Methods for Real-Time Full Web, Pulp, Paper and Paperboard Analysis ABB’s Web Imaging System (WIS) White paper/ Tommi Huotilainen (ABB), Myron Laster (ABB), Seppo Riikonen (ABB) Introduction Today’s high speed and high quality web product machines, with increased resolution requirements for Web Imaging Sys- tems (WIS) to analyze smaller details of the product, set new standards for the performance of imaging system technology. Simultaneously, the latest improvements in imaging technolo- gy have given new opportunities to develop methods, which utilize the measurement data of the whole web area both for the product quality evaluation, and for the product manufactu- ring process monitoring and control. Currently, in many cases the quality evaluation of the pro- duct has been based on remote lab measurements or some online measurement results, which are based on only small portions of the product area. Recently, ABB introduced new methods for analyzing very large numbers of interesting target regions of a product in real-time and covering the measu- rement of the whole product area. These new methods and derived measurements allow pulp and paper manufacturers to: (1) monitor the overall quality factors of a product online, (2) react immediately to improve the product manufacturing process, (3) evaluate the whole product quality, and (4) classify the manufactured product areas based on specific customer requirements. This means huge savings compared to cases where a partial measurement result is used for downgrading the product quality causing significant amounts of good quality product to be downgraded. In order to use imaging technologies to analyze pulp, paper or paperboard products in real-time, the system first needs to capture an image of the product, and then separate the interesting and uninteresting regions of the image. The latter process is often called Region of Interest (ROI) segmentation, which creates a binary image of regions. The next process includes the real-time analysis of the interesting regions. Morphometric methods, including measurement of sizes, lengths, widths, angles and ratios, can be used to analyze the different shape features of the interesting regions, but these methods are required to run in real-time, regardless of the number of interesting regions per time unit. Thus, real-time analysis of the interesting regions can be demanding if the number of regions is high. In this paper we show how it is possible to: (1) calculate ROI morphometric features like size, length, and width in real-time, with a very high number of interesting regions per time unit, (2) classify the interesting regions based on their features, and (3) calculate the number of interesting regions, by utilizing Field Programmable Gate Array (FPGA) based hardware. We also show how the proposed real-time ROI morphometric method can be utilized in different pulp, paper or paperboard imaging applications like for example (1) pulp dirt count and (2) paper or paperboard defect analysis. We also briefly describe the new real-time ABB HPINet WIS DIRT Count product. High speed, high quality web product machines, with increased resolution requirements for Web Imaging Systems (WIS) to analyze smaller details of the product, set new standards for the performance of imaging system technology. Simultaneously, the latest improvements in imaging technology have given new opportunities to develop methods, which utilize the measurement data of the whole web area both for the product quality evaluation, and for the product manufacturing process monitoring and control. Figure 1 – Web imaging system.
Transcript
Methods for Real-Time Full Web, Pulp, Paper and Paperboard AnalysisABB’s Web Imaging System (WIS)
White paper/ Tommi Huotilainen (ABB), Myron Laster (ABB), Seppo Riikonen (ABB)
Introduction
Today’s high speed and high quality web product machines, with increased resolution requirements for Web Imaging Sys-tems (WIS) to analyze smaller details of the product, set new standards for the performance of imaging system technology. Simultaneously, the latest improvements in imaging technolo-gy have given new opportunities to develop methods, which utilize the measurement data of the whole web area both for the product quality evaluation, and for the product manufactu-ring process monitoring and control.
Currently, in many cases the quality evaluation of the pro-duct has been based on remote lab measurements or some online measurement results, which are based on only small portions of the product area. Recently, ABB introduced new methods for analyzing very large numbers of interesting target regions of a product in real-time and covering the measu-rement of the whole product area. These new methods and derived measurements allow pulp and paper manufacturers to: (1) monitor the overall quality factors of a product online, (2) react immediately to improve the product manufacturing process, (3) evaluate the whole product quality, and (4) classify the manufactured product areas based on specific customer requirements. This means huge savings compared to cases where a partial measurement result is used for downgrading the product quality causing significant amounts of good quality product to be downgraded.
In order to use imaging technologies to analyze pulp, paper or paperboard products in real-time, the system first needs to capture an image of the product, and then separate the interesting and uninteresting regions of the image. The latter process is often called Region of Interest (ROI) segmentation, which creates a binary image of regions. The next process includes the real-time analysis of the interesting regions. Morphometric methods, including measurement of sizes, lengths, widths, angles and ratios, can be used to analyze the different shape features of the interesting regions, but these methods are required to run in real-time, regardless of the number of interesting regions per time unit. Thus, real-time analysis of the interesting regions can be demanding if the number of regions is high.
In this paper we show how it is possible to: (1) calculate ROI morphometric features like size, length, and width in real-time, with a very high number of interesting regions per time unit, (2) classify the interesting regions based on their features, and (3) calculate the number of interesting regions, by utilizing Field Programmable Gate Array (FPGA) based hardware. We also show how the proposed real-time ROI morphometric method can be utilized in different pulp, paper or paperboard imaging applications like for example (1) pulp dirt count and (2) paper or paperboard defect analysis. We also briefly describe the new real-time ABB HPINet WIS DIRT Count product.
High speed, high quality web product machines, with increased resolution requirements for Web Imaging Systems (WIS) to analyze smaller details of the product, set new standards for the performance of imaging system technology. Simultaneously, the latest improvements in imaging technology have given new opportunities to develop methods, which utilize the measurement data of the whole web area both for the product quality evaluation, and for the product manufacturing process monitoring and control. Figure 1 – Web imaging system.
2 White paper | ABB | Web imaging system (WIS) methods for real-time full web pulp, paper and paperboard analysis
Web imaging principles
The latest pulp, paper, and paperboard web imaging systems need to handle various different image analysis tasks and sup-port higher resolutions and dynamic ranges in real-time (see Figures 1 & 2). One method of solving the challenge caused by the enormous increase in the amount of image data is to use a smart FPGA based imaging camera which processes the incoming raw image data, and transfers only the results and target images having desired resolution and dynamic range (see Figure 3) [1]. In this way it is possible to reach real-time processing performance for the full web data utilizing all of the available web data for product analysis, yet still reduce the amount of report data. FPGA based HW platforms make it possible to provide new measurement features for new chal-lenges, upgrade existing systems with these new features, and thus also extend the life cycle of web imaging systems.
In real-time web imaging systems, pulp, paper, or paperboard products are first imaged utilizing appropriate illumination, imaging configuration, optics and camera (see Figure 2). The generated raw image data is then analyzed by the imaging hardware, which needs first to make several corrections to the incoming raw data, for example position-dependent bright-ness corrections and gray-scale transformations, and to seg-ment the image to separate the interesting regions from the background [2, 3, 4]. The latter process is often called ROI segmentation (or just segmentation), which transforms the grayscale image into a binary image. The segmentation part of the process can be challenging and usually several different segmentation methods and parameters are used in parallel to provide multiple features for subsequent analysis.
The next step in the image analysis process includes the real-time analysis of the interesting regions. The morphometric methods, like measurement of sizes, lengths, widths, ratios
Figure 2 – Web imaging system aspects.
and angles, can be used to analyze the interesting regions. These methods must run in real-time, with a very high number of interesting regions per time unit. The real-time analysis of the interesting regions can be demanding if the number of regions is extremely high. In this paper we present the perfor-mance test results of one FPGA based solution for the hand-ling of binary regions, which are generated by segmentation. We also present how these region handling methods can be used in some web imaging applications like pulp dirt analysis, and paper or paperboard defect analysis.
Real-time web imaging based on morphometric analysisIntroduction to FPGA TechnologyAn FPGA is a programmable logic chip [1]. A typical FPGA includes a large number of very simple logic elements which can each be configured to perform relatively simple logic func-tions. These logic elements can then be connected together to create more complex functionality. The complexity of the resulting logic is limited only by the number of logic elements and available interconnect routing resources. Historically, FPGAs were especially popular for prototyping designs based on the relatively short time required to make design changes, and reprogram the devices. Once the design was fully tested, it was typically implemented in an Application specific integ-rated circuit (ASIC). This allowed a manufacturer to save on ASIC development costs, and still exploit the benefits of high volume ASIC cost savings. Developments in FPGA technology allow today’s devices to include millions of logic elements, support high internal clock frequencies, large internal me-mories, dedicated digital signal processing (DSP) blocks, and have competitive price levels. Today’s FPGA technology is cost and performance competitive with ASIC technology in low to medium volume production applications. Unlike an ASIC device where the functionality is fixed, an FPGA de-
Web imaging system (WIS) methods for real-time full web pulp, paper and paperboard analysis | ABB | White paper 3
vice can be reprogrammed by downloading a user-defined configuration file. There are a wide variety of FPGA devices in the market, offering a multitude of dedicated features. One of the main advantages of FPGA devices is flexibility. General purpose processors are limited to fixed hardware features like for example the number of multipliers, amount of memory, amount of data paths and data widths. In an FPGA based design, application specific features can be configured and resource usage can be optimized as required.
FPGAs are well suited for the real-time image processing ap-plications typically needed in web imaging. Image processing algorithms require, or benefit from, support for spatial, tempo-ral, computing and data parallelism, because usually a large number of operations should be performed utilizing multiple data sources for each pixel position. An example of the smart camera parallel architecture of the web imaging system is presented in Figure 3. With an FPGA based system, it is also possible to design new algorithms later and add them to the system as parallel algorithms (for example new “soft imaging sensors”).
Real-time ROI Morphometric Methods ROI segmentation processing allows us to determine the interesting regions of the imaged product. The next step is to analyze the regions and generate valuable information about the product quality. Morphometric refers to the methods measuring size and shape. These methods can be used to measure and generate geometric features and then it is pos-sible to classify the interesting regions based on the features. Feature means a numerical value that is computable from binary image values and coordinates of the pixels in a region. When several features are extracted simultaneously we can generate a feature vector [2, 3, 4].
With the latest FPGA technology based hardware and suitable algorithm, the morphometric parameters can be calculated in real-time from the streaming image data. An important parameter is Area, which is the total number of pixels of a region and can be used for region size classification. Area is also used for generating further geometric features. Another important geometric parameter is Perimeter of a region, which is the length of region’s contour. Perimeter can also be used to generate several other geometric properties. For example Roundness can be derived by:
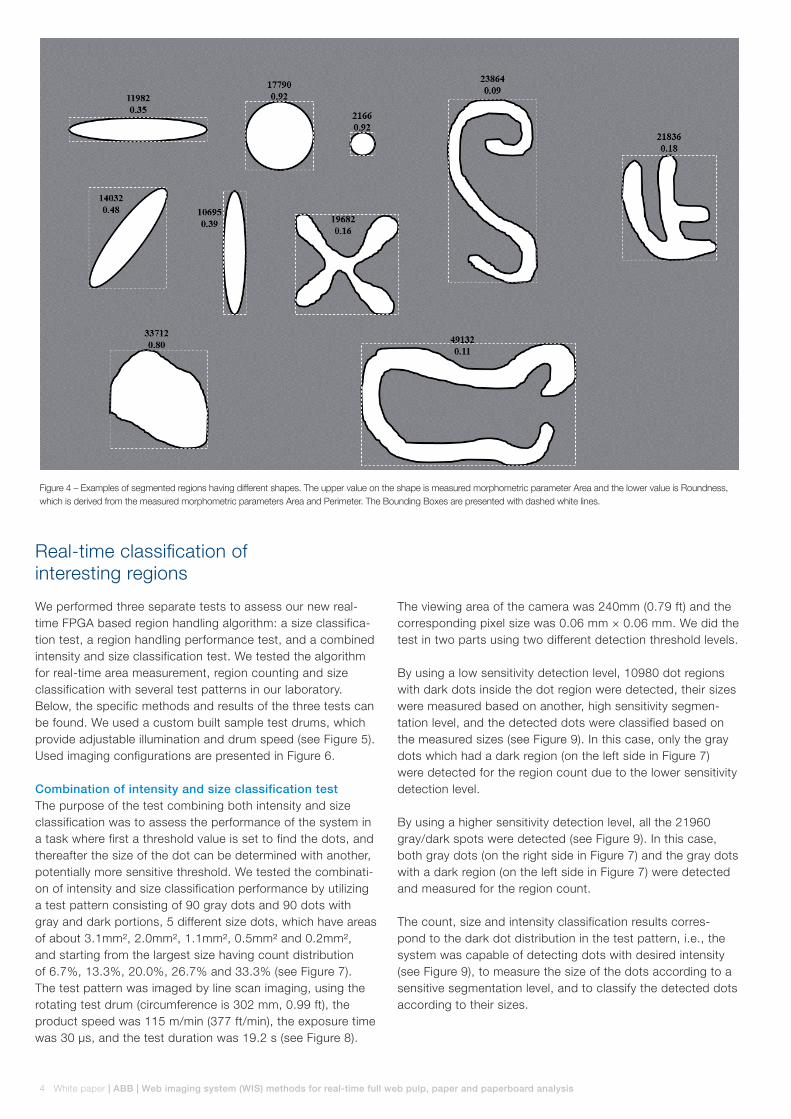
Roundness and other ratio based calculated features are invariant to translation, rotation and scaling and thus they are reliable features to be used for region classification. Bound-ing box and Centroid are also valuable morphometric features and they can be derived from the region pixel coordinates. Examples of shapes with measured Areas and calculated Roundness features are presented in Figure 4 (see next page). When comparing these shapes in Figure 4 we can clearly see that for example Roundness feature separates well the circle type region (value 0.92) from the “flower” type region (value 0.16) while the area feature values are almost the same (17790 and 19682).
Figure 3 – Example of the parallel smart camera architecture for a web imaging system.
4 White paper | ABB | Web imaging system (WIS) methods for real-time full web pulp, paper and paperboard analysis
Figure 4 – Examples of segmented regions having different shapes. The upper value on the shape is measured morphometric parameter Area and the lower value is Roundness, which is derived from the measured morphometric parameters Area and Perimeter. The Bounding Boxes are presented with dashed white lines.
Real-time classification of interesting regions
We performed three separate tests to assess our new real-time FPGA based region handling algorithm: a size classifica-tion test, a region handling performance test, and a combined intensity and size classification test. We tested the algorithm for real-time area measurement, region counting and size classification with several test patterns in our laboratory. Below, the specific methods and results of the three tests can be found. We used a custom built sample test drums, which provide adjustable illumination and drum speed (see Figure 5). Used imaging configurations are presented in Figure 6.
Combination of intensity and size classification test The purpose of the test combining both intensity and size classification was to assess the performance of the system in a task where first a threshold value is set to find the dots, and thereafter the size of the dot can be determined with another, potentially more sensitive threshold. We tested the combinati-on of intensity and size classification performance by utilizing a test pattern consisting of 90 gray dots and 90 dots with gray and dark portions, 5 different size dots, which have areas of about 3.1mm², 2.0mm², 1.1mm², 0.5mm² and 0.2mm², and starting from the largest size having count distribution of 6.7%, 13.3%, 20.0%, 26.7% and 33.3% (see Figure 7). The test pattern was imaged by line scan imaging, using the rotating test drum (circumference is 302 mm, 0.99 ft), the product speed was 115 m/min (377 ft/min), the exposure time was 30 µs, and the test duration was 19.2 s (see Figure 8).
The viewing area of the camera was 240mm (0.79 ft) and the corresponding pixel size was 0.06 mm × 0.06 mm. We did the test in two parts using two different detection threshold levels.
By using a low sensitivity detection level, 10980 dot regions with dark dots inside the dot region were detected, their sizes were measured based on another, high sensitivity segmen-tation level, and the detected dots were classified based on the measured sizes (see Figure 9). In this case, only the gray dots which had a dark region (on the left side in Figure 7) were detected for the region count due to the lower sensitivity detection level.
By using a higher sensitivity detection level, all the 21960 gray/dark spots were detected (see Figure 9). In this case, both gray dots (on the right side in Figure 7) and the gray dots with a dark region (on the left side in Figure 7) were detected and measured for the region count.
The count, size and intensity classification results corres-pond to the dark dot distribution in the test pattern, i.e., the system was capable of detecting dots with desired intensity (see Figure 9), to measure the size of the dots according to a sensitive segmentation level, and to classify the detected dots according to their sizes.
Web imaging system (WIS) methods for real-time full web pulp, paper and paperboard analysis | ABB | White paper 5
Figure 5 – Test drums for the test pattern based algorithm testing in the ABB laboratory.
Figure 6 – Line scan imaging configurations in the ABB laboratory. Left image pre-sents a high angle reflection measurement and right image presents a transmission measurement.
Figure 7 – A test pattern used for testing the combination of intensity and size classi-fications. The pattern includes 90 gray dots and 90 dots with gray and dark portions, 5 different size dots.
Figure 8 – A test pattern on the test drum. The test pattern was used for testing the combination of intensity and size classifications. Figure 9 – The region intensity and size classification combination test results.
6 White paper | ABB | Web imaging system (WIS) methods for real-time full web pulp, paper and paperboard analysis
Extreme size classification testThe purpose of the extreme size classification test was to determine whether the algorithm is capable of classifying black dots, on densely spotted test paper, into classes according to their sizes at very high speed.
The test pattern, shown in Figure 10, consists of 240 dark dots having 5 different sizes, which are about 0.60 mm², 0.44 mm², 0.24 mm², 0.11 mm² and 0.06 mm². Starting from the largest dot size, the count distribution percentages of the test pattern are 6.7%, 13.3%, 20.0%, 26.7% and 33.3%. We defined the detection and region handling system so that we had 5 different size classes and the classes were defined so that the 5 different size regions should be classified into 5 different size matched target classes. For the size classifica-tion test, we put 1320 of these test patterns on the drum by setting 24 of them in parallel (see Figure 11) and thus the total number of dark dots on the test drum were about 316,000. The test patterns were imaged by line scan imaging, using the rotating test drum. The circumference of the test drum was 1576 mm (5.17 ft) and the product speed was 420 m/min, which means about 4.44 test drum rounds/s. The viewing area of the camera was 378 mm (1.24 ft) and the correspon-ding pixel size was 0.091 mm × 0.092 mm.
Thus, the region detection and area measurement perfor-mance during the test was about 1,400,000 regions/s. The size classification result corresponds to the test pattern’s dark dot distribution. The test result for the size classification of the dark dots is presented in Figure 12.
Figure 10 – A test pattern, which was used for testing the real-time region counting, area measurement, size classi-fication and region density tolerance.
Figure 11 – Set of test patterns on the test drum. Test pattern set, which included about 316,800 dark dots, was used for testing the real-time region counting, area measurement, size classification and region density tolerance.
Figure 12 – The region size classification test result.
Web imaging system (WIS) methods for real-time full web pulp, paper and paperboard analysis | ABB | White paper 7
Morphometric region classification test The purpose of the morphometric region classification test was to assess the performance of the system at high speed with a large number of different shape regions very densely pa-cked together. The test pattern, which is shown in Figure 13, consists of 240 dark shapes having 5 different sizes between 0.10 mm² and 2.50 mm² and 4 different shapes (dots, rings, 45 degrees elongated, 135 degrees elongated). Starting from the largest shape size, the count distribution percentages of the test pattern are 6.7%, 13.3%, 20.0%, 26.7% and 33.3%. The shape based, dark region count distribution percentages of the test pattern are dots 50%, rings 25%, 45 degrees elon-gated 12.5% and 135 degrees elongated 12.5%. We defined the detection and region handling system so that we had 5 different size classes and the classes were defined so that the 5 different size regions should be classified into 5 different size matched target classes. For the size and shape classification test, we put 210 of these test patterns on the drum by setting
Figure 13 – A test pattern, which was used for testing real-time different shape region handling performance, included 240 dark dots. The areas of dark dots are between 0.10–2.50 mm².
Figure 14 – Set of test patterns on the test drum. Test pattern set, which included about 50,400 dark shapes, was used for testing the real-time region counting, area measurement, size and shape classification, and region density tolerance.
Figure 15 – The different dark shape classification performance test result.
7 of them in parallel (see Figure 14) and thus the total number of dark shapes on the test drum were about 50,400. The test patterns were imaged by line scan imaging, using the rotating test drum. The circumference of the test drum was 1576 mm (5.17 ft) and the product speed was 420 m/min, which means about 4.44 test drum rounds/s. The viewing area of the came-ra was 378 mm (1.24 ft) and the corresponding pixel size was 0.091 mm × 0.092 mm.
Thus, the region detection and area measurement perfor-mance during the test was about 223,000 regions/s. The size and shape classification results correspond to the test pattern’s dark shape distribution. The test results for the size and shape classifications of the dark shapes are presented in Figure 15.
8 White paper | ABB | Web imaging system (WIS) methods for real-time full web pulp, paper and paperboard analysis
Pulp, paper and paperboard analysis
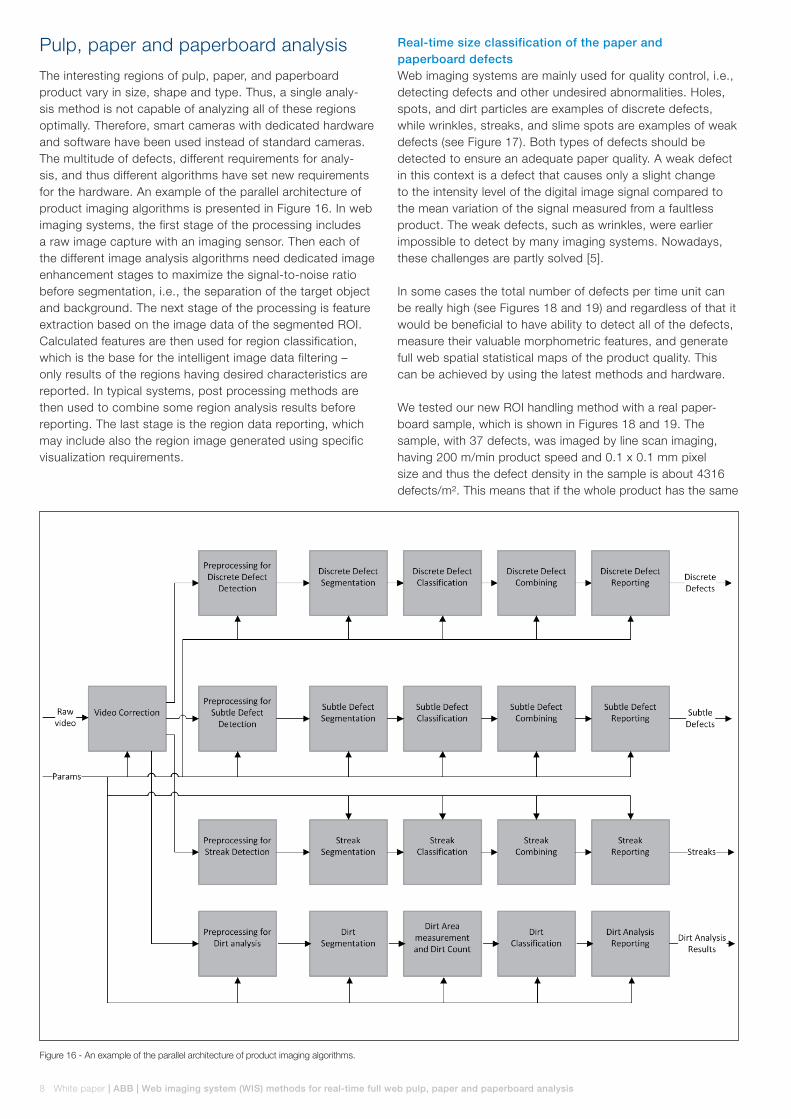
The interesting regions of pulp, paper, and paperboard product vary in size, shape and type. Thus, a single analy-sis method is not capable of analyzing all of these regions optimally. Therefore, smart cameras with dedicated hardware and software have been used instead of standard cameras. The multitude of defects, different requirements for analy-sis, and thus different algorithms have set new requirements for the hardware. An example of the parallel architecture of product imaging algorithms is presented in Figure 16. In web imaging systems, the first stage of the processing includes a raw image capture with an imaging sensor. Then each of the different image analysis algorithms need dedicated image enhancement stages to maximize the signal-to-noise ratio before segmentation, i.e., the separation of the target object and background. The next stage of the processing is feature extraction based on the image data of the segmented ROI. Calculated features are then used for region classification, which is the base for the intelligent image data filtering – only results of the regions having desired characteristics are reported. In typical systems, post processing methods are then used to combine some region analysis results before reporting. The last stage is the region data reporting, which may include also the region image generated using specific visualization requirements.
Figure 16 - An example of the parallel architecture of product imaging algorithms.
Real-time size classification of the paper and paperboard defectsWeb imaging systems are mainly used for quality control, i.e., detecting defects and other undesired abnormalities. Holes, spots, and dirt particles are examples of discrete defects, while wrinkles, streaks, and slime spots are examples of weak defects (see Figure 17). Both types of defects should be detected to ensure an adequate paper quality. A weak defect in this context is a defect that causes only a slight change to the intensity level of the digital image signal compared to the mean variation of the signal measured from a faultless product. The weak defects, such as wrinkles, were earlier impossible to detect by many imaging systems. Nowadays, these challenges are partly solved [5].
In some cases the total number of defects per time unit can be really high (see Figures 18 and 19) and regardless of that it would be beneficial to have ability to detect all of the defects, measure their valuable morphometric features, and generate full web spatial statistical maps of the product quality. This can be achieved by using the latest methods and hardware.
We tested our new ROI handling method with a real paper-board sample, which is shown in Figures 18 and 19. The sample, with 37 defects, was imaged by line scan imaging, having 200 m/min product speed and 0.1 x 0.1 mm pixel size and thus the defect density in the sample is about 4316 defects/m². This means that if the whole product has the same
Web imaging system (WIS) methods for real-time full web pulp, paper and paperboard analysis | ABB | White paper 9
defect density, the WIS for a 5 m wide product machine needs to handle 71933 defects/s. This performance, and even higher, can be reached with our new region handling method, inclu-ding defect area measurement and size classification. The size classification test result is presented in Figure 20.
Pulp dirt analysisThe pulp, paper, and paperboard producers are interested in evaluating the quality of their product and providing their customers with suitable quality grades, as determined by the international standards. The visible dirt in pulp, paper, or paperboard can significantly affect the quality of the end pro-duct. Both the amount and visual impact (area and intensity) of the dirt may be important quality factors [6–10]. Thus, one of the most beneficial quality testing procedures is dirt coun-ting and dirt area classification, which analyzes the content of foreign materials in the product.
Several international standards have been published for the dirt analysis procedure, but most of them represent offline laboratory measurements (see Figure 21) and produce test reports for only a small portion of the area of the manufactu-red pulp, paper, or paperboard product. ISO 5350 standard
Figure 17 – Examples of defect types.
Holes
Light spots
Dark spots/ Dirt
Streaks/Wrinkles
(ISO is the International Organization for Standardization) consists of four parts, under the general title “Pulps – Estima-tion of dirt and shives”. The first two parts include transmissi-on light based test procedures for laboratory sheets [11] and mill sheeted pulp [12]. Parts 3 and 4 are based on reflection measurement and Equivalent Black Area (EBA) method. Part 3 presents the visual inspection [13] and Part 4 the instrumen-tal inspection test methods [14]. Also Tappi organization has published several Dirt analysis standards. Tappi T213 om-01 “Dirt in pulp – chart method” provides a test method for esti-mating the amount of dirt in pulp based on equivalent black area (EBA) [15]. In T213 a dirt speck is defined as the area of a round black spot on a white background of the TAPPI Dirt Estimation Chart. Tappi T 563 “Equivalent Black Area (EBA) and Count of Visible Dirt in Pulp, Paper, and Paperboard by Image Analysis” presents a method that uses image analysis to determine the level of dirt in pulp, paper, and paperboard based on EBA of dirt specks within the physical area range of 0.02 mm² to 3.0 mm² reported in parts per million and the number of dirt specks per square meter [16].
With the latest imaging technologies it is possible to build automatic product analysis systems capable of measuring
10 White paper | ABB | Web imaging system (WIS) methods for real-time full web pulp, paper and paperboard analysis
Figure 18 – An example of high dirt density in paperboard. In the lower image 37 defects have been segmented and the corresponding measured areas in pixels are presented.
Figure 19 – The paperboard sample on the test drum.
Figure 20 – The paperboard defect size classification test result.
and analyzing the product abnormalities online during the product manufacturing process. There are already several commercial systems available for automatic online dirt analy-sis, but their results are often based on only the data of small areas (snapshot images, narrow CD measurement bands, or scanning imaging methods) of the product and thus they are not covering full web data (see Figure 22). New standards are needed for the image analysis based real-time full web test methods, and for them it would be beneficial to first try to recognize and define the requirements, and then to discover and standardize the most valuable reference values for the producers.
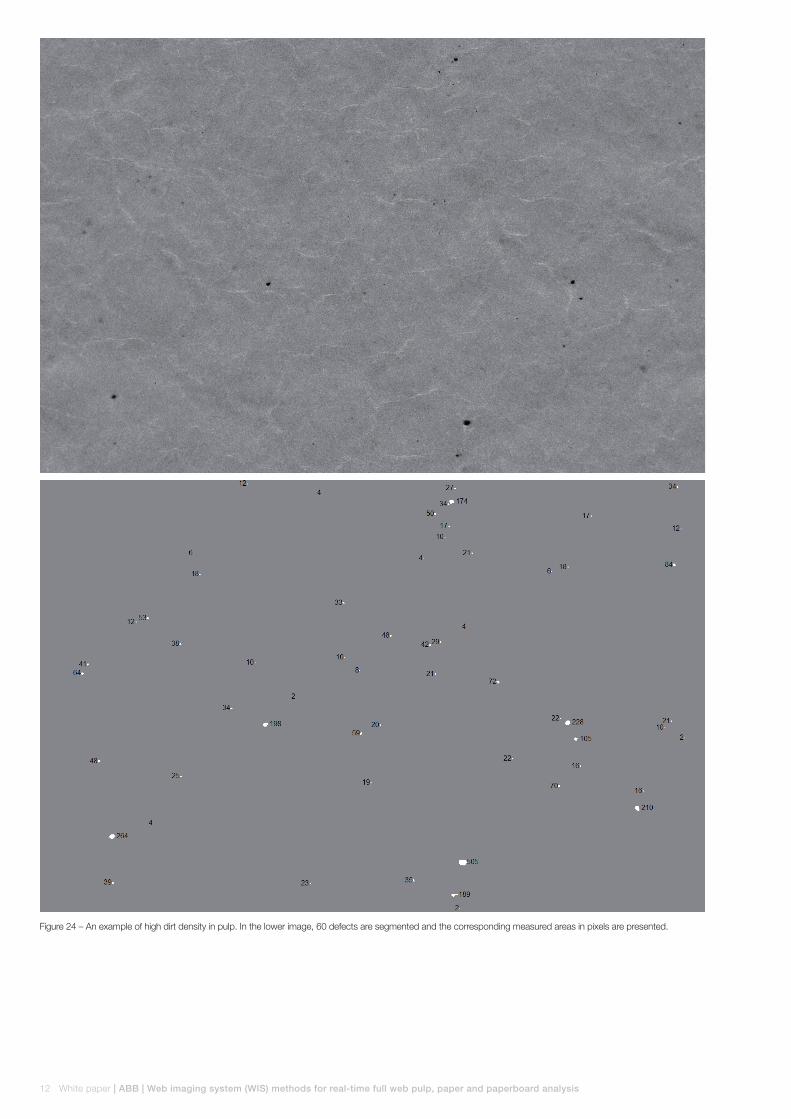
We tested our new ROI handling method with a real pulp sample, which is shown in Figure 24. The sample was imaged by line scan imaging, having 200 m/min product speed and 0.1 × 0.1 mm pixel size. The dirt particle density in the sample is about 1586 defects/m². This means that if the whole pro-duct had the same dirt particle density, the WIS for a 5 m wide pulp machine needs to handle 26431 dirt particles/s. This performance can be achieved with our new region handling method, including dirt area measurement and size classi-fication. The test result is presented in Figure 23. It is also possible to use logarithmic mean area as a basis for the size classification as defined in ISO 5350 standard [1, 2] if needed.
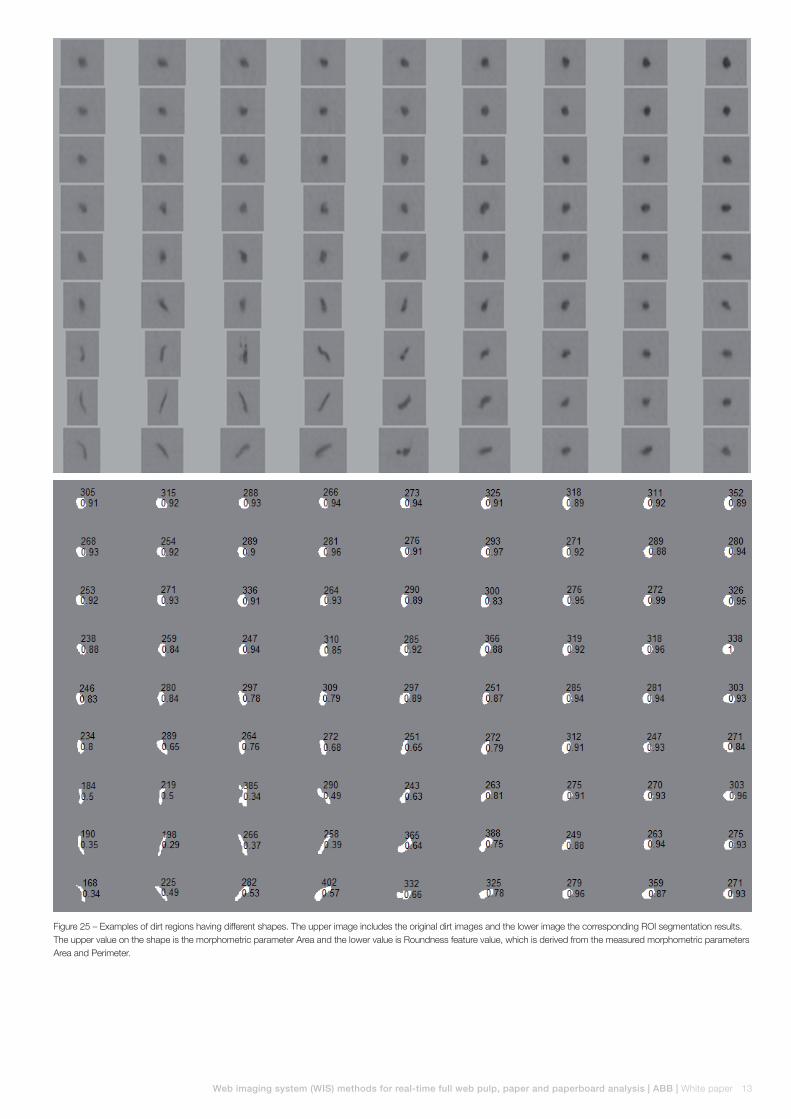
It is also possible to further classify the dirt particles in real-time based on the generated morphometric features like roundness. Figure 25 presents dirt particle samples and the corresponding area and roundness feature values. By setting a threshold for the roundness feature, it is possible to separa-te the size classification for round dirt particles and elongated particles. This can be considered as a first step towards real-time full web shape based dirt classification.
Web imaging system (WIS) methods for real-time full web pulp, paper and paperboard analysis | ABB | White paper 11
Figure 21 – Dirt analysis based on manual laboratory inspection. Manual inspection covers only a small portion of the whole pulp product area.
Figure 22 – Online pulp dirt analysis based on snapshot images, CD band measurement, scanning imaging, and full web area measurement.
Figure 23 – Pulp dirt detection and size classification test result.
12 White paper | ABB | Web imaging system (WIS) methods for real-time full web pulp, paper and paperboard analysis
Figure 24 – An example of high dirt density in pulp. In the lower image, 60 defects are segmented and the corresponding measured areas in pixels are presented.
Web imaging system (WIS) methods for real-time full web pulp, paper and paperboard analysis | ABB | White paper 13
Figure 25 – Examples of dirt regions having different shapes. The upper image includes the original dirt images and the lower image the corresponding ROI segmentation results. The upper value on the shape is the morphometric parameter Area and the lower value is Roundness feature value, which is derived from the measured morphometric parameters Area and Perimeter.
14 White paper | ABB | Web imaging system (WIS) methods for real-time full web pulp, paper and paperboard analysis
ABB’S new real-time dirt analysis product
ABB’s DIRT Count is part of ABB’s innovative HPINet family of integrated imaging products and it allows for the real-time full web dirt detection, measurement and analysis for web based products. It is an automated online, image based inspec-tion system, utilizing the latest high resolution CMOS digital camera technology and the latest real-time methodology. The system inspects full 100% width of the product web, with consistent and repeatable results, detecting and reporting defects and dirt particles as small as 0.02 mm2. With the ap-plication of ABB’s advanced imaging technology and increa-sed camera density, defect dimensions can be determined up to an accuracy of 0.10 mm.
Unlike older technology that attempts to count dirt based on single sheets or narrow webs, with ABB’s full web dirt count solution, the system can detect, classify and statistically quantify information across the entire web. ABB’s DIRT Count can be configured with either transmission or reflection illumi-nation methods.
ABB’s DIRT Count allows for the generating of a real-time (online) full web dirt classification (area and count). Size classi-fication of dirt particles conforms to industry standards (ISO, Tappi) or manually defined limits. The dirt detection, counting and analysis are performed by specialized, high speed FPGA based processing components of ABB’s HDI 9 smart came-ras. This allows for the instantaneous detection and classifica-tion of dirt, reducing the unnecessary overloading of the sys-tem data transfer resources. This unique system architecture allows each HDI 9 smart camera to independently handle the high computational loads associated with dirt analysis while continuing to deliver reliable defect detection in parallel. ABB HPINet WIS DIRT Count is based on real-time processing and analysis of the streaming web image signal (video signal) per-forming dirt particle (1) detection, (2) size (area) measurement, (3) classification based on intensity and size, (4) count, and (5) reporting.
In pulp drying, while the HDI 9 smart cameras accurately analyze dirt content, they simultaneously continue to provide 100% inspection, and hence they detect other larger defects as well as detect and identify potential production limiting structural defects within the pulp web. In pulp production, ABB’s HDI 9 Web Imaging System (WIS) with ABB HPINet WIS DIRT Count will allow operators to manage pulp quality of the whole web, optimizing production and profitability. 100% web inspection for total dirt content, combined with detailed image analysis allows critical quality requirements for various defect classes to be accurately managed.
Conclusions
High quality web imaging performance depends on many factors that have to be carefully managed in order to generate reliable and valuable results for today’s requirements. A smart camera platform including FPGA device based real-time par-allel image processing support is one of the most successful hardware solutions for web imaging systems. Computing and data parallelism, as well as flexibility for functionality updates, makes it possible to design and update new real-time “soft sensors” even for existing WIS, and thus extend the life cycle of the systems, and ensure competitive performance throug-hout the system’s lifetime.
Several pulp, paper, and paperboard measurements, which are based on international standards, and many commercial systems, are covering only small portions of the product web, which is undesirable and not cost-efficient. The latest FPGA based technologies and the latest image processing algo-rithms offer new opportunities to analyze pulp, paper, and paperboard products in real-time and to cover full web even if the ROI density is extremely high. In this paper we have shown the performance results of ABB’s latest FPGA based hardware and new image processing methods for the ROI handling including region area measurement, and intensity and size based classification. Based on the performance test results of the new methods, with one camera, it is possible to: (1) detect, (2) measure the size (area), (3) classify the regi-ons based on intensity and size, (4) count, and (5) report the results of over 1,400,000 regions of interest per second per camera. This means that we can handle over 5,000,000,000 regions of interest per hour per camera.
We have shown how these new methods can be used for pulp, paper, and paperboard analysis to reach the demands of the customers in full web, high speed analysis with very high defect density. We have also introduced new ABB HPI-Net WIS DIRT Count product, which utilizes the latest ABB WIS HDI 9 hardware and the new region of interest handling methodology for dirt particle detection, analysis and classifi-cation.
Acknowledgements
The authors are grateful to many ABB colleagues over the years. They have provided a strong background for the ABB web imaging system development through the years and thus they have built the prior art needed for the latest innovations.
Web imaging system (WIS) methods for real-time full web pulp, paper and paperboard analysis | ABB | White paper 15
References
1. Mittal, S., Gupta, S., and Dasgupta, S., “FPGA: An Efficient And Promising Platform For Real-Time Image Processing Applications”, Proceedings of the National Conference on Research and Development in Hardware & Systems (CSI-RDHS), 2008.
2. Sonka, M., Hlavac, V., and Boyle, R., "Image Proces-sing, Analysis, and Machine Vision (4th Edition)", ISBN 1133593607, 2014.
3. Gonzalez, R. C., Woods, R. E., “Digital Image Processing (3rd Edition)”, ISBN 9780131687288, 2007
4. Jain, R., Kasturi, R., Schunck, B. G., "Machine Vision", ISBN 0070320187, 1995.
5. Huotilainen, T., “Method and Product for Detecting Abnor-malities” United States Patent Application Publication (US 8000501 B2), 2011.
6. Strokina, Nataliya; Mankki, Aki; Eerola, Tuomas; Lensu, Lasse; Käyhkö, Jari; Kälviäinen, Heikki. Framework for Developing Image-based Dirt Particle Classifiers for Dry Pulp Sheets, In Machine Vision and Applications, Springer-Verlag, vol. 24, no. 4, pages 869-881, 2013.
7. Strokina, Nataliya. Machine vision methods for process measurements in pulping, PhD thesis, Lappeenranta Uni-versity of Technology, 2013.
8. Strokina, Nataliya; Mankki, Aki; Eerola, Tuomas; Lensu, Lasse; Käyhkö, Jari; Kälviäinen, Heikki. Semisynthetic ground truth for dirt particle counting and classification methods, In Proceedings of the 12th IAPR Conference on Machine Vision Applications, MVA, 2011.
9. Strokina, Nataliya; Eerola, Tuomas; Lensu, Lasse; Kälviäi-nen, Heikki. Adaptive Classification of Dirt Particles in Pa-permaking Process, In The 17th Scandinavian Conference on Image Analysis, SCIA, 2011.
10. Fouladgaran, M., Mankki, A., Lensu, L., Käyhkö, J., and Kälviäinen, H. Automated counting and characterization of dirt particles in pulp. In Proceedings of the International Conference on Computer Vision and Graphics, ICCVG (Warsaw, Poland, 2010), pp. 166-174.
11. International Organization for Standardization. Pulps – Estimation of dirt and shives – Part 1: Inspection of labora-tory sheets by transmitted light. ISO 5350-1:2006.
12. International Organization for Standardization. Pulps – Estimation of dirt and shives – Part 2: Inspection of mill sheeted pulp by transmitted light. ISO 5350-2:2006.
13. International Organization for Standardization. Pulps – Estimation of dirt and shives – Part 3: Visual inspection by reflected light using Equivalent Black Area (EBA) method. ISO 5350-3:2007.
14. International Organization for Standardization. Pulps – Estimation of dirt and shives – Part 4: Instrumental inspec-tion by reflected light using Equivalent Black Area (EBA) method. ISO 5350-4:2006.
15. Dirt in pulp – chart method, T 213 om-01, Tappi, 2006.16. Equivalent Black Area (EBA) and Count of Visible Dirt in
Pulp, Paper, and Paperboard by Image Analysis, T 563 pm-97, Tappi, 1997.
We reserve the right to make technical changes or modify the contents of this document without prior notice. With regard to purchase orders, the agreed particulars shall prevail. ABB does not accept any responsibility whatsoever for potential errors or possible lack of information in this document.
We reserve all rights in this document and in the subject matter and illustrations contained therein. Any reproduction, disclosure to third parties or utilization of its contents - in whole or in parts – is forbidden without prior written consent of ABB.