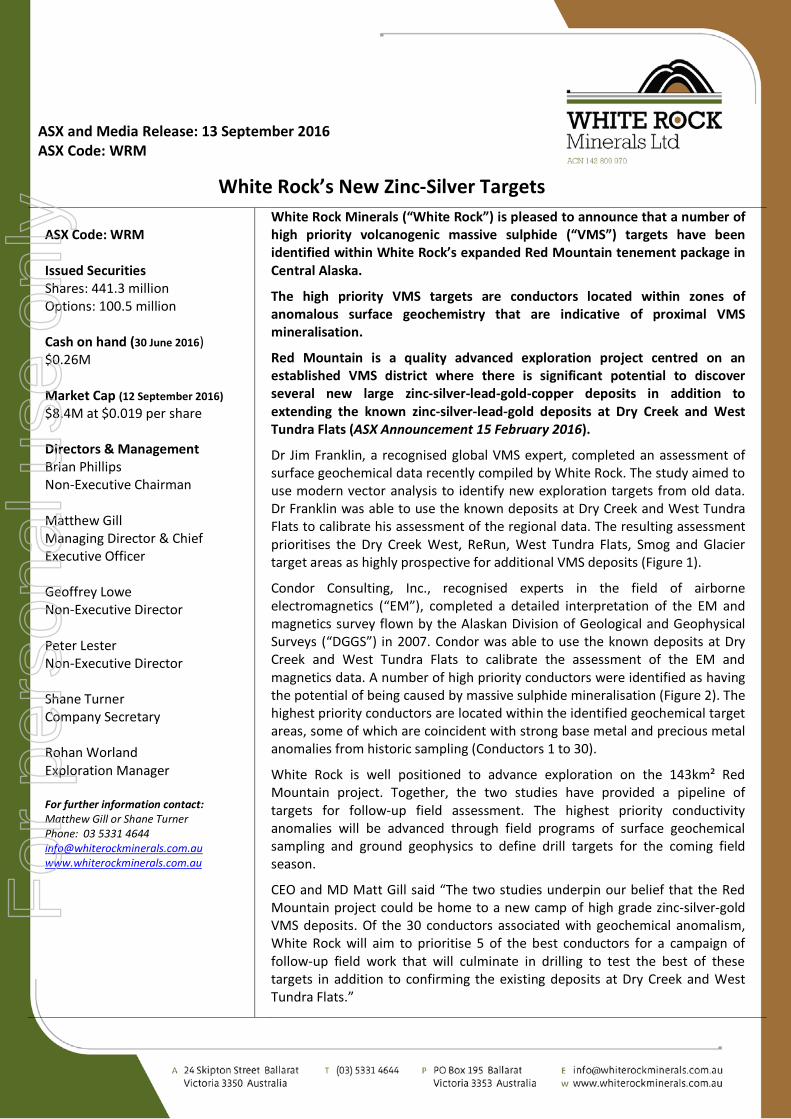
ASX and Media Release: 13 September 2016 ASX Code: WRM White Rock’s New Zinc-Silver Targets ASX Code: WRM Issued Securities Shares: 441.3 million Options: 100.5 million Cash on hand (30 June 2016) $0.26M Market Cap (12 September 2016) $8.4M at $0.019 per share Directors & Management Brian Phillips Non-Executive Chairman Matthew Gill Managing Director & Chief Executive Officer Geoffrey Lowe Non-Executive Director Peter Lester Non-Executive Director Shane Turner Company Secretary Rohan Worland Exploration Manager For further information contact: Matthew Gill or Shane Turner Phone: 03 5331 4644 [email protected]www.whiterockminerals.com.au White Rock Minerals (“White Rock”) is pleased to announce that a number of high priority volcanogenic massive sulphide (“VMS”) targets have been identified within White Rock’s expanded Red Mountain tenement package in Central Alaska. The high priority VMS targets are conductors located within zones of anomalous surface geochemistry that are indicative of proximal VMS mineralisation. Red Mountain is a quality advanced exploration project centred on an established VMS district where there is significant potential to discover several new large zinc-silver-lead-gold-copper deposits in addition to extending the known zinc-silver-lead-gold deposits at Dry Creek and West Tundra Flats (ASX Announcement 15 February 2016). Dr Jim Franklin, a recognised global VMS expert, completed an assessment of surface geochemical data recently compiled by White Rock. The study aimed to use modern vector analysis to identify new exploration targets from old data. Dr Franklin was able to use the known deposits at Dry Creek and West Tundra Flats to calibrate his assessment of the regional data. The resulting assessment prioritises the Dry Creek West, ReRun, West Tundra Flats, Smog and Glacier target areas as highly prospective for additional VMS deposits (Figure 1). Condor Consulting, Inc., recognised experts in the field of airborne electromagnetics (“EM”), completed a detailed interpretation of the EM and magnetics survey flown by the Alaskan Division of Geological and Geophysical Surveys (“DGGS”) in 2007. Condor was able to use the known deposits at Dry Creek and West Tundra Flats to calibrate the assessment of the EM and magnetics data. A number of high priority conductors were identified as having the potential of being caused by massive sulphide mineralisation (Figure 2). The highest priority conductors are located within the identified geochemical target areas, some of which are coincident with strong base metal and precious metal anomalies from historic sampling (Conductors 1 to 30). White Rock is well positioned to advance exploration on the 143km² Red Mountain project. Together, the two studies have provided a pipeline of targets for follow-up field assessment. The highest priority conductivity anomalies will be advanced through field programs of surface geochemical sampling and ground geophysics to define drill targets for the coming field season. CEO and MD Matt Gill said “The two studies underpin our belief that the Red Mountain project could be home to a new camp of high grade zinc-silver-gold VMS deposits. Of the 30 conductors associated with geochemical anomalism, White Rock will aim to prioritise 5 of the best conductors for a campaign of follow-up field work that will culminate in drilling to test the best of these targets in addition to confirming the existing deposits at Dry Creek and West Tundra Flats.” For personal use only
Transcript
ASX and Media Release: 13 September 2016 ASX Code: WRM
White Rock’s New Zinc-Silver Targets ASX Code: WRM Issued Securities Shares: 441.3 million Options: 100.5 million Cash on hand (30 June 2016) $0.26M Market Cap (12 September 2016) $8.4M at $0.019 per share
Directors & Management Brian Phillips Non-Executive Chairman Matthew Gill Managing Director & Chief Executive Officer Geoffrey Lowe Non-Executive Director
Peter Lester Non-Executive Director
Shane Turner Company Secretary Rohan Worland Exploration Manager
For further information contact: Matthew Gill or Shane Turner Phone: 03 5331 4644 [email protected] www.whiterockminerals.com.au
White Rock Minerals (“White Rock”) is pleased to announce that a number of high priority volcanogenic massive sulphide (“VMS”) targets have been identified within White Rock’s expanded Red Mountain tenement package in Central Alaska.
The high priority VMS targets are conductors located within zones of anomalous surface geochemistry that are indicative of proximal VMS mineralisation.
Red Mountain is a quality advanced exploration project centred on an established VMS district where there is significant potential to discover several new large zinc-silver-lead-gold-copper deposits in addition to extending the known zinc-silver-lead-gold deposits at Dry Creek and West Tundra Flats (ASX Announcement 15 February 2016).
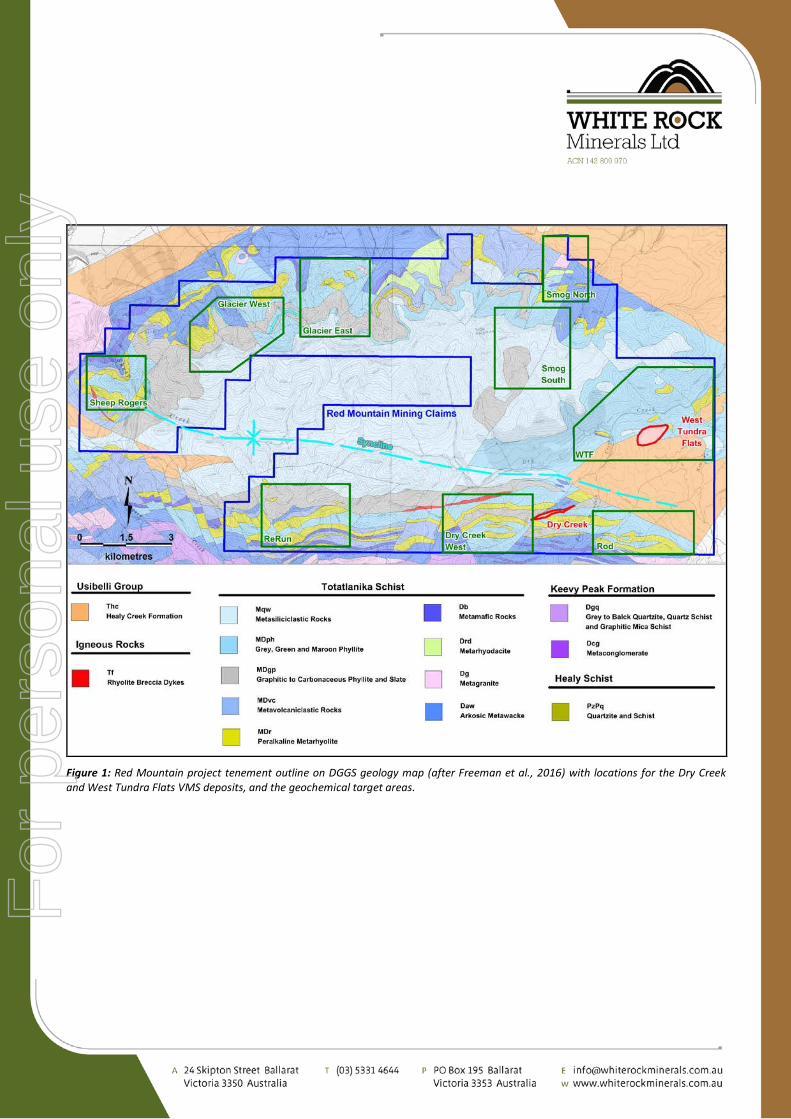
Dr Jim Franklin, a recognised global VMS expert, completed an assessment of surface geochemical data recently compiled by White Rock. The study aimed to use modern vector analysis to identify new exploration targets from old data. Dr Franklin was able to use the known deposits at Dry Creek and West Tundra Flats to calibrate his assessment of the regional data. The resulting assessment prioritises the Dry Creek West, ReRun, West Tundra Flats, Smog and Glacier target areas as highly prospective for additional VMS deposits (Figure 1).
Condor Consulting, Inc., recognised experts in the field of airborne electromagnetics (“EM”), completed a detailed interpretation of the EM and magnetics survey flown by the Alaskan Division of Geological and Geophysical Surveys (“DGGS”) in 2007. Condor was able to use the known deposits at Dry Creek and West Tundra Flats to calibrate the assessment of the EM and magnetics data. A number of high priority conductors were identified as having the potential of being caused by massive sulphide mineralisation (Figure 2). The highest priority conductors are located within the identified geochemical target areas, some of which are coincident with strong base metal and precious metal anomalies from historic sampling (Conductors 1 to 30).
White Rock is well positioned to advance exploration on the 143km² Red Mountain project. Together, the two studies have provided a pipeline of targets for follow-up field assessment. The highest priority conductivity anomalies will be advanced through field programs of surface geochemical sampling and ground geophysics to define drill targets for the coming field season.
CEO and MD Matt Gill said “The two studies underpin our belief that the Red Mountain project could be home to a new camp of high grade zinc-silver-gold VMS deposits. Of the 30 conductors associated with geochemical anomalism, White Rock will aim to prioritise 5 of the best conductors for a campaign of follow-up field work that will culminate in drilling to test the best of these targets in addition to confirming the existing deposits at Dry Creek and West Tundra Flats.”
Figure 1: Red Mountain project tenement outline on DGGS geology map (after Freeman et al., 2016) with locations for the Dry Creek and West Tundra Flats VMS deposits, and the geochemical target areas.
For
per
sona
l use
onl
y
Figure 2: High priority conductors (pink) on a conductivity depth slice at 40m below surface from the 1D inversion of airborne electromagnetics. Locations for the Dry Creek and West Tundra Flats VMS deposits, and target areas (ReRun, Dry Creek West, Rod, WTF, Smog South, Smog North, Glacier East, Glacier West and Sheep Rogers) are defined by geochemical alteration (in green boxes), and the corridor of conductors along the northeast trend from Dry Creek to West Tundra Flats (dashed yellow line).
Figure 3: High priority conductors (pink) on a magnetics image (TMI-RTP). Locations for the Dry Creek and West Tundra Flats VMS deposits, and target areas (ReRun, Dry Creek West, Rod, WTF, Smog South, Smog North, Glacier East, Glacier West and Sheep Rogers) defined by geochemical alteration (in green boxes), and the corridor of conductors along the northeast trend from Dry Creek to West Tundra Flats (dashed yellow line). Note the general northeast trend of magnetic linear features through the area, particularly notable in the southern portion of the tenement package.
For
per
sona
l use
onl
y
THE RED MOUNTAIN PROJECT
The Red Mountain Project is located in central Alaska, 100km south of Fairbanks, in the Bonnifield Mining District. The tenement package comprises 224 mining claims over a total area of ~143km², including the Dry Creek and West Tundra Flats VMS deposits.
Geology
The regional geology consists of an east-west trending schist belt of Precambrian and Palaeozoic meta-sedimentary and volcanic rocks. The schist is intruded by Cretaceous granitic rocks along with Tertiary dykes and plugs of intermediate to mafic composition. Tertiary and Quaternary sedimentary rocks with coal bearing horizons cover portions of the older rocks (Wahrhaftig, 1968). More than a dozen VMS prospects are found within the Bonnifield District. The massive sulphide mineralisation is most commonly located in the upper portions of the Totatlanika Schist which is of Carboniferous to Devonian age (Figure 1).
White Rock has chosen to focus exploration on the Bonnifield East area where the two most significant deposits of Dry Creek and West Tundra Flats are located on opposite limbs of a regional syncline. The syncline controls the distribution of the prospective VMS horizon with the upper metasiliciclastic rocks of the Totalanika Schist forming the hangingwall to VMS mineralisation throughout the district. The prospective footwall sequence dips steeply to the north along the southern limb (where the Dry Creek deposit is located) and shallow to the south along the northern limb (where the West Tundra Flats deposit is located).
White Rock has recently expanded the Red Mountain tenement package to cover the best geochemical targets along both limbs of the syncline (Figure 1), including a significant area down dip of the exposed prospective VMS horizon. (ASX Announcement 9 August 2016).
Geochemical Target Generation
Dr Jim Franklin, a recognised global VMS expert, completed modern vector analysis of the geochemical data. The analysis reviewed all data compiled from historical exploration reports together with public data including that recently released by the Alaskan Division of Geological and Geophysical Surveys (DGGS). The assessment relies on a compilation of historical data. The historical data is not comprehensive and is of variable quality. Consequently, the analysis has focused on the geochemical vectors that can be adequately assessed using the available data. Future work will look to improve the quality of data required to complete a more comprehensive analysis of the geochemical vectors such that target areas can be refined.
The focus of the analysis was to determine alteration vectors that point to areas of probable VMS deposition. The most useful vectors using the available data compilation were shown to be the identification of sodium depletion in the footwall, barium addition in the footwall, barite in the massive sulphide horizon and hangingwall, and base metal (zinc-lead-copper) and precious metal (gold-silver) anomalism as direct indicators of mineralisation. The data compilation is of insufficient quality for additional vectors using manganese, magnesium, antimony and arsenic (amongst others) to be applied in the regional assessment of target areas, though in some cases they can be used to more precisely define vectors within individual target areas.
Based on alteration zonation patterns for local and global VMS deposits, the assessment was able to identify a number of high priority VMS target areas within the expanded Red Mountain tenement package, being ReRun, Dry Creek West, Rod, WTF, Smog South, Smog North, Glacier East, Glacier West and Sheep Rogers (Figure 1).
For
per
sona
l use
onl
y
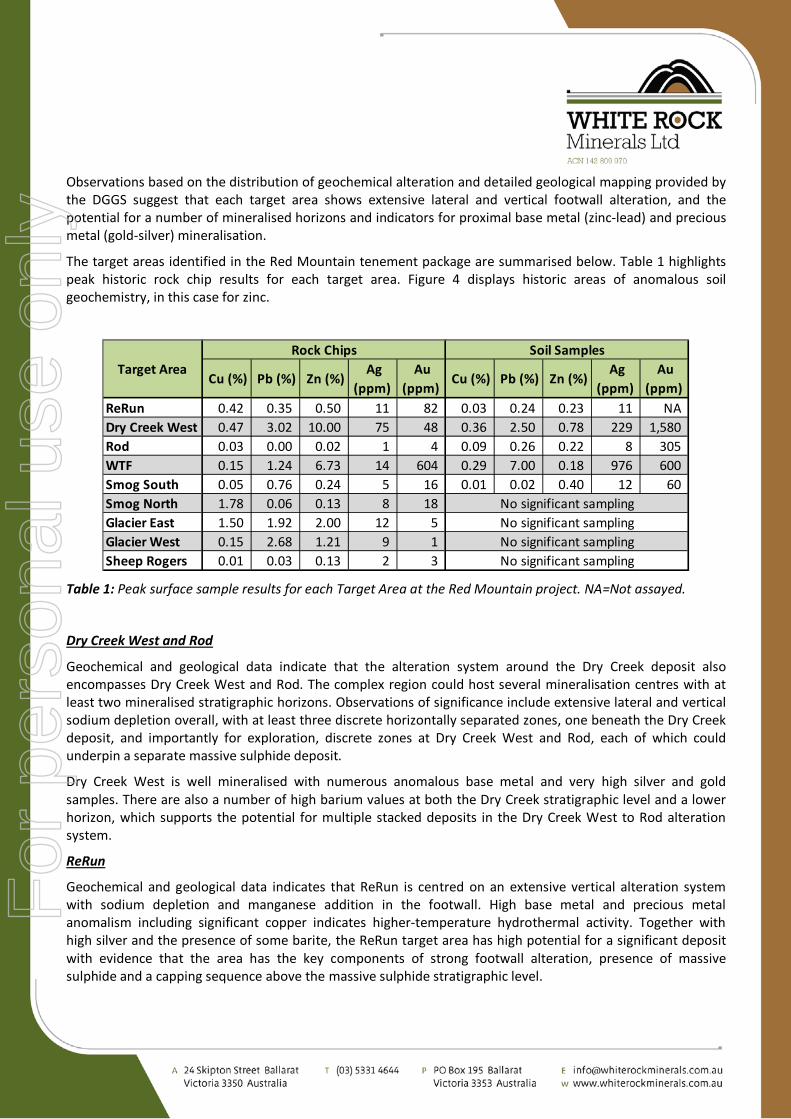
Observations based on the distribution of geochemical alteration and detailed geological mapping provided by the DGGS suggest that each target area shows extensive lateral and vertical footwall alteration, and the potential for a number of mineralised horizons and indicators for proximal base metal (zinc-lead) and precious metal (gold-silver) mineralisation.
The target areas identified in the Red Mountain tenement package are summarised below. Table 1 highlights peak historic rock chip results for each target area. Figure 4 displays historic areas of anomalous soil geochemistry, in this case for zinc.
No significant samplingNo significant samplingNo significant sampling
Table 1: Peak surface sample results for each Target Area at the Red Mountain project. NA=Not assayed.
Dry Creek West and Rod
Geochemical and geological data indicate that the alteration system around the Dry Creek deposit also encompasses Dry Creek West and Rod. The complex region could host several mineralisation centres with at least two mineralised stratigraphic horizons. Observations of significance include extensive lateral and vertical sodium depletion overall, with at least three discrete horizontally separated zones, one beneath the Dry Creek deposit, and importantly for exploration, discrete zones at Dry Creek West and Rod, each of which could underpin a separate massive sulphide deposit.
Dry Creek West is well mineralised with numerous anomalous base metal and very high silver and gold samples. There are also a number of high barium values at both the Dry Creek stratigraphic level and a lower horizon, which supports the potential for multiple stacked deposits in the Dry Creek West to Rod alteration system.
ReRun
Geochemical and geological data indicates that ReRun is centred on an extensive vertical alteration system with sodium depletion and manganese addition in the footwall. High base metal and precious metal anomalism including significant copper indicates higher-temperature hydrothermal activity. Together with high silver and the presence of some barite, the ReRun target area has high potential for a significant deposit with evidence that the area has the key components of strong footwall alteration, presence of massive sulphide and a capping sequence above the massive sulphide stratigraphic level.
For
per
sona
l use
onl
y
WTF
The West Tundra Flats area provides an important case study since the host stratigraphy and known deposit has a shallow dip to the south. The exposure of the geochemical zonation around the known deposit is limited to the hangingwall above the deposit and more distal extensions of the VMS horizon to the north. The recognition of helpful geochemical vectors in this setting can be applied to a number of the northern target areas since the target stratigraphy has a similar shallow dip.
Smog
Geochemical and geological data indicates that Smog has the potential to host another significant VMS centre. Smog North is located in the footwall sequence, with well-developed sodium depletion, barium enrichment and some high copper values. The geochemical signature provides a vector pointing down dip to the south similar to WTF. At Smog South, high copper suggests the nearby presence of a high temperature hydrothermal system. The presence of block faulting provides complexity whereby additional sampling will be able to better define targets.
Glacier East and Glacier West
Geochemical and geological data indicates that the Glacier target areas have the potential of another Dry Creek system with extensive surface alteration that mimics the sulphide oxidation at the project’s namesake Red Mountain Dry Creek deposit. Historical sampling has returned a large number of samples with high base metal and precious metal anomalism, together with barite. The strongest base metal and precious metal enrichment is spread throughout the hangingwall sequence at both Glacier East and Glacier West. Alteration in the footwall is pronounced with strong sodium depletion and magnesium and barium enrichment. Glacier East also shows evidence of barite towards the south. Based on all the evidence examined, the Glacier East and Glacier West target areas are rated as highly as Dry Creek for possible further VMS discoveries.
Sheep Rogers
Geochemical data is sparse in the Sheep Rogers area but there is enough to suggest at least moderate sodium depletion and cause for further investigation.
Figure 4: Anomalous zinc soil geochemistry from compiled historic data, on DGGS geology map (after Freeman et al., 2016) with locations for the geochemical target areas (green boxes) and high priority conductors (pink).
For
per
sona
l use
onl
y
Conductivity Targets
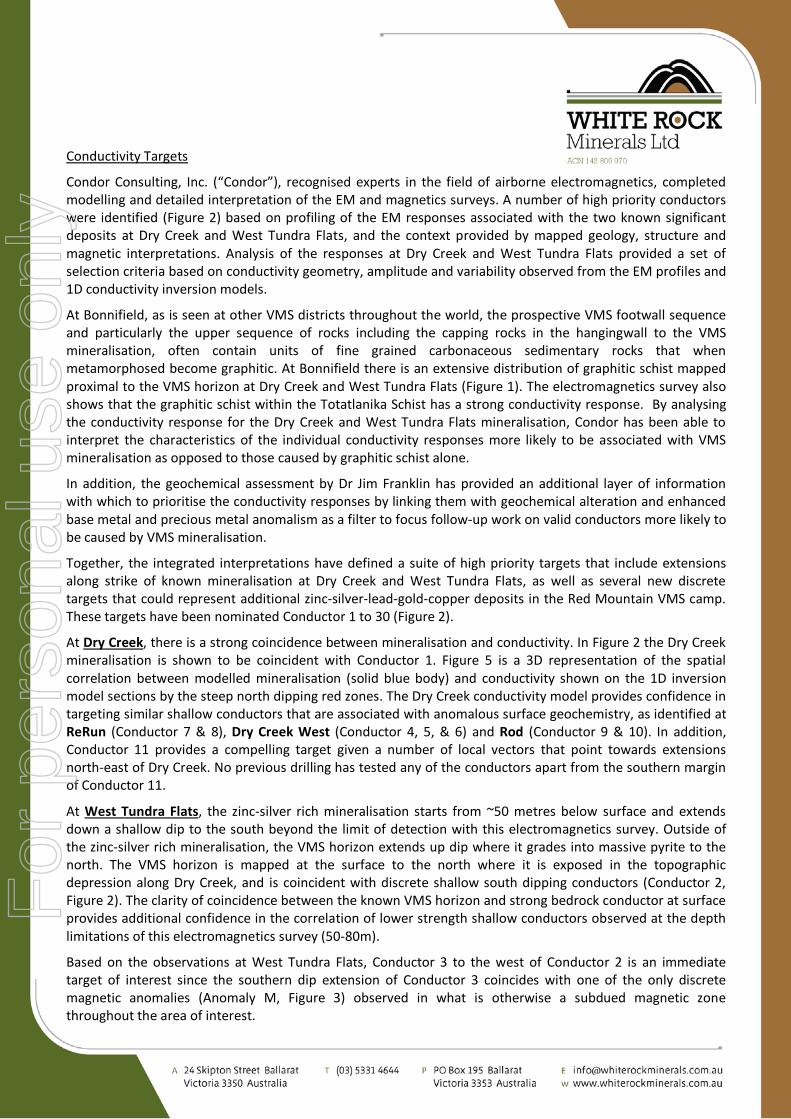
Condor Consulting, Inc. (“Condor”), recognised experts in the field of airborne electromagnetics, completed modelling and detailed interpretation of the EM and magnetics surveys. A number of high priority conductors were identified (Figure 2) based on profiling of the EM responses associated with the two known significant deposits at Dry Creek and West Tundra Flats, and the context provided by mapped geology, structure and magnetic interpretations. Analysis of the responses at Dry Creek and West Tundra Flats provided a set of selection criteria based on conductivity geometry, amplitude and variability observed from the EM profiles and 1D conductivity inversion models.
At Bonnifield, as is seen at other VMS districts throughout the world, the prospective VMS footwall sequence and particularly the upper sequence of rocks including the capping rocks in the hangingwall to the VMS mineralisation, often contain units of fine grained carbonaceous sedimentary rocks that when metamorphosed become graphitic. At Bonnifield there is an extensive distribution of graphitic schist mapped proximal to the VMS horizon at Dry Creek and West Tundra Flats (Figure 1). The electromagnetics survey also shows that the graphitic schist within the Totatlanika Schist has a strong conductivity response. By analysing the conductivity response for the Dry Creek and West Tundra Flats mineralisation, Condor has been able to interpret the characteristics of the individual conductivity responses more likely to be associated with VMS mineralisation as opposed to those caused by graphitic schist alone.
In addition, the geochemical assessment by Dr Jim Franklin has provided an additional layer of information with which to prioritise the conductivity responses by linking them with geochemical alteration and enhanced base metal and precious metal anomalism as a filter to focus follow-up work on valid conductors more likely to be caused by VMS mineralisation.
Together, the integrated interpretations have defined a suite of high priority targets that include extensions along strike of known mineralisation at Dry Creek and West Tundra Flats, as well as several new discrete targets that could represent additional zinc-silver-lead-gold-copper deposits in the Red Mountain VMS camp. These targets have been nominated Conductor 1 to 30 (Figure 2).
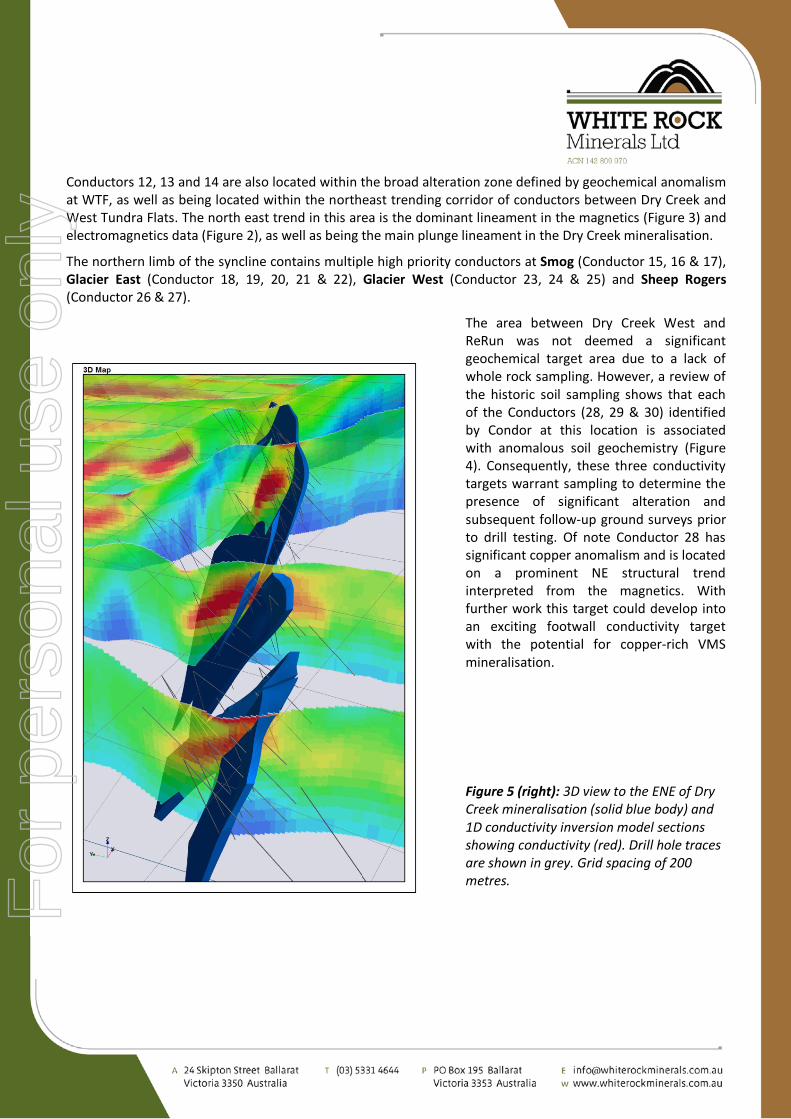
At Dry Creek, there is a strong coincidence between mineralisation and conductivity. In Figure 2 the Dry Creek mineralisation is shown to be coincident with Conductor 1. Figure 5 is a 3D representation of the spatial correlation between modelled mineralisation (solid blue body) and conductivity shown on the 1D inversion model sections by the steep north dipping red zones. The Dry Creek conductivity model provides confidence in targeting similar shallow conductors that are associated with anomalous surface geochemistry, as identified at ReRun (Conductor 7 & 8), Dry Creek West (Conductor 4, 5, & 6) and Rod (Conductor 9 & 10). In addition, Conductor 11 provides a compelling target given a number of local vectors that point towards extensions north-east of Dry Creek. No previous drilling has tested any of the conductors apart from the southern margin of Conductor 11.
At West Tundra Flats, the zinc-silver rich mineralisation starts from ~50 metres below surface and extends down a shallow dip to the south beyond the limit of detection with this electromagnetics survey. Outside of the zinc-silver rich mineralisation, the VMS horizon extends up dip where it grades into massive pyrite to the north. The VMS horizon is mapped at the surface to the north where it is exposed in the topographic depression along Dry Creek, and is coincident with discrete shallow south dipping conductors (Conductor 2, Figure 2). The clarity of coincidence between the known VMS horizon and strong bedrock conductor at surface provides additional confidence in the correlation of lower strength shallow conductors observed at the depth limitations of this electromagnetics survey (50-80m).
Based on the observations at West Tundra Flats, Conductor 3 to the west of Conductor 2 is an immediate target of interest since the southern dip extension of Conductor 3 coincides with one of the only discrete magnetic anomalies (Anomaly M, Figure 3) observed in what is otherwise a subdued magnetic zone throughout the area of interest.
For
per
sona
l use
onl
y
Conductors 12, 13 and 14 are also located within the broad alteration zone defined by geochemical anomalism at WTF, as well as being located within the northeast trending corridor of conductors between Dry Creek and West Tundra Flats. The north east trend in this area is the dominant lineament in the magnetics (Figure 3) and electromagnetics data (Figure 2), as well as being the main plunge lineament in the Dry Creek mineralisation.
The northern limb of the syncline contains multiple high priority conductors at Smog (Conductor 15, 16 & 17), Glacier East (Conductor 18, 19, 20, 21 & 22), Glacier West (Conductor 23, 24 & 25) and Sheep Rogers (Conductor 26 & 27).
The area between Dry Creek West and ReRun was not deemed a significant geochemical target area due to a lack of whole rock sampling. However, a review of the historic soil sampling shows that each of the Conductors (28, 29 & 30) identified by Condor at this location is associated with anomalous soil geochemistry (Figure 4). Consequently, these three conductivity targets warrant sampling to determine the presence of significant alteration and subsequent follow-up ground surveys prior to drill testing. Of note Conductor 28 has significant copper anomalism and is located on a prominent NE structural trend interpreted from the magnetics. With further work this target could develop into an exciting footwall conductivity target with the potential for copper-rich VMS mineralisation.
Figure 5 (right): 3D view to the ENE of Dry Creek mineralisation (solid blue body) and 1D conductivity inversion model sections showing conductivity (red). Drill hole traces are shown in grey. Grid spacing of 200 metres.
For
per
sona
l use
onl
y
For more information about White Rock and its Projects, please visit our website www.whiterockminerals.com.au or contact: Matt Gill (Chief Executive Officer) or Shane Turner (Company Secretary) Phone: +61 (0)3 5331 4644 Email: [email protected] This announcement has been prepared for publication in Australia. This announcement does not constitute an offer to sell, or a solicitation of an offer to buy, securities in any other jurisdiction.
Competent Persons Statement The information in this report that relates to exploration results is based on information compiled by Mr Rohan Worland who is a Member of the Australian Institute of Geoscientists and is a consultant to White Rock Minerals Ltd. Mr Worland has sufficient experience which is relevant to the style of mineralisation and type of deposit under consideration and to the activity which he is undertaking to qualify as a Competent Person as defined in the 2012 Edition of the ‘Australasian Code for Reporting of Exploration Results, Mineral Resources and Ore Reserves’. Mr Worland consents to the inclusion in the report of the matters based on his information in the form and context in which it appears.
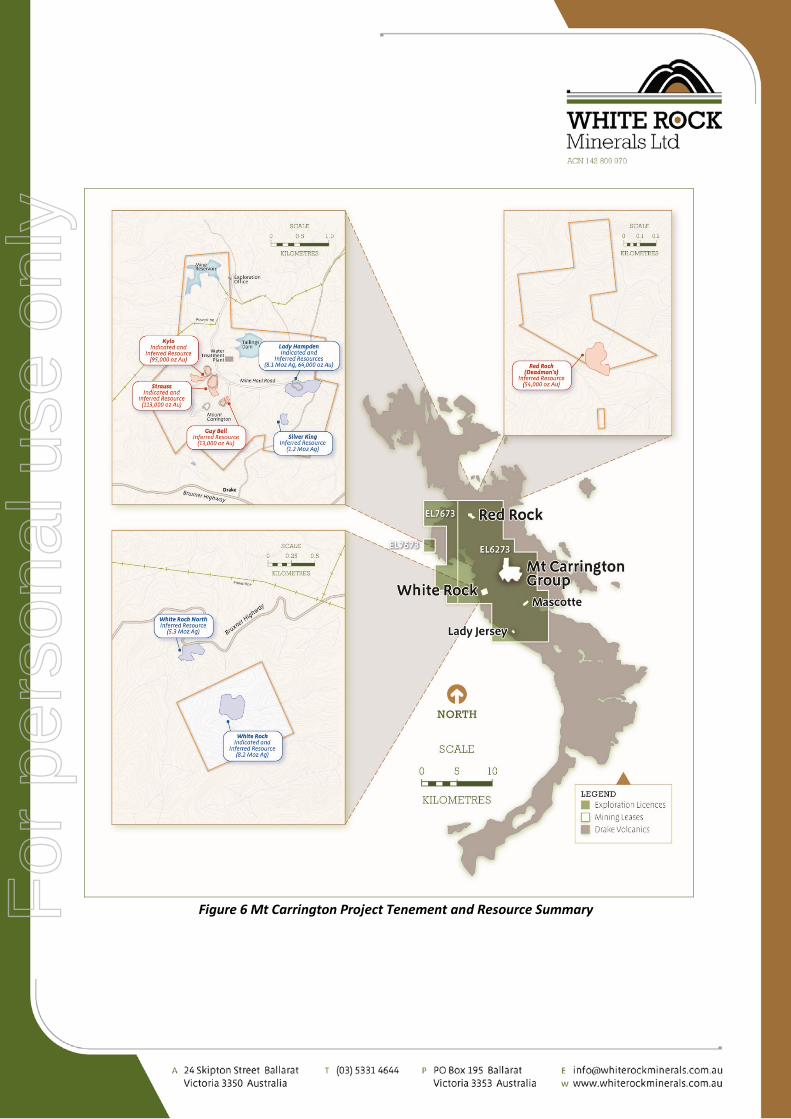
• The Mt Carrington Project is located in northern NSW, near the township of Drake on the Bruxner Highway, 4 hours’ drive south-west of Brisbane. The tenement package comprises 22 mining leases and two exploration licences over a total area of 229km² (Figure 6).
• The Mt Carrington Project contains gold-silver epithermal mineralisation associated with a large 250km² collapsed volcanic caldera structure. Gold was first discovered in the district in 1853. In 1988 a mining operation at Mt Carrington focussed on extracting open pit oxide gold and silver ore from the Strauss, Kylo, Guy Bell and Lady Hampden deposits. The oxide ore was depleted by 1990, and with metal prices at US$370/oz gold and US$5/oz silver, the small scale mine was closed.
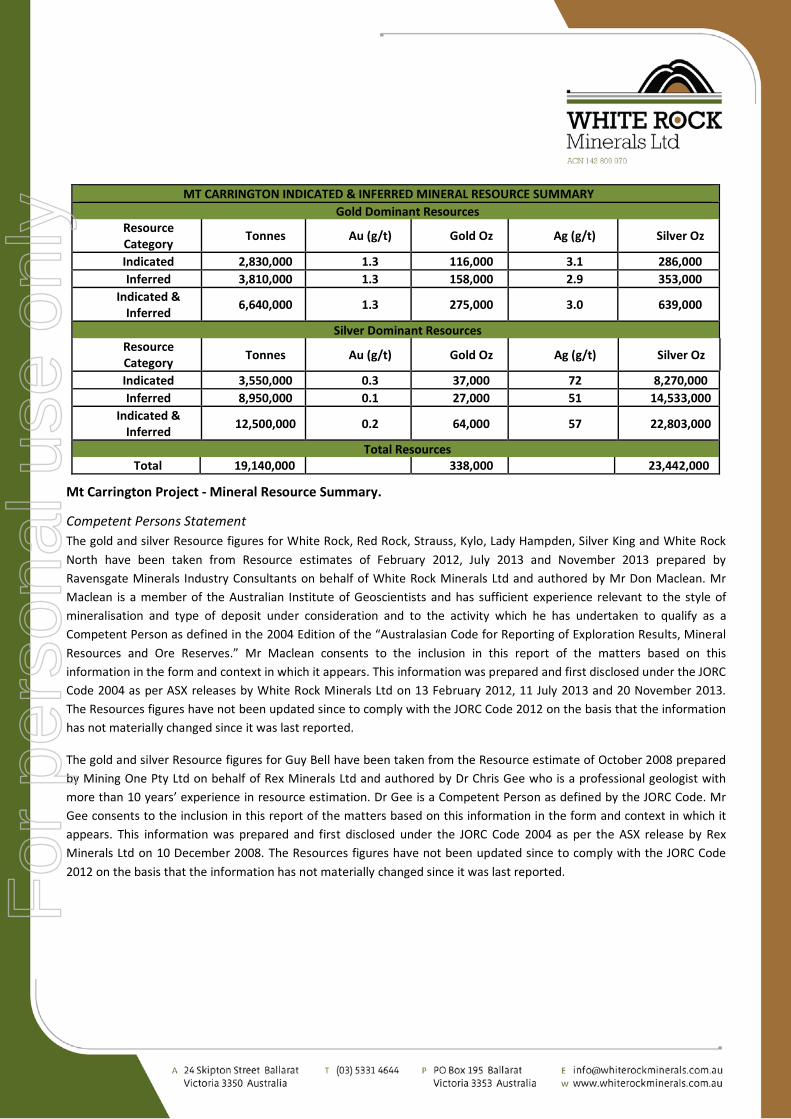
• Since 2010, White Rock has successfully expanded the inventory at Mt Carrington. Indicated and Inferred Mineral Resources total 338,000oz gold and 23.5Moz silver. There are four gold dominant deposits (Strauss, Kylo, Guy Bell and Red Rock), one gold-silver deposit (Lady Hampden) and three silver dominant deposits (White Rock, Silver King and White Rock North). All of these deposits apart from White Rock North are amenable to open pit mining, with mineralisation extending from surface.
• Scoping studies (ASX Announcements 29 March 2016, 30 September 2015, 16 September 2014 and 31 July 2012) support the development of a gold-silver operation at Mt Carrington. Using A$1,600/oz gold and A$22/oz silver, the Mt Carrington Project forecasts:-
production of 111,000 oz gold and 6.7Moz silver over a mine life of 7 years, a low capital cost of A$24.2M, an NPV10 of A$60.6M and an IRR of 103%, free cash flow of A$100M (undiscounted), a quick payback of 10 months, and with a C1 cash cost of A$754/oz gold and $A10/oz silver.
• The scoping study contemplates a processing circuit capable of treating all ore types. For the gold dominant ore types the optimized pathway consists of a standard milling and flotation circuit producing a rougher concentrate which is subsequently reground and treated in an intensive leach process to recover the precious metals as dore. For the silver dominant ore types the flotation circuit would be upgraded to enable a cleaned concentrate to be produced. Production of a saleable silver concentrate is the most profitable processing pathway for the silver rich deposits.
• The low capital cost is augmented by the presence of already existing key infrastructure from the historic mining operation. This existing infrastructure includes granted mining leases, a 1.5 Mt tailings dam, a 750 mL freshwater dam, site office, the old plant footprint and foundations, a reverse osmosis water treatment plant
For
per
sona
l use
onl
y
and access to state grid power. This existing infrastructure has been valued at A$20M in terms of the savings with respect to a greenfields development scenario.
• The positive results from the scoping studies strongly support the implementation of feasibility studies and future development of the Mt Carrington Project. A number of pre-development optimisation activities are underway in preparation for feasibility studies to be completed in 2017 with development targeted in 2018.
• The Mt Carrington Mining Leases are enveloped by a large portfolio of Exploration Licences with demonstrated potential for epithermal and intrusion-related gold, silver and copper mineralisation. White Rock has generated and refined an extensive exploration target portfolio at Mt Carrington for staged advancement and drill testing for gold and silver concurrent with the development of the current Resource. In addition, more recent work has demonstrated the potential for the project to host significant intrusion-related (porphyry) copper mineralisation.
The scoping study referred to in this report is insufficient to support estimation of Ore Reserves or to provide assurance of an economic development case at this stage, or to provide certainty that the conclusions of the Scoping Study will be realised. The material assumptions relating to the scoping study at Mt Carrington provided in the ASX Announcements dated 29 March 2016, 30 September 2015, 14 September 2014 and 31 July 2012 continue to apply and have not materially changed.
In discussing ‘reasonable prospects for eventual extraction’ in Clause 20, the JORC Code 2012 (‘Code’) requires an assessment (albeit preliminary) in respect of all matters likely to influence the prospect of economic extraction including the approximate mining parameters by the Competent Person. While a Scoping Study may provide the basis for that assessment, the Code does not require a Scoping Study to have been completed to report a Mineral Resource.
Scoping Studies are commonly the first economic evaluation of a project undertaken and may be based on a combination of directly gathered project data together with assumptions borrowed from similar deposits or operations to the case envisaged. They are also commonly used internally by companies for comparative and planning purposes. Reporting the results of a Scoping Study needs to be undertaken with care to ensure there is no implication that Ore Reserves have been established or that economic development is assured. In this regard it may be appropriate to indicate the Mineral Resource inputs to the Scoping Study and the process applied, but it is not appropriate to report the diluted tonnes and grade as if they were Ore Reserves. While initial mining and processing cases may have been developed during the Scoping Study, it must not be used to allow an Ore Reserve to be developed.
Total Resources Total 19,140,000 338,000 23,442,000
Mt Carrington Project - Mineral Resource Summary.
Competent Persons Statement The gold and silver Resource figures for White Rock, Red Rock, Strauss, Kylo, Lady Hampden, Silver King and White Rock North have been taken from Resource estimates of February 2012, July 2013 and November 2013 prepared by Ravensgate Minerals Industry Consultants on behalf of White Rock Minerals Ltd and authored by Mr Don Maclean. Mr Maclean is a member of the Australian Institute of Geoscientists and has sufficient experience relevant to the style of mineralisation and type of deposit under consideration and to the activity which he has undertaken to qualify as a Competent Person as defined in the 2004 Edition of the “Australasian Code for Reporting of Exploration Results, Mineral Resources and Ore Reserves.” Mr Maclean consents to the inclusion in this report of the matters based on this information in the form and context in which it appears. This information was prepared and first disclosed under the JORC Code 2004 as per ASX releases by White Rock Minerals Ltd on 13 February 2012, 11 July 2013 and 20 November 2013. The Resources figures have not been updated since to comply with the JORC Code 2012 on the basis that the information has not materially changed since it was last reported.
The gold and silver Resource figures for Guy Bell have been taken from the Resource estimate of October 2008 prepared by Mining One Pty Ltd on behalf of Rex Minerals Ltd and authored by Dr Chris Gee who is a professional geologist with more than 10 years’ experience in resource estimation. Dr Gee is a Competent Person as defined by the JORC Code. Mr Gee consents to the inclusion in this report of the matters based on this information in the form and context in which it appears. This information was prepared and first disclosed under the JORC Code 2004 as per the ASX release by Rex Minerals Ltd on 10 December 2008. The Resources figures have not been updated since to comply with the JORC Code 2012 on the basis that the information has not materially changed since it was last reported.
For
per
sona
l use
onl
y
Figure 6 Mt Carrington Project Tenement and Resource Summary
For
per
sona
l use
onl
y
APPENDIX 1
Sampling Techniques and Data Criteria JORC Code explanation Commentary
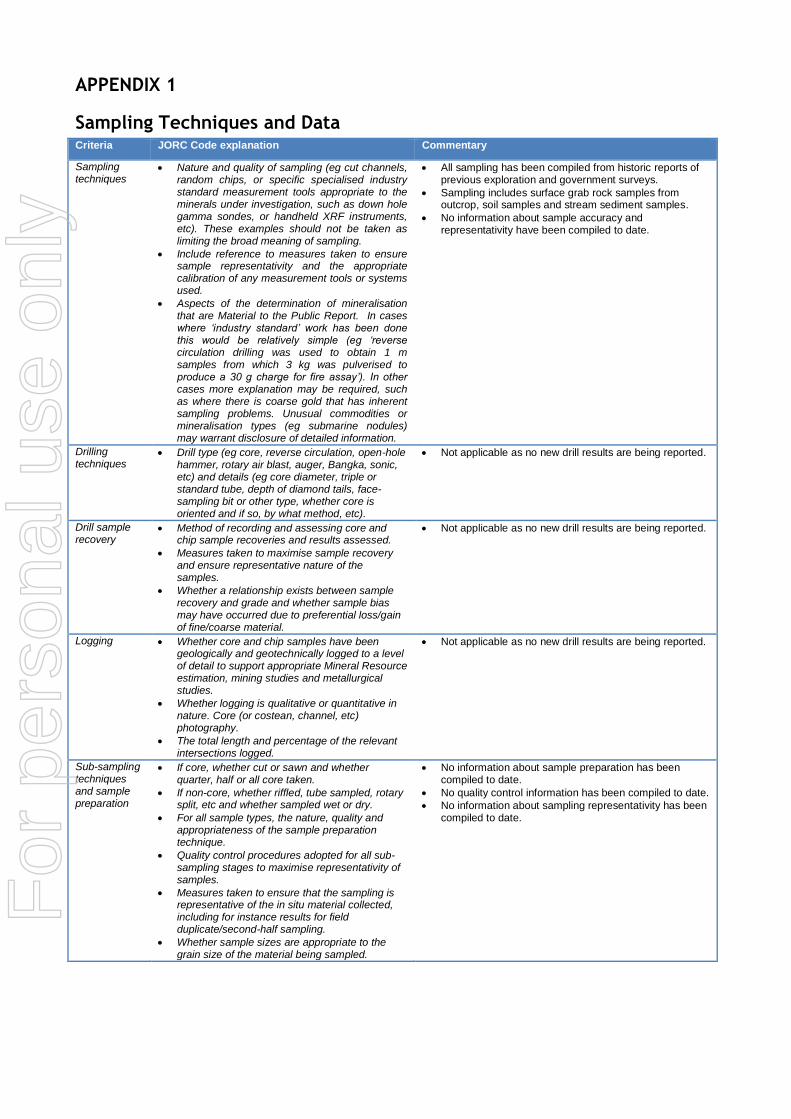
Sampling techniques
Nature and quality of sampling (eg cut channels, random chips, or specific specialised industry standard measurement tools appropriate to the minerals under investigation, such as down hole gamma sondes, or handheld XRF instruments, etc). These examples should not be taken as limiting the broad meaning of sampling.
Include reference to measures taken to ensure sample representativity and the appropriate calibration of any measurement tools or systems used.
Aspects of the determination of mineralisation that are Material to the Public Report. In cases where ‘industry standard’ work has been done this would be relatively simple (eg ‘reverse circulation drilling was used to obtain 1 m samples from which 3 kg was pulverised to produce a 30 g charge for fire assay’). In other cases more explanation may be required, such as where there is coarse gold that has inherent sampling problems. Unusual commodities or mineralisation types (eg submarine nodules) may warrant disclosure of detailed information.
All sampling has been compiled from historic reports of previous exploration and government surveys.
Sampling includes surface grab rock samples from outcrop, soil samples and stream sediment samples.
No information about sample accuracy and representativity have been compiled to date.
Drilling techniques
Drill type (eg core, reverse circulation, open-hole hammer, rotary air blast, auger, Bangka, sonic, etc) and details (eg core diameter, triple or standard tube, depth of diamond tails, face-sampling bit or other type, whether core is oriented and if so, by what method, etc).
Not applicable as no new drill results are being reported.
Drill sample recovery
Method of recording and assessing core and chip sample recoveries and results assessed.
Measures taken to maximise sample recovery and ensure representative nature of the samples.
Whether a relationship exists between sample recovery and grade and whether sample bias may have occurred due to preferential loss/gain of fine/coarse material.
Not applicable as no new drill results are being reported.
Logging Whether core and chip samples have been geologically and geotechnically logged to a level of detail to support appropriate Mineral Resource estimation, mining studies and metallurgical studies.
Whether logging is qualitative or quantitative in nature. Core (or costean, channel, etc) photography.
The total length and percentage of the relevant intersections logged.
Not applicable as no new drill results are being reported.
Sub-sampling techniques and sample preparation
If core, whether cut or sawn and whether quarter, half or all core taken.
If non-core, whether riffled, tube sampled, rotary split, etc and whether sampled wet or dry.
For all sample types, the nature, quality and appropriateness of the sample preparation technique.
Quality control procedures adopted for all sub-sampling stages to maximise representativity of samples.
Measures taken to ensure that the sampling is representative of the in situ material collected, including for instance results for field duplicate/second-half sampling.
Whether sample sizes are appropriate to the grain size of the material being sampled.
No information about sample preparation has been compiled to date.
No quality control information has been compiled to date.
No information about sampling representativity has been compiled to date.
For
per
sona
l use
onl
y
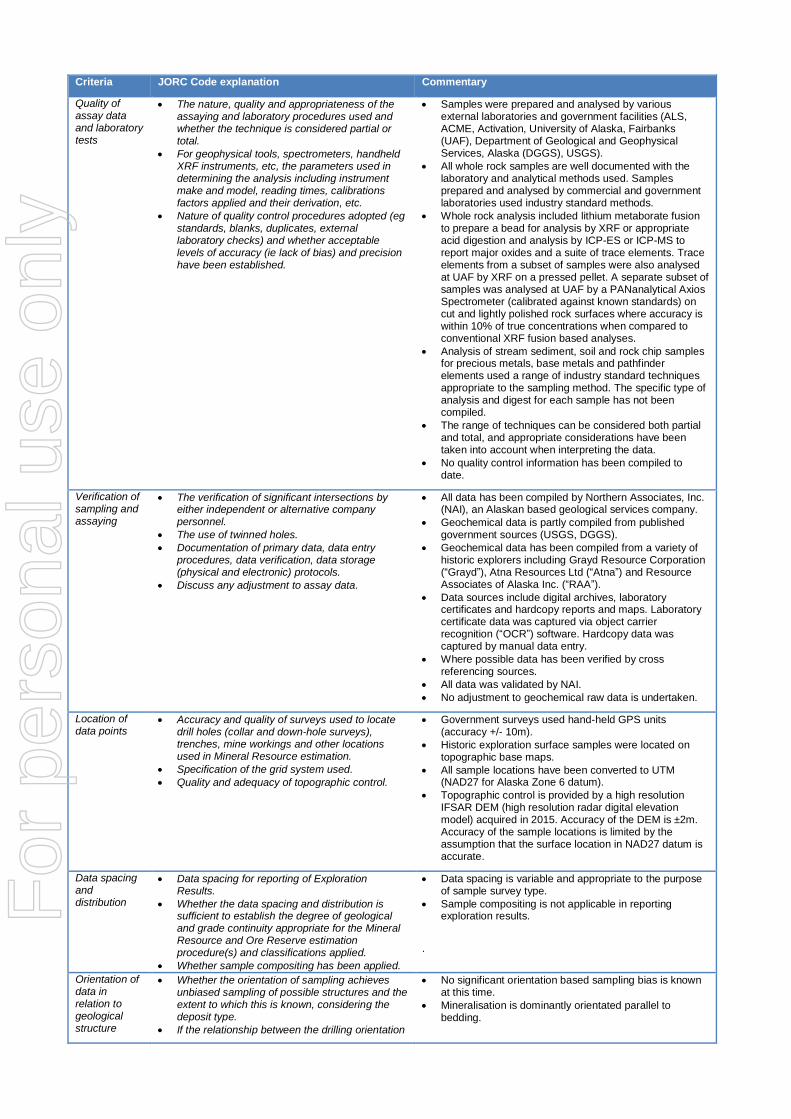
Criteria JORC Code explanation Commentary
Quality of assay data and laboratory tests
The nature, quality and appropriateness of the assaying and laboratory procedures used and whether the technique is considered partial or total.
For geophysical tools, spectrometers, handheld XRF instruments, etc, the parameters used in determining the analysis including instrument make and model, reading times, calibrations factors applied and their derivation, etc.
Nature of quality control procedures adopted (eg standards, blanks, duplicates, external laboratory checks) and whether acceptable levels of accuracy (ie lack of bias) and precision have been established.
Samples were prepared and analysed by various external laboratories and government facilities (ALS, ACME, Activation, University of Alaska, Fairbanks (UAF), Department of Geological and Geophysical Services, Alaska (DGGS), USGS).
All whole rock samples are well documented with the laboratory and analytical methods used. Samples prepared and analysed by commercial and government laboratories used industry standard methods.
Whole rock analysis included lithium metaborate fusion to prepare a bead for analysis by XRF or appropriate acid digestion and analysis by ICP-ES or ICP-MS to report major oxides and a suite of trace elements. Trace elements from a subset of samples were also analysed at UAF by XRF on a pressed pellet. A separate subset of samples was analysed at UAF by a PANanalytical Axios Spectrometer (calibrated against known standards) on cut and lightly polished rock surfaces where accuracy is within 10% of true concentrations when compared to conventional XRF fusion based analyses.
Analysis of stream sediment, soil and rock chip samples for precious metals, base metals and pathfinder elements used a range of industry standard techniques appropriate to the sampling method. The specific type of analysis and digest for each sample has not been compiled.
The range of techniques can be considered both partial and total, and appropriate considerations have been taken into account when interpreting the data.
No quality control information has been compiled to date.
Verification of sampling and assaying
The verification of significant intersections by either independent or alternative company personnel.
The use of twinned holes.
Documentation of primary data, data entry procedures, data verification, data storage (physical and electronic) protocols.
Discuss any adjustment to assay data.
All data has been compiled by Northern Associates, Inc. (NAI), an Alaskan based geological services company.
Geochemical data is partly compiled from published government sources (USGS, DGGS).
Geochemical data has been compiled from a variety of historic explorers including Grayd Resource Corporation (“Grayd”), Atna Resources Ltd (“Atna”) and Resource Associates of Alaska Inc. (“RAA”).
Data sources include digital archives, laboratory certificates and hardcopy reports and maps. Laboratory certificate data was captured via object carrier recognition (“OCR”) software. Hardcopy data was captured by manual data entry.
Where possible data has been verified by cross referencing sources.
All data was validated by NAI.
No adjustment to geochemical raw data is undertaken.
Location of data points
Accuracy and quality of surveys used to locate drill holes (collar and down-hole surveys), trenches, mine workings and other locations used in Mineral Resource estimation.
Specification of the grid system used.
Quality and adequacy of topographic control.
Government surveys used hand-held GPS units (accuracy +/- 10m).
Historic exploration surface samples were located on topographic base maps.
All sample locations have been converted to UTM (NAD27 for Alaska Zone 6 datum).
Topographic control is provided by a high resolution IFSAR DEM (high resolution radar digital elevation model) acquired in 2015. Accuracy of the DEM is ±2m. Accuracy of the sample locations is limited by the assumption that the surface location in NAD27 datum is accurate.
Data spacing and distribution
Data spacing for reporting of Exploration Results.
Whether the data spacing and distribution is sufficient to establish the degree of geological and grade continuity appropriate for the Mineral Resource and Ore Reserve estimation procedure(s) and classifications applied.
Whether sample compositing has been applied.
Data spacing is variable and appropriate to the purpose of sample survey type.
Sample compositing is not applicable in reporting exploration results.
.
Orientation of data in relation to geological structure
Whether the orientation of sampling achieves unbiased sampling of possible structures and the extent to which this is known, considering the deposit type.
If the relationship between the drilling orientation
No significant orientation based sampling bias is known at this time.
Mineralisation is dominantly orientated parallel to bedding.
For
per
sona
l use
onl
y
Criteria JORC Code explanation Commentary
and the orientation of key mineralised structures is considered to have introduced a sampling bias, this should be assessed and reported if material.
Sample security
The measures taken to ensure sample security. No records of sample security have been compiled to date.
Audits or reviews
The results of any audits or reviews of sampling techniques and data.
No records of any audits or reviews of sampling have been compiled to date.
For
per
sona
l use
onl
y
APPENDIX 2
Reporting of Exploration Results Criteria JORC Code explanation Commentary
Mineral tenement and land tenure status
Type, reference name/number, location and ownership including agreements or material issues with third parties such as joint ventures, partnerships, overriding royalties, native title interests, historical sites, wilderness or national park and environmental settings.
The security of the tenure held at the time of reporting along with any known impediments to obtaining a licence to operate in the area.
The Red Mountain Project comprises 224 mining claims in the State of Alaska (‘the Tenements’).
The Tenements are 100% owned by White Rock (RM) Inc., a fully owned subsidiary of White Rock Minerals Ltd.
All of the Tenements are current and in good standing.
There are no known impediments to exploration or mining in the area
Exploration done by other parties
Acknowledgment and appraisal of exploration by other parties.
The Red Mountain project has seen significant exploration conducted by Resource Associates of Alaska Inc. (“RAA”), Getty Mining Company (“Getty”), Phelps Dodge Corporation (“Phelps Dodge”), Houston Oil and Minerals Exploration Company (“HOMEX”), Grayd Resource Corporation (“Grayd”) and Atna Resources Ltd (“Atna”). The Exploration Results presented here are based ono a compilation of the historical surface sampling completed by these explorers and government surveys.
Government surveys of compiled and published geochemical data include U.S. Geological Survey (“USGS”) and the Division of Geological & Geophysical Surveys, Alaska (“DGGS”)
All historical work has been reviewed, appraised and integrated into a database and is of sufficient quality, relevance and applicability to be reported here.
Geology Deposit type, geological setting and style of mineralisation.
Volcanogenic massive sulphide (“VMS”) mineralisation located in the Bonnifield District, located in the western extension of the Yukon Tanana terrane.
The regional geology consists of an east-west trending schist belt of Precambrian and Palaeozoic meta-sedimentary and volcanic rocks. The schist is intruded by Cretaceous granitic rocks along with Tertiary dikes and plugs of intermediate to mafic composition. Tertiary and Quaternary sedimentary rocks with coal bearing horizons cover portions of the older rocks. The VMS mineralisation is most commonly located in the upper portions of the Totatlanika Schist which is of Carboniferous to Devonian age.
Drill hole Information
A summary of all information material to the understanding of the exploration results including a tabulation of the following information for all Material drill holes: o easting and northing of the drill hole collar o elevation or RL (Reduced Level – elevation
above sea level in metres) of the drill hole collar
o dip and azimuth of the hole o down hole length and interception depth o hole length.
If the exclusion of this information is justified on the basis that the information is not Material and this exclusion does not detract from the understanding of the report, the Competent Person should clearly explain why this is the case.
Not applicable as no new drill results are being reported.
All known historic drilling and drill results were reported on 15
th February 2016.
Data aggregation methods
In reporting Exploration Results, weighting averaging techniques, maximum and/or minimum grade truncations (eg cutting of high grades) and cut-off grades are usually Material and should be stated.
Where aggregate intercepts incorporate short lengths of high grade results and longer lengths of low grade results, the procedure used for such aggregation should be stated and some typical examples of such aggregations should be shown in detail.
The assumptions used for any reporting of metal
No aggregation methods were used in the reporting of results. F
or p
erso
nal u
se o
nly
Criteria JORC Code explanation Commentary
equivalent values should be clearly stated.
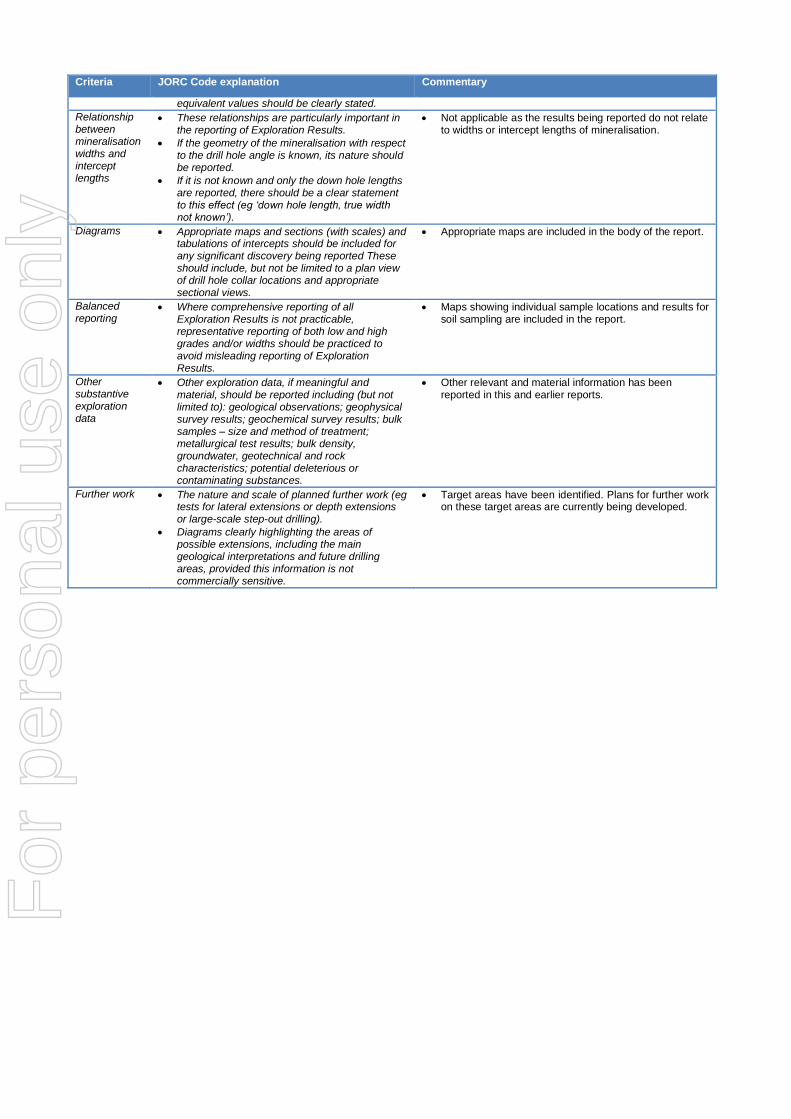
Relationship between mineralisation widths and intercept lengths
These relationships are particularly important in the reporting of Exploration Results.
If the geometry of the mineralisation with respect to the drill hole angle is known, its nature should be reported.
If it is not known and only the down hole lengths are reported, there should be a clear statement to this effect (eg ‘down hole length, true width not known’).
Not applicable as the results being reported do not relate to widths or intercept lengths of mineralisation.
Diagrams Appropriate maps and sections (with scales) and tabulations of intercepts should be included for any significant discovery being reported These should include, but not be limited to a plan view of drill hole collar locations and appropriate sectional views.
Appropriate maps are included in the body of the report.
Balanced reporting
Where comprehensive reporting of all Exploration Results is not practicable, representative reporting of both low and high grades and/or widths should be practiced to avoid misleading reporting of Exploration Results.
Maps showing individual sample locations and results for soil sampling are included in the report.
Other substantive exploration data
Other exploration data, if meaningful and material, should be reported including (but not limited to): geological observations; geophysical survey results; geochemical survey results; bulk samples – size and method of treatment; metallurgical test results; bulk density, groundwater, geotechnical and rock characteristics; potential deleterious or contaminating substances.
Other relevant and material information has been reported in this and earlier reports.
Further work The nature and scale of planned further work (eg tests for lateral extensions or depth extensions or large-scale step-out drilling).
Diagrams clearly highlighting the areas of possible extensions, including the main geological interpretations and future drilling areas, provided this information is not commercially sensitive.
Target areas have been identified. Plans for further work on these target areas are currently being developed.