18
WHITEPAPER Development of a Compact, Cost Effective, and Energy Efficient Biofilm Reactor for Wastewater Treatment and Effluent Reuse
| Date post: | 09-Mar-2018 |
| Category: |
Documents |
| Upload: | truongdang |
| View: | 217 times |
| Download: | 1 times |
whitepaperDevelopment of a Compact, Cost effective, and energy efficient Biofilm reactor for wastewater treatment and effluent reuse


Contentabstract ............................................................................................... 4introduction ......................................................................................... 4the CFiC® Biofilm reactor process .................................................. 5Bench-Scale tests .............................................................................. 6pilot-Scale tests ................................................................................13Conclusions .......................................................................................16acknowledgements ...........................................................................17references .........................................................................................17
4
Development of a Compact, Cost Effective, and Energy Efficient Biofilm Reactor for Wastewater Treatment and Effluent Reuse Bjorn Rusten1*, Pascale Stang1,2, Eva Rogne3, Jon Siljudalen3, Laura Marcolini4
1Aquateam, P.O. Box 6875, Rodelokka, N-0504 Oslo, Norway 2University of Life Sciencies, Dept. of Mathematical Sciencies & Technolgy, P.O. Box 5003, N-1432 Ås, Norway 3Biowater Technology, P.O. Box 236, N-3101 Tønsberg, Norway 4Biowater Technology, LLC, 2145 Diamond Hill Rd, Cumberland, Rhode Island 02864, USA *E-mail: [email protected] ABSTRACT The CFIC® (Continuous Flow Intermittent Cleaning) biofilm reactor has been developed. It contains highly packed biofilm carriers to a degree that little movement of the carriers occurs in the reactor during normal operation. The process has continuous inflow to the bioreactor and intermittent cleaning, which removes excess biomass from the biofilm carriers. A large void volume maximizes the run time between cleaning cycles. During cleaning the water level in the reactor is elevated just enough to provide free movement of the carriers. The turbulence in the reactor may temporarily be increased to facilitate removal of biomass, and the biomass will be washed out of the reactor using influent wastewater. The new CFIC® process was tested in parallel with the well-documented MBBR process. The CFIC® process produced lower effluent FCOD and TSS concentrations than the MBBR process, even at higher biofilm surface area loading rates and significantly higher volumetric loading rates. KEYWORDS: Biofilm, CFIC®, MBBR, organic matter, wastewater treatment. INTRODUCTION With many wastewater treatment plants facing increased loads and the need for upgrading within a confined space, compact biofilm processes have gained popularity. This is evidenced by the huge success of the moving bed biofilm reactor (MBBR) process (Rusten and Paulsrud, 2009). The MBBR technology was introduced more than 20 years ago (Ødegaard et al., 1999) and is now a mature technology. About two years ago, engineers involved in the initial commercialization of the MBBR process began development of the next generation biofilm reactor, with the aim to be more compact, more energy efficient and have lower costs than the current MBBR process. The new biofilm reactor is patented and has been developed by Biowater Technology, with the help of external R&D institutions. It is called the CFIC® (Continuous Flow Intermittent Cleaning) biofilm reactor.

5
This paper presents results from testing of the CFIC® biofilm reactor process in bench-scale and pilot-scale, with different types of biofilm carriers, different filling degrees, and different cleaning procedures. The CFIC® process was tested in parallel with the MBBR technology at both bench-scale and pilot-scale. THE CFIC® BIOFILM REACTOR PROCESS The CFIC® reactor contains highly packed biofilm carriers to a degree (typically 90-99% bulk volumetric fill) that little movement of the carriers occurs in the reactor during normal operation (Figure 1 a). Microorganisms in the biofilm that attach on the surface of the carriers take up pollutants as food for growth. The CFIC® process has continuous inflow to the bioreactor and intermittent cleaning, using influent wastewater, which removes excess biomass (sludge) from the biofilm carriers. At the same time the carrier shape provides a large void volume (typically a 85% void volume in a 100% fill situation) for growth and accumulation of biomass. The void volume maximizes the run time between cleaning cycles. During cleaning cycles the water level in the reactor is elevated (Figure 1 b) just enough to provide free movement of the carriers. The turbulence in the reactor may temporarily be increased to facilitate removal of biomass, and the biomass will be washed out of the reactor using influent wastewater. Figure 1. The CFIC® during a) normal operation, and during b) the cleaning cycle. Under normal operation and with limited mobility of the carriers, high carbon and nutrient gradients are created inside the biofilm. In an aerated reactor, oxygen transfer efficiency is improved since air bubbles will have to travel through the highly packed carriers, thereby creating a long retention time and pathway before the air bubbles reach the reactor surface. Highly packed carriers can also serve as a “filter” to reduce solids concentrations in the treated water and thus allow the CFIC® to be combined with membrane filtration (microfiltration or ultrafiltration) for wastewater reuse without employing an intermediate solids separation unit. An example flow-sheet of CFIC® followed by membrane filtration for effluent reuse is shown in
Effluent
Wash waterInfluent
a) Normal operation b) Removal of excess biomassAerator Aerator
Open valve:Closed valve:
Influent

6
Figure 2. Wastewater treatment plants typically have several parallel trains, and the beauty of the CFIC® process is that one wash water (or biosludge) handling system can serve multiple trains. Figure 2. Simplified flow sheet of a CFIC® + membrane filtration treatment plant with parallel trains. BENCH-SCALE TESTS Materials and Methods A semi-synthetic wastewater was made, using the recipe from Parker et al. (2002). The wastewater was supposed to resemble a medium strength municipal wastewater. Concentrations varied a little bit with the amount of dilution water added to the concentrate. Typical influent concentrations to the bench-scale bioreactors were 420 mg/L total COD (TCOD), 300 mg/L filtered COD (FCOD), and 85 mg/L total suspended solids (TSS). Acrylic reactors with inside dimensions of 200 mm x 200 mm x 714 mm (L x W x H) were used as bioreactors. The reactors had adjustable water levels. Water levels of 500 mm were used for normal operation. During cleaning the water level in the CFIC® reactor was increased to 640 mm. This was equivalent to empty bed reactor volumes of 20 L during normal operation and 25.6 L during cleaning. The bioreactors had both fine bubble and coarse bubble aerators at the bottom of the reactors. Influent wastewater was distributed through two perforated tubes at the bottom of the reactors. For the results reported in this paper biofilm carriers from Biowater Technology, described in Table 1, were used. These carriers are square, with rounded corners. They have internal dividing walls in order to increase the protected biofilm surface area.
Influent Effluent
Primarytreatment
CFIC®
biofilm reactorsMF or UF
membranes
Primarysludge
Washwater
Sludge liquor
Concentrate
Biologicalsludge
Wash watertreatment

7
Table 1. Biofilm carriers used for bench-scale testing of CFIC® and MBBR. CFIC® reactor MBBR reactor Type of biofilm carrier BWT35TM BWT15TM Protected biofilm surface area 500 m2/m3 840 m2/m3 Length 8 mm 5 mm Height 35 mm 15 mm Width 35 mm 15 mm Number of cells per carrier element 50 25 The MBBR reactor had a 60 % fill of the BWT15 biofilm carrier, providing 497 m2/m3 of specific biofilm surface area in the reactor. During normal operation the CFIC® reactor had a 90 % fill of the BWT35 biofilm carrier, providing 450 m2/m3 of specific biofilm surface area in the reactor. Both reactors had continuous influent flow. During the cleaning cycle for the CFIC® process a solenoid valve automatically closed the standard effluent valve and the water level increased until it reached a level of 640 mm, corresponding to a biofilm carrier filling of 70 %. At the same time another solenoid valve opened for coarse bubble aeration, to provide better mixing and improved cleaning of the biofilm carriers. Occasionally an air-lance was manually used in the corners to make sure all biofilm carriers got into suspension during the cleaning cycle. A standard cleaning cycle lasted for 2 hours. During some tests a propeller mixer was also used for additional turbulence in the reactor. If used, propeller mixing was for 5 min at a time and with 3 repetitions between 15 and 60 minutes into the cleaning cycle. Both grab sampling and automatic sampling were used for collecting water samples. Influent samples, reactor samples, and effluent samples were analyzed for total COD, filtered COD, and TSS. Glass fiber filters with an average pore size of 1.2 micron were used for filtration. Biomass on the biofilm carriers were measured regularly, both before and after the cleaning cycle. Dissolved oxygen (DO) concentrations, pH and temperature were measured on-line, in addition to manual measurements. Electrodes were cleaned daily. All reactors were kept in a temperature controlled room at 15 ºC. Standard Testing The initial bench-scale testing was carried out at empty bed hydraulic retention times (HRT) of 1.0 h for both the CFIC® reactor and the MBBR reactor. Table 2 provides average results over a 3-week period. The CFIC® reactor was in cleaning mode from 12:00 to 14:00 every day. Grab samples of the effluent from both the CFIC® reactor and the MBBR reactor were taken at 10:00. Average biomass on the carriers was approximately 8 g TS/m2 for the BWT35 biofilm carriers in the CFIC® reactor and about 11 g TS/m2 for the BWT15 biofilm carriers in the MBBR reactor. The average biofilm surface area loading rate (SALR) was 22 g TCOD/m2-d for the CFIC® reactor and 20 g TCOD/m2-d for the MBBR reactor. The two reactors had almost identical removal of filtered COD, but the CFIC® reactor had significantly lower effluent TSS concentrations than the MBBR reactor.
8
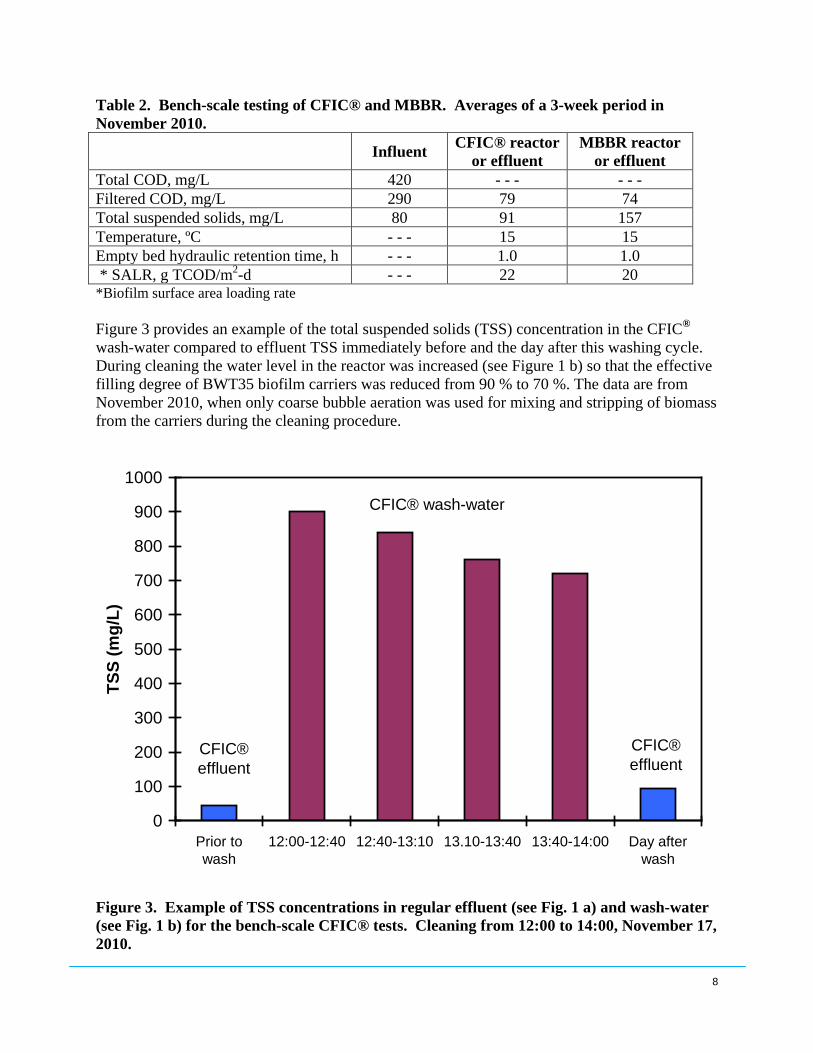
Table 2. Bench-scale testing of CFIC® and MBBR. Averages of a 3-week period in November 2010.
Influent CFIC® reactor or effluent
MBBR reactor or effluent
Total COD, mg/L 420 - - - - - - Filtered COD, mg/L 290 79 74 Total suspended solids, mg/L 80 91 157 Temperature, ºC - - - 15 15 Empty bed hydraulic retention time, h - - - 1.0 1.0 * SALR, g TCOD/m2-d - - - 22 20 *Biofilm surface area loading rate Figure 3 provides an example of the total suspended solids (TSS) concentration in the CFIC® wash-water compared to effluent TSS immediately before and the day after this washing cycle. During cleaning the water level in the reactor was increased (see Figure 1 b) so that the effective filling degree of BWT35 biofilm carriers was reduced from 90 % to 70 %. The data are from November 2010, when only coarse bubble aeration was used for mixing and stripping of biomass from the carriers during the cleaning procedure.
0
100
200
300
400
500
600
700
800
900
1000
Prior towash
12:00-12:40 12:40-13:10 13.10-13:40 13:40-14:00 Day afterwash
TSS
(mg/
L)
CFIC® wash-water
CFIC®effluent
CFIC®effluent
Figure 3. Example of TSS concentrations in regular effluent (see Fig. 1 a) and wash-water (see Fig. 1 b) for the bench-scale CFIC® tests. Cleaning from 12:00 to 14:00, November 17, 2010.

9
Due to the cleaning procedure the CFIC® process is a dynamic system that will never reach steady state. As an example, results from a 24 h period on January 19 and 20, 2011, are shown in Figure 4. The reactor was operated at an empty bed HRT of 1.0 h and a biofilm surface area loading rate of 22 g TCOD/m2-d. The reactor DO concentration was 3.9 mg O2/L and the pH was 7.6. A carrousel sampler was used for automatic sampling.
0
200
400
600
800
1000
1200
1400
08:0
010
:00
12:0
014
:00
16:0
018
:00
20:0
022
:00
00:0
002
:00
04:0
006
:00
08:0
010
:00
12:0
0
Con
cent
ratio
n (m
g/L)
TSSTotal CODFiltered COD
CFIC® with BWT35 carrierJanuary 19-20, 2011Cleaning from 12:00 to14:00
Figure 4. Example of TSS concentrations in regular effluent (see Fig. 1 a) and wash-water (see Fig. 1 b) for the bench-scale CFIC® tests. Cleaning from 12:00 to 14:00, November 17, 2010. At 10:00 on January 19 the effluent concentrations were 68 mg TSS/L, 105 mg FCOD/L and 228 mg TCOD/L. Cleaning took place from 12:00 to 14:00, with coarse bubble aeration only. During cleaning the TSS and TCOD concentrations increased significantly. The 12:30 sample also showed an increase in FCOD, but this is believed to be an anomaly due to the very high TSS concentration in the sample and hydrolysis of particulate organic matter prior to filtration and analysis of FCOD. After the cleaning was terminated at 14:00 residual biomass needed to be washed out of the reactor before a normal effluent concentration was established. The lowest concentration of effluent filtered COD was 51 mg FCOD/L and was reached at 15:30. The FCOD concentration then increased gradually up to 80 mg FCOD/L prior to the next cleaning cycle. The effluent concentration of total COD got down to about 100 mg TCOD/L, and

10
then increased gradually to about 240 mg TCOD/L. After wash-out of residual biomass, the effluent TSS concentration was below 50 mg TSS/L and then gradually climbed to 90 mg TSS/L. In comparison the MBBR reactor had an average effluent concentration of 385 mg TCOD/L and 352 mg TSS/L on January 19 and 20, operating at a biofilm surface area loading rate of 14 g TCOD/m2-d with a DO concentration of 7.5mg O2/L and a pH of 7.6. Mass Balance It was of interest to see how the CFIC® process would handle very high organic loads, as well as establishing a mass balance over several days of operation. This required so much work that the MBBR reactor was shut down. The test was carried out from May 29 to June 3, 2011. Both grab sampling and flow proportional automatic sampling were used. The flow proportional automatic samples were collected over periods from 50 min up to 5 h. The sampler took a sub-sample every 10 min. Biomass on the biofilm carriers was measured immediately prior to and immediately after each cleaning cycle. Average results from this test period are shown in Table 3. The cleaning cycle was from 12:00 to 14:00 every day. In addition to coarse bubble aeration, 3 x 5 min of propeller mixing was used during the cleaning cycle. Effluent concentrations in Table 3 do not include wash-water discharge from 12:00 to 15:00 daily. Considering a biofilm surface area loading rate 3 times higher than for the results previously shown in Table 2, the results in Table 3 are pretty good. Average DO concentration in the reactor was 3.9 mg O2/L during normal operation. During the cleaning cycle average DO concentration increased to 6.6 mg O2/L. Table 3. Bench-scale testing of CFIC® at high organic load. Averages from May 29 to June 3, 2011.
Influent CFIC® reactor or effluent
Total COD, mg/L 464 298 Filtered COD, mg/L 314 110 Total suspended solids, mg/L 111 127 DO concentration, mg O2/L 3.9 pH 7.5 Temperature, ºC - - - 15 Empty bed hydraulic retention time, h - - - 0.4 * SALR, g TCOD/m2-d - - - 61
Biomass on carriers, g TS/m2 - - - 27 ** 20 ***
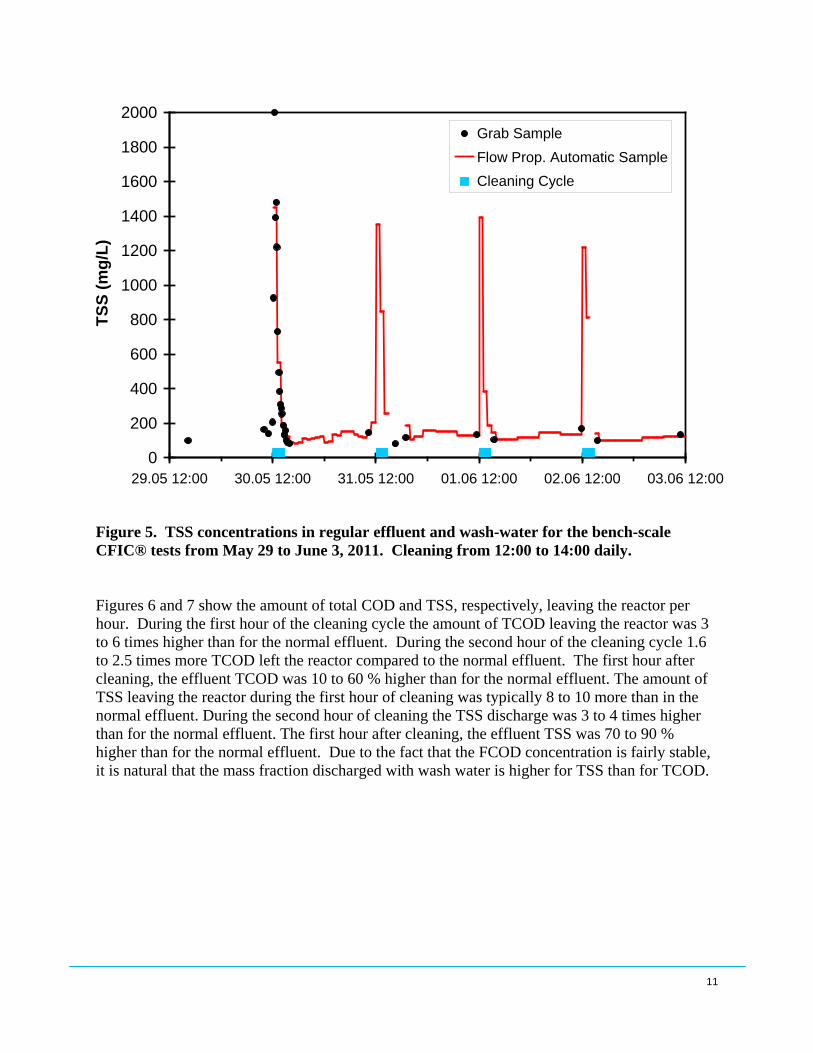
*Biofilm surface area loading rate **Immediately prior to washing ***Immediately after washing Figure 5 shows TSS concentrations in wash-water as well as normal effluent from the CFIC® reactor from May 29 to June 3, 2011. The cleaning cycles are indicated by blue rectangles. Based on 1 h flow proportional samples the peak wash-water concentrations were between 1200 and 1500 mg TSS/L. The highest grab sample showed 2000 mg TSS/L in the wash-water.
11
0
200
400
600
800
1000
1200
1400
1600
1800
2000
29.05 12:00 30.05 12:00 31.05 12:00 01.06 12:00 02.06 12:00 03.06 12:00
TSS
(mg/
L)
Grab SampleFlow Prop. Automatic SampleCleaning Cycle
Figure 5. TSS concentrations in regular effluent and wash-water for the bench-scale CFIC® tests from May 29 to June 3, 2011. Cleaning from 12:00 to 14:00 daily. Figures 6 and 7 show the amount of total COD and TSS, respectively, leaving the reactor per hour. During the first hour of the cleaning cycle the amount of TCOD leaving the reactor was 3 to 6 times higher than for the normal effluent. During the second hour of the cleaning cycle 1.6 to 2.5 times more TCOD left the reactor compared to the normal effluent. The first hour after cleaning, the effluent TCOD was 10 to 60 % higher than for the normal effluent. The amount of TSS leaving the reactor during the first hour of cleaning was typically 8 to 10 more than in the normal effluent. During the second hour of cleaning the TSS discharge was 3 to 4 times higher than for the normal effluent. The first hour after cleaning, the effluent TSS was 70 to 90 % higher than for the normal effluent. Due to the fact that the FCOD concentration is fairly stable, it is natural that the mass fraction discharged with wash water is higher for TSS than for TCOD.

12
0
20
40
60
80
100
120
May 30 May 31 June 1 June 2
Tota
l CO
D o
ut o
f rea
ctor
(g/h
)15:00 (day before) - 12:0012:00-13.0013:00-14:0014:00-15:00
Figure 6. Amount of total COD discharged per hour from the bench-scale CFIC® reactor during normal operation, during the cleaning process (12:00 – 14:00), and during the first hour after cleaning.
0
10
20
30
40
50
60
70
80
May 30 May 31 June 1 June 2
TSS
out o
f rea
ctor
(g/h
)
15:00 (day before) - 12:0012:00-13.0013:00-14:0014:00-15:00
Figure 7. Amount of TSS discharged per hour from the bench-scale CFIC® reactor during normal operation, during the cleaning process (12:00 – 14:00), and during the first hour after cleaning.

13
Based on the results from May 29 to June 3, 2011, the biomass yield was calculated. The total COD, filtered COD, and TSS entering and leaving the reactor was measured for the entire period. The net biomass production was corrected for the difference in biomass attached to the biofilm carriers at the beginning and at the end of the test. The observed biomass yield (YOBS) was 0.54 g TSS/g COD removed. The COD of the biomass was measured to 1.33 g COD/g TSS, which gives an observed biomass yield of 0.72 g CODBIOMASS/g COD removed. This means that of the removed COD, 72 % was removed in the form of biomass and 28 % was removed through respiration to CO2 and water. A high biomass yield is beneficial for an aerobic biological process, since it means that the amount of oxygen needed will be low. This will reduce the air demand and the energy costs for operating the process. The specific oxygen demand (kg O2/kg CODREMOVED = 1 – YOBS) for the test period from May 29 to June 3 was 1 – 0.72 = 0.28 kg O2/kg CODREMOVED. The produced biomass can be anaerobically digested for production of biogas. Instead of spending energy on supplying more oxygen for a process with higher respiration and lower biological sludge production, anaerobic digestion of the additional biomass from the CFIC® process will produce renewable energy. PILOT-SCALE TESTS Materials and Methods The CFIC® biofilm reactor process was tested in parallel with the MBBR in large pilot-scale at the TAU municipal wastewater treatment plant (WWTP) in Tønsberg, Norway. This plant has no primary treatment, so wastewater was pumped to the CFIC® and MBBR reactors after coarse screens and sand traps. The biofilm carrier used for the pilot-scale tests was the Biowater Technology BWTX carrier, with specifications as shown in Table 4. Both the CFIC® reactor and the MBBR reactor used the same carrier. The biofilm carrier fill was 90 % (during normal operation) in the CFIC® reactor, providing 565 m2/m3 of specific biofilm surface area in reactor. The MBBR reactor had 65 % biofilm carrier fill, providing 408 m2/m3 of specific biofilm surface area in the reactor. Table 4. Biofilm carriers used for pilot-scale testing of CFIC® and MBBR processes at the TAU WWTP. Type of biofilm carrier BWTXTM Protected biofilm surface area 628 m2/m3 Length 11 mm Height 15 mm Width 15 mm Number of cells per carrier element 9

14
The bioreactors were steel tanks with air diffusers at the bottom. Sieves at the reactor outlets prevented the biofilm carriers from leaving the reactors. The CFIC® reactor was equipped with a propeller mixer. Key data for the reactors are shown in Table 5. Table 5. Bioreactor data for the pilot-scale testing at the TAU WWTP. CFIC® reactor MBBR reactor Normal wet volume 1.3 m3 1.4 m3 Normal water depth 1.32 m 1.42 m Water depth during cleaning 1.72 m - - - - Type of biofilm carrier BWTXTM BWTXTM Biofilm carrier fill during normal operation 90 % 65 % Biofilm carrier fill during cleaning procedure 69 % - - - - Initially the CFIC® reactor was operated with only aeration during the cleaning cycle, but this did not create enough shear force to remove a sufficient amount of biomass from the biofilm carriers. Therefore, a procedure using the propeller mixer during the cleaning was implemented. The results presented are from a 5-week period when the mixer was used. Cleaning was performed for 1½ to 2 h once every day. Automatic samplers were used for flow proportional samples of the influent, the effluent from the MBBR, and the normal effluent from the CFIC®. Manual grab sampling was used for the wash-water from the CFIC® reactor. Samples were analyzed for total COD, filtered COD, and TSS. Biomass on the biofilm carriers was also measured routinely. Pilot-Scale Results Table 6 and Figure 8 provide average and individual results from the pilot-scale test for a 5-week period with propeller mixing during cleaning of the CFIC® reactor. In spite of higher biofilm surface area loading rates (SALR), and substantially higher volumetric organic loading rates, the CFIC® process had significantly lower effluent FCOD and TSS concentrations than the MBBR process. Table 6. Pilot-scale testing of CFIC® and MBBR. Averages of a 5-week period.
Influent CFIC® reactor or effluent
MBBR reactor or effluent
Total COD, mg/L 552 - - - - - - Filtered COD, mg/L 150 62 78 Total suspended solids, mg/L 342 187 269 Temperature, ºC - - - 14 14 Empty bed hydraulic retention time, h - - - 0.7 1.3 * SALR, g TCOD/m2-d - - - 33 27
Biomass on carriers, g TS/m2 - - - 22 ** 12 *** 13
*Biofilm surface area loading rate **Immediately prior to washing ***Immediately after washing

15
0
5
10
15
20
25
30
35
40
45
50
23.9.
5.10.
14.10
.
15.10
.
19.10
.
20.10
.
26.10
.
SALR
(g T
CO
D/m
2 -d)
0
20
40
60
80
100
120
Efflu
ent F
CO
D (m
g/L)
LOAD CFIC
LOAD MBBR
CFIC effl. FCOD
MBBR effl. FCOD
Figure 8. Biofilm SALR and effluent FCOD for pilot-scale CFIC® and MBBR reactors. During cleaning the water level in the reactor was increased so that the effective filling degree of BWTX biofilm carriers was reduced from 90 % to 69 %. Figure 9 shows an example of TSS in wash-water, together with the normal effluent TSS immediately before this cleaning cycle. On average, 45 % of the biomass attached to the carriers was removed in each cleaning cycle. Also shown in Figure 9 are FCOD concentrations, which averaged 54 mg FCOD/L. This demonstrated that the biological consumption of the organic matter in the incoming wastewater was completely unaffected by the cleaning procedure.

16
0
200
400
600
800
1000
1200
1400
1600
1800
00:00 00:30 01:00 01:30 02:00 02:30
Time (hh:mm)
mg/
LTSS (mg/L)
FCOD (mg/L)
Start cleaning: 00:15End cleaning: 01:45
Figure 5. Example of TSS and FCOD concentrations in wash-water from pilot-scale CFIC® reactor. CONCLUSIONS The new CFIC® biofilm reactor process has been tested in parallel with the well-documented MBBR process. The CFIC® process produced lower effluent FCOD and TSS concentrations than the MBBR process, even at higher biofilm surface area loading rates and significantly higher volumetric loading rates. The cleaning procedure developed for the CFIC® process successfully removed accumulated biomass from the biofilm carriers. However, this required a fairly high shear force in the reactor. Cleaning once a day was sufficient, even at very high organic loads (SALR of 61 g TCOD/m2-d) or with very high influent TSS concentrations (452 mg TSS/L). The CFIC® process easily handled coarse screened wastewater. A mass balance at high organic loads showed a biomass yield of 0.54 g TSS/g COD removed or 0.72 g CODBIOMASS/g COD removed. This gives a low specific oxygen demand of 0.28 kg O2/kg CODREMOVED.

17
More testing is needed to find the optimum biofilm carrier, optimum biofilm carrier fill, optimum aeration system, and optimum DO concentration for the CFIC® process. ACKNOWLEDGEMENTS The authors gratefully acknowledge the support from the Norwegian Research Council in the form of a scholarship to Ms. Pascale Stang. Ms. Ocelie Kjonno and Dr. Gang Xin are acknowledged for their assistance with the bench-scale tests. Ms. Karolina A. Korczyk is acknowledged for her help with the pilot-scale tests. REFERENCES Parker D. S., Rusten B., Wien A. and Siljudalen J. G. (2002) A New Process for Enriching
Nitrifiers in Activated Sludge Through Separate Heterotrophic Wasting from Biofilm Carriers. Water Environ. Res., 74 (1), 68-76.
Ødegaard H., Rusten B. and Siljudalen J. G. (1999) The development of the moving bed biofilm process – From idea to commercial product. EWPCA Journal European Water Management, Vol. 2, No. 3, pp. 36-43.
Rusten B. and Paulsrud B. (2009) Environmental Technology Verification of a Biofilm Process for High Efficiency Nitrogen Removal From Wastewater. Proceedings of WEFTEC 2009.

heaDquarterSBiowater technology aS
rambergvn. 5 | 3115 tonsberg | norway
phone: +47 911 10 600 | email: [email protected]
Biowater uSaBiowater technology uSa LLC
2145 Diamond hill road | Suite 4B | Cumberland, ri 02864
phone: +1 401-305-3622 | email: [email protected]


