8
WHITEPAPER IMPROVING ENERGY AND SUSTAINABILITY WITH CLOUD-BASED SERVICES June 2018
WHITEPAPER
IMPROVING ENERGY AND SUSTAINABILITY WITH CLOUD-BASED SERVICES
June 2018
Energy improvement offers enormous potential for variable cost reduction and improved environmental performance.
These types of improvements can be fast-tracked and amplified via cloud-based collaboration, but there is a risk that outsourced services can lead to a hollowing out of site expertise. Other potential issues include failure to account for the impacts of energy improvement projects on process throughput, yield or reliability. A new generation of collaborative services with first principles engineering models and analytics addresses these issues by simultaneously taking into account both process optimization and energy use reduction to improve plant and human performance.
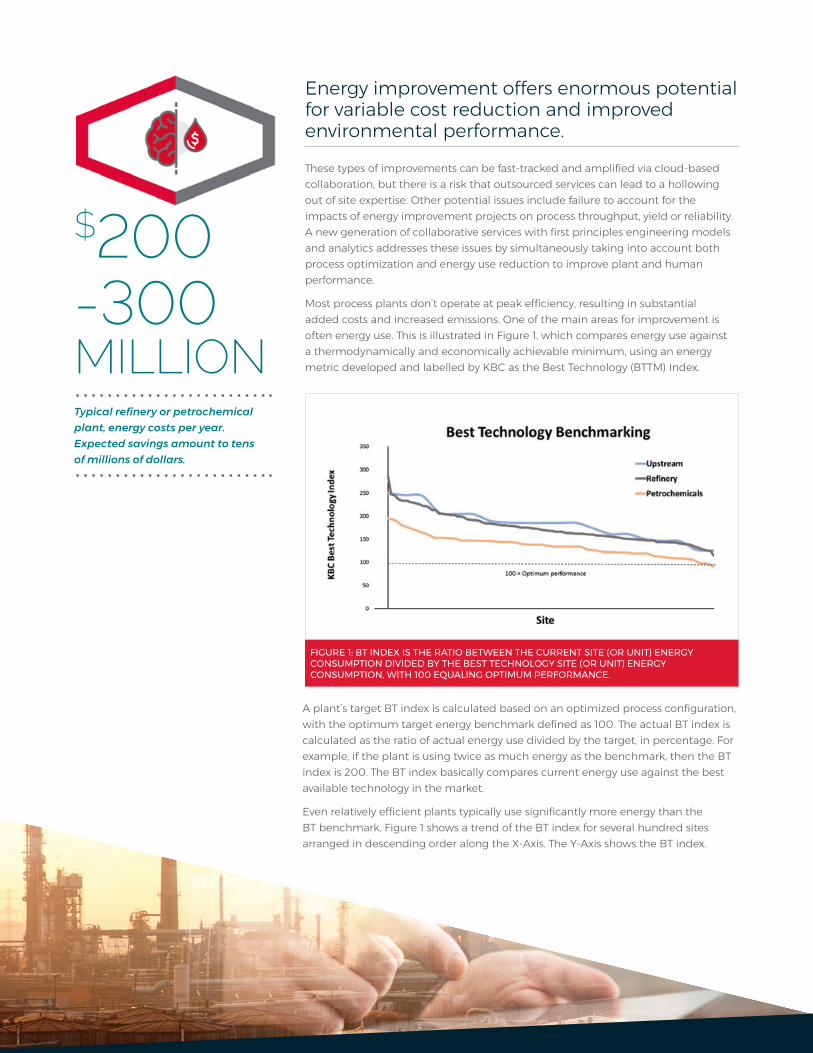
Most process plants don’t operate at peak efficiency, resulting in substantial added costs and increased emissions. One of the main areas for improvement is often energy use. This is illustrated in Figure 1, which compares energy use against a thermodynamically and economically achievable minimum, using an energy metric developed and labelled by KBC as the Best Technology (BTTM) Index.
$200 -300 MILLIONTypical refinery or petrochemical plant, energy costs per year. Expected savings amount to tens of millions of dollars.
FIGURE 1: BT INDEX IS THE RATIO BETWEEN THE CURRENT SITE (OR UNIT) ENERGY CONSUMPTION DIVIDED BY THE BEST TECHNOLOGY SITE (OR UNIT) ENERGY CONSUMPTION, WITH 100 EQUALING OPTIMUM PERFORMANCE.
A plant’s target BT index is calculated based on an optimized process configuration, with the optimum target energy benchmark defined as 100. The actual BT index is calculated as the ratio of actual energy use divided by the target, in percentage. For example, if the plant is using twice as much energy as the benchmark, then the BT index is 200. The BT index basically compares current energy use against the best available technology in the market.
Even relatively efficient plants typically use significantly more energy than the BT benchmark. Figure 1 shows a trend of the BT index for several hundred sites arranged in descending order along the X-Axis. The Y-Axis shows the BT index.

For example, in the refining and upstream industries, even the best performers (right hand end of the scale) have a BT index well above 100. In numerical terms, this represents an opportunity for significant improvements. Typical savings potential with little or no capital expenditures required are:
• Energy savings and CO2 reduction of 3-11%
• Production increase of 1-2%
• Maintenance cost reduction of 1-2%
• Availability increase of 1-2%
These figures can easily be doubled for capital projects.
For a typical refinery or petrochemical plant, energy costs are $200-300 million per year, so expected savings often amount to tens of millions of dollars. Unlike investing in additional capacity or changing product mix, both of which entail risk due to reliance on predictions of market conditions, energy savings always increase profits. In addition, energy systems often constrain processes and throughput, a hidden cost which can be considerable.
For example, process compressors can be limited by a turbine drive’s capacity and efficiency. Steam and condenser operating conditions, or degradation of the turbine, can mean the drive reaches its limit before the compressor does. In another example, unit throughput can be limited by the amount of heat a process furnace is able to deliver. Energy-related bottlenecks often constrain throughput of high-margin processes by 2-3%.
Process plants often struggle to address these and other issues due to a lack of skills or awareness, or simply inadequate bandwidth due to fire-fighting day to day problems. This can prevent improvements from being identified, realized or sustained. Operating companies have typically turned to internal or external consultants to perform studies, which deliver some value but often have a patchy record of long-term sustainment and improvement. But a new generation of cloud-based outsourcing services are gaining prominence for the reasons we outline now.
On-premise vs outsourcing vs collaboration
Cloud-based monitoring services are rapidly gaining acceptance, especially as a means of connecting site data with remotely located experts, providing support where the in-house workforce is limited either in number or skillset..
With a skills shortage being a consistent industry issue, these types of services can offer significant value and productivity gains by globalizing the division of labor. In addition, third-party service providers often have access to powerful analytical and simulation tools which help to analyze and resolve site problems. However, before engaging a service provider, plant owners should ensure that:
• There is no dependency on one particular supplier
• In-house expertise isn’t hollowed out
• Supplier recommendations and expertise are independent in nature, and not just a means to sell a particular product
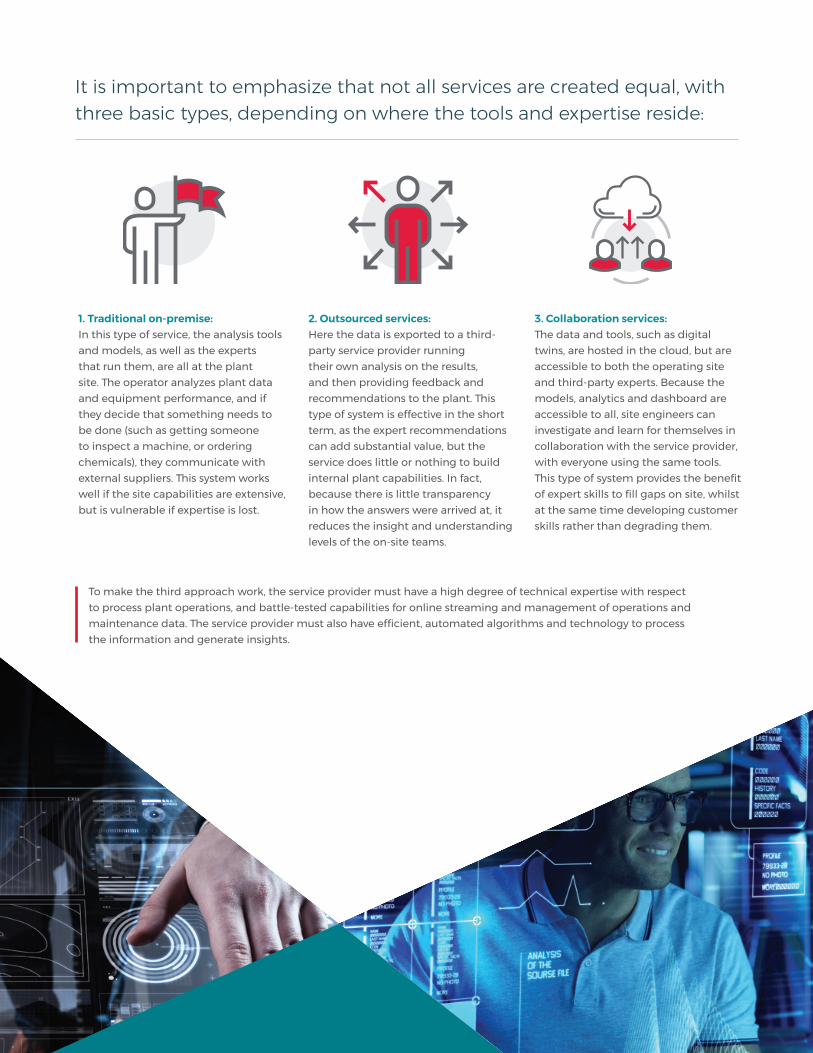
1. Traditional on-premise: In this type of service, the analysis tools and models, as well as the experts that run them, are all at the plant site. The operator analyzes plant data and equipment performance, and if they decide that something needs to be done (such as getting someone to inspect a machine, or ordering chemicals), they communicate with external suppliers. This system works well if the site capabilities are extensive, but is vulnerable if expertise is lost.
2. Outsourced services: Here the data is exported to a third-party service provider running their own analysis on the results, and then providing feedback and recommendations to the plant. This type of system is effective in the short term, as the expert recommendations can add substantial value, but the service does little or nothing to build internal plant capabilities. In fact, because there is little transparency in how the answers were arrived at, it reduces the insight and understanding levels of the on-site teams.
3. Collaboration services: The data and tools, such as digital twins, are hosted in the cloud, but are accessible to both the operating site and third-party experts. Because the models, analytics and dashboard are accessible to all, site engineers can investigate and learn for themselves in collaboration with the service provider, with everyone using the same tools. This type of system provides the benefit of expert skills to fill gaps on site, whilst at the same time developing customer skills rather than degrading them.
It is important to emphasize that not all services are created equal, with three basic types, depending on where the tools and expertise reside:
To make the third approach work, the service provider must have a high degree of technical expertise with respect to process plant operations, and battle-tested capabilities for online streaming and management of operations and maintenance data. The service provider must also have efficient, automated algorithms and technology to process the information and generate insights.
3RD PARTIES: SUPPLIERS AND MANUFACTURERS◆ EQUIPMENT SUPPLIER MONITORING◆ CATALYST VENDORS◆ CHEMICAL SUPPLIERS
PHYSICAL ASSETS
ECONOMICS
SIMULATION AND OPTIMIZATION
SOFTWARE AND ANALYTICS
YOUR PEOPLE
COLLABORATION PORTAL
KBC CO-PILOT
DATA
DATA
QUESTIONS ADVICE & CAPABILITIES
PLANT
INSIGHTS
UPDATE
MODELS
DATA & INSIGHTS
ASSURED
MODELS &
PLANT INSIGHTS
QA
CUSTO
MER
FACILITY
DIGITAL TWIN IN THE CLOUDCO
NN
ECTED EX
PERTS
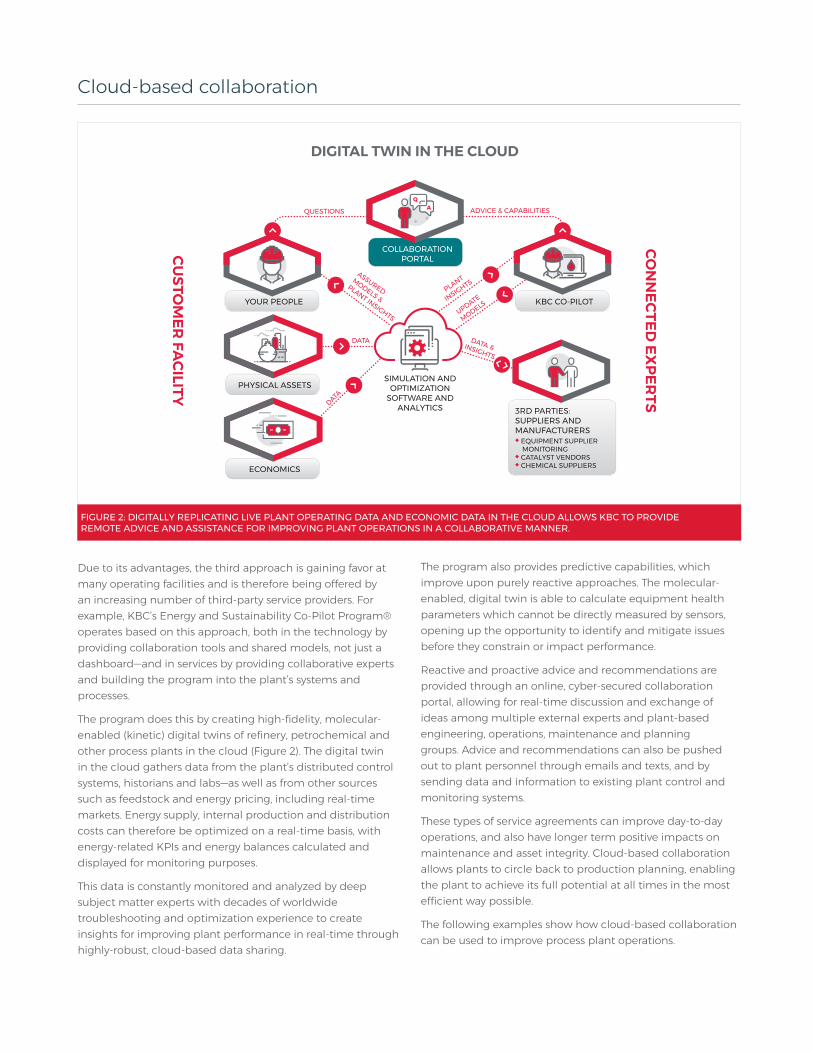
Cloud-based collaboration
FIGURE 2: DIGITALLY REPLICATING LIVE PLANT OPERATING DATA AND ECONOMIC DATA IN THE CLOUD ALLOWS KBC TO PROVIDE REMOTE ADVICE AND ASSISTANCE FOR IMPROVING PLANT OPERATIONS IN A COLLABORATIVE MANNER.
Due to its advantages, the third approach is gaining favor at many operating facilities and is therefore being offered by an increasing number of third-party service providers. For example, KBC’s Energy and Sustainability Co-Pilot Program® operates based on this approach, both in the technology by providing collaboration tools and shared models, not just a dashboard—and in services by providing collaborative experts and building the program into the plant’s systems and processes.
The program does this by creating high-fidelity, molecular-enabled (kinetic) digital twins of refinery, petrochemical and other process plants in the cloud (Figure 2). The digital twin in the cloud gathers data from the plant’s distributed control systems, historians and labs—as well as from other sources such as feedstock and energy pricing, including real-time markets. Energy supply, internal production and distribution costs can therefore be optimized on a real-time basis, with energy-related KPIs and energy balances calculated and displayed for monitoring purposes.
This data is constantly monitored and analyzed by deep subject matter experts with decades of worldwide troubleshooting and optimization experience to create insights for improving plant performance in real-time through highly-robust, cloud-based data sharing.
The program also provides predictive capabilities, which improve upon purely reactive approaches. The molecular-enabled, digital twin is able to calculate equipment health parameters which cannot be directly measured by sensors, opening up the opportunity to identify and mitigate issues before they constrain or impact performance.
Reactive and proactive advice and recommendations are provided through an online, cyber-secured collaboration portal, allowing for real-time discussion and exchange of ideas among multiple external experts and plant-based engineering, operations, maintenance and planning groups. Advice and recommendations can also be pushed out to plant personnel through emails and texts, and by sending data and information to existing plant control and monitoring systems.
These types of service agreements can improve day-to-day operations, and also have longer term positive impacts on maintenance and asset integrity. Cloud-based collaboration allows plants to circle back to production planning, enabling the plant to achieve its full potential at all times in the most efficient way possible.
The following examples show how cloud-based collaboration can be used to improve process plant operations.
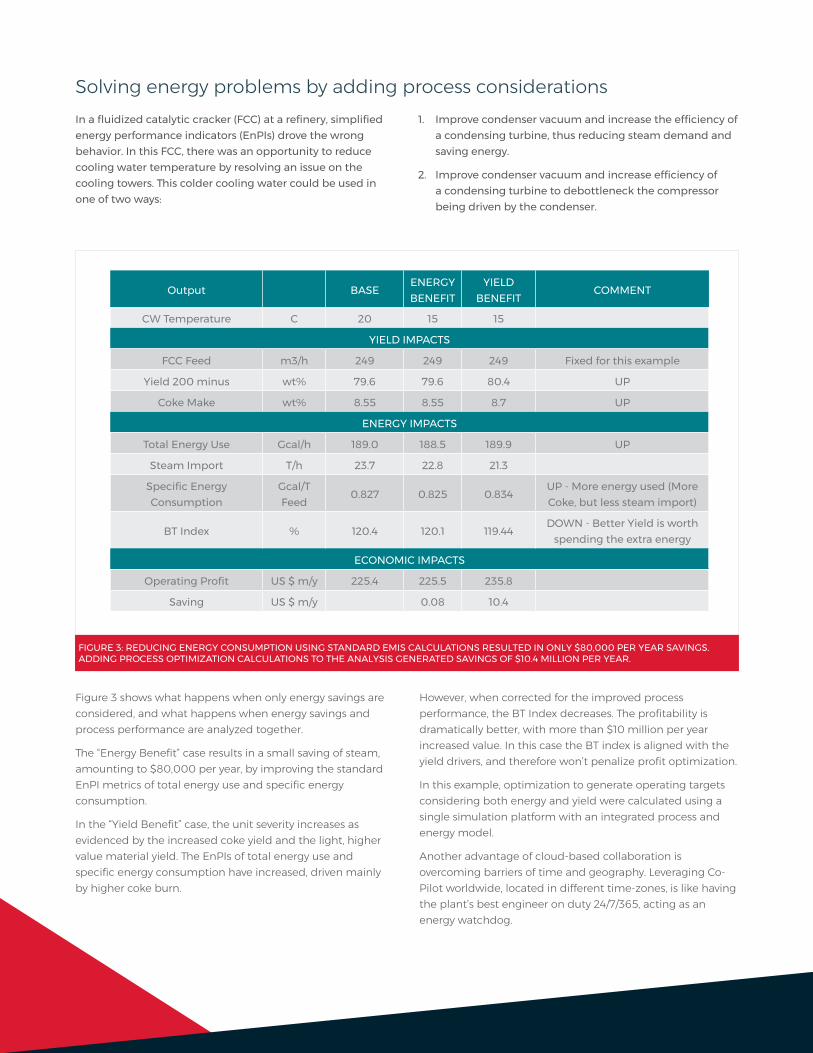
Solving energy problems by adding process considerationsIn a fluidized catalytic cracker (FCC) at a refinery, simplified energy performance indicators (EnPIs) drove the wrong behavior. In this FCC, there was an opportunity to reduce cooling water temperature by resolving an issue on the cooling towers. This colder cooling water could be used in one of two ways:
1. Improve condenser vacuum and increase the efficiency of a condensing turbine, thus reducing steam demand and saving energy.
2. Improve condenser vacuum and increase efficiency of a condensing turbine to debottleneck the compressor being driven by the condenser.
Figure 3 shows what happens when only energy savings are considered, and what happens when energy savings and process performance are analyzed together.
The “Energy Benefit” case results in a small saving of steam, amounting to $80,000 per year, by improving the standard EnPI metrics of total energy use and specific energy consumption.
In the “Yield Benefit” case, the unit severity increases as evidenced by the increased coke yield and the light, higher value material yield. The EnPIs of total energy use and specific energy consumption have increased, driven mainly by higher coke burn.
FIGURE 3: REDUCING ENERGY CONSUMPTION USING STANDARD EMIS CALCULATIONS RESULTED IN ONLY $80,000 PER YEAR SAVINGS. ADDING PROCESS OPTIMIZATION CALCULATIONS TO THE ANALYSIS GENERATED SAVINGS OF $10.4 MILLION PER YEAR.
However, when corrected for the improved process performance, the BT Index decreases. The profitability is dramatically better, with more than $10 million per year increased value. In this case the BT index is aligned with the yield drivers, and therefore won’t penalize profit optimization.
In this example, optimization to generate operating targets considering both energy and yield were calculated using a single simulation platform with an integrated process and energy model.
Another advantage of cloud-based collaboration is overcoming barriers of time and geography. Leveraging Co-Pilot worldwide, located in different time-zones, is like having the plant’s best engineer on duty 24/7/365, acting as an energy watchdog.
Output BASEENERGY BENEFIT
YIELD BENEFIT
COMMENT
CW Temperature C 20 15 15
YIELD IMPACTS
FCC Feed m3/h 249 249 249 Fixed for this example
Yield 200 minus wt% 79.6 79.6 80.4 UP
Coke Make wt% 8.55 8.55 8.7 UP
ENERGY IMPACTS
Total Energy Use Gcal/h 189.0 188.5 189.9 UP
Steam Import T/h 23.7 22.8 21.3
Specific Energy Consumption
Gcal/T Feed
0.827 0.825 0.834UP - More energy used (More Coke, but less steam import)
BT Index % 120.4 120.1 119.44DOWN - Better Yield is worth
spending the extra energy
ECONOMIC IMPACTS
Operating Profit US $ m/y 225.4 225.5 235.8
Saving US $ m/y 0.08 10.4
The case for comprehensive energy management
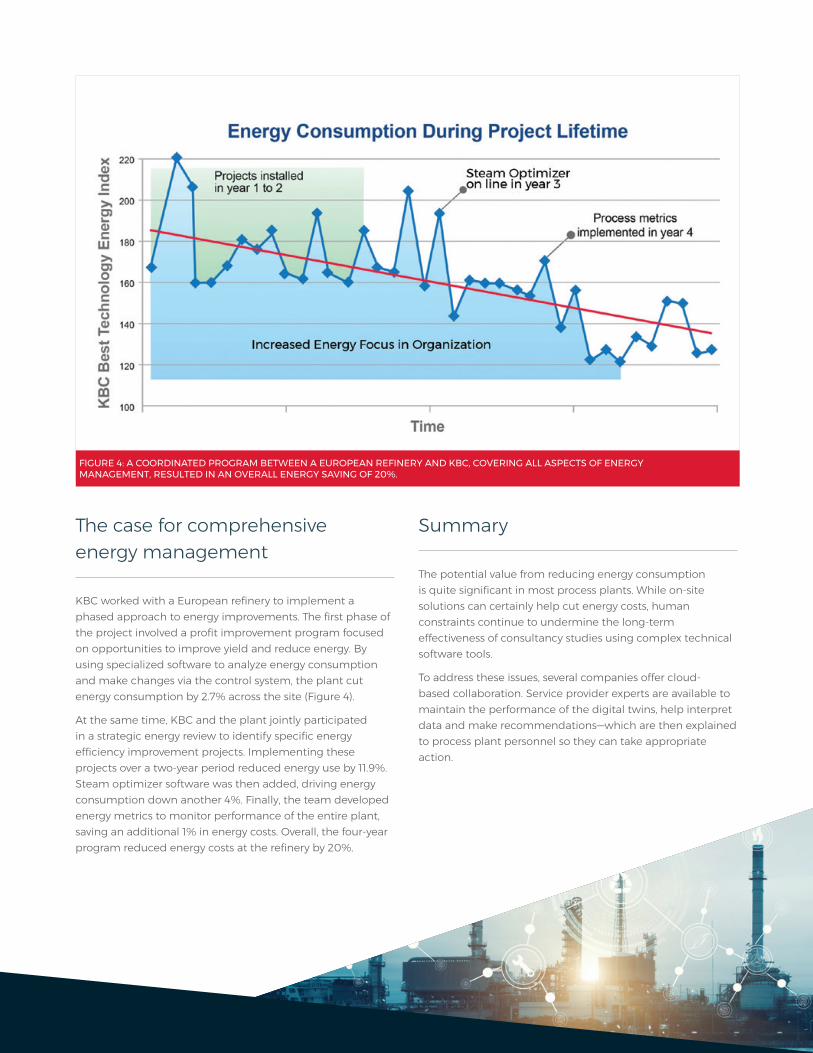
KBC worked with a European refinery to implement a phased approach to energy improvements. The first phase of the project involved a profit improvement program focused on opportunities to improve yield and reduce energy. By using specialized software to analyze energy consumption and make changes via the control system, the plant cut energy consumption by 2.7% across the site (Figure 4).
At the same time, KBC and the plant jointly participated in a strategic energy review to identify specific energy efficiency improvement projects. Implementing these projects over a two-year period reduced energy use by 11.9%. Steam optimizer software was then added, driving energy consumption down another 4%. Finally, the team developed energy metrics to monitor performance of the entire plant, saving an additional 1% in energy costs. Overall, the four-year program reduced energy costs at the refinery by 20%.
FIGURE 4: A COORDINATED PROGRAM BETWEEN A EUROPEAN REFINERY AND KBC, COVERING ALL ASPECTS OF ENERGY MANAGEMENT, RESULTED IN AN OVERALL ENERGY SAVING OF 20%.
Summary
The potential value from reducing energy consumption is quite significant in most process plants. While on-site solutions can certainly help cut energy costs, human constraints continue to undermine the long-term effectiveness of consultancy studies using complex technical software tools.
To address these issues, several companies offer cloud-based collaboration. Service provider experts are available to maintain the performance of the digital twins, help interpret data and make recommendations—which are then explained to process plant personnel so they can take appropriate action.

KB
C-W
P-005US
AMERICAS 15021 Katy FreewaySuite 600Houston, TX 77094USA
T: +1 281 293 8200 E: [email protected]
xli
EUROPE 42-50 Hersham RoadWalton on ThamesSurrey KT12 1RZUK
T: +44 (0) 1932 242 424
ASIA PACIFIC 8 Temasek Boulevard #08-02Suntec Tower ThreeSingapore 038988
T: +65 6735 5488
MIDDLE EAST Level 17, The Offices World Trade Center, Central Market, Al Markaziya P.O. Box 3876Abu Dhabi, United Arab Emirates
T: +971 2 508 7300


