45
ESAN 2016 Meeting of the WHO Action Network on Salt Reduction in the Population in the European Region (ESAN) MEETING REPORT 20-21 April 2016 Lisbon, Portugal Edited by: Karen McColl

ESAN 2016
Meeting of the WHO Action Network on Salt Reduction in
the Population in the European Region (ESAN)
MEETING REPORT
20-21 April 2016 Lisbon, Portugal
Edited by: Karen McColl

ABSTRACT
WHO has identified cutting salt intakes as a priority for preventing non-communicable diseases and, globally, countries have already committed to cut salt intakes by 30% between 2010 and 2025. Although
countries have been taking policy action, however, it is clear that progress is uneven and insufficient—no
European country is currently on track to meet that global target. The WHO Action Network on Salt Reduction in the Population in the European Region was established in
2007 as a response to the increasing salt consumption of the population. The network—which now consists
of 29 WHO European Region Member States—met in Lisbon, Portugal on 20-21 April 2016. The meeting
heard about the latest progress on salt reduction from selected countries and explored various methods of measuring and monitoring salt levels in food and salt intakes. Participants learned about state of the art
science—including the latest evidence on salt and health outcomes—and the latest technological
developments to facilitate further reductions in the levels of salts in foods. The meeting also heard clear
evidence that salt reduction strategies can and do work. The growing evidence base on successful salt
reduction strategies provides a wealth of information for policymakers to learn from others’ experience and to identify the most effective approaches to reduce salt intakes and improve population health.
Keywords
SODIUM CHLORIDE, DIETARY – ADVERSE EFFECTS SODIUM CHLORIDE, DIETARY – ADMINISTRATION AND DOSAGE
NUTRITION POLICY HEALTH PROMOTION
EUROPE
© World Health Organization 2016 All rights reserved. This information material is intended for a limited audience only. It may not be reviewed, abstracted, quoted, reproduced, transmitted, distributed, translated or adapted, in part or in whole, in any form or by any means.

CONTENTS
Page
BACKGROUND AND INTRODUCTION ................................................................................... 1
Background and aim of the network ............................................................................ 1
Organisation of the network ........................................................................................ 1
INTRODUCTORY SESSION .................................................................................................. 2
Opening addresses ..................................................................................................... 2
SESSION 1: UPDATE ON SALT REDUCTION STRATEGIES WITHIN THE WHO EUROPEAN UNION2
NCDs in the WHO European Region — Focus on salt ..................................................... 2
The SHAKE Package for Salt Reduction ........................................................................ 3
Country updates ........................................................................................................ 6
Insight into developing salt strategies ........................................................................ 13
How to develop sustainable national salt reduction strategies ...................................... 14
SESSION 2: MEASURING AND MONITORING SALT INTAKE .................................................. 18
Examples of across-country databases for salt (and other public health relevant nutrients) ................................................................................................................ 18
Methods to measure salt intake at individual level ....................................................... 22
SESSION 3: RESEARCH PROJECTS / SCIENTIFIC UPDATES.................................................. 24
State-of-the-art salt and health outcomes .................................................................. 24
Update on link between salt, soft drinks and obesity ................................................... 26
Iodine in Portugal .................................................................................................... 28
How healthy are specialty salts really? ....................................................................... 29
Salt, saturated fat and sugars in selected foods from several European countries .......... 30
SESSION 4: REFORMULATION—TECHNOLOGICAL FEASIBILITY AND CONSUMER
ACCEPTABILITY ............................................................................................................... 34
Sodium reduction while maintaining sensory quality .................................................... 34
Evidence on consumer acceptability from the systematic literature review and meta-analysis .............................................................................................................................. 35
CONCLUSIONS AND NEXT STEPS ...................................................................................... 38

ESAN April 2016 Meeting Report
Page 1
BACKGROUND AND INTRODUCTION
Background and aim of the network
The WHO Action Network on Salt Reduction in the Population in the European Region (hereafter referred to as ESAN or ‘the network’) was established in 2007 under the auspices of the WHO and with the support of the United Kingdom Food Standards Agency (FSA). Since May 2013 Switzerland has chaired ESAN. The network was established as a response to the increasing salt consumption of the population, in line with WHO Europe’s designation of salt reduction as a priority intervention for the reduction of noncommunicable diseases (NCDs) in the European population1. The network aims to:
a) promote the identification and sharing of national policies on salt reduction and the types of action undertaken; b) describe monitoring and evaluation strategies of salt reduction initiatives; c) discuss the public health and cost benefits of salt reduction strategies in different countries; d) develop good practice in the area of policy development, implementation, monitoring and evaluation; e) promote the development of science and food technology in the relevant areas; f) explore the links between salt reduction policies and inequalities.
Organisation of the network
Since May 2013, the Federal Food Safety and Veterinary Office of Switzerland has chaired the network. As of April 2016, the network consists of 29 of the WHO European Region Member States. Participants include governmental institutions (or those nominated by government) and representatives of WHO and WHO collaborating centres. The network usually meets once a year, at a meeting organized by the ESAN leading country, in close collaboration with the WHO Regional Office for Europe. The network meeting is an important arena for sharing and discussing experiences in salt reduction strategies. The 2016 network meeting was held in Lisbon, Portugal on 20-21 April 2016. The Portuguese Directorate-General of Health (DGS in its Portuguese acronym) hosted the meeting. Representatives from 16 countries (Austria, Belgium, Bulgaria, Croatia, Finland, Greece, Ireland, Italy, Latvia, Netherlands, Norway, Portugal, Republic of Uzbekistan, Slovenia, Sweden and Switzerland), the WHO, the European Commission, the WHO collaborating centres RIVM and University of Warwick, and invited external speakers attended the meeting.
1 WHO Regional Office for Europe (2012). Action Plan for the implementation of the European Strategy on the
Prevention and Control of Noncommunicable Diseases (2012-2016) [Brochure]. Access http://www.euro.who.int/__data/assets/pdf_file/0019/170155/e96638.pdf
ESAN April 2016 Meeting Report
Page 2
INTRODUCTORY SESSION
Opening addresses
On behalf of the WHO Regional Office for Europe, João Breda warmly welcomed all participants to the meeting. The record number of participants attending the meeting reflects the healthy state of the network, the importance of the topic under discussion and the willingness of Member States to share knowledge and experience. This network serves as an example for other areas of work, where collaboration across the Region could help policymakers to make progress. On behalf of the DGS, Andreia Silva welcomed participants to Lisbon, conveyed the high level of interest in this work within the DGS and wished all participants a successful meeting. Fernando Almeida from the Dr Ricardo Jorge National Institute for Health in Portugal added a warm welcome to all participants. Given its experience on data collection on salt and iodine, the Institute, a WHO Collaborating Centre, is very interested in the discussions. Finally, Michael Beer, Federal Food Safety and Veterinary Office, Switzerland, added his words of welcome and introduction, as chair of the network. He reminded participants of the real challenges that remain for salt reduction and underlined the importance of the network as a forum for exchange. In particular, the network provides an opportunity to hear about which measures have worked and which have been less successful. He encouraged all participants to contribute to the discussions.
SESSION 1: UPDATE ON SALT REDUCTION STRATEGIES WITHIN THE WHO EUROPEAN UNION
The first session focused on bringing participants up to date on developments in salt reduction in
WHO—at both the global and European levels—and included some examples of national
developments, as well as insights from some experts in the field.
NCDs in the WHO European Region — Focus on salt
João Breda gave an overview of the situation in the European Region—in relation to NCD
prevention and, specifically, salt reduction—and highlighted some additional issues for possible
further discussion. For all countries in the European Region dietary risks are either the leading, or second, cause of death and disease. Portugal is a fitting setting for the meeting because high blood pressure was the biggest risk factor for death and disability in the country in 2013, and high salt intakes are a major contributor to high blood pressure. Globally, countries have already committed to cut salt intakes by 30% between 2010 and 2025, but much more action is needed to meet that target. On the basis of the latest data, no European country is on track to meet the global targets for salt or obesity. Although countries have been taking policy action, it is clear that progress is uneven and insufficient. All Member States, for example, have at least partially implemented reformulation measures to reduce sugar and/or salt levels. A different mix of tools and methods, however, may be needed for reformulation to progress as it should, and to bring about real reductions in the burden of disease.
ESAN April 2016 Meeting Report
Page 3
In line with its clear mandate—established through statements such as the Vienna Declaration on
Nutrition and Noncommunicable Diseases in the Context of Health 2020—the WHO Regional
Office for Europe has established a strong framework for action on nutrition. The European Food
and Nutrition Action Plan 2015 – 2020 and the Physical Activity Strategy for the WHO European
Region 2016-2025 establish priority areas and set out practical suggestions for action. One of the five priority areas of the Food and Nutrition Action Plan is the healthy food and drink environment, and this is an area where more progress is needed on salt. High quality information on food composition and diets is an important element. The Regional Office is currently working on a project in eight countries in Central Asia and the Caucasus to identify and analyse common foods in markets and marketing practices and on another project on the availability of commercially produced baby food products in the market place. There are a number of important opportunities to facilitate action at this time. The EU is now establishing a framework for salt reduction, following the Netherlands EU Presidency initiative
and the EU Roadmap for Action on Food Product Improvement. There are useful tools—such as
nutrient profiling models—which could help facilitate progress. There are also examples of good
practice, including in some of the Region’s less affluent countries that provide inspiration—
Uzbekistan, for example, has recently measured average salt intakes using the 24-hour urine excretion methodology. Challenges do, of course, remain. It is now time to mainstream reformulation and persistent inequalities in salt intakes are still a problem that needs to be tackled.
The SHAKE Package for Salt Reduction
Stephen Whiting, WHO Headquarters, gave an overview of the SHAKE package, a new tool to help Member States implement comprehensive salt reduction strategies, with a view to helping them meet the global salt target. This toolkit has been developed over the past two years by WHO headquarters in collaboration with the George Institute and relevant global experts.
The package—informed by evidence of successful national strategies, policies and interventions—
comprises an advocacy flyer, a technical package that lists key policies and interventions, and a toolkit to help implement such interventions.

ESAN April 2016 Meeting Report
Page 4
The SHAKE acronym sets out key elements and the associated policies and interventions (Figure 1).
Figure 1 The SHAKE technical package of policies and interventions for salt reduction
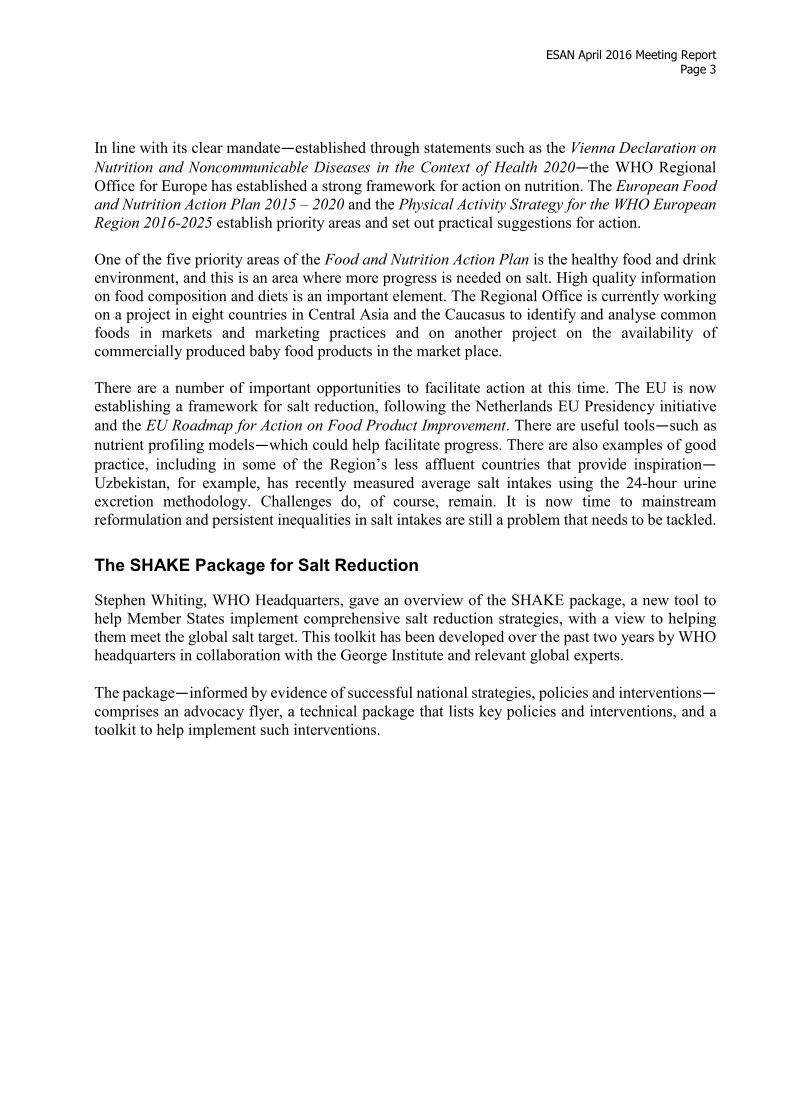
For the various intervention areas, the package sets out the specific objectives, outlines the necessary steps and contains resources to help with the implementation.
Table 1 The SHAKE Package—Example resources to help implementation
POLICY AREA / INTERVENTION(S) TOOLS AND RESOURCES PROVIDED IN
THE PACKAGE TO HELP
IMPLEMENTATION SURVEILLANCE
o Measure and monitor population salt consumption patterns
o Measure and monitor the sodium content of food o Monitor and evaluate the impact of the salt
reduction programme
• Population survey design
• 24 hr/spot urine collection protocol
• Shop survey data collection
• Program monitoring plan with indicators
HARNESS INDUSTRY
Set target levels for the amount of salt in and implement strategies to promote reformulation
• Tips for engaging food industry • Guidance for setting targets
• Example targets from the UK, Argentina and regional targets from the EU and the Americas
ESAN April 2016 Meeting Report
Page 5
POLICY AREA / INTERVENTION(S) • TOOLS AND RESOURCES PROVIDED
IN THE PACKAGE TO HELP
IMPLEMENTATION
ADOPT STANDARDS FOR LABELLING AND
MARKETING
o Adopt interpretative front-of-pack nutrient labelling systems
o Implement strategies to combat the misleading marketing of foods that are high in salt
• Recommended guiding principles for labelling schemes
• Overview of different types of FOP labelling
• Alternative labelling methods
• Case studies
KNOWLEDGE o Implement integrated education and
communication strategies to raise awareness about the health risks and dietary sources of salt and ultimately change behaviour.
• Guidance to develop consumer awareness campaign
• Sample leaflets and media releases
• Key messages for salt advocates
• Framework for evaluation of communication campaigns
ENVIRONMENT
o Implement multicomponent salt reduction strategies in community settings including schools, workplaces and hospitals.
• Guidance on integrating salt reduction initiatives into community settings
• Sample salt criterion for schools and workplaces
• A brief salt reduction counselling tool for primary care settings
STRATEGY DEVELOPMENT • Guidance on integrating salt reduction initiatives into community settings
• Sample salt criterion for schools and workplaces • A brief salt reduction counselling tool for primary
care settings
The package2 is now ready for use and a soft launch is planned, alongside launch of the CVD management package. The next steps will be to print and disseminate the package and discussions are ongoing with development partners about potential funding to support countries in putting the package into practice. The toolkit will be published online and will also be modified for use as a training manual. Discussion
There was clarification that the toolkit includes the messages from the outcome of the WHO Technical Meeting on measuring salt intakes. The gold standard remains 24-hour urine collection when feasible. The example of Uzbekistan is important, if 24-hour urine collection can be achieved in this context it can clearly be done in other countries. WHO Europe continues to advise Member States to use the 24-hour urine collection methodology if possible. The reference to misleading marketing and claims mainly relates specifically to salt content. There is, however, also a link to the WHO Set of recommendations on marketing of food and non-
alcoholic beverages to children.
2 WHO (2016) SHAKE the salt habit - Technical package for salt reduction [Brochure]. Access http://www.who.int/dietphysicalactivity/reducingsalt/en/index1.html

ESAN April 2016 Meeting Report
Page 6
Country updates
Some of the network member countries gave an update on their recent activities.
Portugal
Pedro Graça, DGS, Portugal, gave an update on salt reduction strategies in the country. In response to the very high burden of disease, particularly cerebrovascular disease, associated with salt in Portugal, five strategic objectives for salt reduction have been established:
SO1 - Implement a system for assessing population-wide salt intake while monitoring the supply of salt in the main food groups supplying salt to the Portuguese;
SO2 - Promote awareness and empower consumers towards a reduced salt intake;
SO3 - Promote the best way to provide labelling that is able to highlight the salt content of foods and identify low-salt products;
SO4 - Modify availability, particularly through the participation of the industry and the food chain in reformulating and supplying food products with lower salt content;
SO5 ‐ Monitor and assess the industry's involvement in the reformulation and supply of food products and also of the consumers' awareness, attitudes and behaviour.
The first three have previously been reported on to ESAN, but there has been progress on the fourth and fifth objectives since the last meeting. A strategy for reducing the salt intake in the Portuguese population by modifying the availability of the offer was adopted in 20153. In late 2015, the associations of food producers and restaurants were invited to discussions on an agreement to reduce the salt levels, firstly in soup and then in some other products. Agreement was reached in 2016 and several institutions are involved in monitoring salt levels in products until the end of the year. Agreement was also reached with some of the major food players in the country to do their own
evaluation of salt levels and to share results with the DGS. One such player—Portugal Foods, a
cluster of 125 companies—has created a platform for the analysis and mapping of food
composition data. This Food and Nutrition Observatory enables a better understanding of the composition of food on offer to consumers, with a particular focus on Portugal Foods’ members. In this way it is hoped that DGS will be able to monitor changes in salt levels (and will be able to share the data with ESAN next year), as well as other ingredients/nutrients, and identify areas where further support is needed. Carla Gonçalves, University of Porto, described some work on innovative approaches to monitoring salt content. Traditional methods for measuring salt levels are time consuming, not portable and they require several steps for sample preparation. A consortium of researchers has developed user-friendly portable equipment to provide fast and reliable results on the salt content of foods. The characteristics and method of use for the equipment were described. It is designed to be used in kitchens and results are available within six minutes.
3 Law no 8272/2015 of 29 July.
ESAN April 2016 Meeting Report
Page 7
The next steps in the development process will be to make some improvements and then to produce 20 units of the industrial prototypes for testing in other settings, such as schools and hospitals. Future steps will include identifying a business partner to produce the equipment on a commercial basis. Discussion
There was tremendous interest in the new equipment from ESAN members and there was clarification that the equipment is still a prototype, so not yet available for Member States’ use. In the longer term, the idea is to make something so portable and easy to use that consumers can use it in restaurants. To measure levels in solid food it is necessary to first process the food using a blender, in future versions a blender may be incorporated. In response to questions, there was clarification that the funding was mainly provided by the DGS and the University’s own resources. It was also clarified that, unlike some other methods, the equipment measures sodium from all sources, not just salt. It was pointed out that Portugal had been the first country in the world to regulate salt targets, when it introduced targets for bread. This provided a very good example for other countries, and, of course, this approach could be extended to other products at some point in the future. There was some discussion of the compatibility of traffic lights labelling with the EU Food Information Regulation, in light of the EU investigation into the UK’s traffic light scheme. WHO had organized a meeting in Lisbon in December 2015 to discuss this issue and hopes to publish the outcome in coming months. The discussions pointed to the clear evidence for an impact of front-of-pack interpretative labelling on consumers’ awareness and preferences, and the case for considering these as proxies for a health outcome.
Ireland
Karl McDonald, Food Safety Authority of Ireland, presented a new review by the Authority’s Scientific Committee to update its report Salt and Health: Review of the scientific evidence and
recommendations for public policy, published in 2005. Two issues related to salt reduction, and which have recently arisen in the research/scientific literature, were addressed:
• Use of potassium-based salt replacement ingredients;
• Influence of low salt diets on the occurrence of cardiovascular disease. Potassium-based salt replacements
In 2005, the Committee advised against the use of potassium-based salt replacement ingredients, because the preferred approach has been to encourage an overall reduction in salt and saltiness. The industry has asked for further guidance on this issue, particularly with respect to some foods where salt is more challenging to reduce, e.g., processed meats.

ESAN April 2016 Meeting Report
Page 8
The 2015 review concluded that:
1. Potassium-based salt replacement ingredients should only be used by the food industry where reduction of sodium could be detrimental to food safety and/or the physical or organoleptic properties of foods.
2. Potassium-based salt replacement ingredients should not be used for the sole purpose of flavour maintenance i.e. saltiness or flavour enhancement. There continues to be a requirement for the food industry to work on reducing the salt taste thresholds of the Irish population.
3. The use of potassium-based salt replacement ingredients by the food industry could also help supplement intakes of potassium by the Irish population which are lower than WHO recommendations.
4. However, there is also scope for increased intake of potassium in the Irish diet through consumption of unprocessed or unrefined fruits, vegetables and nuts.
The Food Safety Authority Ireland will, therefore, issue guidelines to the food industry on the use of potassium and other mineral-based salt replacement ingredients, taking into account the following:
• Possible effects of these ingredients to vulnerable groups (e.g., renal patients with an aversion to high potassium diets)
• The types of replacement ingredients required by the food industry
• The types of foods in which they could be used and at what levels
• The likely reductions in salt levels in these foods
• The impact on actual sodium reduction in foods
• The impact on potassium intakes in the population. These guidelines to the industry will be made available to all vulnerable groups through, for example, health professionals and health department advice. In addition the Authority will continue to monitor the sodium and potassium content of food and may periodically re-evaluate intakes. Data suggest an increase of around 25% on potassium levels in bread between 2013 and 2015, and the reasons for this increase are not yet clear. Low sodium intakes and health
In recent years there has been considerable attention in the scientific literature on the interpretation of cohort analyses used to study the relationship between sodium intake and CVD. The literature has included systematic literature reviews, meta-analyses and analyses of individual studies and has questioned the public health benefits of interventions to decrease sodium intake in the diet. In some cases it has pointed towards the increased benefits of focusing instead on weight loss and excessive alcohol consumption as a means of reducing hypertension in the population. The attention on this literature has been undermining the salt message. Having reviewed the new literature over a one-year period, the Scientific Committee issued a strong conclusion. Namely, that the available evidence indicates that salt intakes in the Irish population are still too high and need to be reduced in order to reduce blood pressure and the risk of cardiovascular disease. It also issued a robust recommendation that guidance on intakes of sodium should be based on the evidence which links high sodium intake to blood pressure and cardiovascular disease and the current public health policy in Ireland to reduce sodium intake in the Irish population should continue. Ireland is continuing, therefore, to move forward on

ESAN April 2016 Meeting Report
Page 9
reformulation work in relation to salt, sugar and fat. The Scientific Committee’s review has been added as a new appendix to the revised report4. Discussion
Professor Francesco Cappuccio is publishing a report on the impact of potassium, and issues around potassium supplementation safety, in the near future. This is a worthwhile area to explore further. One important issue is to improve the sodium to potassium ratio, which is the predictor of mortality. In relation to potassium supplements, it is important to emphasise the need for vulnerable patients, principally renal patients, to consult their doctors before taking any supplements.
Greece
George Marakis, Hellenic Food Authority, gave an update on salt reduction actions from Greece. There are four pillars to the Salt reduction strategy 2016-2020, which was endorsed by the Management Board of the Hellenic Food Authority in March 2016:
• Data collection (salt intake and major dietary sources, knowledge and attitude of adults and teenagers)
• Raising awareness: public (adults & teenagers) and health professionals • Reducing salt content of foods and meals • Monitoring and evaluation.
As reported to the ESAN meeting in 2015, bread was taken as the starting point for the salt reduction strategy, with a focus on craft bread (for which estimated contributions range from 0.23g to 3.95 g of salt daily). A protocol of commitment between the Hellenic Food Authority and the Hellenic Federation of Bakers, signed in March 2016, sets out agreed voluntary limits for salt in all types of bread, with a view to involving all bakeries by the end of 2017. Participating bakeries that reduce salt in all types of bread are allowed to display the ‘Less Salt – Better Health’ logo in their shops. The particular challenges associated with reducing salt in bread include the difficulty of reaching more than 7,000 small-size bakeries and of persuading all of them to modify long-standing recipes. It is also difficult to monitor salt levels amidst this proliferation of products. Finally, bread from
neighbouring countries—with potentially different salt concentrations—also enters the market.
In relation to the catering sector the Hellenic Chefs Club has agreed that all its members will reduce salt in meals by 30%. A leaflet on replacing salt in food with herbs has been well received by professionals and the public. Participation in the Gastronomy Forum and television cooking programmes has been another opportunity for presenting facts about salt and cooking without salt. Further work to raise awareness, and to combat negative messages and address confusion about speciality salts, is needed. Future work in the pipeline includes an agreement on joint work with the Hellenic Dietetic Association and, once major sources of salt in the diet have been identified, the setting of benchmarks and agreements with other sectors.
4 Food Safety Authority of Ireland (FSAI) (2016). Salt and health: review of the scientific evidence and
recommendations for public policy in Ireland (Revision 1). Access http://www.lenus.ie/hse/handle/10147/609526

ESAN April 2016 Meeting Report
Page 10
Discussion
Recently, some research has been conducted on salt intakes in the north of Greece and this will be published in the near future. There was discussion of the negative messages conveyed by television cooking programmes, where chefs are very liberal with salt. Research continually shows, however, the high proportion
of dietary salt contributed by meals eaten outside the home—emphasising the importance of
continuing to work with chefs.
Slovenia
Mojca Gabrijelčič Blenkuš, National Institute of Public Health, gave a brief update on salt reduction in Slovenia, where salt reduction has now been incorporated into broader reformulation work. The national Action plan and the National strategy on nutrition and physical activity were adopted in July 2015, and reformulation is an important part of the strategy. Following on from the issues highlighted under the Dutch presidency, there is a focus on reformulation to reduce sugar levels. The work is being taken forward by a Reformulation Working Group on sugars, trans fats and salt and through the mobilisation of different stakeholders. National food producers adopted the first pledge on salt reduction for Slovenia, and a new pledge covering other nutrients is under negotiation. However, the pledge does not contain any concrete goals and the industry focus appears to be on new product development rather than reformulation. It remains a challenge for public health to channel and guide industry efforts in the right direction. Awareness-raising activities are also ongoing, along with education of nurses on salt. The latter is particularly important given the major health reforms underway, that will place higher emphasis on health promotion and prevention.
Italy
Pasquale Strazzullo5, Coordinator, Interdisciplinary Working Group for Reduction of Salt Intake in Italy, presented an update on Italian initiatives on salt reduction. Reduction of salt intake is included as a main objective of the government's intersectoral NCD prevention strategy Gaining health: Making healthy choices easier. In order to estimate population salt intakes, the MINISAL programme estimated average 24-hour sodium and potassium excretion in 20 Italian regions. Men excreted on average 183 mmol of sodium per day, equivalent to 10.6 g of salt, while for women the figures were 142 mmol (8.2 g of salt). There is a clear socioeconomic gradient in habitual sodium intake in Italy. When socioeconomic status, occupation and educational level are taken into account, the apparent geographical differences across the country disappear6. Salt intakes in hypertensive patients are only slightly lower than for the general population, and intakes are already very high in children
5 Professor Strazzullo acknowledged the contribution of Dr Daniele Galeone to the presentation 6 Cappuccio FP, Ji C, Donfrancesco C, Palmieri L, Ippolito R, Vanuzzo D,… Strazzullo P. Geographic and
socioeconomic variation of sodium and potassium intake in Italy: results from the MINISAL-GIRCSI programme. BMJ Open, 2015;5:e007467. doi:10.1136/bmjopen-2014-007467
ESAN April 2016 Meeting Report
Page 11
and adolescents. Only 5% of adult men and 15% of women meet the WHO recommendation, while the figures for children/adolescents are 12% for males and 13% for females. In order to reduce salt in (processed) foods a number of agreements have been reached with industry sectors. A voluntary agreement with the main National Association of Bakers pledged a reduction to 15% in four years from 2009. One challenge is that 90% of bread in Italy is craft production by about 30,000 small bakeries. There is a very important role of the Italian regions, therefore, to involve craft bakers and inform citizens. A number of other agreements have been reached: • 2011: agreement to provide a 15% salt reduction in ‘gnocchi’ products (with Association of
Pasta Manufacturers) • 2012: agreement to provide at least a 10% salt reduction in pasta and rice of frozen ready meals
(with Association of Food Product Industries) • 2014: Agreement to provide, at least 10% of salt reduction in soups and vegetable/legumes
puree (with Association of Food Product Industries)
A review of the results in 2015, found that all the partners had reached the goal in the products involved and some partners, had pushed the reduction up to 20%. Analysis of over 3,000 products, by the Meno sale piu’ salute (the Lower Salt Community Project), revealed extreme variability in the salt content of the different products in each given category. It is hoped that this information will be useful for defining future Italian targets. Awareness-raising campaigns continue to be developed in order to raise awareness of the importance of reducing salt intake, enable people to choose low-salt food and encourage consumers to check salt information on food labels. The Lower Salt Community project in Campania set out to evaluate the feasibility of a strategy of moderate, gradual dietary salt reduction at the population level. The project achieved a sizeable reduction in the salt content in bread, and this was still found in follow-up after the project had finished. At follow-up, 15% of the population were meeting the WHO recommendation for daily salt intake, compared to 12% at baseline. Future plans include a repeat survey of salt intakes (five years after MINISAL), monitoring of salt levels in foods and calling for self-reporting by companies, fixing salt targets for specific food categories, continuing campaigns and the setting up and testing new instruments for assessing habitual salt intake.

ESAN April 2016 Meeting Report
Page 12
Norway
Amandine Lamglait, Norwegian Directorate of Health, presented the Salt Partnership that had been launched in Norway in October 2015. Mean total salt intake in Norway is estimated to be about 10 g per day. The Action plan on salt
reduction 2014-2018 established a number of goals: • 15% reduction in salt intake by end 2018 – equivalent to 1.5 g salt per person/day. • 30% reduction by end 2025 – equivalent to 3 g salt per person/day. • The long-term goal is a 50% reduction in salt intake to 5 g per person/day.
The focus areas for action were communication, labelling, monitoring and a partnership to reduce salt in processed and served foods. The Minister of Health convened a food industry group in 2014, comprising top-level management from food and catering companies. The resulting Partnership involves food manufacturers and retailers, catering industry, research institutes, trade associations, consumer councils, NGOs and the authorities. The Norwegian Directorate of Health leads the Partnership’s board, which is responsible for the cooperation agreement and the common monitoring system. All actors in the Partnership are equal partners committed to working together towards the goal of a reduction in salt in processed and served foods in order to achieve the 15% reduction in salt intake by 2018. The partners have different obligations under the agreement: – Food and catering industries: reduce the salt content in processed food products and served
foods; – Trade associations: encourage participation and contribute to coordination of the work; – NGOs and Consumer council: contribute to dissemination of information; – Authorities: increase knowledge on salt and health, empower consumers on how to reduce
salt intakes and increase demand for products with less salt. Voluntary salt reduction targets have been developed for nearly 100 different food categories, following a study of various existing models and collection of data on the Norwegian market. For the catering sector, nutritional procurement criteria are being developed, along with piloting of a ‘salt school’ on kitchen practice and menu planning. Consumer information is another element for this sector. At launch, 53 partners signed the intention agreement under the Salt Partnership and, by April 2016, 60 partners were signed up. Actions planned for 2016 involve monitoring salt levels in processed foods, sodium analysis for intake estimates, organizing a conference with workshops for exchange, definition of the nutritional procurement criteria for catering and implementation of the ‘salt school’ in the autumn. These activities will be complemented by communication and awareness-raising activities to spread the message ‘Mindre salt. Bedre helse’ which means ’Less salt. Better health.’ Discussion
The Partnership was lauded for being a comprehensive initiative, with the engagement of industry leaders at the highest level. The leadership from the Minister of Health, with coordination by the Directorate of Health, is also to be commended. The third impressive element is the very professional, high quality information and communication materials.
ESAN April 2016 Meeting Report
Page 13
There was also discussion, however, of how successful such a partnership can be if it is based on voluntary agreement. Experience has shown that regulatory approaches to setting salt targets are effective. A number of issues relating to costs were discussed. In terms of human resources dedicated to the strategy, there was clarification that two people in the Ministry are working on the plan. The Partnership specifies that industry bear the cost of monitoring and reporting data. While the industry owns the databank, it is obliged to report results to the Directorate of Health. It is important to be able to convey the economic costs to society of salt consumption when advocating for action on salt reduction with politicians and policymakers. It is estimated that every dollar spent on salt reduction brings a return of $6-8. Better information on the economic costs to society of high salt intakes would be helpful for making the case for action and that industry should bear some of the costs. This is an interesting issue to put on the agenda for the next ESAN meeting.
Insight into developing salt strategies
Jacqui Webster, the George Institute for Global Health, Australia, provided an overview of what is known about salt reduction strategies and provided some pointers on how to implement them. As countries work towards the global target for a 30% reduction in population salt intakes by 2025, the role of the WHO Collaborating Centre on Salt Reduction in the Food Policy Division at the George Institute, is to support countries by providing evidence for salt reduction, helping with implementation and evaluation, producing tools and measures and facilitating information sharing. An overview of the evidence for the case to cut salt intake is covered elsewhere, but it is worth noting that there are resources that provide a comprehensive overview of the research base on a continuous basis. The Science of Salt Weekly7, a weekly synthesis of publications on dietary sodium, for example, publishes around 1-10 studies per week, and 95% of these studies support the need to reduce salt. For the handful of studies that dispute the salt reduction hypothesis, there are useful overviews explaining the flawed study designs8.
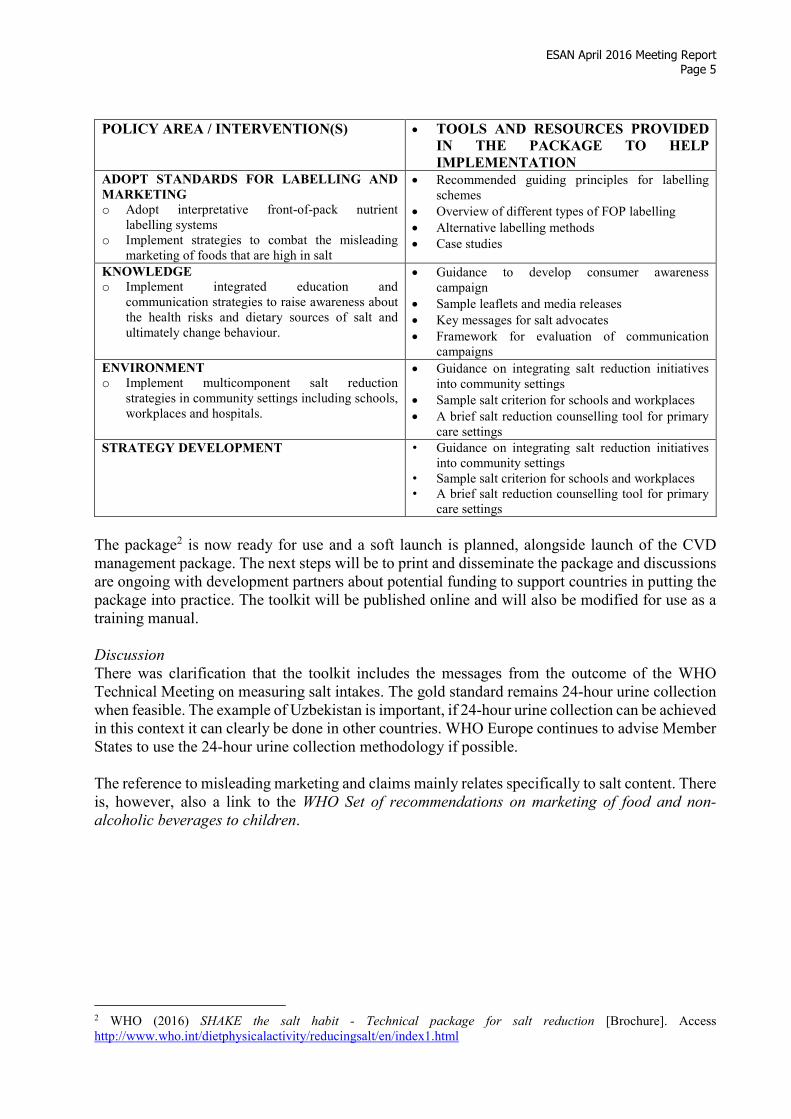
Global and European strategies from WHO set out the actions that countries can take to reduce salt, and there is now a wealth of knowledge about what works. A systematic review of progress towards the global target found that 75 countries have a national salt reduction strategy, comprising different elements (Figure 2)9. There are now strategies in all regions of the world. Although governments still prefer voluntary initiatives to regulation, there are signs that increasingly countries are prepared to consider a regulatory approach. Five European countries have now set legal standards for salt contents, for example, and Finland requires warning labels on high salt foods.
7 Hypertension talk. (2016). Science of salt weekly. Access http://www.hypertensiontalk.com/science-of-salt-weekly/ 8 Cogswell M E, Mugavero K, Bowman A B, Frieden T R. Dietary Sodium and Cardiovascular Disease Risk —
Measurement Matters. N Engl J Med, 2016;375:580-586 9 Trieu K, Neal B, Hawkes C, Dunford E, Campbell N, Rodriguez-Fernandez R, et al. Salt Reduction Initiatives
around the World - A Systematic Review of Progress towards the Global Target. PLoS One, 2015;10(7):e0130247

ESAN April 2016 Meeting Report
Page 14
Figure 2 Types of salt reduction initiatives in national strategies
There is growing evidence that salt reduction can work—12 countries now report that they have
managed to cut average salt intakes (based on countries’ own reports) over differing periods of time. The greatest reduction reported is the 36% drop in population salt intake experience in Finland between 1979 and 2007. A Cochrane review on the same issue is underway and will be published soon10. It is clear, however, that more robust evaluation of initiatives is required. A number of projects are underway to try and obtain more evidence. Evaluation should comprise various components, including impact (salt intakes, salt levels in foods, consumer behaviour), process and outcomes (how well it was implemented, what was the reach, what has happened as a result), and cost-effectiveness. There is no need for policymakers to reinvent the wheel. Existing targets, such as those defined by a long, comprehensive process in the UK11, could be adapted and adopted by other countries. Finally, it is important to emphasise the importance of continued advocacy on the need for salt reduction and how it can be achieved.
How to develop sustainable national salt reduction strategies
Professor Graham MacGregor, World Action on Salt and Health, UK, drew on the experience in the UK to give some pointers for developing national salt reduction strategies. Current salt intakes are in the range of 9 g to 15 g per day, with serious implications for the population’s blood pressure, the rise in blood pressure with age, prevalence of hypertension and other health effects. The challenge is to reduce intakes to the recommended 5 g per day. How can this be achieved?
10 McLaren L, Sumar N, Barberio AM, Trieu K, Lorenzetti DL, Tarasuk V, Webster J, Campbell NRC. Population-
level interventions in government jurisdictions for dietary sodium reduction. Cochrane Database of Systematic
Reviews 2016, Issue 9. Art. No.: CD010166. DOI: 10.1002/14651858.CD010166.pub2 11 Charlton K, Webster J, Kowal P. To legislate or not to legislate? A comparison of the UK and South African
approaches to the development and implementation of salt reduction programs. Nutrients, 2014;6(9):3672-3695.
71
61
36
27
19
9 8
23
3
0
10
20
30
40
50
60
70
Consumer
education
Industry
engagement
to
reformulate
foods
Establish
salt targets
in foods
Front of
pack
labelling
Nutrition
guidelines
for food
procured in
public
institutions
Taxation
Nu
mb
er
of
cou
ntr
ies
wit
h i
nit
iati
ve
s
Voluntary
Mandatory

ESAN April 2016 Meeting Report
Page 15
An important first step is to know where the salt in the diet comes from. This will vary from country to country. Where salt is predominantly added by consumers (as table/cooking salt, stock cubes, flavourings and sauces) public awareness campaigns are needed. The message needs to emphasise that salt is chronic poison that puts up blood pressure, the major cause of strokes/heart disease. People should be encouraged to reduce added salt and salted foods. Other elements could include signpost labelling and warning labels on salt and high-salt food, similar to those for tobacco. Where salt is predominantly coming from processed food and/or eating out, a gradual reduction in
added salt—incremental reformulation—in processed food is the most effective response. Other
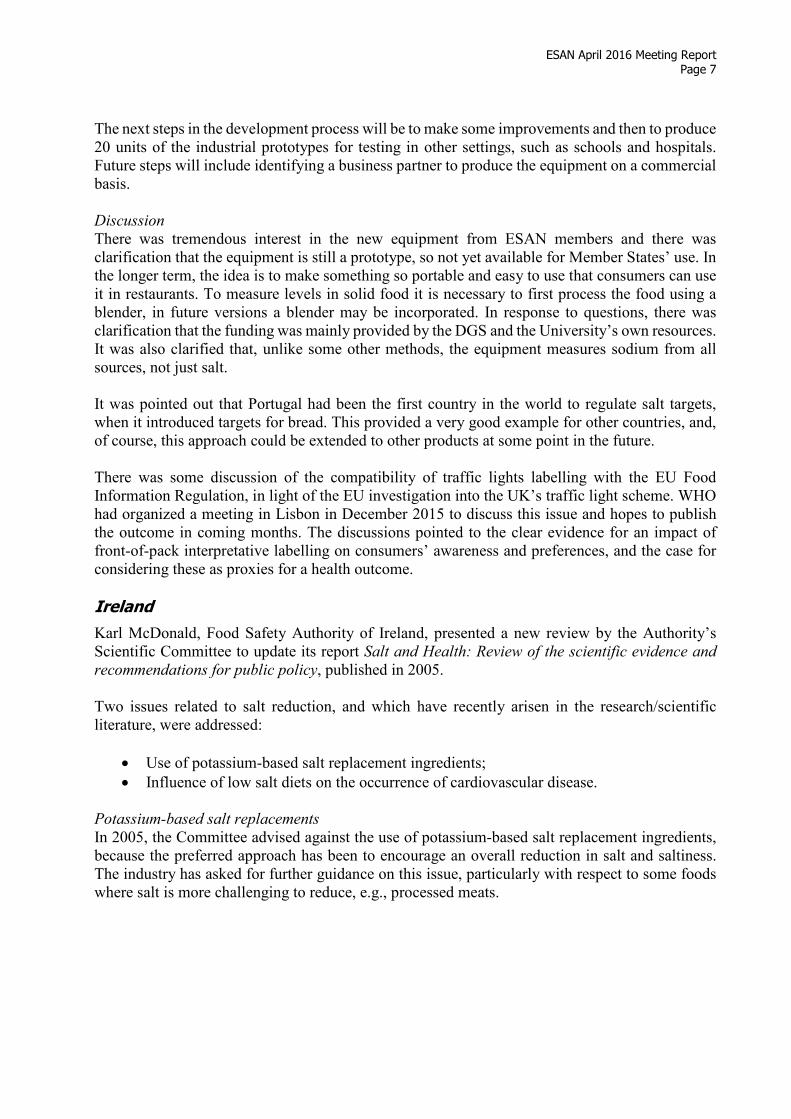
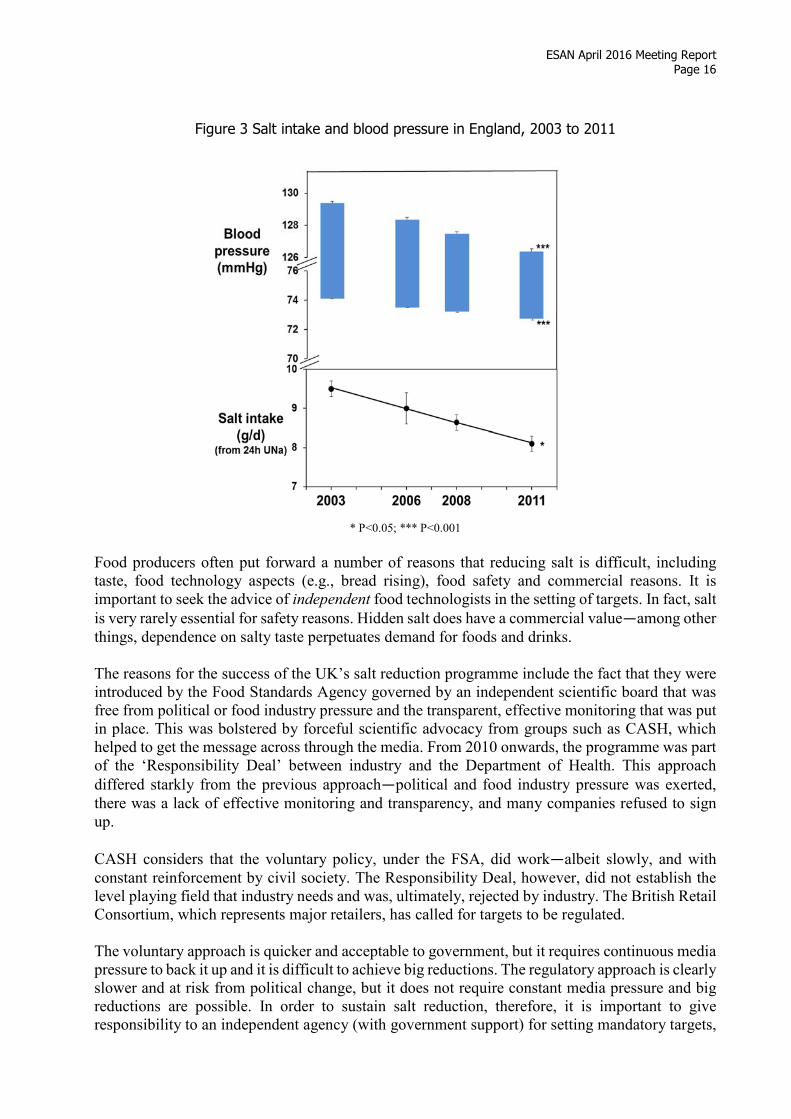
approaches such as labelling, public education, production of specific lower salt foods and advising people to avoid processed foods and/or eating out have been found to be either ineffective or impractical. Given that in developed countries between 60 and 80% of salt is consumed passively, the responsibility for action to reduce salt levels clearly lies with the food industry. A 53% reduction in salt intake from processed foods and eating out is required to be able to meet the 5 g daily target. This means that the food industry and government need to slowly reduce salt content of all foods by over 50% by setting incremental targets. In the UK, where 75% salt comes from processed foods, progressive salt reduction targets led to a gradual reduction of 10-20% a year, and there has been no rejection of the products by the public. The first set of salt targets was published in March 2006, covering 85 categories of processed foods that contribute most salt to the diet. Unfortunately, the out-of-home and catering sector was left out. Reductions in salt levels were monitored by the food industry and independently checked by the Food Standards Agency, as well as surveys by Consensus Action on Salt and Health (CASH). Targets were re-set every two or three years. These targets could easily be adapted to other contexts and have already been adopted by some countries. The reduction in salt levels was reflected in a drop in salt intakes (measured using 24-hour urinary excretion) and in a fall in mean population blood pressure (Figure 3). This is estimated to have resulted in 18,000 fewer strokes or heart attacks (of which, 9,000 would have been fatal) per year. The UK’s National Institute for Health and Clinical Excellence (NICE) estimated that the cost of the salt reduction strategy was around 6.5 million euros (and this included a costly public campaign), while the healthcare savings were estimated to be 1.95 billion euros12.
12 NICE. (2010). Cardiovascular disease prevention [Brochure]. Access http://guidance.nice.org.uk/PH25
ESAN April 2016 Meeting Report
Page 16
Figure 3 Salt intake and blood pressure in England, 2003 to 2011
* P<0.05; *** P<0.001
Food producers often put forward a number of reasons that reducing salt is difficult, including taste, food technology aspects (e.g., bread rising), food safety and commercial reasons. It is important to seek the advice of independent food technologists in the setting of targets. In fact, salt
is very rarely essential for safety reasons. Hidden salt does have a commercial value—among other
things, dependence on salty taste perpetuates demand for foods and drinks. The reasons for the success of the UK’s salt reduction programme include the fact that they were introduced by the Food Standards Agency governed by an independent scientific board that was free from political or food industry pressure and the transparent, effective monitoring that was put in place. This was bolstered by forceful scientific advocacy from groups such as CASH, which helped to get the message across through the media. From 2010 onwards, the programme was part of the ‘Responsibility Deal’ between industry and the Department of Health. This approach
differed starkly from the previous approach—political and food industry pressure was exerted,
there was a lack of effective monitoring and transparency, and many companies refused to sign up.
CASH considers that the voluntary policy, under the FSA, did work—albeit slowly, and with
constant reinforcement by civil society. The Responsibility Deal, however, did not establish the level playing field that industry needs and was, ultimately, rejected by industry. The British Retail Consortium, which represents major retailers, has called for targets to be regulated. The voluntary approach is quicker and acceptable to government, but it requires continuous media pressure to back it up and it is difficult to achieve big reductions. The regulatory approach is clearly slower and at risk from political change, but it does not require constant media pressure and big reductions are possible. In order to sustain salt reduction, therefore, it is important to give responsibility to an independent agency (with government support) for setting mandatory targets,
ESAN April 2016 Meeting Report
Page 17
with the support of independent expertise in food technology and persistent advocacy from NGOs. Reducing salt in this way is very cost-effective in preventing cardiovascular disease and Europe needs a comprehensive and effective strategy to reduce salt. Discussion
There was some discussion about whether the particular success of the early was due to the fact that the first set of reductions were easiest to achieve. Any reduction of salt is easy, however, if it is done slowly. The major UK retailers have already achieved the 2017 targets. World Action on Salt and Health (WASH) is conducting an international survey to examine products that are sold in many different countries. It is important to ensure that the best products (with lowest salt levels) are distributed internationally. There was a suggestion that this could, and should, be an area for ‘class action’.

ESAN April 2016 Meeting Report
Page 18
SESSION 2: MEASURING AND MONITORING SALT INTAKE
The second session explored different databases containing data on salt levels and methodology for measuring intakes.
Examples of across-country databases for salt (and other public health relevant nutrients)
GS1 EU1169 Databases
Cassi Belazouz, GS1 France, presented the GS1 EU1169 databases. GS1 is a non-profit platform for its 112 member organisations in over 150 countries to agree on supply chain standards and systems, the most well-known of which is the bar code system. In Europe, GS1 is working to harmonise and improve the quality of product data across countries and compliance with the EU Food Information Regulation (EU1169/2011)13. This requires certain product information to be displayed on labels and by the end of 2016 will require information to be online. GS1 operates data sharing networks, such as the Global Data Synchronization Network (GSDN), which allow trading partners to automatically share product data, including information for regulatory compliance, nutritional information, product images and logistical information (pack dimensions, etc.).
Data quality is a crucial issue—the quality of data varies hugely between countries. GS1 member
organisations in countries are trying to improve the quality of data (this does not extend to testing the product). This would apply, for example, to salt levels. There are known to be discrepancies between data cited online and label data. Local databases exist in some countries and policymakers in Member States should contact the local GS1 information to get information about the data collected14. Discussion
There was some discussion of the noted discrepancies in online product information, but the prevalence of such inaccuracies is not clear. In the future, national food enforcement authorities are likely to do more work to check the accuracy of label and online information.
There was clarification that the website is not generally accessible to consumers—it is intended to
be only for business-to-business information—but in some countries, such as Switzerland, it
appears that consumers can access the database directly. Sweden was highlighted as one country demonstrating good practice—quality-controlled data is collated on a central database. Local GS1 databases exist in Switzerland, Belgium, Italy, Sweden and the UK. GS1 could help to improve monitoring of, for example, salt levels by ensuring that the information available comes from the brand owner. Then, national authorities could connect to the database and collect information by product category. At this stage, an overall European database appears unrealistic.
13 EUR-Lex. (2011). EUR-Lex - 32011R1169 - EN. Access http://data.europa.eu/eli/reg/2011/1169/oj 14 A list of local contacts was provided. See Cassi Belazouz’s powerpoint presentation on ESAN extranet.

ESAN April 2016 Meeting Report
Page 19
International Food Monitoring Database
Jacqui Webster delivered a presentation about the International Food Monitoring Database on behalf of Michelle Crino, Elizabeth Dunford and Bruce Neal at the George Institute. As dietary intervention strategies focusing on individual behaviour change have proved to be unsuccessful, un-scalable or both, interest has turned to changing the global food environment. There is, however, limited data available to describe and influence the food supply.
The George Institute’s FoodSwitch initiative—which now has a broad vision to improve the health
of billions, by cataloguing the world’s food supply, and making the data available to all–started as a small project to monitor salt in the Australian food supply. FoodSwitch is a smart phone application that shows users immediate easy-to-understand nutrition information about packaged foods. It also suggests healthier alternative products based on an adapted version of the Australia New Zealand Food Standards Agency Nutrient Profiling System. The app facilitates crowdsourcing of product information by including a feature for consumers to give feedback if a product is not in the database and to enable them to submit the missing information (by sending photos of the label). Within a few weeks of launch, thousands of photos were received and this consumer feed-back loop now ensures that FoodSwitch covers more than 90% of all packaged-food products sold in Australia and that the data is up-to-date. The app has
proved tremendously popular—it has been downloaded more than 700,000 times and around
20,000 users regularly update the app, suggesting regular use. In 2015, 19 countries (of which two-thirds and low- or middle-income countries) were involved in collecting data on more than 230,000 individual branded food items. FoodSwitch drives impact in various ways: by empowering consumers to make better food choices; by providing data to help advocate for government and industry action; by highlighting issues to the media and promoting accountability; and by enabling global scientific collaboration and research outputs. Data collected via FoodSwitch has demonstrated that levels of salt in Australian processed foods are higher than for comparable products in the UK15 and has established the baseline for monitoring product changes. This type of data is essential for establishing a baseline for advocacy and for monitoring progress in salt reduction strategies. Future plans for the initiative are to expand the number of participating markets, optimise potential use for advocacy and link with other research organisations. The plan is also to create a self-sustaining platform by making the data available on a commercial basis to companies while ensuring free access to the data for research and advocacy16. Discussion
The simple act of measuring the content of producers’ food and including that information in a database might encourage producers to change their products. Manufacturers have been very keen to get access to their data. Countries wishing to join the international project are encouraged to have an initial discussion with colleagues at the George Institute. The Institute holds the intellectual property on the application
15 Ni Mhurchu C, Capelin C, Dunford EK, Webster JL, Neal BC, Jebb SA. Sodium content of processed foods in the
United Kingdom: analysis of 44,000 foods purchased by 21,000 households. Am J Clin Nutr,2010:93(3);594-600. 16 Further information on FoodSwitch is available from Michelle Crino at the George Institute

ESAN April 2016 Meeting Report
Page 20
and data, but grants licences to partners to allow them to use the data. The costs involved depend on the context. There was some discussion of the relative values of the database for countries with food composition data and those without such data. For those with food composition databases, which tend to use composite data, the FoodSwitch database enables differentiation between products. In this way, products can be compared and the range of nutrient levels in foods is revealed, which can be very important for advocacy. For those countries that do not already have food composition databases the whole process can be tremendously valuable and informative for the collection of information across the food supply.
Brandbank global product exchange
Kevin Knight, Brandbank, outlined the work of Brandbank (recently acquired by Nielsen) to
create, manage and distribute digital content on products—that is, the images and data that people
see when looking at products online. The content is created in various ways, but for the majority of products (70%) the data is input manually on the basis of a sample of the physical product shipped to the Brandbank warehouse. Once the content has been created and approved by the supplier it is entered into the Brandbank product library and this is distributed to retailers and other data users. As well as online retailing, the content can be used for space management, logistics, printing, etc. Online shopping is evidently growing in importance and will continue to do so, along with more digital ‘touch points’ even when shopping in stores (such as retail apps, in-store scanning, in-store computers). This makes it ever more challenging for brands to have consistent data and images across all retailers and all channels. More than 7,000 brands are included in the database and content is distributed to over 200 retailers. Other organisations that use the data include Weight Watchers, Public Health England (for the Eatwell guide). All packaging had to be re-entered after the Food Information to Consumers Regulation (FIC EU1169) came into force.
Quality assurance processes are in place. There are many dimensions to data quality—it is not only
a question of accuracy. Other dimensions include relevance, consistency, format, timelines and completeness. A crude analysis, for this meeting, of data on archived products found average salt intake per 100 g in all products declining between 2011 and 2016. A similar downward trend can be seen in cakes, while the levels in bread are relatively stable and those in speciality/ethnic food products have risen steeply. A similar crude analysis of sugars found that sugars levels generally remained stable between 2010 and 2015 for all categories combined, but showed a slight decline in cakes and an increase in carbonated drinks. Discussion
Once again the data under discussion is all derived from the label, not from actual product testing. According to UK trading standards, producers used to have a 20% margin for accuracy on, for example, salt levels. The EU has spent a long time discussing these issues on label accuracy and new guidance is tighter on the question of tolerances.

ESAN April 2016 Meeting Report
Page 21
It was clarified that the archive data presented on salt levels does include historical data and does, therefore, include products that have been removed from the market, while the later data includes new entrants to the market. It does not necessarily portray reductions over time in particular products. It would be interesting to separate out the new and revised products. Brandbank and GS1 work together rather than compete. By way of differentiation, Brandbank sells data to consumers as well as to businesses, while GS1 focuses on business-to-business data.
Dutch infrastructure to manage data on salt in foods
Susanne Westenbrink, from the National Institute for Public Health and the Environment (RIVM) in the Netherlands described the Dutch infrastructure that has been established to manage data on salt in foods. The Netherlands Food Information Resource comprises detailed nutrient information on more than 2,500 generic food items and limited nutrient information on more than 10,000 branded foods. It combines information from two databases:
• The RIVM generic database has information on 2,500 food items (mostly generic) and includes data on around 40 nutrients and individual fatty acids. It does not have information on ingredients or portion size, but does have detailed information on the source of the data.
• The Dutch Nutrition Centre (VCN) has a database of around 10,000 branded foods (with plans to expand up to 50,000). The information covers four to eight nutrients, as featured on labels, and has some information on portion size. It does not yet have any information on ingredients (although this is planned for the near future) or on the source of the data.
This data is essential for research (including national food consumption surveys) and has recently been used to create a Food Reformulation Monitor to track the food industry’s progress towards their commitments to reduce salt levels in their foods by 2020, according to the national agreement signed with the Minister of Health. In 2012, the Minister made it clear that if voluntary reformulation does not work then legislation will be introduced, thus providing clear impetus for the national agreement. The National Agreement to Improve Product Composition 2014-2020 was signed in 2014. The agreed ambitions are to reformulate products such that a consumer eating according to dietary guidelines will consume no more than 6 g of salt per day, with a maximum of 10% of energy from saturated fat. The aim is also to reduce energy intakes by reducing sugar and fat levels, reducing portion sizes and increasing fruit and vegetable consumption. RIVM receives data for the Food Reformulation Monitor from a variety of sources, including brand data from the database hosted at the Dutch nutrition Centre web application, analytical data from the Dutch Food Standards Agency, and monitoring data from specific sectors. Talks are underway to obtain data through a database that takes data from product labels on the internet. Other recent developments in the data infrastructure include establishment of links with some food industry databases and a pilot study to test exchanging of data with GS1.
ESAN April 2016 Meeting Report
Page 22
A number of challenges remain:
• Size of datasets—The number of data points is now very large and thus harder to deal with.
There are more and more double entries. Quality of brand data is also an issue, particularly how it can be monitored and corrected.
• Keeping up to date—To meet this challenge direct links with company databases will be
essential. Otherwise, there is a risk that data used in research is out-dated.
• Cooperation is voluntary—This means that the current data is not necessarily complete nor
representative of the food supply
• Component identification on labels—There are variations between use of ‘salt’ or
‘sodium’, or ‘saturated fat’ or ‘saturated fatty acids’. Future developments could include international cooperation on database management, with harmonisation and exchange of data. International collaboration with brand data providers would also be useful, in order to harmonize monitoring of food reformulation in Europe. Discussion
There was discussion of how, given the importance of food as a determinant of health, it should be easier to obtain accurate information on the content of food. It was suggested that there should be a mandatory complete database, available free-of-charge across Europe. There was clarification that, although much of the data included in the Dutch database is derived from industry, there are also annual analyses by the Dutch Food Standards Agency to check some product composition and compare with label information.
Methods to measure salt intake at individual level
Francesco Cappuccio, University of Warwick, UK, outlined some issues about the methodology used to measure salt intake at the individual level. Given the variable salt content of foods and that people add differing amounts of discretionary salt to their food, dietary surveys are generally recognised to provide poor estimates of sodium intakes. The preferred methods for estimating sodium intakes, therefore, tend to involve collecting urine and measuring how much sodium has been excreted. Most of the sodium eaten in a day is usually excreted in the urine in the following 24-hours, so the gold standard method has been to collect urine for 24-hours and measure the sodium excreted. More convenient methods have been introduced as proxy measures for the 24-hour urine collection, which is often considered too cumbersome. In recent years a confusion has arisen as to
what extent, and for which purposes, such proxies—namely, ‘spot’ or ‘timed’ urine collections—
can be used to assess salt intakes of individuals or populations. ‘Timed’ urine collections that involve, for example, collecting urine over a four-hour period at particular times of the day are more variable at the individual level but they may give a good estimate of average intakes for a group. They may, therefore, be a desirable alternative to 24-hour collections for monitoring how programmes impact on average intakes over time, but they do need to be validated with a 24-hour urine collection to establish a baseline. Timed overnight
collections—where urine passed during the night and first thing in the morning is collected—may
give biased estimates and should not be used to monitor programme effects over time.

ESAN April 2016 Meeting Report
Page 23
One-off ‘spot’ urine collections are highly dependent on factors such as a person’s hydration or residual bladder volume. Analyses based on spot collections are highly variable at the individual level but may give an estimate of a group mean. Their use for monitoring programme effects over time is less desirable than 24-hour or timed collections. It has been known for decades that there is great variability in individuals’ salt intakes and that, therefore, a number of measurements are need to improve the reliability of the results. In fact, the variation between individuals tends to be lower than the variance within individuals from one day to the next. Salt-balance studies (which control dietary intakes and collect all urine) suggest that seven separate 24-hour urine collections and analyses are required to produce accurate results (92% accuracy)17. A number of equations have been developed to try and estimate 24-hour urinary sodium excretion from spot urinary samples. These calibration methods, however, produce biased results and a more accurate method is needed to estimate 24-hour sodium excretion from spot urine. Current research, therefore, points to a number of conclusions:
• Spot timed urinary sodium does not provide reliable and reproducible estimates of 24-hour urinary sodium excretion in an individual.
• Spot urines should not be used in cohort studies to estimate individuals’ exposures. • 24-hour urinary collection for the measurement of urinary sodium excretion remains the
preferred tool for assessing salt intake. • Multiple 24-hour collections are necessary to increase the accuracy of the prediction.
Discussion
This presentation points to a more widespread problem with the methodology used in diet and nutrition studies. This is why it is important to be cautious in interpretation of such studies.
There was some discussion of whether—given the poor performance of all proxy methods and the
practical difficulty of repeated 24-hour collections—there may be an argument for exploring
whether a well-designed, validated questionnaire would perform better. There is also a case, however, for concentrating on the measurement of population intakes rather than further developing techniques to measure individual intakes. It is population, rather than individual, intake estimates that are needed in order to track trends and the effectiveness of
interventions. The huge intra-individual variation from one day to the next—unlike, for example,
BMI—makes the use of individual measurements in prospective studies highly problematic.
Under-collection of urine is recognised to be part of the problem. This appears to be particularly poor when collection is not carried out by experienced health professionals. It is important to refer to standard protocols for 24-hour urine collection, as that prepared by PAHO/WHO18. It is possible to use urinary creatinine excretion to verify the completeness of collections. There was a question about whether WHO could also look at developing criteria to apply for population estimates.
17 Lerchl K, Rakova N, Dahlmann A, et al. Agreement between 24-hour salt ingestion and sodium excretion in a
controlled environment. Hypertension, 2015;66:850-7 18 Salt-Smart Americas: A guide for country-level action. PAHO/WHO, Washington, DC, 2013; pp. 1-159 (ISBN
978-92-75-31769-3)
ESAN April 2016 Meeting Report
Page 24
SESSION 3: RESEARCH PROJECTS / SCIENTIFIC UPDATES
State-of-the-art salt and health outcomes
Francesco Cappuccio gave an overview of the latest evidence on salt and health outcomes and addressed some of the apparent recent controversies. Current WHO guidance on salt is based on the paradigm that salt intake is high around the world,
that salt raises blood pressure and—because hypertension is a major risk factor for cardiovascular
disease—thus increases the risk of cardiovascular deaths.
Salt entered the food chain as a preservative for food but in westernized societies is not now generally needed to preserve food. Salt intake is now high, with population averages usually between 7.5 g and 12.5 g per day (with higher extremes), and 75% or more of salt in food derives from salt added in the manufacturing process. As a result, individuals, at least in the Western world, control only a small proportion of the salt they consume. The first part of the paradigm (the salt-blood pressure relationship) is clearly supported by evidence. In observational studies, high salt intake is associated with high blood pressure and with the rise in blood pressure with age. This is an effect that is seen at all ages, in both genders, in all ethnic groups and in rich and poor. When migrant populations increase their salt intake their blood
pressure increases in parallel. Animal studies provide further support—large primates fed high salt
diets show a rise in blood pressure and when fed a low salt diet their blood pressure falls. In humans, experimental evidence from randomized controlled trials (RCTs) has shown that a reduction in salt intake causes a dose-dependent fall in blood pressure. A study by Cappuccio and Capewell plotted all published meta-analyses of randomized controlled trials of the effects of salt reduction on systolic blood pressure.19 Despite differing interpretations these analyses all agree that a reduction in salt intake causes a dose-dependent reduction in blood pressure. Similar results have been shown in children.20 There is also a large body of evidence, from different types of studies, to support the next element
of the model—the relationship between blood pressure and cardiovascular disease. In animals,
large primates fed high salt diets show a rise in blood pressure and an increase in stroke deaths. For those fed low salt diets the converse is seen. In humans, observational studies suggest that high blood pressure is a predictor of cardiovascular disease in populations. Countries that have reduced salt consumption have seen falls in cardiovascular disease occurrence over many years. In trials, where drug treatment has been used to reduce blood pressure a fall in cardiovascular disease outcomes (and in most cases all-cause mortality) is seen within five years or, in elderly groups, less. Observational studies suggest that high salt intake is associated with high mortality from stroke, coronary heart disease and cardiovascular disease. Small and short term RCTs have found that cutting salt intakes reduces the incidence of cardiovascular events. Lastly, long-term surveillance confirms the benefits of reduced salt on cardiovascular outcomes21.
19 Cappuccio FP, Capewell S. Facts, issues and controversies in salt reduction for the prevention of cardiovascular
disease. Functional Food Reviews, 2015; 7(1): 41-61 20 Aburto NJ, Ziolkovska A, Hooper L, et al. Effect of lower sodium intake on health: systematic review and meta-
analyses. Br Med J, 2013;346:f1326, doi:10.1136/bmj.f1326. 21 Cook NR, Appel LJ, Whelton PK. Lower levels of sodium intake and reduced cardiovascular risk. Circulation,
2014; 129: 981-9

ESAN April 2016 Meeting Report
Page 25
The risk of both stroke and ischaemic heart disease increases (sometimes by as much as four-fold) with systolic blood pressure even in the ‘normal’ range of blood pressure. Reducing average blood pressure, therefore, has the potential to not only reduce the prevalence of hypertension but also to reduce the burden of disease attributable to blood pressure to a much greater extent. Based on all this evidence, modelling studies estimate that, globally, 1.65 million annual cardiovascular deaths can be attributed to a salt intake of more than 5 g per day, accounting for nearly 10% of cardiovascular deaths. Of these, 85% occurred in low- and middle-income countries and 40% took place in those aged under 70. Recently there have been a number of attacks on the prevailing interpretation of the evidence. Since 2011, some researchers have posited a J-shaped relationship between sodium and
cardiovascular events—in other words, that a very low salt intake increases the risk22,23,24,25,26.
A number of pitfalls have been identified in one or all of these studies, including27,28.
• Use of unreliable methods for estimating sodium intakes (e.g., spot urine, single fasting morning urine) and, in some cases, strong indications of under-collection of urine, particularly in the low sodium group (erroneous assessment of exposure).
• Inclusion of (and failure to adjust for) participants who are old, in ill health or on multiple medications and, therefore, are (a) at higher risk to start with or (b) more likely to be in the lower sodium group at the outset (reverse causality).
• Detailed analysis of reported increases in cardiovascular mortality for low sodium groups reveal that the increase does not always hold true for stroke (and in one case this is also the case for ischaemic heart disease), but it is mainly explained by congestive heart failure deaths and hospitalizations (reverse causality).
• Groups that are described as low salt/low sodium do not always actually have low intakes (e.g., up to 7.5 g / day) (no generalizability to population salt reduction policies and targets).
• Small sample sizes and/or small numbers of cardiovascular events in the groups, and, therefore, wide confidence intervals. Reported results are not always statistically significant (lack of statistical power).
22 Stolarz-Skrzypek K, Kuznetsova T, Thijs L, Tikhonoff V, Seidlerová J, Richart T,… Staessen JA. Fatal and nonfatal outcomes, incidence of hypertension, and blood pressure changes in relation to urinary sodium excretion. JAMA, 2011; 305: 1777–85 23 O'Donnell MJ, Yusuf S, Mente A, Gao P, Mann JF, Teo K,… Schmieder RE. Urinary Sodium and Potassium Excretion and Risk of Cardiovascular Events. JAMA, 2011;306(20):2229-2238. doi:10.1001/jama.2011.1729 24 Thomas MC1, Moran J, Forsblom C, Harjutsalo V, Thorn L, Ahola A,… Groop PH. The association between dietary sodium intake, ESRD, and all-cause mortality in patients with type 1 diabetes. Diabetes Care, 2011; 34: 861-6 25 Mente A, O'Donnell M J, Rangarajan S, McQueen M J, Poirier P, Wielgosz A,… Yusuf S. Association of Urinary Sodium and Potassium Excretion with Blood Pressure. NEJM 2014:371:601-11 26 O’Donnell M, Mente A, Rangarajan S, McQueen M J, Wang X, Liu L… Yusuf S. Urinary Sodium and Potassium Excretion, Mortality, and Cardiovascular Events NEJM 2014:371:612-23 27 Cobb LK, Anderson CA, Elliott P, et al. Methodological issues in cohort studies that relate sodium intake to
cardiovascular disease outcomes: a science advisory from the American Heart Association. Circulation, 2014; 129: 1173-86 28 Cappuccio FP, Campbell NRC. Population dietary salt reduction and the risk of cardiovascular disease: a
commentary on recent evidence. J Clin Hypertens, 2016; doi: 10.1111./jch.12917

ESAN April 2016 Meeting Report
Page 26
It is important to recognise that not all recent studies suggest a J-shaped curve; others continue to show a graded and linear association between salt intake and cardiovascular disease29,30. An IOM analysis from 2013 found, based on 14 studies of which nine were free of methodological flaws, a linear relationship for cardiovascular disease outcomes with dietary sodium intakes from 1250 mg sodium/day31 . While critics of WHO’s salt guidelines might argue that an RCT is required, in reality, this would present considerable practical and ethical problems, especially since salt intakes are currently falling. However, real life experience in Finland (over 30 years) and England (between 2003 and 2011) shows reductions in population salt intakes have been accompanied by changes in diastolic blood pressure and falling stroke deaths32,33.
In conclusion, there is ample evidence for WHO to maintain the current recommendations. Discussion
This critical look at some of the new research was highly appreciated and the clear message was well received. There was some discussion of whether people doing sport need to increase their salt intakes and Professor Cappuccio clarified that, even in hot climates, sports participants need water and minerals (e.g., potassium, magnesium), but they do not need additional salt.
Update on link between salt, soft drinks and obesity
Dr Feng He, Wolfson Institute of Preventive Medicine, UK, gave an update on the possible links between salt, thirst, soft drinks consumption and obesity. Such links are important because, as well as being a major cause of raised blood pressure, salt may also increase obesity and thus may further increase cardiovascular risk independent of blood pressure. There are several potential pathways to explore:
• Salt promotes thirst and increases fluid intakes which, in the current European context, often implies increased consumption of sugar-sweetened beverages;
• High salt levels may also increase food consumption.
• A possible direct link between salt and obesity independent of soft drink and food consumption.
29 Cook NR, Appel LJ, Whelton PK. Lower levels of sodium intake and reduced cardiovascular risk. Circulation,
2014; 129: 981-9 30 Mills KT, Chen J, Yang W, et al. Sodium excretion and the risk of cardiovascular disease in patients with chronic
kidney disease. JAMA, 2016; 315: 2200-10 31 IOM 2013. 32 Karppanen H et al. Progress, Cardiovascular Disease. 2006;49:59-75. 33 Hashem K M, He F J, Jenner K H, MacGregor G A. Cross-sectional survey of salt content in cheese: a major contributor to salt intake in the UK. BMJ Open, 2014; 4: e004549
ESAN April 2016 Meeting Report
Page 27
Salt and fluid intakes
Experiments in animals and both metabolic and observational studies in humans report an association between salt intake and fluid intake, suggesting that salt is an important determinant of fluid intake34,35. In adults, reducing salt intakes from around 10 g per day to the recommended 5 g per day would lead to a reduction of around 350 ml per day in fluid intake, with a proportionate drop in soft drinks consumption. In children, significant associations between salt intakes, fluid intakes and, specifically, sugar-sweetened beverage consumption have been found in the UK, Australia and the USA.36,37,38 In the UK it has been estimated that a 50% reduction in children’s salt intakes could result in a drop in consumption of around two cans of sugar-sweetened beverage per child per week. Soft drinks are potentially associated with obesity through their impact on calorie intake as a result of their high sugar content, the low satiation effect and their impact on appetite. A prospective cohort study39 found higher sugar-sweetened beverage intakes were associated with a raised risk of obesity and a randomised trial40 found that a reduction in soft drink consumption reduced prevalence of overweight and obese children.
Salt and food consumption
Some studies have also explored the salt-food consumption-obesity pathway. A randomised, cross-over study in 48 adults, for example, found that higher salt contents increased food and energy intake41 .
Salt and obesity: direct link
It has also been posited that there may be a direct link between salt and obesity. Analysis of the UK’s rolling dietary survey data found an association between salt and both BMI and waist circumference independent of total energy intake in children and adults. This association was found after adjusting for confounders and was found to be robust in various sensitivity analyses. A small doubly-labelled water sub-study found a significant association between the salt to energy ratio and body fat mass, but not lean body mass.42 Other studies have found similar associations between salt intake and the risk of overweight and/or obesity. A number of potential mechanisms
have been suggested for exploration—including potential changes to body fat metabolism—but
this remains an area of uncertainty.
34 Gamble et al. Am J Physiol 1929;88:571-80 35 He F J, Markandu N D, Sagnella G A, MacGregor G A. Effect of Salt Intake on Renal Excretion of Water in Humans. Hypertension, 2001;38:317-20 36 He F G, Marrero N M, MacGregorSalt G A. Intake Is Related to Soft Drink Consumption in Children and Adolescents Hypertension, 2008;51:629-34 37 Grimes C A, Riddell L J, Campbell K J, Nowson C A. Dietary Salt Intake, Sugar-Sweetened Beverage Consumption, and Obesity Risk. Pediatrics, 2013;131:14-21. 38 Grimes C A, Wright J D, Liu K, Nowson C A, Loria M C. Dietary sodium intake is associated with total fluid and sugar-sweetened beverage consumption in US children and adolescents aged 2–18 y: NHANES 2005–2008. Am J
Clin Nutr, 2013(98): 189-196; doi:10.3945/ajcn.112.051508 39 Ludwig D S, Peterson K E, Gortmaker S L. Relation between consumption of sugar-sweetened drinks and childhood obesity: a prospective, observational analysis. Lancet, 2001;(357):505-8 40 James J, Thomas P, Cavan D, Kerr D. Preventing childhood obesity by reducing consumption of carbonated drinks: cluster randomised controlled trial. BMJ, 2004;328:1237-41. 41 Bolhuis D P, Costanzo A, Newman L P, Keast R SJ. Salt Promotes Passive Overconsumption of Dietary Fat in Humans. J. Nutr., April 2016(146):838-845; doi:10.3945/jn.115.226365 42 Ma Y, He F J, MacGregor G A. High Salt Intake: Independent Risk Factor for Obesity? Hypertension, 2015;66:843-9

ESAN April 2016 Meeting Report
Page 28
In conclusion, it is clear that decreasing salt intake should be an important part of a multifactorial, comprehensive strategy to reduce obesity.
Discussion
There was some discussion about the posited direct link between salt and obesity and there was agreement on the need to be cautious in communication about this potential association. There is not yet any definitive proof of this direct link. It remains an interesting area for further exploration. Nonetheless, the indirect link with obesity (through fluid and food intakes) is clear and merits dissemination.
Iodine in Portugal
Elisa Keating, University of Porto, presented the iogeneration project investigating iodine status
in Portuguese school aged children. Iodine deficiency—which compromises maximal physical and
cognitive development—is a continuing public health problem in Europe with several countries
are classified as iodine deficient. Portugal is currently classified as having an adequate iodine status but the median intake is very close to the lower threshold. Studies suggest that iodine intakes in pregnant women are considered inadequate and that a proportion of children are iodine deficient. As a result, in 2013 the Directorate General of Health issued a recommendation that pregnant women take daily iodine supplements. A further issue is that no data are available on household use of iodized salt in Portugal. The Directorate of Education has, therefore, issued a guideline that iodised salt should be used in the preparation of school meals. Against this backdrop, and recognizing the need for surveillance, the iogeneration project was set up. The project aims are:
• To characterize iodine status in portuguese school-aged children (6-12 years old);
• To monitor household and school canteens usage of iodised salt;
• To find a correlation between iodine levels and markers of cognitive development and global growth;
• To increase awareness of the importance of adequate iodine intake for health, thereby promoting public health policies to reduce nutritional inequalities particularly in children.
Having established a multi-disciplinary team and a brand identity for the project, fieldwork was carried out in the north of Portugal, targeting approximately 4,800 children. Once the protocol for fieldwork had been defined, the psychology team conducted cognitive assessments, the nutrition team conducted anthropometric assessments and urine (first morning urine) analysis to quantify iodine was collected using inductively couple plasma-mass spectrometry methodology. Preliminary results were presented for the sample of 829 children from the Tamega region. Although around 45% of total sample had adequate levels of iodine, 31% of children (1/3) were mildly or moderately iodine insufficient. Girls were more iodine deficient than boys. The proportion of iodine deficiency increased with age (or school grade) and the proportion with iodine excess decreased with age. In response to a questionnaire, most parents and/or teachers did not use or know about iodized salt. Household use of iodized salt was only 8% and none of the school

ESAN April 2016 Meeting Report
Page 29
canteens used iodized salt. No association was found, in this sample, between intellectual performance and urinary iodine. In conclusion, the mean urinary iodine was within WHO’s criteria for adequacy in children, but 31% of children were mildly or moderately iodine deficient. Voluntary household use of iodized salt alone may not be enough to improve iodine status, reinforcing the case for universal salt iodization. The need for an integrated approach between salt reduction and salt iodization
strategies—comprising universal salt iodization–was the message to emerge from a March 2016
seminar at the University of Porto bringing together all relevant players in this area. Discussion
There was some discussion about the methodology, with concerns that ‘spot’ urine analyses may imply deficiencies that are not identified when a 24-hour urine collection method is used. Although validation would certainly be desirable, there is currently a consensus supporting the method that was used. This is an evolving process. The iogeneration team are keen to do sodium analyses in future, and thus will have to move to 24-hour collection in any case.
There is clearly a challenge to implement salt iodization—even in countries where there is a policy
for iodization implementation is poor. The project’s focus on household salt consumption was questioned, given the major contribution of processed food to salt intakes. In fact, the project recognised the importance of salt in processed food, but household salt is also important and it was practical to investigate this aspect, given the interactions with children. This component of the project has clearly revealed the very poor level of awareness about iodized salt. In relation to iodine in processed food and food industry use of iodized salt, the INSA (national institute for health) is currently collating data on iodine content of food. Finland has observed a drop in iodine levels in food since 2007 and has found that the food and catering industries are not using iodized salt. There also appears to have been a change in the feeding practices of cows and chickens as a result of EU legislation that has led to a drop in iodine levels. Austria has required fortification of retail salt since the late 1960s, but has observed a fall in iodine intakes over the last 10 years. The authorities are using the discussions with the bakery industry on salt reduction as an opportunity to communicate on use of iodized salt. The results will be monitored. There are currently a number of important opportunities to examine issues relating to iodine. It will be important to measure the impact of the advice on iodine supplementation to pregnant women and to understand the impact on different socio-economic groups. It is also relevant for industry to assess the iodine content of its own products, such as dairy products.
How healthy are specialty salts really?
Esther Infanger, Federal Food Safety and Veterinary Office, Switzerland, presented the findings
of a study on speciality salts. Health claims have been made for a number of speciality salts—such
as Himalayan Pink crystal salt—and the 2015 ESAN meeting had suggested further investigation
of this issue. The Swiss Federal Food Safety and Veterinary Office, therefore, took up the challenge and analysed a convenience sample of 25 salts. This included 10 rock salts (one standard, nine
ESAN April 2016 Meeting Report
Page 30
speciality rock salts) and 15 sea salts (seven standard sea salts, eight speciality sea salts). The speciality rock salts were Blue Persian salt, Himalaya salt, Kalahari salt, Kala Namak salt and rock salt with dioscorea batata. The speciality sea salts were Bamboo salt, Black Hawaii salt, Fleur de Sel, Sea salt with algae, and white pyramid salt. The analysis included an initial screening to identify elements present via Total reflection X-ray fluorescence analysis, followed by quantitative analysis by inductively-coupled plasma mass spectrometry for zinc, iodine, copper, aluminium, nickel, arsenic, cadmium, lead and uranium, by inductively coupled plasma optical emission spectroscopy for sodium and potassium and by argentometric titration for chlorine. The results were compared with recommended and tolerable intake levels for average adults on the basis of both the recommended 5 g maximum daily salt intake and the current Swiss average intake of 9 g per day.
The analysis found that—contrary to some of the claims—the speciality salts were, on average,
94% sodium chloride. Most of the nutrients or contaminants were not detectable or were only present at levels of less than 2% of the recommended/tolerable intake levels. Levels were relatively high for iron in Himalaya salts, but this is iron with low bio-availability and for potassium in Persian salts. There was virtually no iodine in the salts unless they had been fortified. For the contaminants, there were no levels of toxicological concern. By way of conclusion, the study found that the origin of the salt defines and/or influences the composition of salts and that the composition of speciality salts poses no toxicological risks but does not offer any relevant nutritional benefits either. The findings underline the need for iodine fortification of salt and to raise awareness and increase knowledge about speciality salts. The final study report will be available on the ESAN website. Discussion
The study was welcomed and the researchers were encouraged to publish the findings. The issue of possible changes to the bioavailability of iodine during food processing was raised.
Another issue highlighted was the relative perceived saltiness of different crystal sizes—smaller
crystals taste saltier and therefore less salt is needed. Some major manufacturers have reformulated their snacks to use smaller crystals. There was clarification that uranium had been measured because it was identified in the initial screening as an element that was present.
Salt, saturated fat and sugars in selected foods from several European countries
Ivon Milder, RIVM, Netherlands, reported monitoring work on salt, saturated fat and sugars in selected foods from several European countries. A comparison of food composition was carried out as part of work to gain insight into the current state of play in the EU in preparation for the Netherlands EU Presidency tackling this issue. There were various reasons for conducting this work: variation in food composition within food groups can show how much room there is for improvement; a clear picture of the current situation is needed to develop future actions; monitoring changes in food composition over time is needed to track progress.
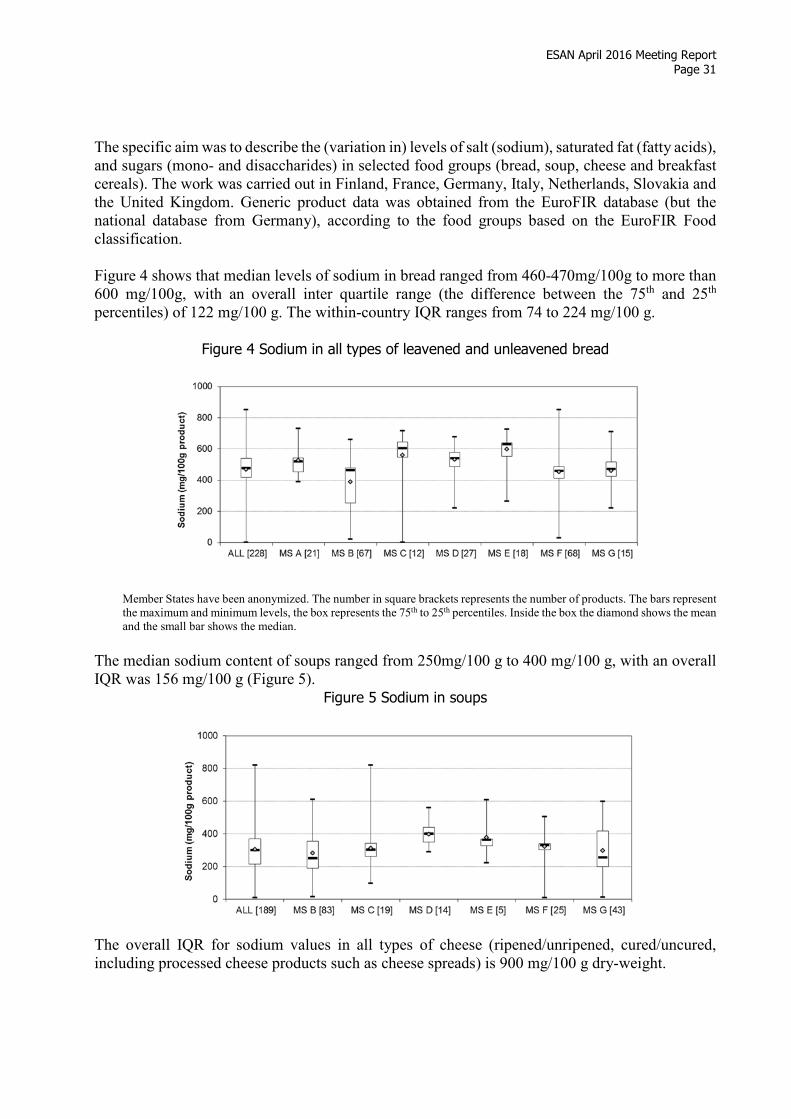
ESAN April 2016 Meeting Report
Page 31
The specific aim was to describe the (variation in) levels of salt (sodium), saturated fat (fatty acids), and sugars (mono- and disaccharides) in selected food groups (bread, soup, cheese and breakfast cereals). The work was carried out in Finland, France, Germany, Italy, Netherlands, Slovakia and the United Kingdom. Generic product data was obtained from the EuroFIR database (but the national database from Germany), according to the food groups based on the EuroFIR Food classification. Figure 4 shows that median levels of sodium in bread ranged from 460-470mg/100g to more than 600 mg/100g, with an overall inter quartile range (the difference between the 75th and 25th percentiles) of 122 mg/100 g. The within-country IQR ranges from 74 to 224 mg/100 g.
Figure 4 Sodium in all types of leavened and unleavened bread
Member States have been anonymized. The number in square brackets represents the number of products. The bars represent the maximum and minimum levels, the box represents the 75th to 25th percentiles. Inside the box the diamond shows the mean and the small bar shows the median.
The median sodium content of soups ranged from 250mg/100 g to 400 mg/100 g, with an overall IQR was 156 mg/100 g (Figure 5).
Figure 5 Sodium in soups
The overall IQR for sodium values in all types of cheese (ripened/unripened, cured/uncured, including processed cheese products such as cheese spreads) is 900 mg/100 g dry-weight.
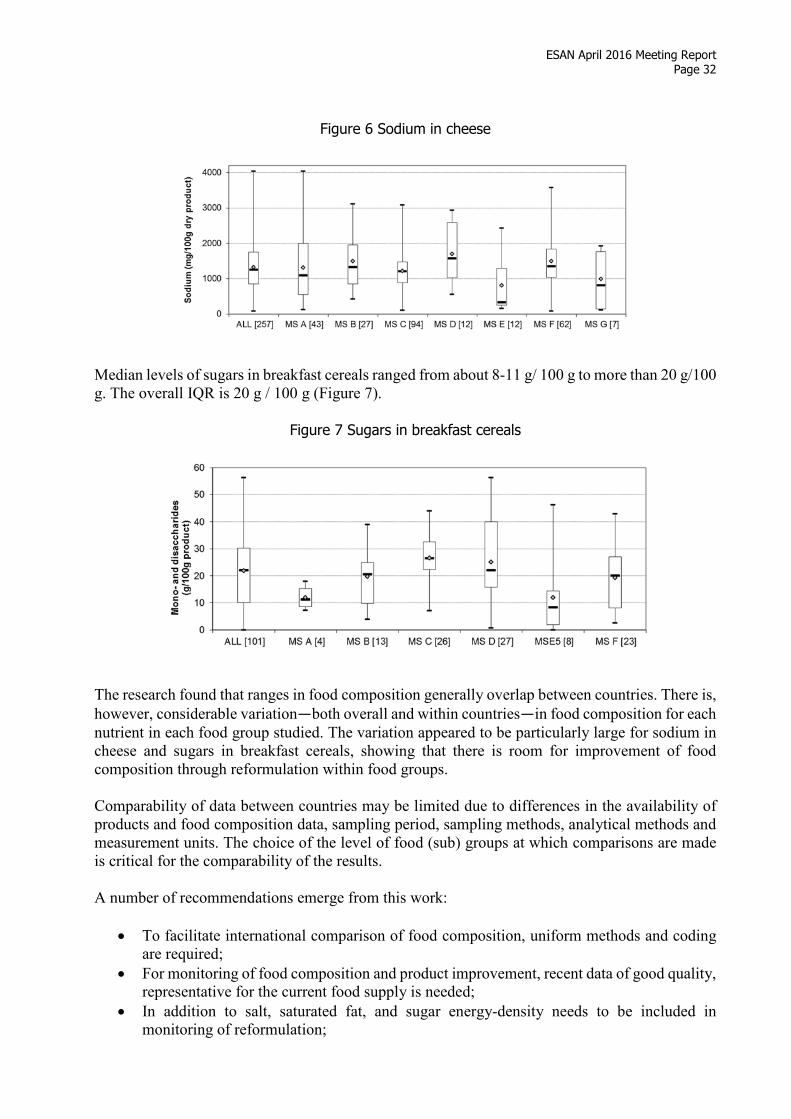
ESAN April 2016 Meeting Report
Page 32
Figure 6 Sodium in cheese
Median levels of sugars in breakfast cereals ranged from about 8-11 g/ 100 g to more than 20 g/100 g. The overall IQR is 20 g / 100 g (Figure 7).
Figure 7 Sugars in breakfast cereals
The research found that ranges in food composition generally overlap between countries. There is,
however, considerable variation—both overall and within countries—in food composition for each
nutrient in each food group studied. The variation appeared to be particularly large for sodium in cheese and sugars in breakfast cereals, showing that there is room for improvement of food composition through reformulation within food groups. Comparability of data between countries may be limited due to differences in the availability of products and food composition data, sampling period, sampling methods, analytical methods and measurement units. The choice of the level of food (sub) groups at which comparisons are made is critical for the comparability of the results. A number of recommendations emerge from this work:
• To facilitate international comparison of food composition, uniform methods and coding are required;
• For monitoring of food composition and product improvement, recent data of good quality, representative for the current food supply is needed;
• In addition to salt, saturated fat, and sugar energy-density needs to be included in monitoring of reformulation;
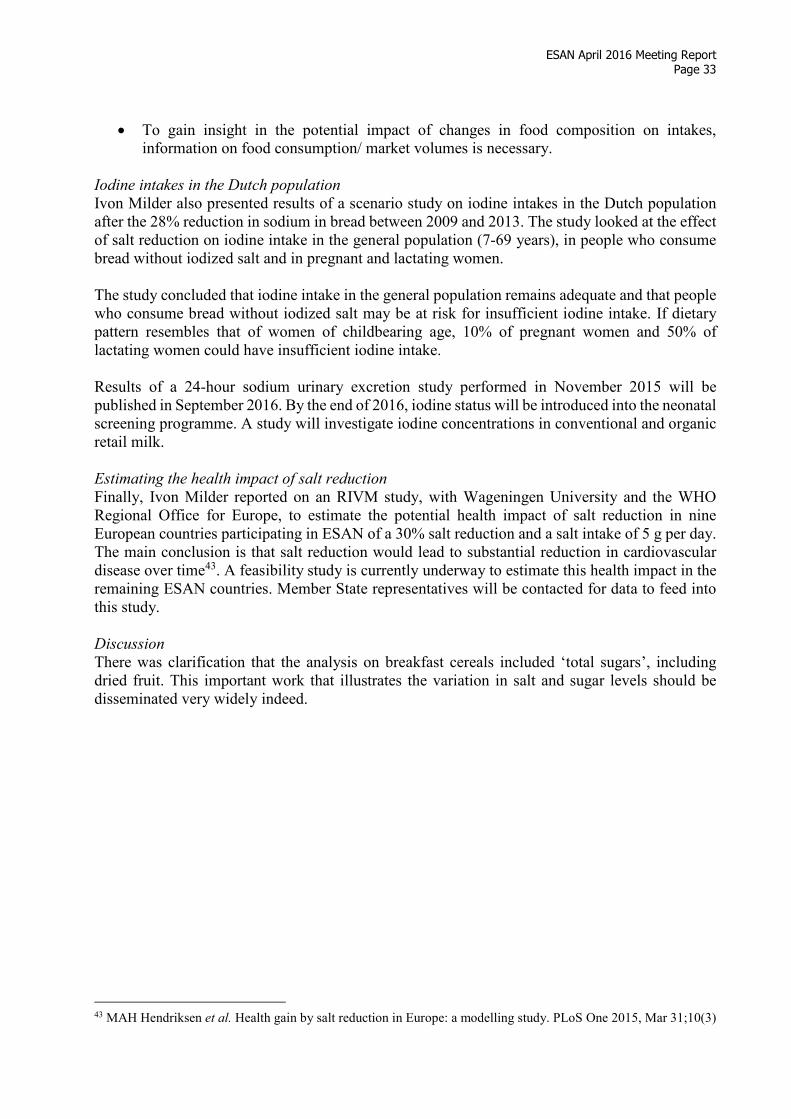
ESAN April 2016 Meeting Report
Page 33
• To gain insight in the potential impact of changes in food composition on intakes, information on food consumption/ market volumes is necessary.
Iodine intakes in the Dutch population
Ivon Milder also presented results of a scenario study on iodine intakes in the Dutch population after the 28% reduction in sodium in bread between 2009 and 2013. The study looked at the effect of salt reduction on iodine intake in the general population (7-69 years), in people who consume bread without iodized salt and in pregnant and lactating women. The study concluded that iodine intake in the general population remains adequate and that people who consume bread without iodized salt may be at risk for insufficient iodine intake. If dietary pattern resembles that of women of childbearing age, 10% of pregnant women and 50% of lactating women could have insufficient iodine intake. Results of a 24-hour sodium urinary excretion study performed in November 2015 will be published in September 2016. By the end of 2016, iodine status will be introduced into the neonatal screening programme. A study will investigate iodine concentrations in conventional and organic retail milk. Estimating the health impact of salt reduction
Finally, Ivon Milder reported on an RIVM study, with Wageningen University and the WHO Regional Office for Europe, to estimate the potential health impact of salt reduction in nine European countries participating in ESAN of a 30% salt reduction and a salt intake of 5 g per day. The main conclusion is that salt reduction would lead to substantial reduction in cardiovascular disease over time43. A feasibility study is currently underway to estimate this health impact in the remaining ESAN countries. Member State representatives will be contacted for data to feed into this study. Discussion
There was clarification that the analysis on breakfast cereals included ‘total sugars’, including dried fruit. This important work that illustrates the variation in salt and sugar levels should be disseminated very widely indeed.
43 MAH Hendriksen et al. Health gain by salt reduction in Europe: a modelling study. PLoS One 2015, Mar 31;10(3)

ESAN April 2016 Meeting Report
Page 34
SESSION 4: REFORMULATION—TECHNOLOGICAL FEASIBILITY AND
CONSUMER ACCEPTABILITY
Sodium reduction while maintaining sensory quality
Ronald W Visschers, consultant for TNO, Netherlands, explored some of the technical challenges involved in sodium reduction. There are foods where salt does have functionality, making reductions harder to achieve. In bread, for example sodium plays a complex role that relates to processing and product quality, taste perception and shelf life and safety. In relation to product quality, ions of salt affect the physical properties of protein. Less salt leads to faster development of yeast but then the gluten network is weaker. There is decreased dough stability and dough resistance, while the fermentation process becomes less controlled. It is possible to compensate for the development of the dough by tweaking the yeast composition and some other patented developments. Salt content in Dutch brown bread can thus be reduced from 1.8% to 0.92% (on a flour basis). This lower figure represents the technological limit and new techniques are required for further reductions. One possible solution is to add a functional food fibre, which overcomes stickiness without ‘buckiness’ or stiffness. When it comes to product safety, there are a small number of products for which there are genuine shelf life and product safety issues with reducing salt. Salt reduces water activity, which retards microbial growth. In bread, the effect on water activity is small, so the impact on microbial growth
inside breads is minor. Problems occur in bread products that are already sensitive to spoilage—
namely, ambient shelf-stable breads which are vulnerable to moulds and packaged part-baked breads. Potential solutions include anti-microbial agents (but there is consumer resistance), improved processing and packaging technology. In relation to taste, there are a number of possible strategies:
• Stepwise gradual reduction over time, without compensation of flavor. This is the ideal situation. While sodium is important to the taste, studies suggest that 25% reductions are accepted and there is relatively fast adaptation.
• Salt replacement by substitutes with non-sodium ions. Only sodium and potassium can attach to the specific receptors on the tongue, thus potassium is the only possible replacement but this induces a bitter, metallic taste.
• Taste-taste interactions—other taste qualities, like umami compounds can be used to
enhance saltiness, e.g., yeast extracts or nucleotides. These are limited by the undesired savoury notes they produce. Potassium and umami compounds combined may be more effective.
• Multisensory interactions: Enhance taste perception by aroma, colour, sound and texture
• Amplify taste perception: Sensory contrast, which exploits the finding that pulsed delivery of salt solution enhances taste intensity.
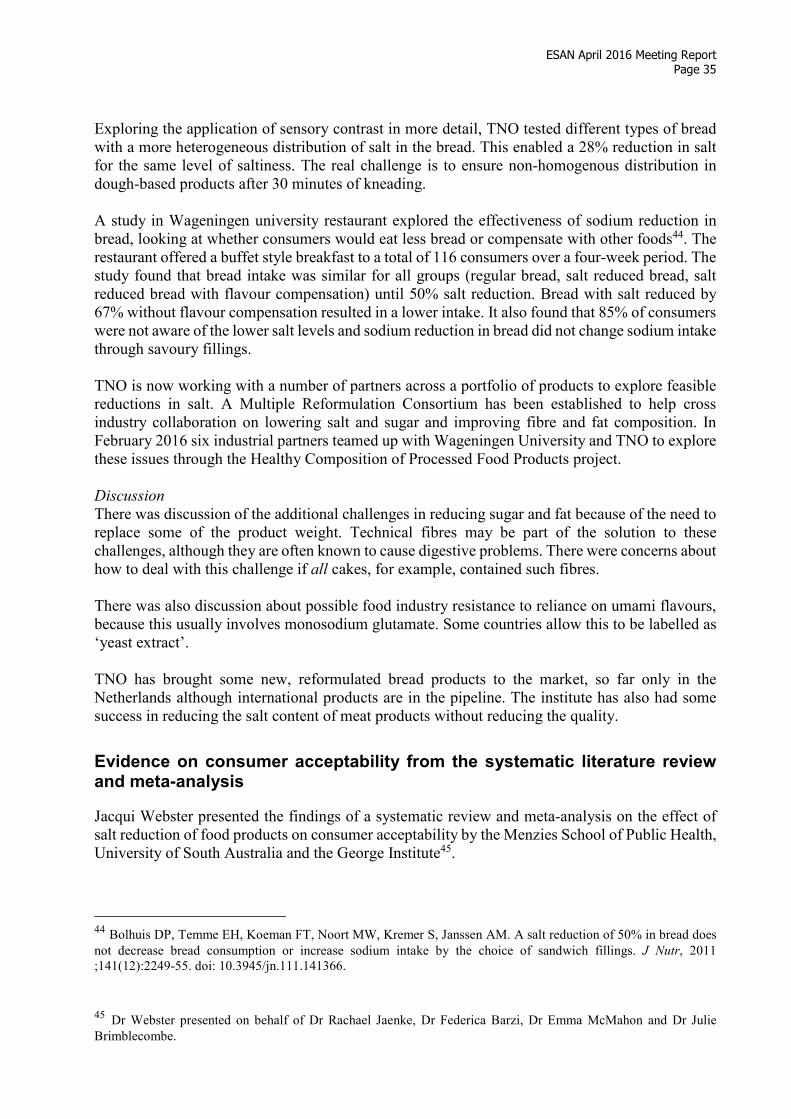
ESAN April 2016 Meeting Report
Page 35
Exploring the application of sensory contrast in more detail, TNO tested different types of bread with a more heterogeneous distribution of salt in the bread. This enabled a 28% reduction in salt for the same level of saltiness. The real challenge is to ensure non-homogenous distribution in dough-based products after 30 minutes of kneading. A study in Wageningen university restaurant explored the effectiveness of sodium reduction in bread, looking at whether consumers would eat less bread or compensate with other foods44. The restaurant offered a buffet style breakfast to a total of 116 consumers over a four-week period. The study found that bread intake was similar for all groups (regular bread, salt reduced bread, salt reduced bread with flavour compensation) until 50% salt reduction. Bread with salt reduced by 67% without flavour compensation resulted in a lower intake. It also found that 85% of consumers were not aware of the lower salt levels and sodium reduction in bread did not change sodium intake through savoury fillings. TNO is now working with a number of partners across a portfolio of products to explore feasible reductions in salt. A Multiple Reformulation Consortium has been established to help cross industry collaboration on lowering salt and sugar and improving fibre and fat composition. In February 2016 six industrial partners teamed up with Wageningen University and TNO to explore these issues through the Healthy Composition of Processed Food Products project. Discussion
There was discussion of the additional challenges in reducing sugar and fat because of the need to replace some of the product weight. Technical fibres may be part of the solution to these challenges, although they are often known to cause digestive problems. There were concerns about how to deal with this challenge if all cakes, for example, contained such fibres. There was also discussion about possible food industry resistance to reliance on umami flavours, because this usually involves monosodium glutamate. Some countries allow this to be labelled as ‘yeast extract’. TNO has brought some new, reformulated bread products to the market, so far only in the Netherlands although international products are in the pipeline. The institute has also had some success in reducing the salt content of meat products without reducing the quality.
Evidence on consumer acceptability from the systematic literature review and meta-analysis
Jacqui Webster presented the findings of a systematic review and meta-analysis on the effect of salt reduction of food products on consumer acceptability by the Menzies School of Public Health, University of South Australia and the George Institute45.
44 Bolhuis DP, Temme EH, Koeman FT, Noort MW, Kremer S, Janssen AM. A salt reduction of 50% in bread does
not decrease bread consumption or increase sodium intake by the choice of sandwich fillings. J Nutr, 2011 ;141(12):2249-55. doi: 10.3945/jn.111.141366. 45 Dr Webster presented on behalf of Dr Rachael Jaenke, Dr Federica Barzi, Dr Emma McMahon and Dr Julie
Brimblecombe.

ESAN April 2016 Meeting Report
Page 36
This review aimed to investigate to what extent salt can be reduced in foods without negatively impacting on consumer acceptability. Studies that investigated reformulated food products with salt reduction and that measured overall acceptability with an untrained consumer panel (i.e. not trained in sensory analysis) were included. The primary production or catering sectors, products with more than one component modified, single elements of acceptability, structural modifications (such as changing salt particle size or salt distribution throughout product) were excluded. In the end 50 articles were included in the review. Overall, there were 63 food products from five categories including processed meats, breads, cheeses, soups and miscellaneous (which included things like ready meals, salad dressing, chips, olives/pickles, biscuit). Studies investigated one or more of three reformulation strategies:
• Salt reduction alone (ranging from 4% reduction to total removal)
• Partial replacement of salt with other chloride salts, or soy sauce
• Salt reduction with flavour compensation using various agents which either produce the umami taste (associated with MSG) or block bitterness.
For the meta-analysis, 37 studies were eligible (salt reduction or salt replacement only). The
primary outcome was the change in acceptability by level of salt reduction—the levels of reduction
were split into four levels, and change was based on a 9-point hedonic scale (dislike extremely to like extremely). Random effects meta-analysis was conducted and stratified by those reduction levels. For breads, there was no significant change in acceptability for products with up to 37% reduced salt, with decreasing acceptability (significant) with reductions of over 50%. For cheeses, whilst a couple of studies showed no decline in acceptability of up to 25%, overall, there was a significant decline in acceptability for all levels of reduction, with a significant trend for declining acceptability with greater levels of reduction. Such a decline in acceptability even at relatively low reductions may be because sodium suppresses bitterness, and cheese has an underlying bitter taste. For processed meats there was no effect of up to 67% salt reduction on the acceptability of processed meats. There are several flavour components present in processed meats which may compensate for the reduction in salt. For soups, there was no linear trend between salt reduction and acceptability. Studies on salt replacement suggest that meats processed with potassium chloride showed no change in acceptability when sodium chloride was reduced by up to 50%. Use of potassium-chloride salt replacements in cheese found no change in acceptability when up to 30% of sodium chloride was replaced and acceptability decreased when over 50% was replaced. Limitations of the study include the fact that not all of the 50 studies could be included in the meta-analysis, that some data had been imputed and that there was high heterogeneity in some groups. The study showed that there is potential for considerable reductions in salt in breads and processed meats. There is also potential for reductions in the salt levels of processed meats and cheese using potassium chloride as a salt replacement. The results on soups were inconclusive but demonstrate that reductions are possible by replacing salt with soy sauce, and there are some positive results for salt replacement and flavour compensation in other products. These results are particularly encouraging for governments and manufacturers, given that bread and processed meats are the biggest contributors to salt intake in many countries. It should be noted that all the studies conducted were from countries where voluntary or mandatory targets for salt levels in food were in place.

ESAN April 2016 Meeting Report
Page 37
Discussion
There was clarification that the average baseline level in bread was 400 mg to 600 mg of sodium. It appeared that when there was a lower baseline starting point the reductions were harder to achieve. The study did not examine the funding of studies, nor any association between funding and results. It was suggested that this would be an interesting exercise. Nor did it look at any variation in
relation to study location—which, in theory, could affect results because of differences in current
salt intakes. The study appears to suggest that there have been some significant, spontaneous reductions in salt levels in processed meat products. This suggests that substantial reductions are possible. In relation to cheese, as well as reducing salt levels it is important to emphasise the advice to eat less.

ESAN April 2016 Meeting Report
Page 38
CONCLUSIONS AND NEXT STEPS
João Breda thanked all participants on behalf of WHO Regional Office for Europe and the Regional Director. Particular thanks are due to Switzerland for its leadership and all its work in putting together a very full and interesting programme. The network is also grateful for the participation and collaboration of the European Commission. Presentations and the discussion sessions during the meeting tackled a number of important practical issues, as well as key scientific questions. The involvement of speakers from different
environments—scientists, academics and NGOs—and very constructive discussion combined to
create a very fruitful meeting. A key challenge is to bring more countries and other parts of the Region. In the future, it is hoped that Member States from the Eastern part of the region will get involved in the network. WHO will continue to provide technical support direct to Member States on issues around salt reduction. Future areas of work are likely to include further work on modelling the economic costs of salt intakes and the positive impact of salt reductions. It will also be interesting to continue to explore the links with iodine research. Finally, he once again thanked the hosts and thanked the Regional Office staff for all their efforts in organising the meeting. The ESAN chair, Michael Beer, conveyed his thanks to WHO, to colleagues from the Federal Food Safety and Veterinary Office, and to all the speakers. The goal of exchanging views and knowledge has been achieved. For the next meeting it will be useful to think about the format, and breakout workshop sessions may be introduced. Possible issues for the next meeting agenda, which is likely to take place next spring in Ireland, include:
• Defining the goal for the next 10 years.
• Exploring the relative merits of the voluntary versus the regulatory approach.
• Estimating the costs of high salt diets and the potential economic benefits of salt reduction. All the presentations will be available on the ESAN extranet, and the meeting report will be available in due course.
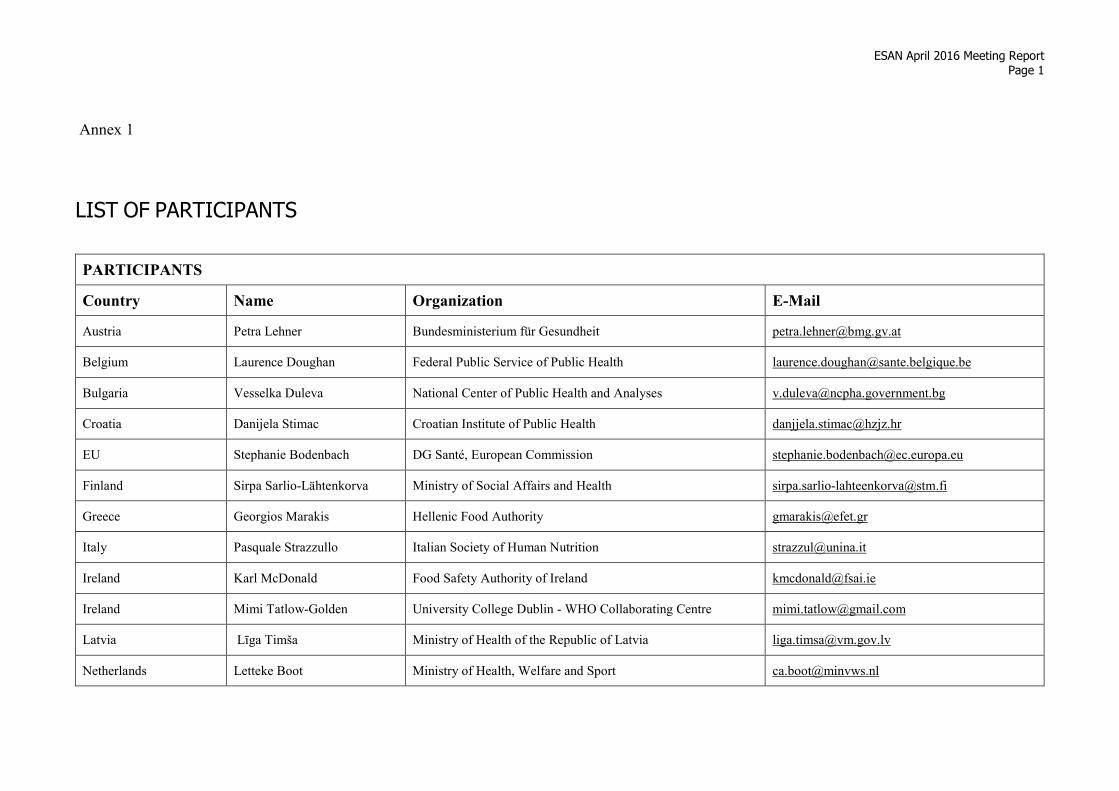
ESAN April 2016 Meeting Report
Page 1
Annex 1
LIST OF PARTICIPANTS
PARTICIPANTS
Country Name Organization E-Mail
Austria Petra Lehner Bundesministerium für Gesundheit [email protected]
Belgium Laurence Doughan Federal Public Service of Public Health [email protected]
Bulgaria Vesselka Duleva National Center of Public Health and Analyses [email protected]
Croatia Danijela Stimac Croatian Institute of Public Health [email protected]
EU Stephanie Bodenbach DG Santé, European Commission [email protected]
Finland Sirpa Sarlio-Lähtenkorva Ministry of Social Affairs and Health [email protected]
Greece Georgios Marakis Hellenic Food Authority [email protected]
Italy Pasquale Strazzullo Italian Society of Human Nutrition [email protected]
Ireland Karl McDonald Food Safety Authority of Ireland [email protected]
Ireland Mimi Tatlow-Golden University College Dublin - WHO Collaborating Centre [email protected]
Latvia Līga Timša Ministry of Health of the Republic of Latvia [email protected]
Netherlands Letteke Boot Ministry of Health, Welfare and Sport [email protected]

ESAN April 2016 Meeting Report
Page 2
PARTICIPANTS
Country Name Organization E-Mail
Norway Amadine Lamglait The Norwegian Directorate of Health [email protected]
Norway Britt Lande The Norwegian Directorate of Health [email protected]
Portugal Maria Antonia Calhau Instituto Nacional de Saude Dr. Ricardo Jorge INSA [email protected]
Portugal Fernando Almeida Instituto Nacional de Saude Dr. Ricardo Jorge INSA
Portugal Rafael Cardoso CEIDSS- Research Center for Health and Social Dynamics [email protected]
Portugal Pedro Graça Directorate-General of Health DGS [email protected]
Portugal Alejandro Santos Directorate-General of Health DGS
Portugal Andreia Silva Directorate-General of Health DGS
Portugal Carla Goncalves University of Porto [email protected]
Portugal Ana Isabel Rito Nutrition Department, National Institute of Health [email protected]
Republic of Uzbekistan Anatoliy Khudaiberganov Ministry of Health [email protected]
Slovenia Mojca Gabrijelčič Blenkuš National Institute of Public Health [email protected]
Switzerland Michael Beer Federal Food Safety and Veterinary Office [email protected]
Switzerland Liliane Bruggmann Federal Food Safety and Veterinary Office [email protected]
Switzerland Esther Infanger Federal Food Safety and Veterinary Office [email protected]
Sweden Anette Jansson Swedish National Food Agency [email protected]
WHO Joao Breda World Health Organization [email protected]
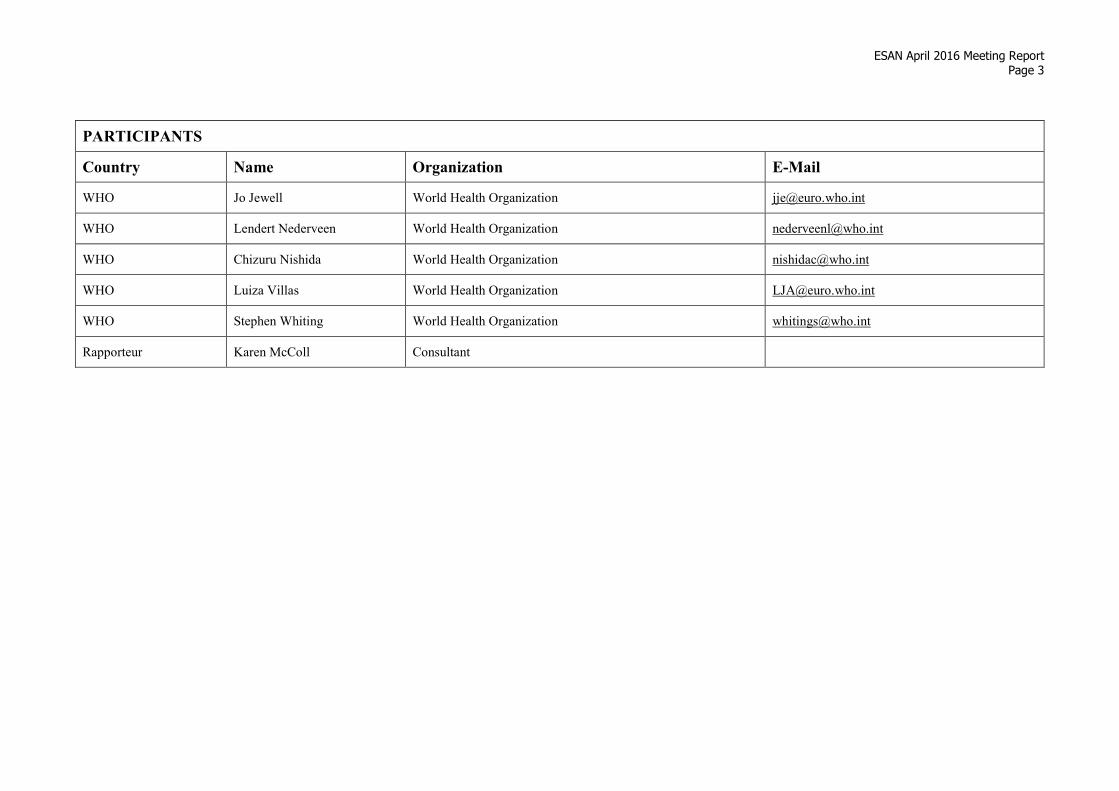
ESAN April 2016 Meeting Report
Page 3
PARTICIPANTS
Country Name Organization E-Mail
WHO Jo Jewell World Health Organization [email protected]
WHO Lendert Nederveen World Health Organization [email protected]
WHO Chizuru Nishida World Health Organization [email protected]
WHO Luiza Villas World Health Organization [email protected]
WHO Stephen Whiting World Health Organization [email protected]
Rapporteur Karen McColl Consultant

ESAN April 2016 Meeting Report
Page 4
SPEAKERS
Country Name Organization E-Mail
Australia Jacqui Webster George Institute for Global Health [email protected]
France Cassi Belazouz GS1 [email protected]
Netherlands Ivon Milder National Institute for Public Health and the Environment (RIVM) [email protected]
Netherlands Ronald Visschers TNO [email protected]
Netherlands Susanne Westenbrink National Institute for Public Health and the Environment (RIVM) [email protected]
Portugal Elisa Keating University of Porto [email protected]
United Kingdom Francesco Cappuccio University of Warwick [email protected]
United Kingdom Feng J. He Wolfson Institute of Preventative Medicine [email protected]
United Kingdom Graham MacGregor World Action on Salt and Health (WASH) / Consensus Action on Salt and Health (CASH)
United Kingdom Kevin Knight Brandbank [email protected]


