P OLICY R ESEARCH WORKING P APER 4635 Who Are the Microenterprise Owners? Evidence from Sri Lanka on Tokman v. de Soto Suresh de Mel David McKenzie Christopher Woodruff The World Bank Development Research Group Trade Team May 2008 WPS4635 Public Disclosure Authorized Public Disclosure Authorized Public Disclosure Authorized Public Disclosure Authorized
Transcript
Policy ReseaRch WoRking PaPeR 4635
Who Are the Microenterprise Owners?
Evidence from Sri Lanka on Tokman v. de Soto
Suresh de MelDavid McKenzie
Christopher Woodruff
The World BankDevelopment Research GroupTrade TeamMay 2008
WPS4635P
ublic
Dis
clos
ure
Aut
horiz
edP
ublic
Dis
clos
ure
Aut
horiz
edP
ublic
Dis
clos
ure
Aut
horiz
edP
ublic
Dis
clos
ure
Aut
horiz
ed
Produced by the Research Support Team
Abstract
The Policy Research Working Paper Series disseminates the findings of work in progress to encourage the exchange of ideas about development issues. An objective of the series is to get the findings out quickly, even if the presentations are less than fully polished. The papers carry the names of the authors and should be cited accordingly. The findings, interpretations, and conclusions expressed in this paper are entirely those of the authors. They do not necessarily represent the views of the International Bank for Reconstruction and Development/World Bank and its affiliated organizations, or those of the Executive Directors of the World Bank or the governments they represent.
Policy ReseaRch WoRking PaPeR 4635
Is the vast army of the self-employed in low income countries a source of employment generation? This paper uses data from surveys in Sri Lanka to compare the characteristics of own account workers (non-employers) with wage workers and with owners of larger firms. The authors use a rich set of measures of background, ability, and attitudes, including lottery experiments measuring risk attitudes. Consistent with the International Labor Organization’s views of the self employed (represented by Tokman), the analysis finds that two-thirds to three-quarters of the own account workers have characteristics
This paper—a product of the Trade Team, Development Research Group—is part of a larger effort in the department to study microenterprise dynamics. Policy Research Working Papers are also posted on the Web at http://econ.worldbank.org. The author may be contacted at [email protected].
which are more like wage workers than larger firm owners. This suggests the majority of the own account workers are unlikely to become employers. Using a two and a half year panel of enterprises, the authors show that the minority of own account workers who are more like larger firm owners are more likely to expand by adding paid employees. The results suggest that finance is not the sole constraint to growth of microenterprises, and provides an explanation for the low rates of growth of enterprises supported by microlending.
Who are the Microenterprise Owners?: Evidence from Sri Lanka on Tokman v. de Soto
Suresh de Mel, David McKenzie, and Christopher Woodruff*
* University of Peradeniya, World Bank, and University of California, San Diego, respectively. The authors thank Josh Lerner, Antoinette Schoar, Tavneet Suri and participants of the NBER conference on International Differences in Entrepreneurship for valuable comments and Susantha Kumara and Jayantha Wickramasiri for outstanding research assistance. AC Nielsen Lanka administered many of the surveys on which the data are based. Financial support from NSF grant numbers SES-0523167 and SES-0617424 is gratefully acknowledged. This paper was drafted in part while Woodruff was visiting LSE, whose support is also greatly appreciated.
The self employed make up around a third of the non-agricultural labor force in low-
income countries. A substantial majority of these self employed work alone, hiring no
paid employees. These own account workers represent half or more of the informal sector
in low-income countries. Is informality a way station on the road to wage work or a
stepping stone for nascent entrepreneurs? The academic and policy worlds have widely
divergent views on this question. Victor Tokman, espousing a view associated with the
International Labor Organization (ILO), suggests that that the army of own account
workers is marginalized and biding time until an opportunity for wage work arises:
“Informal activities [arise from] the failure of the economic system to create enough
productive employment” (Tokman 2007).1
Hernando de Soto is perhaps the best known exponent for a very different point of
view. Starting with The Other Path in 1989, de Soto has held that microenterprise owners
are entrepreneurs who, but for constraints they face on various fronts, might well run
larger enterprises. In an interview with the New York Times in 1992, de Soto states:
"[The own account workers] are in the informal sector because they have no choice. They
have no access to credit. They cannot get their business application approved. Or they are
just prohibited from opening such a business. They have nowhere else to go.” (NY Times
March 21, 1992).2
These divergent views are reflected in the work of other academic researchers as
well. Fields (1975) developed an early model of the informal sector as a way-station of
those queuing for a formal job in urban areas. Others have followed this line. (See Fields
2004 for a review.) Bennett and Estrin (2007) are among those modeling the
microenterprises as a stepping stone to formal business ownership. In their model,
entrepreneurs start in the informal sector because entry costs are lower. After learning
1 To be fair to Tokman’s view, he goes on to say: “This debate has evolved in the last few years, resulting in a substantial narrowing of the gap which had existed between those who argued in favour of the simplistic notion that legislative or procedural changes are enough to overcome the existing problems and those who denied the role of regulatory arrangements relating to the economic system.” We believe the distinction we draw between the two views of informality is valid. But we confess to choosing quotes which make the differences in views sharper than most of those involved in the debates would admit. 2 De Soto’s view has had a significant impact on both research and policy. Djankov et al (2002) measure the time and monetary costs of registering a business in 75 countries. Kaplan, Piedra, and Seira (2007) and Bruhn (2007) analyze the impact of a policy simplifying the registration scheme in Mexico, reaching somewhat contradictory conclusions with respect to the impact on the formation of new businesses.
about the demand for their products, they decide whether to move to the formal sector
and expand, or to shut down.
The heterogeneity of the informal sector in low-income countries allows each side
to cite at least anecdotal evidence supporting its own story. But we are unaware of any
study which takes these arguments to the data in a systematic way with samples
representative of both the informal sector and larger firm owners. In this chapter, we aim
to provide such a systematic comparison of wage workers, own account workers, and
employers, using data from surveys in Sri Lanka. The wage worker and larger firm
surveys are cross-sectional; the own account worker data come from a survey begun in
April 2005, with the most recent survey conducted in October 2007. We use both the
cross sectional comparison and the dynamics from the microenterprise panel.
There are at least two lines of empirical research which are related to our analysis.
William Maloney and coauthors use labor market surveys in several Latin American
countries to study the pattern of transition into and out of self employment and the
informal sector more generally. These data show high rates of mobility between formal
wage work and informal self employment in all of the countries examined (Maloney
1999; Bosch and Maloney 2007; Bosch, Goni, Maloney 2007). Moreover, a large
majority of own account workers report being self employed by choice rather than by
force, for the lack of available wage jobs. Perhaps the strongest evidence that the self
employed are drawn by opportunity is that in Mexico, at least, transitions from formal
wage work to informal self employment are procyclical (Bosch and Maloney 2007).
Collectively, the Maloney et al analysis indicates the lack of any hard barrier between
wage work and self employment in the Latin American countries. But most of their
findings are also consistent with a Lucas-style decision model (Lucas 1978), where those
with low levels of entrepreneurial ability move between wage work and self employment
as economic opportunities change. Because the Latin American labor data are limited to
overlapping one-year panels, they tell us less about whether those transitioning to self
employment subsequently grow to become employers.3
3 Woodruff (2007) questions how much of this mobility is sustained rather than representing short term churn.
Simeon Djankov and coauthors have complied data which allows a broader
comparison of the attitudes, abilities and work histories of wage workers and owners of
enterprises with at least five employees in Russia, China and Brazil (Djankov et al, 2005,
2006). Own account workers are intentionally left out of the sample in order to sharpen
the distinction between wage workers and entrepreneurs. Our analysis is closest in spirit
to that of Djankov et al, but we explicitly bring the own account workers into the
comparison and also include a greater range of owner characteristics. From a policy
perspective, understanding who the own account workers are is critical given their weight
in the labor force. If the sector is an incubator for larger firms, then policies should aim to
help microenterpreneurs grow and generate employment. If, on the other hand, the
owners of the smallest businesses are unlikely to grow to be employers, then policies
aimed at job generation should focus instead on constraints to growth among those who
are already employers above some threshold and there is less reason to encourage growth
of the smallest enterprises.
We begin by discussing how the characteristics of entrepreneurs in developing
countries might be affected by the weak institutional environment in which they operate.
We next describe the surveys and data and then examine differences in family
background, education and ability, attitudes toward risk and measures from the
entrepreneurial psychology literature between the three groups. Our wage worker and
own account worker samples are nearly evenly split by gender. But the larger firm owner
sample is predominantly male, reflecting the population of larger firms. Therefore, after
presenting the full results, we separate the sample by gender and show where this affects
the findings.
Entrepreneurship in developing and developed economies:
Entrepreneur is derived from the old French term entreprendre, meaning one who
undertakes. In standard definitions the word is defined simply as someone who
undertakes to own and manage a business, taking the risk of profit or loss (see Oxford
English Dictionary). In addition to risk, economists often associate entrepreneurs closely
with innovation – Schumpeter (1934) defining an entrepreneur as one who implements
change in markets through the carrying out of new combinations, moving the market
away from equilibrium. Others such as Israel Kirzner instead view the entrepreneur as
someone who moves the market towards equilibrium by recognizing and acting upon
market opportunities (Kirzner, 1979).
Risk and innovation are the two characteristics most closely associated with
entrepreneurs. But the empirical literature has also suggested several other characteristics.
Lazear (2005), for example, focuses on the need for entrepreneurs to be jacks of all
trades. This need has both a cross-sectional and time-series component. A wage worker,
even a manager in a large firm, may specialize in one aspect of the business, but the
entrepreneur has the need to direct many dimensions of the development, production and
sales of products. Lazear finds that MBA students who later become entrepreneurs take a
greater range of classes with in business school than those who become managers in
larger companies. At any point in time, we might expect entrepreneurs to be multi-taskers
as well. Wage workers may focus on a much narrower set of tasks. The entrepreneurial
psychology literature has termed the ability and willingness to juggle many tasks in the
cross section polychronicity (Bluedorn et al. 1999). The willingness to take risks is often
viewed as an innate characteristics, but aspects of being an entrepreneur may also be
learned. Dunn and Holtz-Eakin (2000), for example, find that those whose parents are
entrepreneurs are more likely to become entrepreneurs themselves.
All of these factors are generally collapsed into a single term in theoretical models
of occupational choice. Lucas’ (1978) model of the size distribution of firms, for
example, starts from the premise that individuals face the choice of working as a wage
worker at the prevailing wage w, or becoming an entrepreneur and residual claimant of a
firm whose output depends on the capital and labor used in production, and on the
entrepreneur’s ability level, denoted as θ. Thus, each individual considers starting an
enterprise with output Y = θ K(α) L (β-α) , where α<β<1 sets a finite size for the enterprise.
At optimal levels of capital and labor (which depend on θ), L*(θ) and K*(θ), the profit
from self employment is Y(K*( θ), L*( θ)) – wL*( θ) – rK*( θ). In the absence of any
constraint, each individual weighs this against the wage s/he would earn in the labor
market, and chooses the occupation with the higher earnings.
But constraints are seldom entirely absent, especially in developing countries.
There has been quite a lot of focus on the importance of financial constraints in
determining both occupational choice and firm size (Evans and Jovanovic 1989,
Blanchflower and Oswald 1998?, Banerjee and Duflo 2005). Hurst and Lusardi (2004)
suggest that some of the evidence on capital constraints might instead be interpreted as
reflecting the fact that aversion to risk falls with wealth. There is also the fact that an
entrepreneur may not know his ability level before beginning the business. Jovanovic
(1982) develops a model in which learning is important. Cabral and Mata (2003) are
among those finding a relationship between firm size and firm age consistent with
learning after entry.
Most of the empirical literature we have referenced uses data from high-income
countries. There are reasons to believe that entrepreneurship differs in developing and
developed countries for several reasons that may affect which factors differentiate
entrepreneurs from wage workers. First, risk is likely to play a larger role and innovation
a commensurately smaller role. The instability of the political and economic environment
increases uncertainty of outcomes. Fewer firms operate at the cutting edge
technologically. Technologies are likely to be adopted rather than invented in developing
countries. Second, agency problems are arguably greater in developing countries. The
difficulty of using courts and the scarcity of formal information systems makes
delegation of authority within enterprises more problematic. This makes both arms length
contracting across firms and separation of ownership and management within firms more
difficult. We might expect the local social and political connections to matter more in
more hostile institutional environments.
Third, agency issues and lower levels of formal schooling in the labor force make
management of workers more challenging. Labor regulations which raise hiring and
firing costs also contribute to making labor management more challenging. Combined
with the difficulty of separating ownership and management, this implies that
entrepreneurial outcomes will depend on managerial ability to a greater extent than is the
case in developed countries.
Fourth, the market for business services is likely to be thinner in developing than
developed countries. This implies that entrepreneurs must possess a greater range of
skills themselves. Note that even in developed countries, entrepreneurs have been found
to be jacks-of-all-trades, less specialized than managers (Lazear 2005; Wagner 2003). We
should expect a broad-based skill set, and the desire to juggle many tasks simultaneously,
to be more important in a developing country context.
All of these factors collectively suggest that (self) selection of entrepreneurs from
the population may differ in developing and developed countries. Unfortunately, the
manner in which the entrepreneurial skill set has been assessed across countries is rather
ad hoc. This makes comparison of the factors associated with selection into
entrepreneurship difficult to compare internationally.
The combined theoretical and empirical literature therefore suggests a rich set of
factors differentiating entrepreneurs from wage workers in both unconstrained and
constrained environments. We draw on this literature to identify the relevant factors for
placing the own account workers on the wage worker – entrepreneur scale. Our interest in
undertaking this exercise is practical: From a policy perspective, should we focus on the
own account workers as a potential source of job growth? Or should we instead focus on
increasing incomes of the self employed where possible, in the interest of poverty
alleviation, while looking elsewhere for the generation of jobs which these own account
workers will fill?
Data and empirical approach
We use data from a series of surveys carried out in Sri Lanka between 2005 and
2007. The first is a survey of 618 own account workers, selected from three districts in
south and southwestern Sri Lanka, which we refer to as the Sri Lankan Microenterprise
Survey (SLMS). The own account workers were surveyed quarterly between April 2005
and April 2007, and then again in October 2007. Each survey included questions on the
operating performance of the firms during the month preceding the survey, and questions
on additional topics which varied from quarter to quarter. For example, in the July 2005
survey, we played a lottery game from which we measure attitudes toward risk. In the
January 2006 survey, we recorded data on the labor history of respondents; and in the
October 2007, we gave the respondents a Raven progressive non-verbal test of reasoning.
The survey questions relevant to the analysis here are discussed in more detail in the
following section.
As with any panel, there was some attrition across rounds of the survey. However,
the attrition was much less than we had anticipated, and the October 2007 survey
includes 528 enterprises.4 The project also included random grants of roughly $100 or
$200, which were provided to just under 60 percent of the enterprises in the sample in
either May 2005 or November 2005. These grants were intended to generate exogenous
shocks to capital stock against which we can measure returns to capital. De Mel,
McKenzie and Woodruff 2007a and 2007b explain the grants in more detail. For the
purposes of this paper, we note only that receiving a grant does not appear to have any
effect on the variables of interest. That is, even though we obtained information on
entrepreneurial attitudes after the lottery draw, the responses of the grant recipients do not
differ from the responses of the non-recipients.5
In July 2007, we carried out two additional surveys in the same geographic area
of Sri Lanka. Sampling at the household level in the same GNs from which the own
account workers were selected, we identified 456 wage workers working at least 30 hours
per week. To these wage workers we administered a survey gathering information on
their current jobs, labor history, family background, and attitudes. We also gave them
digitspan recall and Raven non-verbal reasoning tests, and played a lottery game to
measure risk aversion. Most of the questions were taken from previous rounds of the
SLMS.
The second survey we carried out in July 2007 was with 424 owners of
enterprises hiring between 5 and 50 employees. Some of these were identified through
the household screen used in the wage survey. The majority came from identifying and
approaching visible businesses. The sample of business owners comes from the same
GNs in which the own-account and wage worker samples were selected, and from nearby
GNs as well. The latter we added because we did not identify a sufficient number of
larger businesses in the original set of GNs. The survey of larger firm owners was
identical to the survey of wage workers, with two exceptions. First, we added a short
section gathering operating data on the enterprise. Second, questions on attitudes toward 4 Not every firm provided information on operating data in every round, but the response rates to the questions we use in the analysis here are nearly always close to 100%, conditional on being surveyed. 5 There is a difference in responses between the treated and untreated SLMS samples in only one of the questions asked after treatments were given. By one measure, those receiving treatment have higher financial literacy, though the difference is significant at only the .07 level.
work and the selection of self employment over wage work were modified to reflect the
fact that the respondents are business owners rather than wage workers.
Taken together, the three samples provide survey data on wage workers,
microenterprise owners, and larger firm owners. They breadth of information generated
by the surveys for each of these three types of workers is, to our knowledge, unique. We
use the data to compare the characteristics of the own account workers with wage
workers on the one hand and larger firm owners on the other. We examine family
background, measures of ability, attitudes toward risk, labor history, and measures from
the entrepreneurship psychology literature. The specific measures are discussed in more
detail in the following section. We then turn to techniques of species classification, using
all or part of this list of characteristics. This allows us categorize each own account
worker as having characteristics more like the employers or more like wage workers.
Who are the Own Account Workers?
We begin with simple comparisons of means of variables divided into six
attitudes toward risk, and psychological measures. One important difference in the
samples is worth noting. Males make up a much larger portion of the SME sample than
of either the wage worker or SLMS samples. Seven in eight SME owners (87%) are
male, compared with 51% of the SLMS owners and 64 percent of the wage workers.6
There are also some differences in the average age of the respondents in the three
samples. By design, all are between the ages of 20 and 65. On average, the SME owners
are the oldest (43.6 years of age), the SLMS owners next oldest (41.9 years) and the wage
workers the youngest (37.6 years). As we point out later in discussing the labor history
data, surprisingly few of the own account workers say they have ever been wage workers.
But previous wage work is more common among the SME owners. So the difference in
average age may reflect these transitions from wage work to self employment.
For all of the tables, we will show own account workers in the middle, with SME
owners on the left and wage workers on the right. The column between the SME owners
and the own account workers shows the level of significance of the difference in means
6 All three samples were stratefied to include a larger share of females than represented by the population.
between these two samples; the column between the own account and wage workers
shows the significance of differences in means between these two samples.
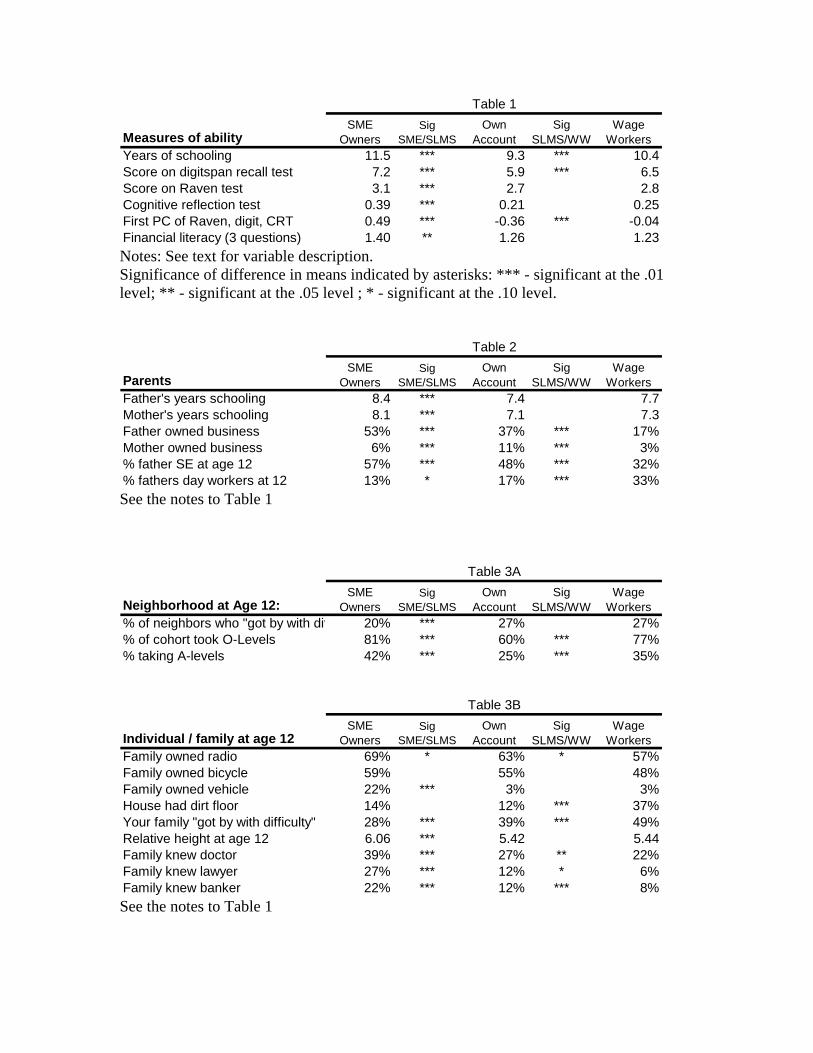
Table 1 displays differences in several measures of ability. In addition to years of
schooling, we tested respondents in three ways. First, we conducted a forward digitspan
recall test. Respondents were shown a three digit number. The card showing the number
was then taken away. Ten seconds later, respondents were asked to repeat the number as
written on the card. Those responding correctly were shown a four digit number, and so
forth up to 11 digits. The table shows that SME owners were able to recall just over 7
digits on average, while own account workers recalled just under six on average.
The second ability measure comes from a Raven progressive non-verbal
reasoning test. We provided 12 printed pages, each of which contained one 3 by 3 pattern
with one cell missing. Below the pattern were eight figures, one of which fit the pattern,
and the other seven of which did not. The patterns become progressively more difficult
from the first to the 12th page. Respondents were given five minutes to complete as many
of the patterns as possible. They were instructed to skip as desired, but told that the
patterns became progressively more difficult. The average respondent completed three of
the patterns correctly.7
Finally, we administered a localized version of Frederick’s three question
cognitive reflection test (Frederick 2005). The test asks, for example: “A bat and a ball
cost Rs. 1100 in total. The bat costs Rs. 1000 more than the ball. How much does the ball
cost?.” Fewer than one in three of the respondents answered any of the three questions
correctly. We also use years of schooling and the response to three questions measuring
financial literacy as measures of ability.8
The pattern of ability is consistent by almost all measures: The ability of own
account workers is lower than both the SME owners and wage workers. The gap with
respect to SME owners is significant at the .01 level for all but financial literacy, where
the significance level is .05. SME owners have just two years of additional schooling,
answered correctly 0.18 more of the cognitive reflection questions correctly (both two-
7 We used the same version of the Raven used in the Mexican Family Life Survey (Rubalcava and Teruel, 2004) 8 The measure of financial literacy comes from Lusardi and Mitchell, 2006.
thirds of a standard deviation), and recalled 1.3 more digits (.85 of a standard deviation).9
On the Raven and financial literacy tests, the gaps were smaller, 0.4 questions or one-
fifth of a standard deviation for Raven and 0.14 or one-third of a standard error for
financial literacy. The table also shows the first principal component of the Raven,
digitspan and CRT tests.
We find no difference between wage workers and own account workers in the
Raven, CRT or financial literacy tests. Wage workers are able to recall more digits, a
difference which is statistically significant at the .10 level but which represents only
about a third of a standard deviation. They also have 1.1 more years of schooling on
average. For ability measures, then, score one for Tokman’s view. Own account workers
appear to be closer to wage workers than to SME owners. These findings are also
consistent with the Lucas framework with the more able self employed owning larger
enterprises.
We next examine differences in parental background. (See Table 2.) For parent’s
schooling, the pattern is the same as for ability. The parents of SME owners have higher
schooling than the parents of wage workers, whose parents have insignificantly higher
schooling than the parents of own account workers. The gap between SME owners and
own account workers is 1 year for either parent, about one-third of a standard deviation.
However, the parents of both SME owners and own account workers were much more
likely to have been self employed when the respondent was 12 years of age than were the
parents of wage workers.
That mothers of the own account workers were more likely and the fathers were
less likely to be self employed than for SME owners may suggest differences in income
levels during childhood between these two groups. Table 3 contains other indications of
childhood income, from a series of questions we asked each of the three groups about
their life when they were 12 years of age. We first asked what percentage of the
respondents neighbors “did not have enough to eat or sometimes got by with difficulty.”
We also asked what percentage of the respondent’s childhood cohort sat for the O-level 9 Even SME owners do not compare favorably with other groups on CRT scores. Frederick reports averages for students at nine universities in the United States ranging from 2.18 (MIT) to 0.59 (University of Toledo). A sample of first and fourth year undergraduates at the University of Peradeniya averaged 0.94 correct responses, with engineering students doing significantly better than students in the arts and humanities (1.49 correct vs. 0.38 correct on average).
exams (to pass into upper secondary school) and the A-level exams (final year
examinations used for university entry). All of these are intended to measure childhood
wealth levels. Childhood wealth might affect occupational choice through the quality of
schooling, access to financial capital, or other channels.
We find that SME owners report a significantly smaller percentage of their
childhood neighbors were poor, and a significantly higher portion of their childhood
peers sat for both the O-level and A-level exams. Own account workers and wage
workers report that the same percentage of their neighbors were poor (27%), but wage
workers report that a larger percentage of their childhood cohorts sat for the O-levels and
A-levels. By these measures, SME owners appear to have been brought up in the
wealthiest neighborhoods and own account workers in the poorest neighborhoods.
The bottom half of Table 3 looks at the respondents own family rather than the
neighborhood. We measure both family assets and family connections. One caveat to the
asset measures is that circumstances change both across time and across rural / urban
areas. The different ages of the owners means that they were 12 during different years.
Those in rural areas may not have had radios or televisions not from a lack of wealth, but
because the radio or television signal coverage did not reach them. With these caveats in
mind, we find only two significant differences in asset measures. SME owners are much
more likely to report that their family owned a car, while wage workers are more likely to
report that they lived in a house with a dirt rather than cement floor. The pattern these
responses suggest is consistent with the percentage of each group saying that their own
family “sometimes did not have enough to eat or got by with difficulty.” Among SME
owners, only 28 percent of respondents say this was the case, compared with 39 percent
of own account workers and 49 percent of wage workers. We also asked respondents
about their relative height at age 12. Showing them a ladder with rungs labeled 1 through
10, we asked them to place themselves on the ladder if the tallest member of their cohort
was at the top and the shortest at the bottom. Both own account and wage workers place
themselves near the middle, an average of 5.4 on the scale. SME owners say they were
significantly taller, 6.1 on the scale. The gap represents about 0.4 of a standard deviation.
Labor history and attitudes
We asked each individual to divide their work history into years as a wage
worker, a self employed worker, an overseas worker, and an unpaid family worker or
apprentice. Perhaps the most surprising finding is that more than half of the own account
workers have spent their entire working life as a self employed worker. Only a third have
ever been a wage worker, and only 5% have worked overseas. SME owners are
significantly more likely to report having been a wage worker at some point during their
life (45 percent).
We measure two attitudes suggested by two different strains of the
entrepreneurship literature: attitudes toward risk and psychological measures. We
measure risk in two ways. First, we conducted a lottery exercise with payoffs
representing between a few hours and a few days wages. For the own account workers,
we asked for behavior on three separate lotteries. We then rolled a ten-sided die and
played one of the lotteries for real money. The payoffs were 40 rupees for the certain
outcome and 100 rupees for the risky outcome. These represent about 3 hours and one
day’s reported mean earnings for the own account workers. Before actually playing we
asked respondents which outcome they would choose as the probability of winning varied
from 10 to 100 percent. We use these responses to calculate a coefficient of relative risk
aversion.
For both the SME owners and wage workers, we first conducted the lottery
exercise with the same payoffs. We then repeated the exercise with both the certain and
risky payoffs increased by a factor of five. Since SME owners have much higher incomes
than either own account or wage workers, the higher payoffs we used to come closer to
matching the payoffs ass a proportion of income. In practice, only a few respondents
changed their behavior with the higher payoffs. The CRRAs shown on Table 5 therefore
use the 40/100 payoffs for all three groups. A higher CRRA indicates more aversion to
risk. The lottery exercise produces results which run counter to expectations. SME
owners are the more risk averse than either own account or wage workers.
We obtain results more in line with expectations by asking more general questions
about the willingness to take risks. Respondents were asked how willing they were, on a
scale of one to ten, to take risks in life, and how willing they were to take financial risks.
SME owners are the most willing to take risks (6.9 for life risks and 5.6 for financial
risks), and wage workers least willing to take risks (6.2 for life risks and 5.3 for financial
risks). These ranking are more in keeping with expectation. By these measures, own
account workers are intermediate between wage workers and SME owners.
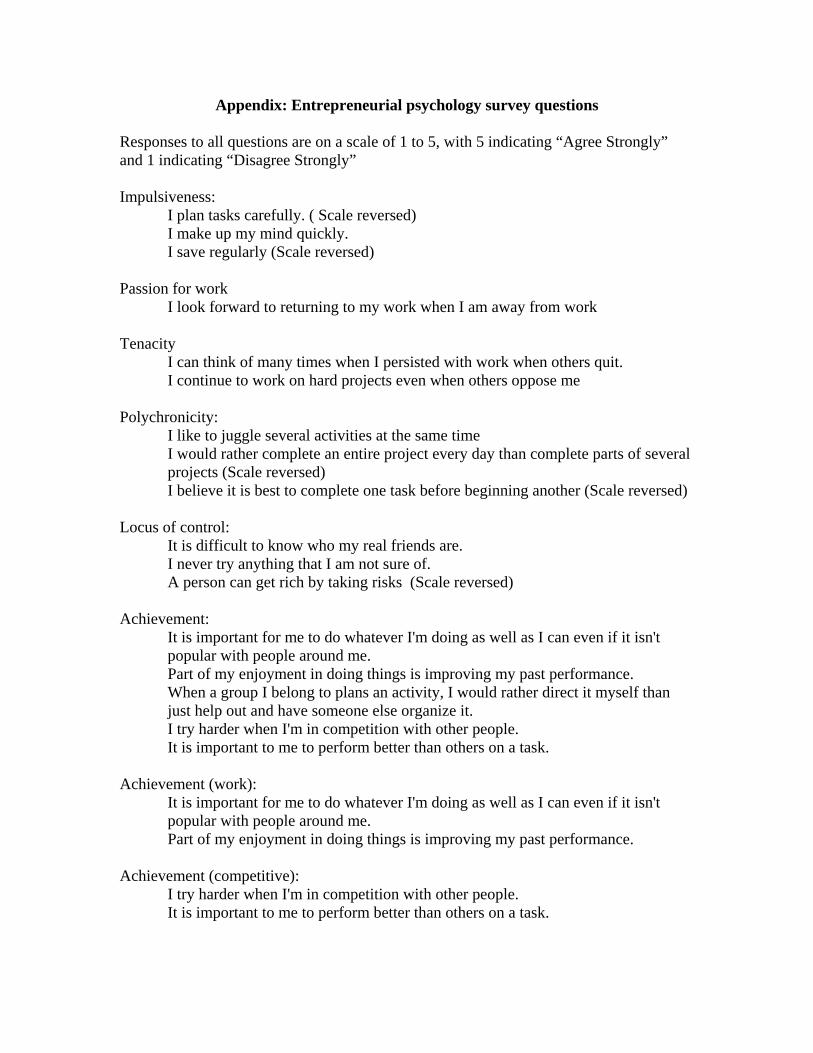
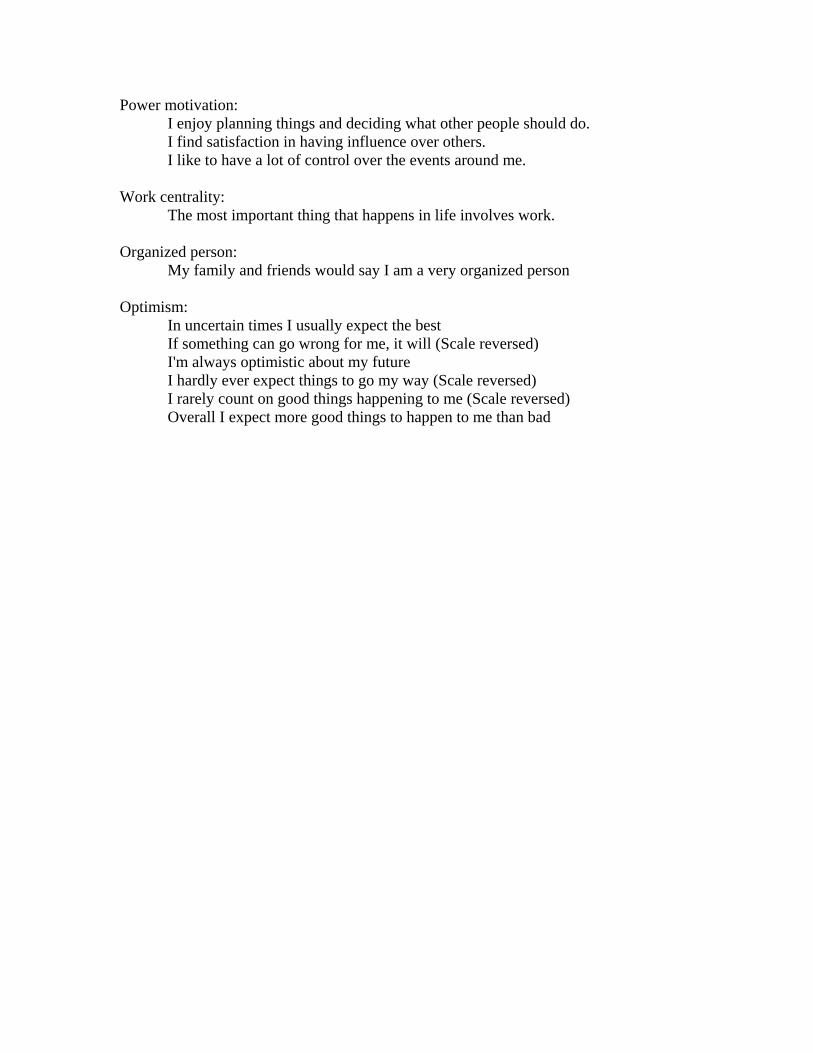
Each of the surveys contains questions developed by industrial psychologists to
measure aspects of the entrepreneurial personality. These are shown on Table 6. The
appendix shows the actual questions, grouped in the manner they are used in the literature
and in this paper. Responses to all questions are coded on a scale of one to five, with one
indicating “strongly disagree” and five “strongly agree.” In some cases, the question is
reversed with respect to the characteristic being measured, so that strongly disagree
indicates having the trait and strongly agree indicates not having the trait. These are
adjusted in calculating the variables.
The first three rows measure work centrality (Mishra et al, 1990), tenacity (Baum
and Locke, 2004) and achievement (McClelland 1985). Work centrality is measured by a
single question related to the importance of work in life. Tenacity measures the extent to
which individuals persist in difficult circumstances. Achievement is measured as the sum
of five questions related to the satisfaction obtained from doing well and a feeling of
competition with others.
All three of these are measures of personal motivation in work and life. The
responses show a consistent pattern: Both SME owners and wage workers are more
motivated than own account workers. In all three cases, the rank ordering of responses
shows that SME owners are the most tenacious and work-motivated, and own account
workers are least tenacious and motivated, with wage workers placed in between. These
data point to motivation and determination as important determinants of firm size.
The next two measures are power motivation (McClelland 1985) and internal
locus of control (Rotter, 1966). Power motivation is measured with three questions
related to planning and deciding what other people should do and control over events.
Internal locus of control is a measure of the willingness to take risks and put oneself in
unfamiliar circumstances. With respect to power motivation, own account workers are
similar to SME owners, and both have a stronger desire to be in control than wage
workers do. The pattern with respect to staying in situations which are familiar is
interesting. Here we find that SME owners are more willing to put themselves in
unfamiliar situations than are either own account or wage workers, who do not differ in
this attitude.
The third set of variables measures polychronicity, impulsiveness and
organization. Polychronicity is the willingness to juggle tasks rather than focusing on a
single task at a time (Bluedorn et al. 1999). Impulsiveness is measured by three questions
on the Barratt Impulsiveness Scale relating to the speed of decision making and savings
behavior. Organization is measured by a single question asking whether the respondent’s
family and friends would call him/her organized. Own account workers are more
impulsive and less organized than either SME owners or wage workers. They are,
however, more comfortable juggling tasks that wage workers.
The final attitude measure relates to optimism, which has been found to have a
mixed association with the success of firms. (See, for example, Landier and Thesmar,
2006.) We measure optimism with six questions related to expectations of good or bad
events occurring in life. We find that SME owners are the most optimistic, followed
closely by own account workers. Wage workers are the least optimistic.
The entrepreneurial attitudes questions show interesting patterns and differences
with respect to the position of own account workers. The willingness to juggle tasks and
the desire to be in control separate own account workers from wage workers. Motivation
and tenacity separate SME owners from own account workers. The former are clearly
important to running a business. But the latter may determine whether the business is
large or small.
Logit regressions
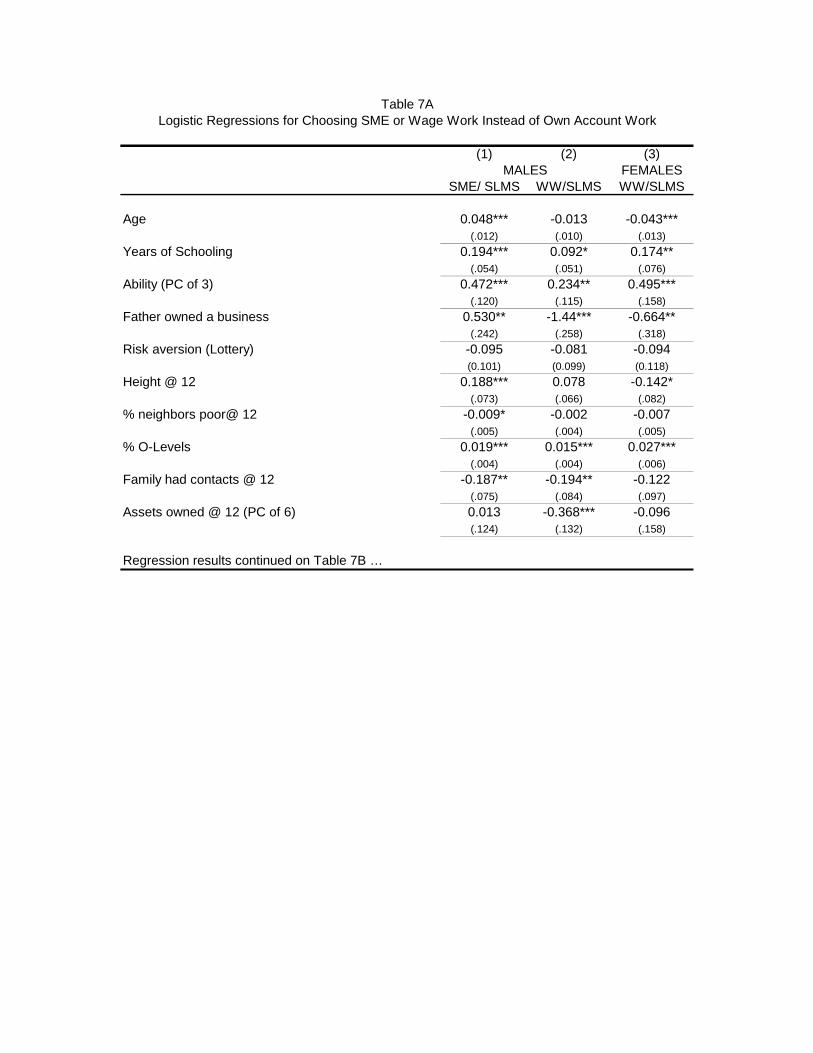
Table 7 report results from logistic regressions distinguishing own account
workers from SME owners on the one hand and wage workers on the other. The logits
allow us to separate males and females and to confirm the importance of variables when
conditioning on other variables. There are very few female SME owners in the sample, so
we present only the own account / wage worker regressions for females. We split the
results into two sections for purposes of exposition, with Table 7A focusing on ability
and family / childhood background variables, and Table 7B focusing on entrepreneurial
attitudes. Both sets of variables come from the same regressions.
The first column on Table 7 shows factors affecting the likelihood of being an
SME owner rather than an own account worker in the sample of males which excludes
wage workers. SME owners are older and have significantly higher schooling and ability,
the latter measured by scores on the Raven, digitspan and cognitive reflection tests. Their
fathers were more likely to be self employed. SME owners also say they were taller
relative to their peers at age 12, had fewer neighbors who were poor, and that a higher
percentage of their peers sat for the O-level exams. Somewhat surprisingly, they say their
families were less likely to know a doctor, lawyer, or banker when they were age 12.
Notably, we find no difference in willingness to take risks, measured as the first principal
component of the overall life risk, financial risk, and CRRA calculated from the lottery
exercise. In sum, SME owners are older and more able, and by most measures come from
a somewhat more privileged background than own account workers.
Compared with own account workers, male wage workers (Column 2) are
insignificantly younger and have somewhat higher ability than own account workers,
measured both by years of schooling and by the three ability tests. Their fathers were
much less likely to have been self employed. They also come from neighborhoods in
which a larger share of their peers took the O-level exams. Again, we find no difference
with respect to willingness to take risks. Thus, for males, own account workers have the
lowest ability measures, and come from neighborhoods with lower schooling levels.
However, own account workers report that their families owned more assets and were
better connected, in the sense of knowing teachers, bankers and other officials when they
were 12 years of age.
For female wage workers, the selection on ability appears to be stronger than for
male wage workers. Again, own account workers have lower ability than wage workers,
but we find that both the schooling and tested ability measures are significant at least at
the .05 level. The magnitude of the coefficients is as large as in the male SME equation.
(Compare Column 3 with Column 1.) Female wage workers are significantly younger
than female own account workers. This stronger selection into wage work among females
could be the result of the types of wage jobs available to those in the sample. For males,
these jobs are most often physically very taxing. For females, they are more likely to be
garment or other light manufacturing. In any case, it appears that the positive selection
into wage work is much stronger for females than for males.
Table 7B shows the variables measuring attitudes. Again, recall that the
coefficients in 7A and 7B come from a single regression. Compared to SME owners, own
account workers are less competitive and have a greater desire to remain in control. They
are also less organized and somewhat more optimistic. Many of the same factors separate
own account workers from wage workers, and in the same direction. Wage workers have
less desire to be in control, are less optimistic and better organized than own account
workers. Compared with own account workers, wage workers say that work is more
important in their life. Among females, the only strong differentiation is the desire of own
account workers to maintain control of their environment. Wage workers are very slightly
more motivated by achievement than are own account workers.
In sum, the logistic regressions allow us to control for age and gender and
examine differences in background and attitudes among workers in the three groups. For
males, the data indicate that the own account workers are optimistic, unorganized, power-
motivated, low ability underachievers. For females, self employment appears to involve
much more negative selection on ability. Female wage workers are younger and have less
desire to control their environment.
Species Classification
Tables 1 through 7 differentiate the characteristics of own account workers from
those of SME owners and wage workers one characteristic at a time. While there are
some clear patterns, looking at the data in a disaggregated manner makes it difficult to
clearly classify own account workers as being more like SME owners or wage workers
on the whole. In other words, we are still short of being able to say whether Tokman or
de Soto’s portrait of own account workers is more accurate. We next turn to techniques of
species classification borrowed from biology to classify the own account workers.
Discriminant analysis is a tool commonly used by biologists to separate animals
or plants into species on the basis of easily measured characteristics. The basic idea is to
find the particular combination of the set of measured variables which best separates
individuals into their distinct species. There are two main uses for this in practice. The
first is similar to our logit regressions above, studying the set of variables to characterize
the nature of differences between species. The second use is to then use the fitted
combination of measured variables to predict the species of new animals or plants for
which only this vector of measured variables has been observed. This is particularly
useful in cases where the species of an animal can only be truly verified after exhaustive
and expensive testing, possibly resulting in killing the animal. Observing certain
characteristics of the animal instead allows it to be accurately classified without taking
such expensive and extreme measures.
We apply these techniques to classifying another elusive animal, the own-account
worker. Logistic discriminant analysis is first used to obtain the combination of observed
characteristics which best separates the wage workers from the SME owners. This fitted
model is then used to predict the “species” of each own account worker, enabling us to
characterize them into wage workers and SME owners. Estimation was carried out in
STATA 10.0.
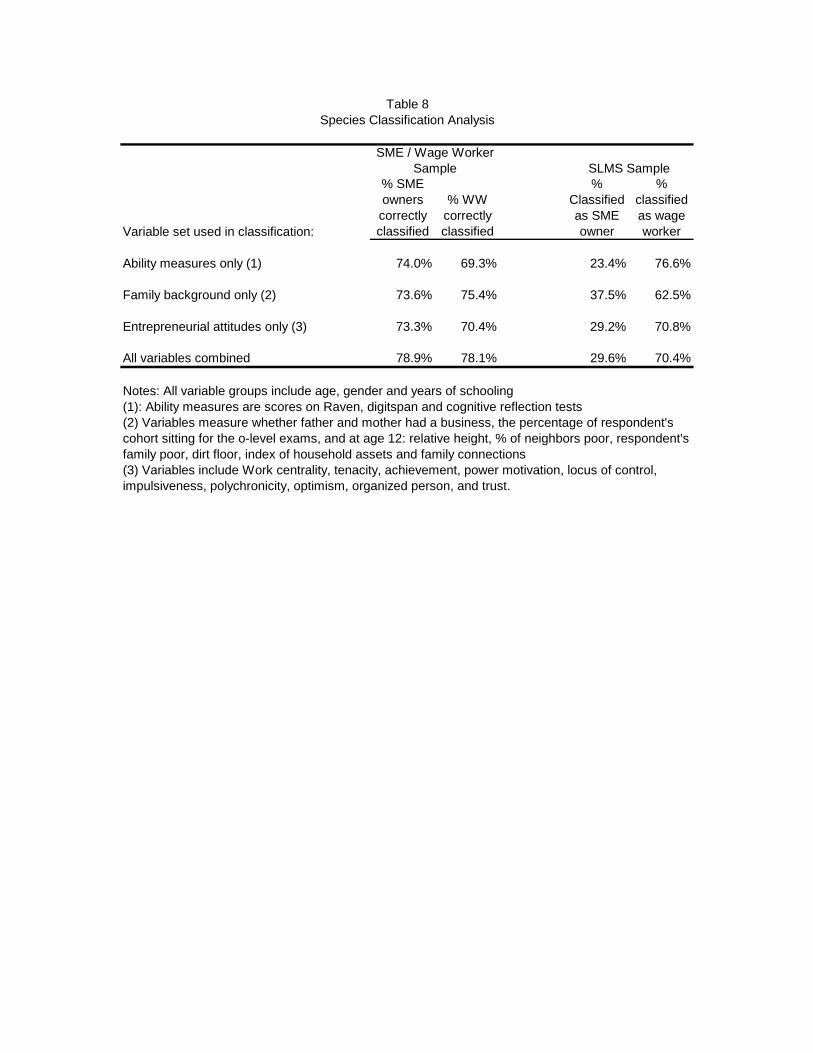
Table 8 shows the results of classifications using different subsets of variables.
We use four overlapping groups of variables in the classification analysis. Gender, age
and education are included in each of the groups. In addition to these variables, the first
group of variables includes the three ability tests: Raven, digitspan and CRT. The second
group includes family background variables, including whether the respondent’s mother
and father owned a business, the percentage of neighbors who were poor, the percentage
of the neighborhood cohort sitting for the O- and A-level exams, and others listed on
Table 8. The third group focuses instead on entrepreneurial attitudes: risk, achievement,
work centrality, and others. The final group includes combines all of the variables from
the first three groups.
We show first the percentage of the SME and wage workers properly classified by
each set of variables. Classifying using only age, gender, education and the three ability
variables results in a correct classification of 74 percent of the SME owners and 69
percent of the wage workers. Family background alone allows us to classify 74 percent of
both wage workers and SME owners correctly. Attitudes by themselves classify a slightly
lower percentage of the respondents correctly: 73 percent of SME owners and 70 percent
of wage workers. Using both sets of variables combined results in 79 percent of SME
owners and 78 percent of wage workers being classified correctly. Since a coin flip
would classify 50 percent correctly, we might think of this as close to a 60 percent
improvement over random classification.
Do the characteristics of the own account workers lead them to be classified as
SME owners or wage workers? In all cases, the majority of own account workers are
classified as wage workers. The largest percentage—almost 77 percent—are classified as
wage workers when we use the ability measures alone. The largest percentage are
classified as SME owners—37 percent—when we use only family background. Using all
of the variables, we classify 70 percent of the own account workers as wage workers and
30 percent as SME owners.10
The species classification analysis suggests that ability and attitudes differentiate
own account workers from SME owners more than family backgrounds do. While the
majority of the own account workers have characteristics more like wage workers than
SME owners, a significant minority are more like SME owners than wage workers.
Given the large number of own account workers in low-income countries, this suggests
the possibility of job creation from the sector should not be ignored.
Who Grows the Enterprise?
One criticism of the analysis to this point is that the comparisons between wage
worker, own account workers and SME owners are based on separate cross sectional
samples. We note that this is the standard in the literature. But for variables measuring
attitudes, we should be concerned that outcomes may have influenced attitudes. That is,
successful entrepreneurs may be more likely to report that work is central to their life,
even if they were no more likely to say that before they entered business. Ideally, we
would like to measure attitudes prior to the decision to enter self employment and the
realization of the success of the business.
We can use the panel aspect of the survey of own account workers to examine
growth of enterprises across time. The panel covers a period of two and a half years, from
the April 2005 survey through the October 2007 survey. One of the screening criteria for
10 If we limit the sample only to males, we classify 63 percent of the own account males as wage workers and 37 percent as SME owners using the full set of characteristics.
the panel was that the enterprise had no paid workers. Therefore, in the baseline survey,
no firms hire paid workers. By the October 2007 survey, just under nine percent of the
firms had hired one or more paid employees. Is this transition from non-employer to
employer associated with the same factors which differentiate own account workers from
SME owners in tables 1 through 8? If the same variables are association with growth in
the panel, then the case for a causal relationship is somewhat stronger.11
Table 9 shows the results of logistic regressions on the determinants of
employment growth in the microenterprise panel. The dependent variable takes a value of
one for the 8.8 percent of the sample adding at least one paid labor between April 2005
and October 2007, and zero otherwise. Given the relatively small number of enterprises
that add employees, we limit the number of variables included on the right hand side in
any specification. We find neither parental background nor childhood conditions to be
significant in any specification. The specification in the first column measures ability as
the first principal component of years of schooling and the scores on the Raven, digitspan
and cognitive reflection tests. The four entrepreneurial attitudes variables are measured as
in Table 6.
The results in column 1 are consistent with those in Table 7 with respect to ability
and motivation. Higher ability owners are more likely to have added employees, as are
owners who are motivated by personal achievement. Moreover, owners with lower power
motivation—that is, those more willing to give up some control over their situations—are
more likely to grow. In the second regression, we add the owner’s age at the time of the
baseline survey, and a variable indicating the owner is female. We find that older owners
are less likely to grow. On the surface this appears to conflict with the results from Table
7. However, Table 7 measures a stock, or cumulative hazard, while Table 9 measures a
flow or hazard, so the results with respect to age are actually not inconsistent. But, the
ability measure loses significance once we control for age. Years of schooling and age
are negatively correlating, reflecting the trend of increasing education across time. The
achievement and power motivation variables remain significant with little change in
11 Some of the questions were asked in later rounds, so one could still argue that they post-date the growth experience. For example, entrepreneurial attitudes were included in the survey administered in October 2006. Not enough firms grow after this point for analysis of growth following the responses to be possible.
magnitude. Note also that enterprises owned by females are much less likely to add paid
employees.
Employment growth is much more common among enterprises operating in the
manufacturing and services sectors, and very uncommon among retail shops. The first
two regressions include a dummy variable indicating the enterprise is a retail shop. The
third column drops the retail shops from the sample. The results are very similar when
the sample is limited to manufacturers.
Our species analysis classified about two-thirds of the own account workers as
wage workers and one-third as SME owners. Did a larger percentage of those classified
as SME owners add employees? The answer is yes: 13.8 percent of those classified as
SME owners added at least one paid employee, compared with 7.8 percent of those
classified as wage workers, a difference significant at the .06 level. Not only do we find a
difference in rates of growth, but the nearly 14 percent of SME-type enterprises that add
employees in less than three years time is much larger than comparable growth rates in
the United States suggested by Davis et al (2007).
Concluding Remarks
Are own account workers more like wage workers, or more like owners of larger
enterprises? The simplest answer to this question comes from our discriminant analysis.
We find that roughly two-thirds of the own account workers should be classified as wage
workers rather than entrepreneurs. The more detailed analysis uncovers several
interesting patterns. Most significantly, we find that ability, motivation and a competitive
attitude are very important in differentiation SME and microenterprise owners.
Controlling for these factors, family background and measures of childhood wealth and
well being are much less important.
The classification analysis suggests that capital is not the only, and perhaps not
even the primary constraint to growth for the majority of the own account workers. The
data thus shed light on the recent concern with the lack of dynamism among recipients of
microfinance. Microlenders are concerned that few enterprise owners grow large enough
to graduate to more formal lending programs. Our data suggest one explanation for this:
the majority of the microenterprise owners are more like wage workers than larger
enterprise owners in both cognitive ability, personality, and ambition. Indeed, on average
they place less emphasis on work than even wage workers. For a substantial part of the
microenterprises, the lack of growth is likely to derive from a lack of ability or desire to
grow, rather than a lack of finance.
While we find that only a minority of the own account workers have
characteristics making them like SME owners, the percentage of own account workers
who transition from non-employer to employer status in less than three years is far from
trivial. These results have important implications for policies directed at the vast army of
own account workers in Sri Lanka, and perhaps in other low-income countries as well.
They suggest the need for a set of differentiated policies. For the majority of own account
workers unlikely to grow, policies should focus on increasing income. But to the extent
that we can identify those with greater prospects for growth, policies toward them should
aim to aid the transition to employer status. We view the analysis of these data as only a
first step in the design of differentiated set of policies for the sector. We need a much
more nuanced and detailed understanding of those in the sector before appropriate
policies can be devised.
References Banerjee, Abhijit and Esther Duflo 2004, “Do Firms want to Borrow More? Testing Credit Constraints Using a Directed Lending Program,” working paper MIT. Baum, J. Robert and Edwin A. Locke (2004) “The Relationship of Entrepreneurial Traits, Skill, and Motivation to Subsequent Venture Growth”, Journal of Applied Psychology 89(4): 587-98. Bennett, John and Saul Estrin (2007) “Entrepreneurial Entry in Developing Economies: Modeling Interactions Between the Formal and Informal Sector,” working paper, London School of Economics. Blanchflower, David and Andrew Oswald (1998), “What Makes an Entrepreneur?”, Journal of Labor Economics 16(1): pp. 26-60. Bluedorn, Allen C., Thomas J. Kalliath, Michael J. Strube, and Gregg D. Martin (1999) “Polychronicity and the Inventory of Polychronic Values (IPV)”, Journal of Management Psychology 14(3/4): 205-231. Bosch, Mariano and William Maloney, 2007, “Comparative Analysis of Labor Market Dynamics using Markov Processes: An Application to Informality,” World Bank Policy Research Working Paper No. 4429. Bosch, Mariano, Edwin Goni, and William Maloney, 2007 “The Determinants of Rising Informality in Brazil: Evidence from Gross Worker Flows,” World Bank Policy Research Working Paper No. 4375. Bruhn, Miriam, 2007, “License to Sell: The Effect of Business Registration Reform on Entrepreneurial Activity in Mexico,” working paper, World Bank Cabral, Luís and José Mata, 2003, “On the Evolution of the Firm Size Distribution: Facts and Theory,” American Economic Review, Vol. 93(4), pp. 1075-1090. Davis, Steven J., John Haltiwanger, Ron S. Jarmin, C.J. Krizan, Javier Miranda, Alfred Nucci, and Kristin Sandusky, 2007 “Measuring the Dynamics of Young and Small Businesses: Integrating the Employer and Nonemployer Universes,” NBER Working Paper No. w13226. de Mel, Suresh, David McKenzie and Christopher Woodruff (2007a) “Returns to Capital in Microenterprises: Evidence from a Field Experiment”, World Bank Policy Research Working Paper No. 4230. de Mel, Suresh, David McKenzie and Christopher Woodruff (2007b) “Who does Microfinance Fail to Reach? Experimental Evidence on Gender and Microenterprise Returns”, BREAD Working Paper No. 157.
Djankov Simeon, Edward Miguel, Yingyi Qian, Gerard Roland, and Ekaterina Zhuravskaya, 2005 “Who are Russia’s Entrepreneurs?” Journal of the European Economic Association, Vol 3(2-3), pp. 1-11. Djankov, Simeon, Yingyi Qian, Gerard Roland, and Ekaterina Zhuravskaya, “Entrepreneurship in Brazil, China, and Russia,” CEFIR Working Paper No. w0066. Djankov, Simeon, Rafael La Porta, Florencio Lopez-de-Silanes and Andrei Schleifer 2002, “The Regulation of Entry,” Quarterly Journal of Economics, Vol. 117(1), pp. 1-37. Dunn, Thomas and Douglas Holtz-Eakin, 2000, “Financial Capital, Human Capital, and the Transition to Self-Employment: Evidence from Intergenerational Links,” Journal of Labor Economics, Vol. 18 (2), pp. 282-305. Evans, David S. and Boyan Jovanovic (1989) "An Estimated Model of Entrepreneurial Choice under Liquidity Constraints", The Journal of Political Economy 97(4): 808-827. Fields, Gary, 1975, “Rural-Urban Migration, Urban Unemployment and Underemployment, and Job Search Activities in LDC’s,” Journal of Development Economics, Vol. 2, pp. 165-88. Fields, Gary, 2004, “A Guide to Multisector Labor Market Models,” Working paper, Cornell University, Frederick, Shane, 2005, “Cognitive Reflection and Decision Making,” Journal of Economic Perspectives, Vol 19(4), pp. 22-45. Hurst, Erik, and Annamaria Lusardi (2004): "Liquidity Constraints, Household Wealth, and Entrepreneurship," Journal of Political Economy, 112(2): 319-347. Jovanovic, Boyan, 1982, “Selection and the Evolution of Industry,” Econometrica, Vol. 50, pp. 649-70. Landier, Augustin; Thesmar, David, 2006, “Financial Contracting with Optimistic Entrepreneurs: Theory and Evidence,” working paper, Stern School of Business, NYU. Lazear, Edward P., 2005, “Entrepreneurship,” Journal of Labor Economics, Vol 23 (4), pp. 649-80. Lucas, Robert E. Jr, 1978, “On the Size Distribution of Firms,” Bell Journal of Economics, Vol. 9, pp. 508-523. Lusardi, Anna-Maria and Olivia Mitchell (2006) “Financial Literacy and Planning: Implications for Retirement”, PRC Working Paper Series No. 2006-1
Maloney, William, 1999, “Does informality Imply Segmentation in Urban Labor Markets? Evidence from Sectoral Transitions in Mexico,” World Bank Economic Review, Vol. 13, No.2, pp. 275-302. McClelland, D.C. (1985) Human Motivation. Glenview, IL: Scott, Foreman. Mishra, S., R. Ghosh, and R. Kanungo (1990) “Measurement of Family Involvement: A cross-national study of managers”, Journal of Cross-cultural Psychology 21(2): 232-48. Rubalcava and Turuel, 2004, “The Role of Maternal Cognitive Ability on Child Health,” InterAmerican Development Bank, working paper R-497. Tokman, Victor, 2007, “Modernizing the Informal Sector,” UN/DESA Working Paper No. 42. Wagner, Joachim, "Are Nascent Entrepreneurs Jacks-of-All-Trades? A Test of Lazear's Theory of Entrepreneurship with German Data" (October 2003). IZA Discussion Paper No. 911 Woodruff, Christopher, 2007, “Self Employment: Engine of Growth or Self-Help Safety Net?” in Paci and Serneels, Eds., Employment and Shared Growth. Washington, DC: The World Bank
Measures of abilityYears of schooling 11.5 *** 9.3 *** 10.4Score on digitspan recall test 7.2 *** 5.9 *** 6.5Score on Raven test 3.1 *** 2.7 2.8Cognitive reflection test 0.39 *** 0.21 0.25First PC of Raven, digit, CRT 0.49 *** -0.36 *** -0.04Financial literacy (3 questions) 1.40 ** 1.26 1.23
Wage Workers
SME Owners
Sig SME/SLMS
Own Account
Sig SLMS/WW
Table 1
Notes: See text for variable description. Significance of difference in means indicated by asterisks: *** - significant at the .01 level; ** - significant at the .05 level ; * - significant at the .10 level.
ParentsFather's years schooling 8.4 *** 7.4 7.7Mother's years schooling 8.1 *** 7.1 7.3Father owned business 53% *** 37% *** 17%Mother owned business 6% *** 11% *** 3%% father SE at age 12 57% *** 48% *** 32%% fathers day workers at 12 13% * 17% *** 33%
SME Owners
Own Account
Wage Workers
Sig SME/SLMS
Sig SLMS/WW
Table 2
See the notes to Table 1
Neighborhood at Age 12:% of neighbors who "got by with dif 20% *** 27% 27%% of cohort took O-Levels 81% *** 60% *** 77%% taking A-levels 42% *** 25% *** 35%
Individual / family at age 12Family owned radio 69% * 63% * 57%Family owned bicycle 59% 55% 48%Family owned vehicle 22% *** 3% 3%House had dirt floor 14% 12% *** 37%Your family "got by with difficulty" 28% *** 39% *** 49%Relative height at age 12 6.06 *** 5.42 5.44Family knew doctor 39% *** 27% ** 22%Family knew lawyer 27% *** 12% * 6%Family knew banker 22% *** 12% *** 8%
Table 7BLogistic Regressions for Choosing SME or Wage Work Instead of Own Account Work
Variable set used in classification:
% SME owners correctly classified
% WW correctly classified
% Classified as SME owner
% classified as wage worker
Ability measures only (1) 74.0% 69.3% 23.4% 76.6%
Family background only (2) 73.6% 75.4% 37.5% 62.5%
Entrepreneurial attitudes only (3) 73.3% 70.4% 29.2% 70.8%
All variables combined 78.9% 78.1% 29.6% 70.4%
Notes: All variable groups include age, gender and years of schooling(1): Ability measures are scores on Raven, digitspan and cognitive reflection tests(2) Variables measure whether father and mother had a business, the percentage of respondent's cohort sitting for the o-level exams, and at age 12: relative height, % of neighbors poor, respondent's family poor, dirt floor, index of household assets and family connections(3) Variables include Work centrality, tenacity, achievement, power motivation, locus of control, impulsiveness, polychronicity, optimism, organized person, and trust.
Table 9Logistic Regressions for Addition of Paid Employees
SLMS Employment Growth
Note: Standard errors in parentheses. The regressions in columns 2 and 3 also include a variable indicating the enterprise is a retail shop.
Appendix: Entrepreneurial psychology survey questions Responses to all questions are on a scale of 1 to 5, with 5 indicating “Agree Strongly” and 1 indicating “Disagree Strongly” Impulsiveness:
I plan tasks carefully. ( Scale reversed) I make up my mind quickly. I save regularly (Scale reversed) Passion for work
I look forward to returning to my work when I am away from work Tenacity
I can think of many times when I persisted with work when others quit. I continue to work on hard projects even when others oppose me
Polychronicity:
I like to juggle several activities at the same time I would rather complete an entire project every day than complete parts of several projects (Scale reversed) I believe it is best to complete one task before beginning another (Scale reversed)
Locus of control:
It is difficult to know who my real friends are. I never try anything that I am not sure of. A person can get rich by taking risks (Scale reversed)
Achievement:
It is important for me to do whatever I'm doing as well as I can even if it isn't popular with people around me. Part of my enjoyment in doing things is improving my past performance. When a group I belong to plans an activity, I would rather direct it myself than just help out and have someone else organize it. I try harder when I'm in competition with other people. It is important to me to perform better than others on a task.
Achievement (work):
It is important for me to do whatever I'm doing as well as I can even if it isn't popular with people around me. Part of my enjoyment in doing things is improving my past performance.
Achievement (competitive):
I try harder when I'm in competition with other people. It is important to me to perform better than others on a task.
Power motivation: I enjoy planning things and deciding what other people should do. I find satisfaction in having influence over others. I like to have a lot of control over the events around me.
Work centrality:
The most important thing that happens in life involves work. Organized person:
My family and friends would say I am a very organized person Optimism: In uncertain times I usually expect the best If something can go wrong for me, it will (Scale reversed) I'm always optimistic about my future I hardly ever expect things to go my way (Scale reversed) I rarely count on good things happening to me (Scale reversed) Overall I expect more good things to happen to me than bad