Creative City in Cooperation and Harmony ATSUGI WHO Collaborating Centre on Community Safety Promotion Application report to be a member of International Safe Community March 2010 Atsugi City, Japan
Transcript
Creative City in Cooperation and Harmony
ATSUGI
WHO Collaborating Centre on Community Safety Promotion
Application report to be a member of International Safe Community
March 2010
Atsugi City, Japan
Logo of Safe Community Atsugi
<<Concept>>
This simple and adorable logo is made to give the image of cherishing and improving
safety and peace for all Atsugi citizens from new born babies and the elderly
Greeting from Mayor
Being located in the center of Kanagawa Prefecture, Atsugi City has been
taking important roles as a distribution hub to the Metropolitan Tokyo Area with
high developed transportation systems. On the other hand, our city enjoys
abundant nature such as the Sagami River and Tanzawa Mountain Range
which are surrounding the city.
These days, however, we have become to be faced to new challenges in the
improvement and management of safety and health of citizens under the
situations of rapid aging of the society, falling birthrate, weakened bond in the
community, residents’ increasing interest in regional autonomy lead by the movement of
de-cauterization of politics. Considering these trends, I strongly believe that strategies of Safe
Community provided by the WHO Collaboration Center on Community Safety Promotion will give us
clues to cope with problems caused by present situation and lead us to brighter future.
Atsugi City declared about launch of the scheme of Safe Community in January 2008. We set up
an administrative section of the Safe Community Project and registered as a candidate for a member of
the International Safe Community Network in April 2008. Furthermore, we declared implementation of
Safe Community programs in Atsugi City comprehensive plan named “Atsugi Vibrant Comprehensive
Plan” started in the same month.
Since then, we have conducted community diagnoses with various materials such as statistical
data and results of surveys, which resulted in revealing problems in safety; suicide, traffic, feeling of
anxiety, various accidents and injuries among high risk groups such as children and the seniors. We
also found that we need to take measures to reduce accidents and injuries with bicycles and at work
places, which is distinct in Atsugi.
I, as a mayor, strongly believe that effort for safety promotion in collaboration among community
members will lead to strengthen the community bond, vitalize communities, and improve quality of our
lives. We are, therefore, trying harder to decrease injuries and accidents along with the concept of Safe
Community and establishing a network of Safe Community in the nation wide as well as international
network.
Tsuneyoshi Kobayashi
Mayor,
Atsugi City
CONTENTS
Chapter1 Overview of Atsugi City ........................................1
1 Geography, population, and households .......................................................................................... 3 2 Economics, Education, and Culture .................................................................................................. 5
Chapter 2 Background of Atsugi Safe Community initiative .....................................................................................7
1. Background ...................................................................................................................................... 7 2. Implementation of the Safe Community Project .............................................................................. 9
Chapter 3 State of Injuries in Atsugi City ......................... 10
1. Causes of Death ............................................................................................................................ 10 2. Causes of Injuries .......................................................................................................................... 15 3. Characteristics of injuries ............................................................................................................... 17
Chapter 4 Challenges and Goals ....................................... 34
1. Priority challenges facing Atsugi City ............................................................................................. 34 2. Objectives of Atsugi Safe Community ............................................................................................ 34
Chapter5 Initiatives Based on Six Indicators ..................... 36 Indicator 1: An infrastructure based on partnership and collaborations, governed by a cross- sectional group
that is responsible for safety promotion in their community ........................................................................ 36 Indicator 2: Long-term, sustainable programs covering both genders and all ages, environments,
and situations ..................................................................................................................................... 45 Indicator 3: Programs that target high-risk groups and environments, and programs that promote
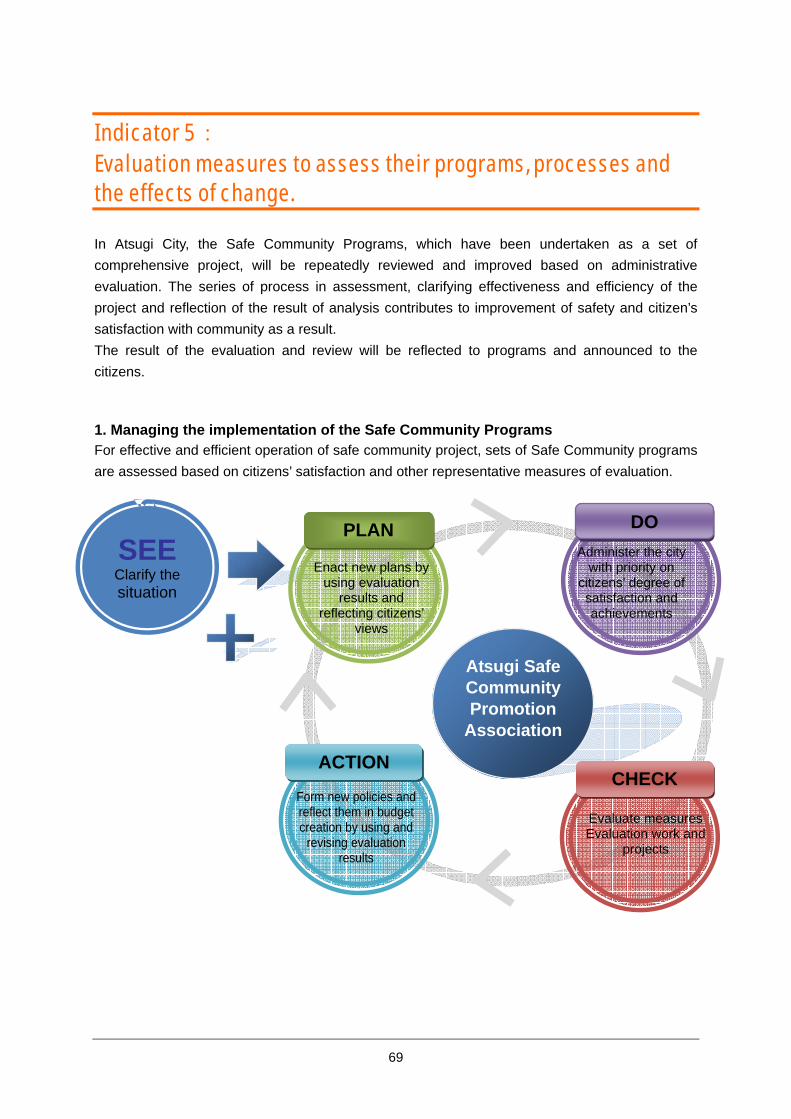
safety for vulnerable groups............................................................................................................... 61 Indicator 4: Programs that document the frequency and causes of injuries .................................... 65 Indicator 5: Evaluation measures to assess their programs, processes and the effects of change. 69 Indicator 6: Ongoing participation in national and international Safe Community networks. ........... 76
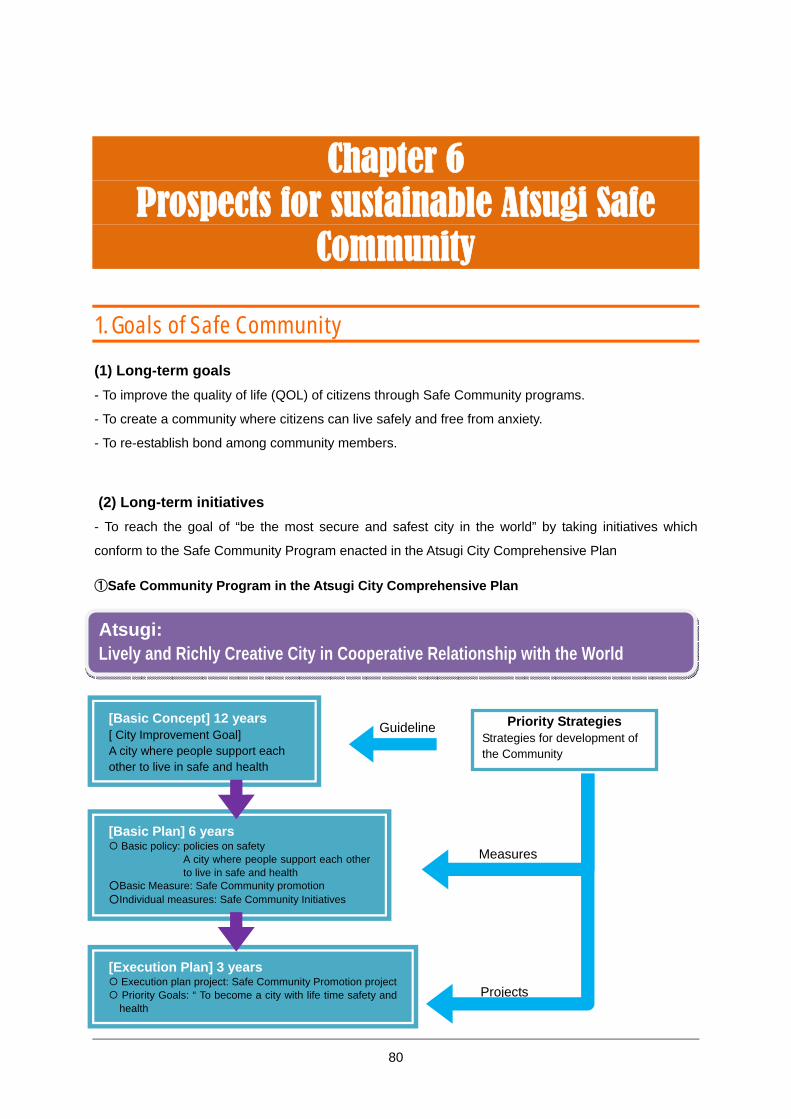
Chapter 6 Prospects for sustainable Atsugi Safe Community ............................................................................. 80
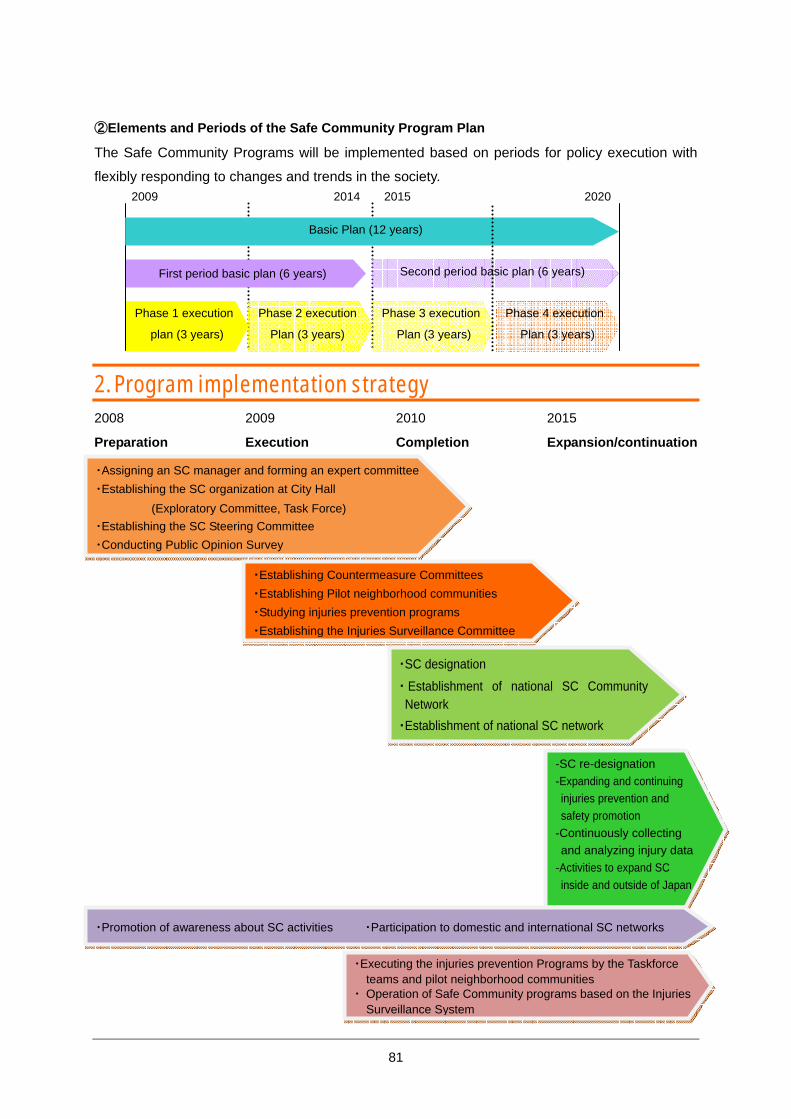
1. Goals of Safe Community .............................................................................................................. 80 2. Program implementation strategy .................................................................................................. 81 3. Future perspective of SC movement at Atsugi City ....................................................................... 82
1
Chapter1 Overview of Atsugi City
Atsugi City is located in the centre of Kanagawa Prefecture on fan-shaped topography on the right bank
of the Sagami River. With the Tanzawa Mountain Range to its north-west, Atsugi is blessed with a rich
natural environment. Furthermore, thanks to the prominent geographical position, it takes a role of
transportation hub and the untiring exertions by residents and has developed as a key city providing
important function in transportation and business to the capital region. Atsugi is a bustling city with
commercial and residential districts, research institutes operated by well known companies, and
universities.
Looking back to the Edo Period (1603 – 1867), the city used to be called ‘Little Edo(Tokyo), which is an
old name of capital of Japan. Along with a development as Inn-City, the city becomes an industrial
region with thriving exchange of products and cargo transport. After long term of development, on
February 1, 1955, one town and four villages merged and become Atsugi City, with three more villages
joining later.
Nowadays, in response to a demand to play a role as a center of wide-area cooperation—a core
business city which has concentrated urban functions to ensure communication and inter-regional
exchanges over a wide area—it has taken advantage of its past achievements and beneficial location
to encourage sustainable development and creation of attractive communities in harmony with its rich
natural environment.
2
City tree: Maple tree (Enacted February 1, 1969)
City flower: Satsuki azalea City logo: Designed the first word ‘a(あ)’of Atsugi City, or three sweet fish. It symbolizes harmony and progress of the people of the city. (Adopted March 22, 1955)
[Origin of the place name, Atsugi]
There are several explanations for the origin of the name of Atsugi. One is a shortened word of “atsume-gi (wood
gathering)” considering it used to be a lumber distribution center. It is also said that the name came from aboriginal
language in Hokkaido, Ainu word, for marquetry (decorative wooden inlay)
.
3
1 Geography, population, and households ● Area 93.83km2 (East-west: 13.68km, South-north: 14.80 km)
● Population 225,797 ( 94,631 households ) (as of Jan. 1, 2010)
● Population density 2,400 per sq. km
● Household size 2.42 people per household
● Births 5.57 persons per day
● Deaths 3.96 persons per day
● Registered foreigners 6,185 persons Source: Atsugi Statistic Data 2008
Figure 1 Population composition by age group (2008)
Source: Prefectural Statistical Survey of Population by Age : Atsugi City (Jan. 1) Nationwide and Kanagawa Prefecture (Oct. 1)
Population of Atsugi City is about 220,000, and young generations take relatively high percentage of
the whole population, which characterizes the Atsugi city among the cities in Kanagawa Prefecture.
Table 1 Population by 3 Age Groups
Year
Population Population composition by 3 age groups (%) Average
Source: Kanagawa Prefecture Statistical Survey of Population by Age: Jan 1 of each year Note) 1. The total population composition ratio by 3 age groups includes those whose age is unknown.
4
The population of Atsugi has been gradually increasing since 1998. The composition ratio of tree age
groups(0-14,15-64, 65 and over) shows that the young generation remains higher ratio than the elderly,
65 years and older, while falling of birth rate and aging of the society .
Figure 2. Population change in past 10 years Index (1998 = 100)
Source: Atsugi City – Statistics Atsugi (Oct. 1 of each year), National (Oct.1 of each year), Kanagawa Pref. (Jan. 1 of each year) – Kanagawa Prefecture Population Statistics by age group
Figure 3. Population composition of 3 age groups and aging Index
Source: Kanagawa Prefecture Statistical Survey of Population by Age (Jan 1 of each year) Note: Aging index is the ratio of the elderly population (65 and older) to the youth population (14 and younger)
Reference The population of Atsugi City was about 30,000 when it was given city status (1955), then reached 100,000 in 1973.It exceeded 200,000 in 1991. At the present, its population is more than 7 times that when it became a city.
5
2 Economics, Education, and Culture
Hub of Transportation Being located 46km from Metropolitan Tokyo and 32km from
Yokohama City, it is blessed with geographical conditions as a
perfect for a transportation hub with Tomei Expressway, national
highways #129, #246, and #412, the Odawara-Atsugi Road and
others..
Industrial City Since the early 1980’s, Atsugi has developed as a multi-function city,
with Nissan Motors Co., Ltd. and other research oriented
corporations located in Atsugi, concentrating business, services,
and industry. ( Table 3)
- Business establishments: 9,764 (2006 Statistical Survey of
Business Establishments and Enterprises).
-Workers: 136,099
(Note) excluding public employees.
Out of these, 397 are industrial companies with 21,375 of
workers (2007 Industrial Statistics Survey) (Note) Business establishments with 3 or fewer workers are not included.
Dynamic Community Activities In 15 wards, there are 220 residents associations, 37 children’s centers, 41 senior citizen centers, with
tradition of mutual support among residents. (FY2009)
City with an excellent medical treatment system (March 2008) The city is fully served by 11 general hospitals, 150 clinics, and 110 dentists’ offices.
Table 2 Comparison with numbers of facilities/hospital beds (per 100,000 people) in Kanagawa Prefecture (Oct. 1, 2006)
Lively academic life (May 2008) Atsugi has a full selection of educational institutions and an
energetic population of young generation attending 18
kindergartens, 23 elementary schools, 13 junior and 6 senior
high schools, 6 vocational schools, 1 two-year college, 4
universities and 4 graduate schools.
Harmony with nature Atsugi is abundant in rich nature including the Sagami River
and Daisan Mountain.
Domestic and international networks Atsugi City has friendship with cities listed below:
Overseas: New Britain City( U.S), Yangzhou City ( China),
and Gunpo City( Korea)
Domestic: Yokote City (Akita Pref.)
Abashiri City( Hokkaido Pref.)
Disaster Prevention Sister City: Sayama City ( Saitama pref.)
Cultural and historical resources Atsugi preserves many arts and cultural properties for future generations: the Intangible Folk Cultural
Asset Of Japan, the Sagami Puppet Theater, the National Designated Valuable Culture Property, the
Wooden Sculpture of a Sitting Amida-Nyorai in Kongoji Temple, and other cultural assets, in addition to
the prefectural designated important cultural property, the main hall of Honzenji Temple.
Related reference index
-Traffic accidents: 5.20 per day
-Fires: One/5.89 days
-Ambulance trips: 24.48 per day
-Railway passengers: 195,841 per day
-Night time – daytime population ratio: 114.7 (Oct. 1, 2005)
-Parks: 7.40m2 per capita Source: Atsugi Mini-statistics Data (2008 edition)
Table 3 Population by industry
7
Chapter 2 Background of Atsugi Safe Community
initiative 1. Background Atsugi City is now going through a sweeping revolution of living infrastructure and environmental
conditions, as a result of change in the society in recent years including the rapid falling birthrate, aging
of the population, change of the urban environment, diversification of the people’s values, residents’
growing consciousness of self-government stemning by the weakening of the bonds of communities
and advancing decentralization to the regions.
In these conditions, the city faces three major challenges related to the safety in residents’ daily lives
which have aroused great concern among the people: in particular; (1) prevention of incidents and
accidents including suicides, traffic accidents, and indicates which threaten the safety of children,(2)
Anxiety of being a victim of crimes or accidents and (3) re-establishment of community bonds
(betterment of living environments through enhanced neighborhood societies).
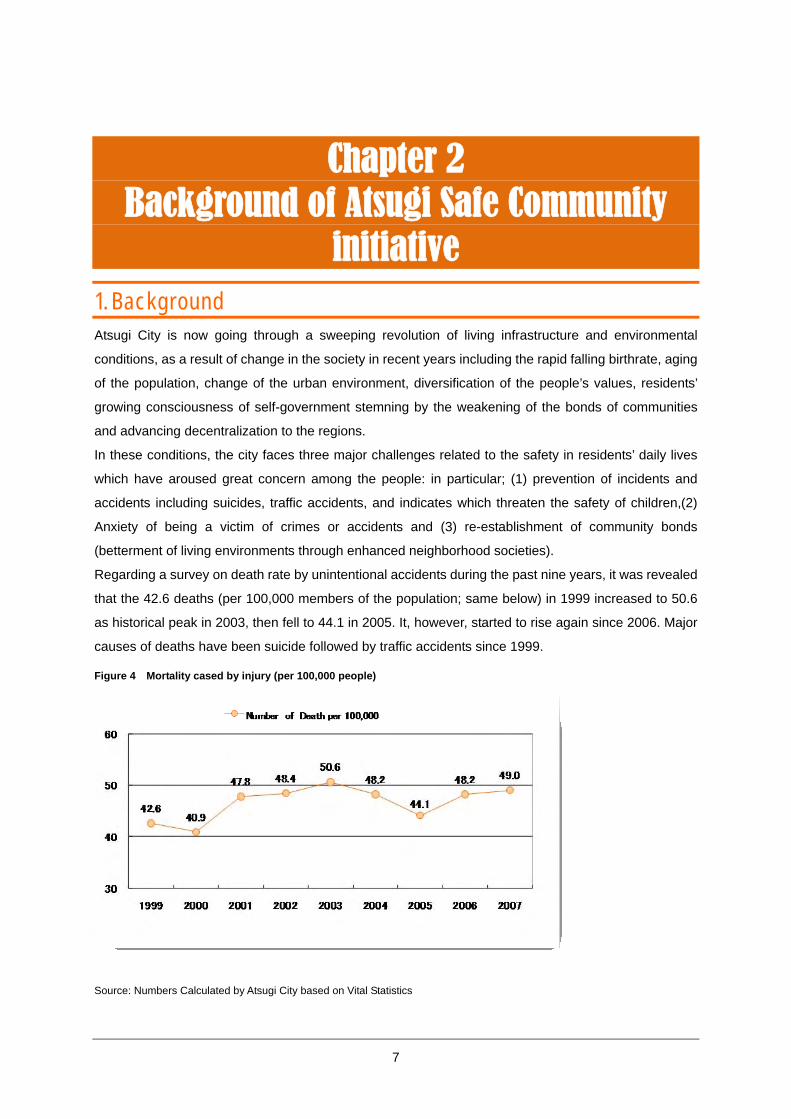
Regarding a survey on death rate by unintentional accidents during the past nine years, it was revealed
that the 42.6 deaths (per 100,000 members of the population; same below) in 1999 increased to 50.6
as historical peak in 2003, then fell to 44.1 in 2005. It, however, started to rise again since 2006. Major
causes of deaths have been suicide followed by traffic accidents since 1999.
Figure 4 Mortality cased by injury (per 100,000 people)
Source: Numbers Calculated by Atsugi City based on Vital Statistics
8
In order to make these circumstances better, Atsugi City decided to introduce Safe Community
strategies in January 2008. Since then, the city has been putting effort on betterment of life and
improvement of safety based on the concept of Safe Community. In addition, in 2009, safety promotion
based on the Safe Community strategies was stipulated as one of main polices toward further
development of the city in our new comprehensive plan for the period between 2009 and 2012.
9
2. Implementation of the Safe Community Project
Table 4. Major activities and events of Safe Community Projects Year Activities
2007.9 Participation in the Kyoto Safe Community Symposium
Launch research on a Safe Community
2008.1 Announcement of challenge to obtain Safe Community Designation by the Mayor of Atsugi
2008.3 Efforts to become a Safe Community stipulated as a priority item in administrative policies
Participation in the Kameoka City Safe Community Designation Ceremony
Participation in International Conference on Surveillance for Safe Community
2008.4 Establishment of the Atsugi City Safe Community Management Office
Assignment of Atsugi City Safe Community specialists
Study tour to Kameoka City
2008.5 Registration as preparing for applying to be a member of the International Safe Community Network
Inauguration of the Atsugi City Safe Community Working group
2008.6 Inauguration of the Atsugi City Safe Community SC Exploratory Committee
Inauguration of Atsugi City Safe Community Steering Committee
Participation in Songpa District Designation Ceremony in Seoul, Korea
2008.7 Visit to the Asia Region Safe Community Certifying Center (Suwon City in Korea)
2008.10 Participation in the 2nd Academic Conference, Japanese Society of Safety Promotion (Tokyo)
Participation in 17th International Safe Community Conference (New Zealand, Christchurch)
Social Survey (household survey on safety, health, community, bicycle use) Note 1
2008.11 Atsugi City Citizens Pep Rally Held to promote efforts for Safe Community Designation
2009.2 Study tour to officials of the WHO Asia Region Certifying Center
2009.3 Study tour to Safe Schools (Taiwan)
2009.4 First assign of Atsugi City Safe Community Pilot neighborhoods communities Note 2
Establishment of the Atsugi City Safe Community Task Force teams Note 3
2009.8 Participation in Towada City Safe Community Designation Ceremony
Participation in and presentation to the 3rd Academic Conference, Japanese Society of Safety Promotion
2009.10 Participation in the 5th Asia Region Safe Community Conference (Beijing China)
2009.11 Citizens Pep Rally Held to promote efforts for Safe Community Designation
2010.3 Participation in 19th International Safe Community Conference (Suwon City, Korea)
2010.11 Holding the 4th Academic Conference of the Japanese Society of Safety Promotion (Atsugi) Note 1) In 2008, Atsugi conducted a social survey to clarify the state of injuries and risk factors. Note 2) To promote locally rooted initiatives, regional challenges are abstracted and initiatives taken based on the results by
assigned seven Pilot neighborhoods communities(Feb.1,2010), conducting questionnaire surveys etc. Note 3) Eight task forces are established by laterally linking organizations including the city, police, and various other groups,
then based on results of the 2008 social survey and existing statistical data etc., measures are taken to continuously prevent injuries in Atsugi City.
10
Chapter 3 State of Injuries in Atsugi City
1. Causes of Death
(1) Statistical Analysis Considering the following three tables, it was found that the Atsugi City Safe Community Program must
tackle three challenges: suicides, traffic accidents, and the elderly safety.
Leading causes of deaths in the past five years in Atsugi City show that, between 0- 4 years old
and 10 - 29 years old, the top of leading cause of deaths is intentional accident. Between 20 - 69 years
old, suicide is ranked in the top fives. It should be noted that comparison with traffic accident, the
second leading cause of death, there is big difference in the number of death. It is especially, apparent
in 30’s as seen the number of death by suicide results in 9 times as many as those by traffic accidents Table 5 Causes of Deaths by Age Group in Atsugi City (2002 to 2006) Source: Vital Statistics Age group First Second Third Fourth Fifth
0-4 Perinatal disease, congenital abnormalities, respiratory disease unintentional accident, etc. 5-9 Malignant neoplasm, pneumonia, other external causes - -
Top five deaths by external causes - There are different trends by age groups, as fall ranked at higher at old ages. -From 10 to 19 years old and from 20 to 69 years old, main causes of death are traffic accidents and suicides. -Traffic accidents are raked in the top five in all age groups and so do suicides over 10 years old. -Among 30 to 39 years old, deaths by suicide are as 5 times many as death by traffic accidents.
11
Death by external causes in the last 8 years (comparison with Kanagawa Prefecture)
The number of death per 100,000 at each age group is higher in Atsugi City compared to that of
Kanagawa prefecture. The percentage of death by external death at the age 0-9 years old and 2-64
years old exceeds those for Kanagawa Prefecture. The gap is largest in the age group of 20 - 44 years
old.
Table 7 Comparison of Principal Deaths by External causes (1999 to 2006)
Age group Death rate per 100,000 people
Percentage of deaths by external causes
Atsugi City Kanagawa Pref. Atsugi City Kanagawa Pref. 0 - 9 9.9 6.1 19.3 13.1
65 + 136.3 134.7 4.1 4.1 Source: Numbers Calculated by Atsugi City based on Vital Statistics
(2) Mortality by external causes
The number of deaths caused by external causes per 100,000 remained approximately 50 per year
since 2001, and then fell to below 45 in 2005. In 2006, however, it began to rise again. The percentage
of death by external causes out of all death cases peaked in 2001 and fallen afterwards.
Comparing the number of death by external causes to red to Kanagawa Prefecture, all Japan, and
Atsugi has been slightly lower since 1999. It is also found that the percentage of death external causes
in Atsugi is higher than the nation and Kanagawa prefecture.
Figure 5. Number (per 100,000 people) and ratio of death by external causes
Source: Numbers Calculated by Atsugi City based on Vital Statistics
12
Al though there is no big deference in number of death by external causes between male and female in
Kanagawa Prefecture, there is different trend in Atsugi City. In 2007, the death of male fell into 51.1
from 71.8 in a year while that of female grew more than double from 22.5.
Figure 6. Comparison of Number of Deaths by Injuries (per 100,000 people
Source: Numbers Calculated by Atsugi City based on Vital Statistics
The number of death by external cause has remains low at the younger age groups; 0 to 19 years old.
On the other hand, at the age of 65 and older, number of death by external causes remains higher than
100 every year with wide fluctuation occurring until 2003. It, however, become stable afterwards.
Figure 7. Number of Deaths By external causes in Atsugi City (per 100,000 people by age group)
Source: Numbers Calculated by Atsugi City based on Vital Statistics
13
Among external causes, suicide remains the highest ratio every year. Especially in 2006, it soared to
25.5 persons per 100,000. On the other hand, fall tripled to 4.5 in 2007 from 1.4 in 1999.
Figure 8. Trends in Causes of Deaths by Injuries (per 100,000 people)
Source: Numbers Calculated by Atsugi City based on Vital Statistics
14
(3) Indicators of mortality by external causes The number of death per 100,000 by external causes has been increasing since 2004. As a total, male
remains higher number than female although female increased its number more than double in 2007. It
can be seen that the number of death increases as age, especially over the age of 65 years old.
As for unintentional injuries, number of ‘traffic accident’ among children and ‘other unintentional
accidents’ have been increasing. On the other hand, as for intentional injuries, number of suicide at the
middle age remains high and that of elderly has been increasing.
Table 8 Trend of Death and Injuries in 2004 to 2007
Causes Indicator Number of death per 100,000
2004 2005 2006 2007
All injuries
Death 48.2 44.1 48.3 49.0
Sex male 58.0 55.1 71.8 51.1
female 37.6 32.0 22.5 46.7
Ages
0-9yrs yrs old 4.6 13.9 4.8 4.8
10-19 yrs old 13.6 13.8 26.4 4.7
20-44 yrs old 32.6 30.3 30.4 34.6
45-64 yrs old 55.1 50.3 53.5 37.7
Over 65 yrs old 147.5 118.7 135.2 165.5
Uni
nten
tiona
l
death 22.1 16.6 19.7 23.2
Traffic accidents death 7.2 4.5 7.1 4.9
Children 0~14 yrs old 0.0 0.0 0.0 3.2
Elderly Over 65 yrs old 25.8 14.0 19.3 12.0
Fall Death 6.3 3.6 3.1 4.5
elderly Over 65 yrs old 29.5 17.5 22.5 18.1
Drawing death 2.7 3.6 2.7 4.0
Suffocation death 2.3 3.6 2.7 3.6 Exposure to smoke, fire and frame death 0.5 0.5 0.5 0.9
Poisoned by noxious substance death 0.5 0.0 0.5 0.5
Other unintentional accidents death 2.7 0.9 3.1 4.9
Inte
ntio
nal
death 26.1 27.4 28.6 25.8
Suicide
death 19.4 18.4 25.5 22.3
15-24 yrs old 3.1 13.2 19.9 6.8
25-44 yrs old 29.1 20.0 20.7 29.4
45-64 yrs old 27.5 27.6 40.5 18.0
Over 65 yrs old 18.4 21.0 35.4 51.2
Murder death 0.0 1.4 0.5 0.0
Other external causes death 6.8 7.6 2.7 3.6
Source: Numbers Calculated by Atsugi City based on Vital Statistics
15
2. Causes of Injuries
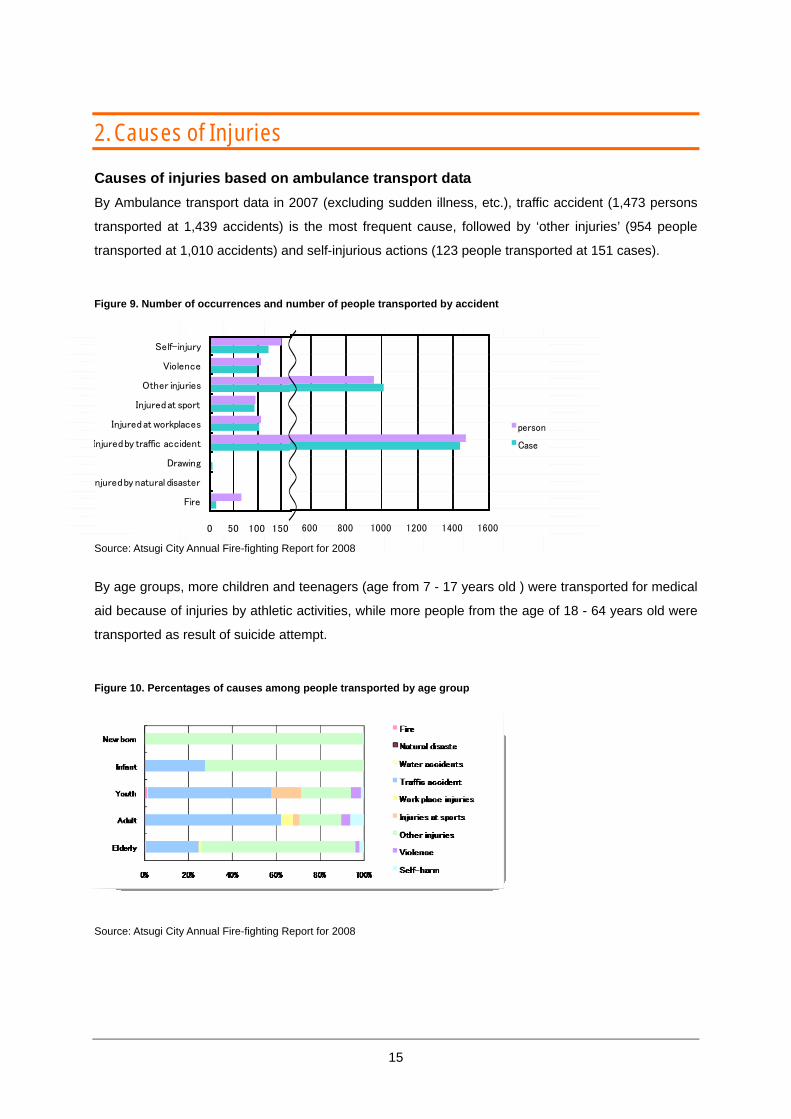
Causes of injuries based on ambulance transport data By Ambulance transport data in 2007 (excluding sudden illness, etc.), traffic accident (1,473 persons
transported at 1,439 accidents) is the most frequent cause, followed by ‘other injuries’ (954 people
transported at 1,010 accidents) and self-injurious actions (123 people transported at 151 cases).
Figure 9. Number of occurrences and number of people transported by accident
0 200 400 600 800 1000 1200 1400 1600
Fire
natural disaster
Drawing
traffic accident
ed at workplaces
Injured at sport
Other injuries
Violence
Self-injury
person
Case
0 50 100 150
Fire
njured by natural disaster
Drawing
Injured by traffic accident
Injured at workplaces
Injured at sport
Other injuries
Violence
Self-injury
Source: Atsugi City Annual Fire-fighting Report for 2008
By age groups, more children and teenagers (age from 7 - 17 years old ) were transported for medical
aid because of injuries by athletic activities, while more people from the age of 18 - 64 years old were
transported as result of suicide attempt.
Figure 10. Percentages of causes among people transported by age group
Source: Atsugi City Annual Fire-fighting Report for 2008
16
Seeing cause of injuries by severity, water related accidents result in death more than other listed
causes of injuries in the figure 11. Then self-injury follows.
Figure 11. severity of injury by cause
Source: Atsugi City Annual Fire-fighting Report for 2008
Seeing age groups, death takes highest ratio among elderly while severe injury takes the most among
younger generation.
Figure 12. Severity of injuries by age group
Source: Atsugi City Annual Fire-fighting Report for 2008
17
3. Characteristics of injuries
(1) Suicide and Violence (Intentional Injuries)
Suicide and its attempt is one of serious problems in Atsugi City, just like most cities in Japan. By
comparison of suicide rates with all Japan and Kanagawa Prefecture, suicide rate in Atsugi hit the peak
of 25.5 persons per 100,000 people in 2006, but started to fall in 2007, and is now far lower than the
national average rate.
Figure 13. Comparison of suicide rates (per 100,000 people)
Source: Vital Statistics
Analyzing cases recorded as suicide, male takes higher rate than female. By age group, the number of
male in the age 40 - 49 years old is five times higher than that of female.
Reasons of attempting suicide are economic problems, anxiety about illness and mental illness
although, in most cases, no specific motive was found. Because of difficulty in clarifying its causes,
suicide is still considered as an impenetrable problem.
Figure 14. Cases reported as suicide by sex and by age group
Figure 15. Causes of suicide by sex
5
33 2712
1 3
24
0 0
99
9 3 2 1 1 0 0
3117 21
0
30
60
90
120
Home p
rob le
msIlln
ess
Econo
mic pro
blems
Employm
ent p
roblem
s
Roman
tic pr
oblem
s
Schoo
l prob
lems
Mental
illne
ss
Lone
lines
s
Others
Unkno
wn
(People)
Male Female
Source: Police statistics (2003 to 2007)
07
3034
50
33
1913
18
05
14 1410
156 8
13
0
20
40
60
0~9 10~19 20~29 30~39 40~49 50~59 60~64 65~69 70~
(People)
MaleFemale
18
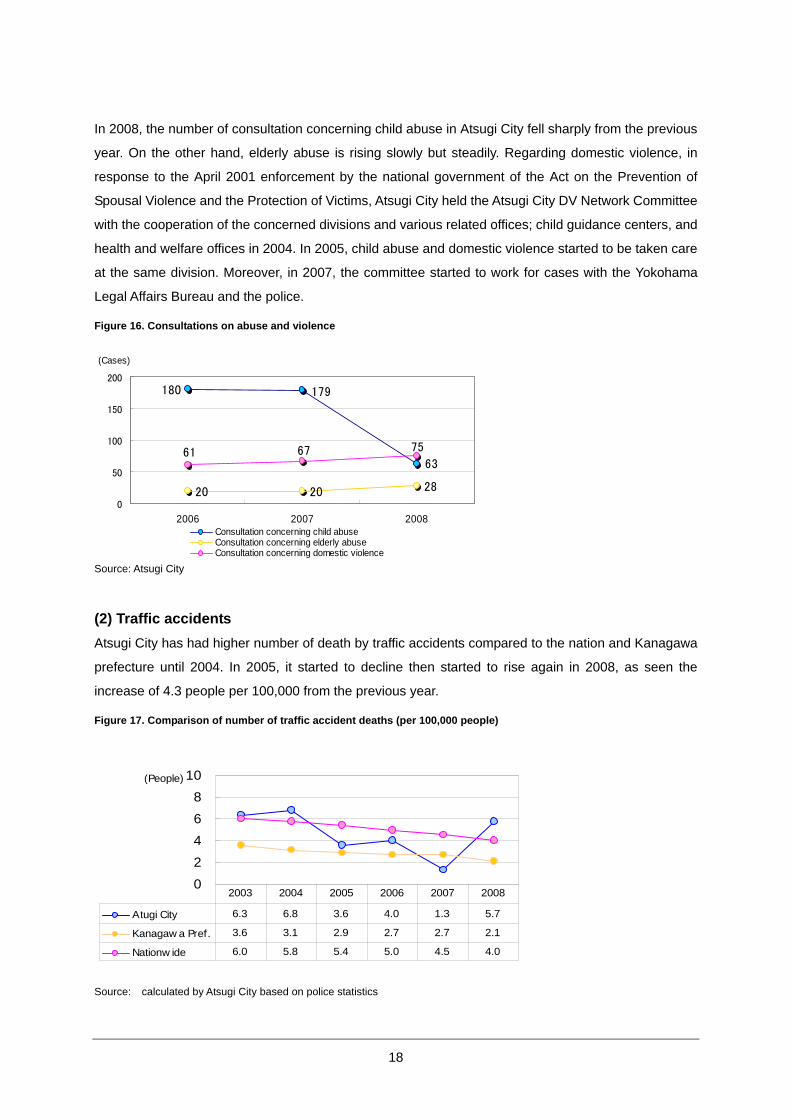
In 2008, the number of consultation concerning child abuse in Atsugi City fell sharply from the previous
year. On the other hand, elderly abuse is rising slowly but steadily. Regarding domestic violence, in
response to the April 2001 enforcement by the national government of the Act on the Prevention of
Spousal Violence and the Protection of Victims, Atsugi City held the Atsugi City DV Network Committee
with the cooperation of the concerned divisions and various related offices; child guidance centers, and
health and welfare offices in 2004. In 2005, child abuse and domestic violence started to be taken care
at the same division. Moreover, in 2007, the committee started to work for cases with the Yokohama
(3) Anxiety about public safety Crime rate in Atsugi City has exceeded that of the nation and Kanagawa Prefecture for the past ten
years. Especially in 2001, it hit the highest rate by 1.5 times higher than all Japan and Kanagawa
Prefecture. To make the situation better, residents, administrators, and police started to work together
in 2002. As a result of their effort, by 2007, crime cases registered by the police fell to about half of its
peak. Although hard work has result in this proud achievement, anxiety of public safety among citizens
still remains high.
Figure 19. Comparison of the Number of Penal Code Crime Cases Known to The Police (per 100,000 people)
Source: Calculated by Atsugi City based on Police Statistics
①Crimes
The number of crimes resulting in injuries has been increasing since 2007 after decline in 2003.
On the other hand, assault has been gradually decreasing although it still remains around 30 cases
every year. There has been some murder cases reported every year. These situations can be one of
causes of anxiety among residents. With concerning about these situations, Atsugi City started to work
for crime prevention with variouse organizations.
Figure 20 Comparison of Murders, Assaults, and Bodily Injuries (per 100,000 people) Source: Calculated by Atsugi City based on Police Statistics
21
② Factors causing negative image of city streets - Frightening, Dangerous, and Dirty -
Analysis of surveys on anxiety about public safety conducted in 2004, 2005 and 2006 revealed signs
and street solicitors of sex parlors, loitering youth have been giving residents’ anxiety. Furthermore,
illegal parking, abandoned bicycles, graffiti, scattered garbage, and dark streets increase feelings of
disorder and anxiety among residents, as well as reduce cleanness and tidiness of streets in the city.
Evaluation of comprehensive plan to improve security and safety
In the result of the Citizens’ Satisfaction Survey carried out in 2007, “Promoting crime prevention
activities” was listed at the top of priority among other several answers as seen below.
Table 10 Evaluation Score of comprehensive plan s to Improve Security and Safety Present evaluation Future importance
Promotion of comprehensive plan s to strengthen disaster resistance 0.419 1.627
Completion of regional disaster prevention measures -0.310 1.507Completion and strengthening of fire-fighting functions -0.023 1.552Ensuring a safe transportation society -0.543 1.282Promoting crime prevention activities -0.777 1.704Ensuring safety of consumers -0.551 1.170
Source: Atsugi City document (Citizens Satisfaction Survey)
In response to the questionnaire survey conducted to 7,000 households in 2007, only 4% of
respondents stated that safety had “improved”, while 83% stated “worsened” or “not changed”. It is
clearly demonstrating that there is still high level
of anxiety about public safety among citizens.
As for reasons of anxiety, “anxiety that children
might become victims of crimes”is highest,
followed by “anxiety concerning earthquakes,
storms and flood damage”.
Source: 2008 Survey on Safety, Health and Community
Figure 21. Public Safety (comparison with previous year)
22
Figure 22 Degree of Anxiety Concerning Threats to Daily Life
Source: 2008 Survey on Safety, Health and Community
Result of a questionnaire survey with the Cell Phone SOS Net has shown that more than 80% of
citizens feel anxiety about “empty streets and dark streets at night” (Figure 23).
Figure 23. In what kinds of places are you uneasy about crime?
Source: Cell Phone SOS Net Questionnaire Survey (2008)
23
[Earthquakes]
According to results of several researches, many of residents feel anxiety for natural disasters, Their
anxiety is partially because of high possibility of six large earthquakes hitting to the city in near future.
Therefore, Atsugi City has been putting effort to be well prepared to disasters.
Figure 24. Distribution Map of Hypothetical Earthquake Hypocenter Regions
Source: Atsugi City Region Disaster Prevention Plan (2009)
(4) Injuries and accidents at bicycle use The number of traffic accidents related to bicycles has been declining since 2004(Fig.25).
Figure 25. Number of Bicycle Accidents
Source: Police statistics
24
Younger people tend to be more involved with traffic accidents, especially accidents with 19 years old
or younger take about 37% of all bicycle accidents.
Among accidents caused by cyclists, more than half were caused by younger than 15 years old
and in their 20’s. Compared to Kanagawa Prefecture, the age groups of 15 years old or younger,
twenties, and thirties take higher rate. (Fig. 26)
Figure 26. Comparison of Occurrences by Age Group with Kanagawa Prefecture (2007)
Source: Calculated by Atsugi City based on police statistics * Figures on the bar graph are totals of accidents caused by cyclists and accidents in which cyclists were the victims.
Bicycle accidents occur most frequently at sidewalks and lead to Injuries by falling or touching/crashing
with cars.
Figure 27 Locations where Injuries and accidents occurred
Figure 28. Circumstances in which Injuries or accidents occurred
Source: 2008 Questionnaire Survey Concerning the Present State of Bicycle Use
25
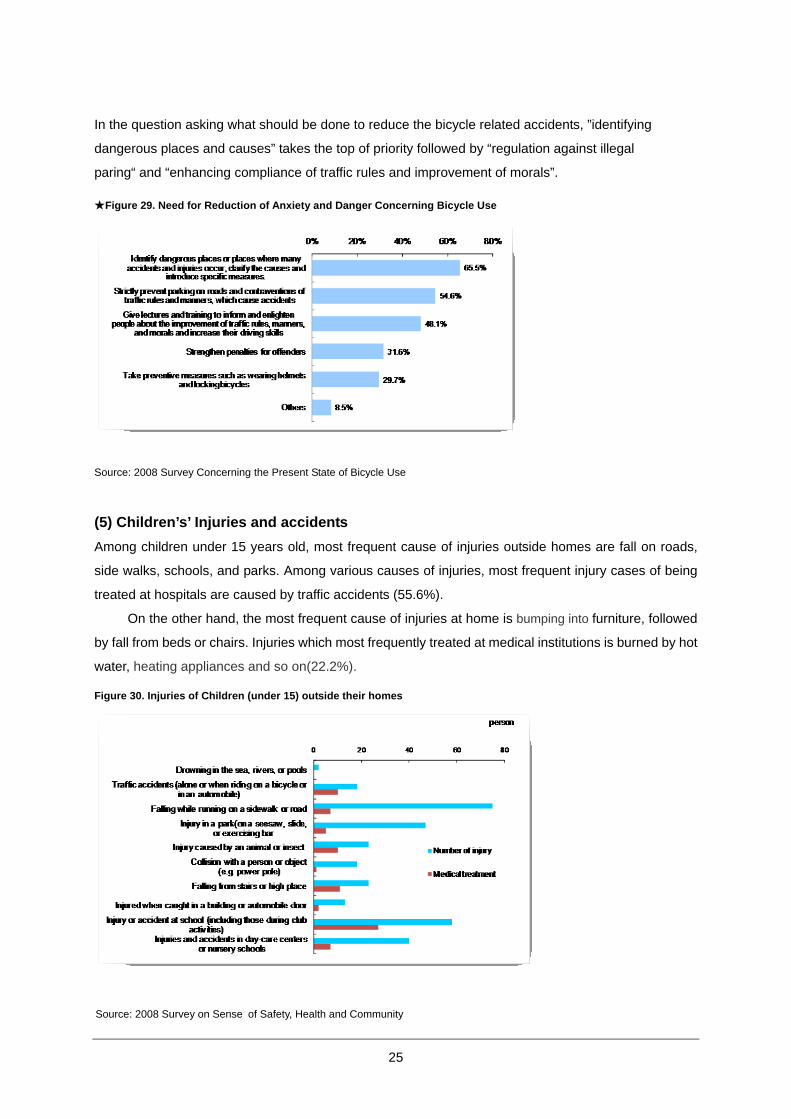
In the question asking what should be done to reduce the bicycle related accidents, ”identifying
dangerous places and causes” takes the top of priority followed by “regulation against illegal
paring“ and “enhancing compliance of traffic rules and improvement of morals”.
★Figure 29. Need for Reduction of Anxiety and Danger Concerning Bicycle Use
Source: 2008 Survey Concerning the Present State of Bicycle Use
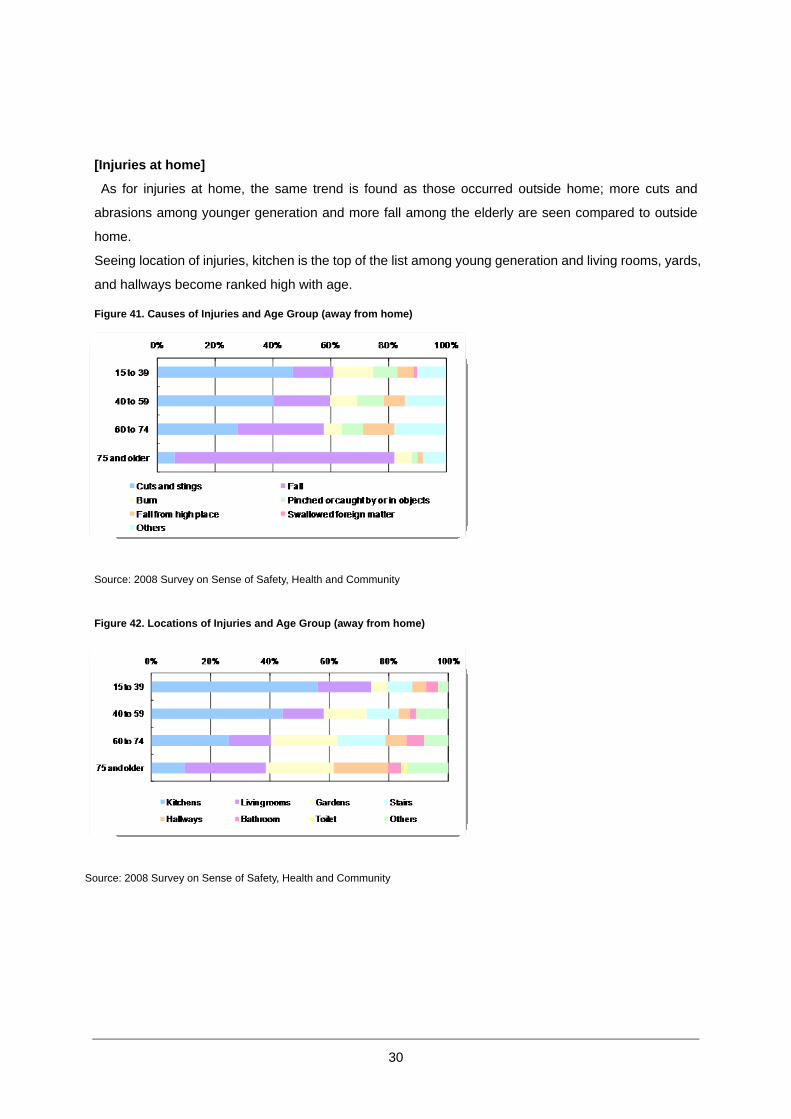
(5) Children’s’ Injuries and accidents Among children under 15 years old, most frequent cause of injuries outside homes are fall on roads,
side walks, schools, and parks. Among various causes of injuries, most frequent injury cases of being
treated at hospitals are caused by traffic accidents (55.6%).
On the other hand, the most frequent cause of injuries at home is bumping into furniture, followed
by fall from beds or chairs. Injuries which most frequently treated at medical institutions is burned by hot
water, heating appliances and so on(22.2%).
Figure 30. Injuries of Children (under 15) outside their homes
Source: 2008 Survey on Sense of Safety, Health and Community
26
Figure 31 Injuries of Children (under 15) at their homes
Source: 2008 Survey on Sense of Safety, Health and Community
Survey on Suspicious behaviors (2004 – 2008)
Cases in which children might have been victims of crimes by prowlers are reported as suspicious
cases. Among those cases, being accosted, shadowed or grabbed on the arm take 25.1%. More than
half of children who have had those experience were elementary and middle school girls. And most
cases had occurred while children were going home from schools during 3:00 p.m. to 4:00 p.m..
Figure 32 Types of suspicious cases Figure 33 victims
Source: Fact-Finding Survey of Suspicious Actions (2004 – 2008)
27
(6) Injuries and accidents among the elderly Among the elderly, the most serious cause of injuries is fall. In the public places, Traffic accident is the
most frequent cause of injuries followed by fall. The elderly fall most often on roads and sidewalks.
Besides, there are many injuries occurred at farms, forests, commercial facilities as well.
As for inside buildings, fall is the most frequent cause of injuries. The elderly, especially over 75 years
old, tend to be more often injured, most of which occurred at living rooms and hall ways.
People under 75 years old tend to get injured by cutting as well as falling. As for the places of injuries,
kitchens and yards are ranked as the top two.
Figure 34. Causes of Injuries and Age Group
Source: 2008 Survey on Sense of Safety, Health and Community
Figure 35. Locations of Injury and Age Group( inside/outside home)
Source: 2008 Survey on Sense of Safety, Health and Community
28
Figure 36 Causes of Injuries and Age Group (outside home)
Source: 2008 Survey on Sense of Safety, Health and Community
Figure 37. Locations of Injuries and Age Group (at home)
Source: 2008 Survey on Sense of Safety, Health and Community
People tend to get medical care more often as they get aged. Residents, especially older than 75 years
old, tend to be hospitalized by injuries caused at home (2.6%) rather than outside of their homes(1.4%).
Figure 38. Use of Medical Treatment Facilities by Age Group (inside/outside home)
15.0 10.0 5.0 0.0
Aw ay from Home 75and older(n=282)Aw ay from Home 60to 74(n=1018)Aw ay from Home 40to 59(n=1145)Aw ay from Home 15to 39(n=1268)
0.0 5.0 10.0 15.0
Was injured, but didnot go to a medicaltreatment facility
Was injured, andvisited a medicaltreatment facility
Was injured, and wasadmitted to a
medical treatmentfacility
Aw ay from Home75 and older(n=282)Aw ay from Home60 to 74(n=1018)Aw ay from Home40 to 59(n=1145)Aw ay from Home15 to 39(n=1268)
29
Source: 2008 Survey on Sense of Safety, Health and Community
(7) Injuries and accidents at home and leisure
[Injuries outside home]
As for outside home, injuries occur most frequently on roads and sidewalks by fall at all age groups.
Traffic accidents, cuts, and abrasions are following causes of injuries.
Seeing injuries by age, the number of fall tends to increase with age, while cuts and stings occur
frequently among younger generations. As for places of injuries occurred, people at the age between
15 -39 years old tend to be injured at school or work, and people at the age 40 - 59 years old are more
injured at work place and fitness facilities.
Figure 39. Causes of Injuries and Age Group (away from home)
Source: 2008 Survey on Sense of Safety, Health and Community
Figure 40. Locations of Injuries and Age Group (outside home)
Source: 2008 Survey on Sense of Safety, Health and Community
30
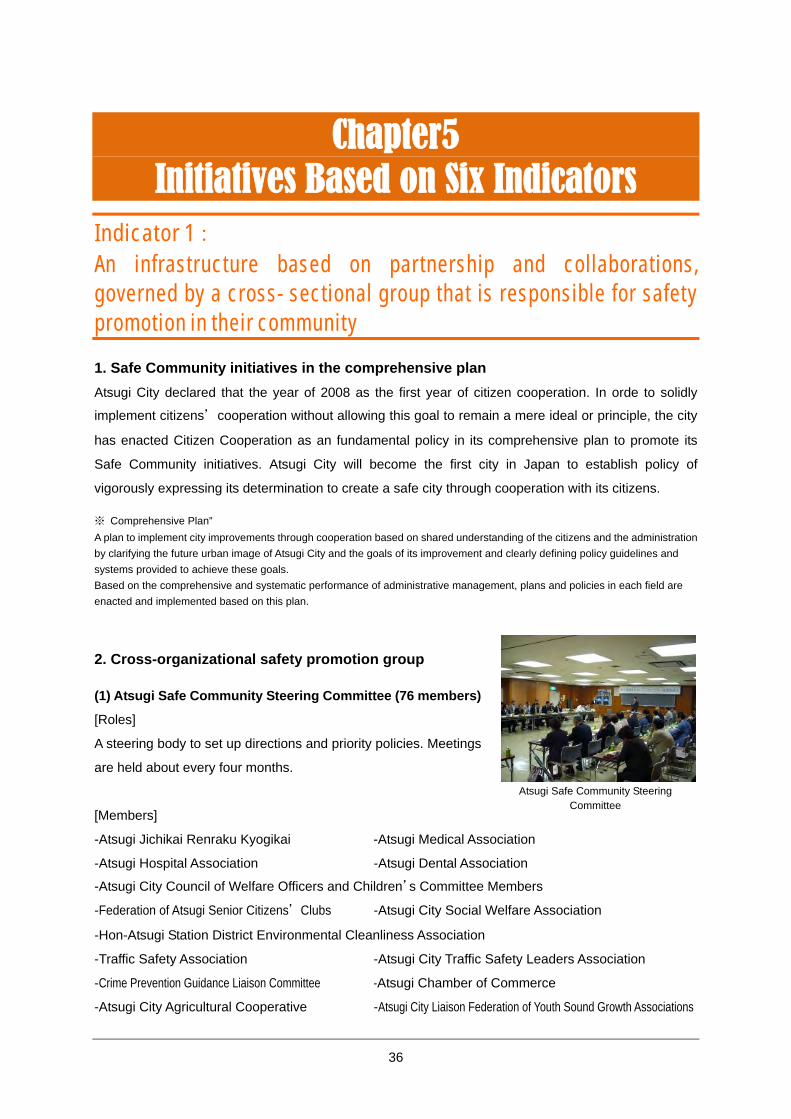
[Injuries at home]
As for injuries at home, the same trend is found as those occurred outside home; more cuts and
abrasions among younger generation and more fall among the elderly are seen compared to outside
home.
Seeing location of injuries, kitchen is the top of the list among young generation and living rooms, yards,
and hallways become ranked high with age.
Figure 41. Causes of Injuries and Age Group (away from home)
Source: 2008 Survey on Sense of Safety, Health and Community
Figure 42. Locations of Injuries and Age Group (away from home)
Source: 2008 Survey on Sense of Safety, Health and Community
31
[Injuries at leisure]
Three first class rivers; Sagami River, Koayu River and Nakatu River, run through the city. Many
citizens spend their leisure time along these rivers. Especially the meeting point of these three rivers is
popular for fishing and water related leisure activities. Therefore, there have been some accidents
along riversides every year. Among water related accidents, drowning is the most frequent case as of
2007.
Figure 43 Severity by types of injuries
Source: Atsugi City Annual Fire-fighting Report for 2008
32
(8) Injuries and accidents at work places
Accidents at work places by industry within the jurisdiction of the Atsugi Labor Standards Inspection Office (2004 – 2008)
Among 12 Labor Standards Inspection Offices in Kanagawa Prefecture, the Atsugi office has been
recorded as the top or second of ranking of the number of injuries at work places from 2004 to 2008.
Table 11 Number of injuries by Labor Standards Inspection Office in Kanagawa Prefecture (2004-2008) 2004 2005 2006 2007 2008 Total
1st Yokohama Kita 994
Atsugi 967
Atsugi 996
Atsugi 978
Yokohama Kita 967
Yokohama Kita
4,854 2nd Atsugi
868 Yokohama
Kita 942
Yokohama Kita 989
Yokohama Kita 962
Atsugi 928
Atsugi 4,737
3rd Yokohama Minami
786
Yokohama Minami
834
Yokohama Minami
865
Yokohama Minami
790
Yokohama Minami
869
Yokohama Minami 4,144
According to records at the Atsugi Labor Standards Inspection Office between 2001 to 2006, 5,333
people were killed or suffered injuries with four or more days absence from work. Out of these killed or
injured people, 1,664 cases(31%) were occurred in Atsugi City, which is highest in the region.
Seeing these cases by type of industry, the manufacturing industry has been taking highest percentage
both within the jurisdiction and in Atsugi City. In the manufacturing industry, one-third of accidents is
“being caught between or in objects”, followed by fall. These two types of injuries take more than half of
all injuries. Injuries by being caught between or in objects are assumed to occur with machinery and
injuries by falling occur on hallways or floors of workshops.
Figure 44 Injuries by musicality in the Atsugi Region Figure 45. Injuries by industry in the Atsugi Region
Death toll
5,333
33
Figure 46. State of Occurrence of Injuries by Accident Type in Manufacturing (2001 – 2006)
<<Model of occurrence of accident at workplace>>
Unsafe Condition
Flawed Condition
Unsafe Condition
Inducing actor
Harming actor
Types of injury
contact
Human
Accident
Inducing actor:Unsafe, defective status
Harming actor:Directly causing accident
34
Chapter 4 Challenges and Goals
1. Priority challenges facing Atsugi City Based on results of analysis of statistical documents and public opinion surveys, four main challenges
are set up; “suicide prevention”, “traffic safety”, “decreasing anxiety about public safety”, and “safety of
the elderly”. Based on these four challenges, Atsugi City has been working for improvement of citizens’
quality of life.
2. Objectives of Atsugi Safe Community
(1) Objectives of Priority Challenges
① Suicide and Violence(causes of intentional injuries)
Since 1998, more than 30,000 people have commited suicides every year over the country, which
confront the national government with the challenge of implementing nationwide preventive measures.
In Atsugi City as well, approximately 50 precious lives were lost by suicide every year. Suicides are not
the result of a single reason or cause; but occur as a result of the interaction of a variety of factors
including health problems, hardships of life, and mental illness. To prevent suicides and to support
survivors of suicide attempts and their families, Atsugi City is providing 19 types of consulting services
and will set up one-stop consultation system.
In addition, in collaboration with related organizations, services for prevention of child abuse and senior
abuse should be improved.
②Traffic safety
With initiatives to encourage traffic safety movements and to work for regulation against illegal bicycle
parking, traffic accidents should be reduced to 1,500 by 2014 from 1,899 in 2007.
③Anxiety about public safety
Crime prevention programs will be improved for the goal of reducing crime cases known to the police
from 4,224 in 2008 to 3,590 in 2014, relieving citizens’ anxiety at the same time as it creates a city
where people can live safely and free from anxiety.
④Elderly safety
The results of a public opinion survey have shown that fall is one of major causes of injuries among the
elderly. Fall prevention programs such as exercise instruction and dietary guidance will be introduced to
reduce injuries among the elderly.
35
(2) Other important challenges Following to the four priority challenges listed above, four more challenges are set up as important
challenges as follows;
①Children’s safety
②Safe bicycle use
③Safe home life and leisure
④Work place (work) safety
Details about programs on above challenges are explained afterwards.
(3) Reduction of Injuries With pursuing the priority challenges listed above, Atsugi City is implementing the Safe Community
Program aim to reduce injuries by 7.6% by 2014 from 2008, which would lead citizens live to healthier
and safer lives with less anxiety.
Those challenges will result in decline in the percentage of citizens who feel that “The City has
improved with reduction of accidents and injuries”. It will be assessed by improving percentage of
people who feel so to 60.0% by 2014 from 37.2% in 2008.
Figure 47 Trend of injuries
60,000 70,000 80,000 90,000
100,000 110,000
(case)
-7.6%
0 10,000
2008 2009 2010 2011 2012 2013 2014
36
Chapter5 Initiatives Based on Six Indicators
Indicator 1: An infrastructure based on partnership and collaborations, governed by a cross- sectional group that is responsible for safety promotion in their community
1. Safe Community initiatives in the comprehensive plan Atsugi City declared that the year of 2008 as the first year of citizen cooperation. In orde to solidly
implement citizens’ cooperation without allowing this goal to remain a mere ideal or principle, the city
has enacted Citizen Cooperation as an fundamental policy in its comprehensive plan to promote its
Safe Community initiatives. Atsugi City will become the first city in Japan to establish policy of
vigorously expressing its determination to create a safe city through cooperation with its citizens.
※ Comprehensive Plan” A plan to implement city improvements through cooperation based on shared understanding of the citizens and the administration by clarifying the future urban image of Atsugi City and the goals of its improvement and clearly defining policy guidelines and systems provided to achieve these goals. Based on the comprehensive and systematic performance of administrative management, plans and policies in each field are enacted and implemented based on this plan.
2. Cross-organizational safety promotion group
(1) Atsugi Safe Community Steering Committee (76 members)
[Roles]
A steering body to set up directions and priority policies. Meetings
are held about every four months.
[Members]
-Atsugi Jichikai Renraku Kyogikai -Atsugi Medical Association
-Atsugi Hospital Association -Atsugi Dental Association
-Atsugi City Council of Welfare Officers and Children’s Committee Members
-Federation of Atsugi Senior Citizens’ Clubs -Atsugi City Social Welfare Association
-Hon-Atsugi Station District Environmental Cleanliness Association
-Traffic Safety Association -Atsugi City Traffic Safety Leaders Association
-Crime Prevention Guidance Liaison Committee -Atsugi Chamber of Commerce
-Atsugi City Agricultural Cooperative -Atsugi City Liaison Federation of Youth Sound Growth Associations
Atsugi Safe Community Steering Committee
37
-Atsugi City Children’s Association Training Liaison Council -Schools
-Atsugi Labor Standards Inspection Office -Atsugi Police Department
-Kanagawa Prefecture Central Region Prefectural Administrative Center
-Kanagawa Prefecture Atsugi Public Works Office
-Kanagawa Prefecture Atsugi Health Care and Welfare Office -Kanagawa Prefecture Atsugi Children’s Consultation Office, Atsugi City, etc.
(2) Organization within Atsugi City administration
[Roles]
An organization established by concerned divisions in City Office for effective implementation of
projects. Meetings are held three times a year.
① Atsugi City Safe Community Exploratory Committee (19 members)
② Atsugi City Safe Community working group (23 members)
Atsugi City Safe Community Exploratory Committee
Atsugi City Safe Community working group
(3) Atsugi City Safe Community Task Force Teams * Detail is explained at table 12 in p 40.
(4) Injury Surveillance Committee [Roles]
An organization which takes analysis, evaluation, and study of
injury-related data to diagnose community safety
[Members]
-Atsugi Medical Association -Atsugi Police Department
-Atsugi Fire Department -Atsugi Health and Welfare Office
-Tokai University. -Concerned bureaus of the city,
38
(5) Pilot neighborhood communities Detail is explained at table 13 in p43.
(6) Safe Community working group at Atsugi Police [Roles]
A cross sectional organization at Atsugi Police to work on “traffic
safety ” and “ feeling of safety and public safety ” which are
challenges of Safe Community program of Atsugi City(established
January 1, 2009).
Atsugi Police has been taking important roles Atsugi City Safe
Community Project through this organization.
[Structure]
□Task Force Leader: Commissioner
□Assistant Leader: Assistant Commissioner
□Assistants: Deputy Chief of Region, Deputy Chief of Detectives,
□Deputy Chief of Traffic Affairs
Taskforce Members, police administration: Chief of House Police Division
Community Safety Force; Chief of the division of Community Safety
□Regional Force: Chiefs of Regional Divisions 1, 2 and 3
□Detective Force: Chiefs of Detective Divisions 1 and 2
□Traffic Safety Force: Chiefs of Traffic Divisions 1 and 2
□Security Force: Chief of Security Division.
3. Community organization
Neighborhood Associations (Jichikai)
Neighborhood associations have been conducting various activities for safety promotion such as safety
promotion campaign by wearing “Safe vest”, Eyes with Love program, voluntary disaster prevention
programs and so on.
4. Section of Safe Community at Atsugi City government (1)Supervisor for Safe Community
A supervisor was appointed to create a safe and anxiety-free city based on the Safe Community
concept in April 2008.
39
(2) Section of Safe Community
The section of Safe Community was set up with the Deputy Chief, Division Chief and six officers in
Atsugi City government.
This is the first section to concentrate on Safe Community at administration level I Japan, while
there are already designated communities, Kameoka City and Towada City. The section of Safe
Community is undertaking Safe Community initiatives with the Taskforce Committees and the pilot
neighborhoods communities by acting as the implementing organizations under the direction of the
Safe Community Leadership.
5. Safe Community Promotion System City-wide movement in Atsugi City
Injury Surveillance Committee
Analyzes, evaluates, and studies data based on injuries and safety diagnoses
Atsugi City SC Steering Committee [Program implementation decision]
SC Taskforce teams
【Conduct 8 programs】
● Violence and Suicide
Prevention ● Traffic Safety ● Feeling of safety and public
safety ● Elderly Safety ● Children’s Safety ● Safe Bicycle use ● Safe homes and leisure ● Work place (work) safety
Atsugi City SC exploratory Committee[Prepares program drafts]
Atsugi City SC working committee [Studies program policies]
SC Pilot neighborhoods communities
Implementation of programs in conformity with regional conditions
Collection, provision And use of information
40
Eight SC Taskforce teams Based on the 11 categories of safety promotion described in the SC guideline, Atsugi has set up 8
taskforce teams to solve risks about safety in various settings.
For risks which are not dealt by the 8 taskforce teams, conditions are accordingly analyzed and causes
will be found to improve situation in future,
Table 12 Members of the 8 SC Taskforce Committees Taskforce Team Programs Activities Long-term Goal Members a. Violence &
Suicides Prevention
Support measures for suicide attempt survivors
・Support for families
of suicides Prevention PR activities
To reduce suicides as one of main issues at the national level.
[ Chair] Atsugi Medical Association [Deputy Chair] Local welfare commissioner [Members] -Atsugi Labor Standards Inspection Office -Atsugi Police Department -Atsugi Health Care and Welfare Office -Atsugi City Social Welfare Association -concerned sections of Atsugi City
b. Traffic safety ・Measures for dangerous places in Wards where accidents occur frequently
・Holding contests
To improvement of intersections with frequent accidents To reduce overall traffic accidents
[ Chair] Atsugi City Traffic Safety Leaders Association [Deputy Chair] Atsugi City Mothers Committee Liaison Association for Traffic Safety [Members] -Traffic Safety Associations in the Jurisdiction of Atsugi Police Department -Atsugi Police Department -Atsugi City Hospital -Concerned sections of Atsugi City
c. Feeling of safety & Public safety
・Crime prevention by regional safety measures using (patrol cars with blue lights)
To prevent crimes to make our city streets where citizens can feel no anxiety about crime
[ Chair] Division of community planning , Atsugi City [Deputy Chair] Aikawa Ward community management Council [Members] -Safe community Liaison Committee -Ichikita Ward community management Council
-Atsugi Police Department Concerned bureaus of Atsugi City
41
Taskforce Team Programs Activities Long-term Goal Members d. Elderly Safety Preventing falling
through exercise and good dietary habits
To reduce senior’s injuries caused by falling To reduce cost of medical and nursing care for elderly.
[ Chair] Federation of Atsugi Senior Citizens’ Clubs [Deputy Chair] Atsugi City Physical Training Instructors Liaison Council, [Members] -Atsugi City Regional Welfare Promotion Council -Dietary Habit Improvement Promotion Group(Ajimikai) -concerned divisions of Atsugi City
e. Children’s Safety
Measures to protect children from suspicious people
Preventing accidents in children’s centers
Preventing accidents in schools
To nurture children’s ability to keep themselves safe (predicted)“
[ Chair] Atsugi City Elementary and Middle School PTA Liaison Council [Deputy Chair] -Atsugi City Youth Leaders Liaison Council -Atsugi City Children’s Association Training Liaison Council [Members] -Atsugi City Children’s Center Liaison Council - Atsugi City Mothers Committee Liaison Association for Traffic Safety -concerned Divisions of Atsugi City
f. Safe Bicycle ・Improvement of driving environments
・User compliance with roles and manners
To develop harmonious coexistence of bicycles, pedestrians, and automobiles To create “cyclists friendly streets” where residents can bike safely
[ Chair] Traffic Safety Associations in the Jurisdiction of Atsugi Police Department [Deputy Chair] Youth Traffic Safety Liaison Associations in the Jurisdiction of the Atsugi Police Department,[Members] -Atsugi City Traffic Safety
Leaders Association - Atsugi City Mothers Committee
-Atsugi Police Department -Atsugi Fire Department -Concerned Divisions of Atsugi City
42
Taskforce Team Programs Activities Long-term Goal Members g. Safe Home and
Jeisure Preventing water accidents
Preventing accidents in homes( elderly people).
To improve safety at rivers and environments where people can enjoy leisure time. To improve of the environment to prevent accidents inside and outside home.
[ Chair] -Atsugi-kita Chiku Jichikai (neighborhood association) -Renraku Kyogikai [Deputy Chair] Atsugi Tourism Association [Members] -Federation of Sagami River Fishery Cooperative Associations -Atsugi Ward Boy Scouts Liaison Council -Atsugi City Fire Department -Concerned Divisions of Atsugi City
h. Work Place Safety
・ Prevention of accidents in the manufacturing industries
To reduce industrial accidents by setting concrete goals based on statistical data.
[ Chair] -Amadera Safety and Hygiene appointed Group [Deputy Chair] -Kanagawa Prefecture Inland Industrial Park Cooperative Association [Members] -Kanagawa Prefecture Work Safety and Hygiene Association - Atsugi Branch -Atsugi Chamber of Commerce -Atsugi Medical Association -Atsugi Labor Standards Inspection Office -Atsugi Police Department -Atsugi Fire Department -concerned Divisions of Atsugi City
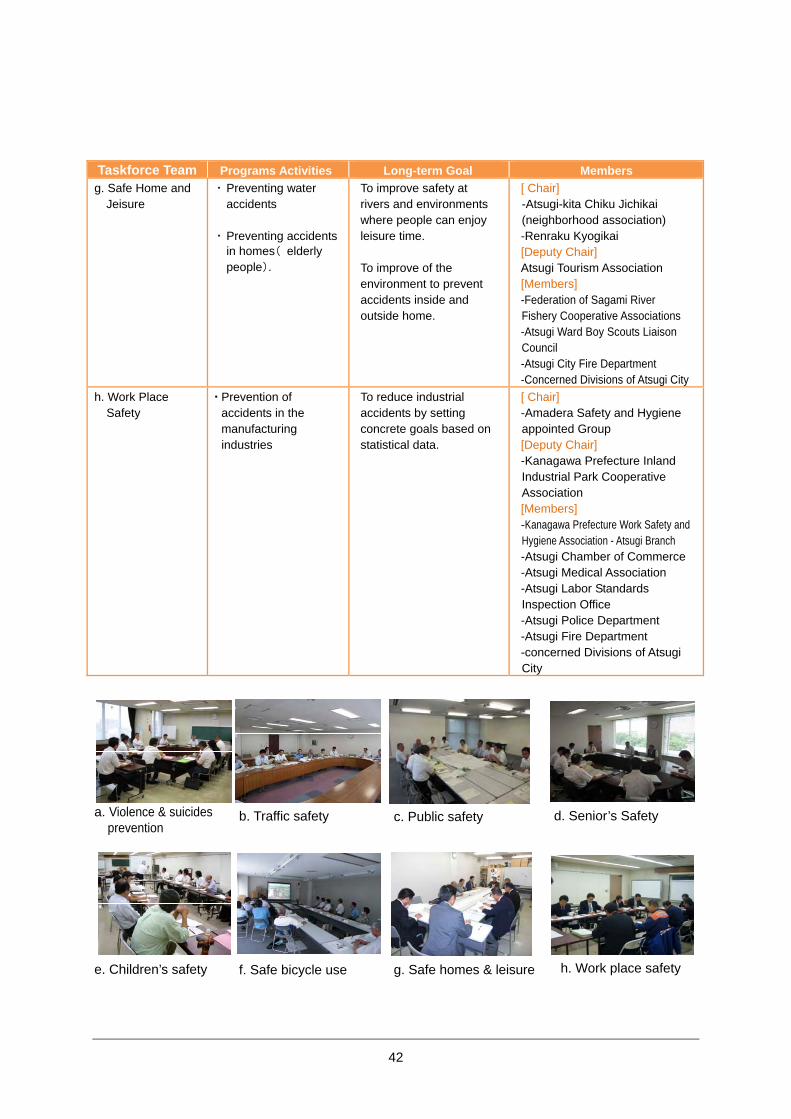
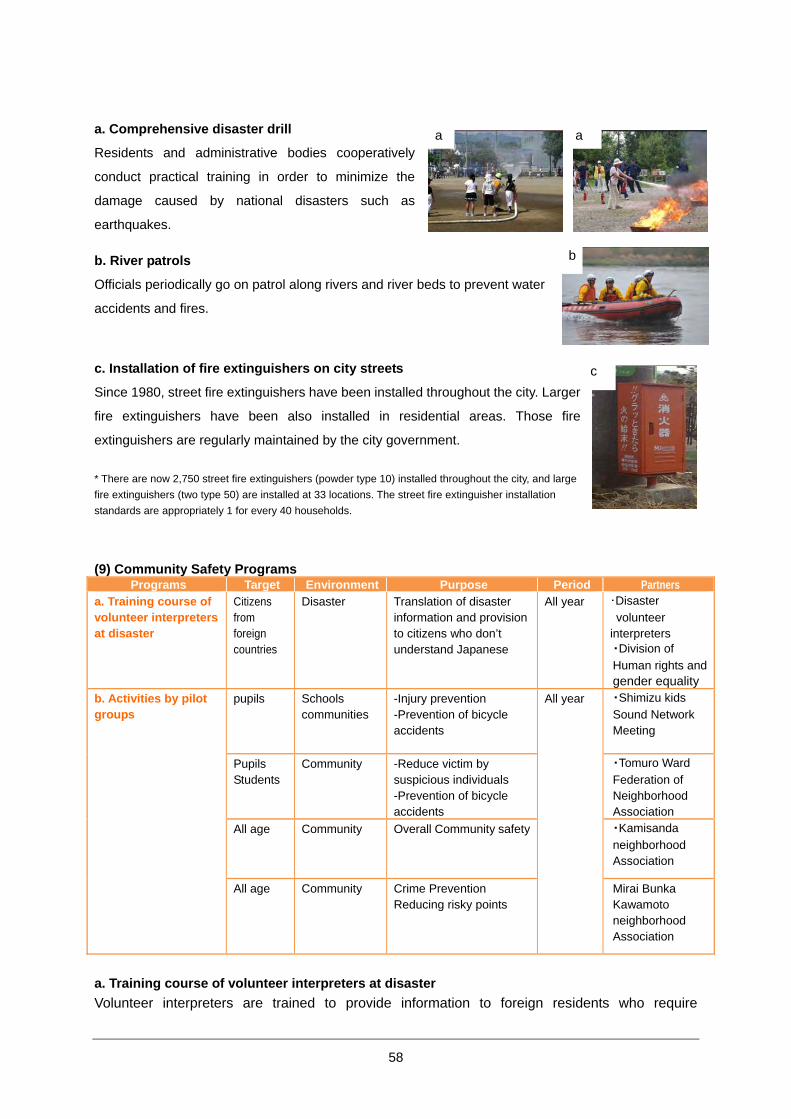
a. Violence & suicides prevention
b. Traffic safety c. Public safety d. Senior’s Safety
e. Children’s safety f. Safe bicycle use g. Safe homes & leisure h. Work place safety
43
Initiatives at Safe Community Pilot neighborhood communities Atsugi City had, in addition the 8 SC task forces mentioned above, appointed 4 pilot neighborhood
communities to promote initiatives rooted in the community. They have carried out questionnaire
surveys and hold workshops to undertake initiatives which conform to the results of the identification of
local problems. 3 more Wards have also been appointed as pilot neighborhoods communities with
expectation of pioneering SC activities.
Table 13 Configuration of the 7 SC Pilot neighborhood communities
Pilot Ward Programs Target ages
Measures
a. Shimizu kids Sound Network Meeting
・Injury prevention at school ・Prevention of head injury by bicycles
・Measurement for places where suspicious people are reported
・Crime prevention
All ages ・Carrying out crime prevention patrols・Preparing and distributing dangerous
location maps ・Holding crime prevention classes
e. 3rd Shimokawairi Neighborhood Association
Examine effective measures according to results of surveys and workshops are planned to be conducted in future
f. Koayu safety watch for children
g. Nishinaka Neighborhood Association
44
a. Shimizu kids Sound Network Meeting b. Tomuro Ward Federation of Residents Associations
c. Kamisanda Residents Association d. Mirai Bunka Kawamoto Residents Association
45
Indicator 2: Long-term, sustainable programs covering both genders and all ages, environments, and situations
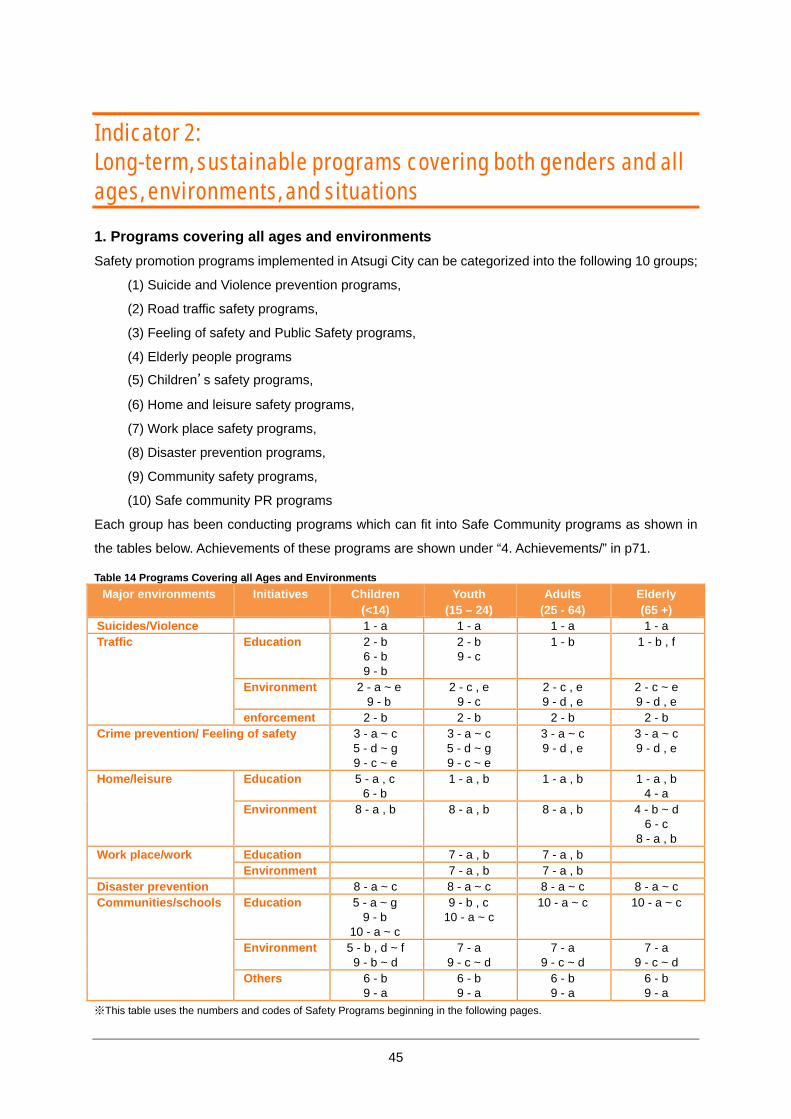
1. Programs covering all ages and environments Safety promotion programs implemented in Atsugi City can be categorized into the following 10 groups;
(1) Suicide and Violence prevention programs,
(2) Road traffic safety programs,
(3) Feeling of safety and Public Safety programs,
(4) Elderly people programs
(5) Children’s safety programs,
(6) Home and leisure safety programs,
(7) Work place safety programs,
(8) Disaster prevention programs,
(9) Community safety programs,
(10) Safe community PR programs
Each group has been conducting programs which can fit into Safe Community programs as shown in
the tables below. Achievements of these programs are shown under “4. Achievements/” in p71.
Table 14 Programs Covering all Ages and Environments Major environments Initiatives Children
(<14) Youth
(15 – 24) Adults
(25 - 64) Elderly (65 +)
Suicides/Violence 1 - a 1 - a 1 - a 1 - a Traffic Education 2 - b
6 - b 9 - b
2 - b 9 - c
1 - b 1 - b , f
Environment 2 - a ~ e 9 - b
2 - c , e 9 - c
2 - c , e 9 - d , e
2 - c ~ e 9 - d , e
enforcement 2 - b 2 - b 2 - b 2 - b Crime prevention/ Feeling of safety 3 - a ~ c
5 - d ~ g 9 - c ~ e
3 - a ~ c 5 - d ~ g 9 - c ~ e
3 - a ~ c 9 - d , e
3 - a ~ c 9 - d , e
Home/leisure Education 5 - a , c 6 - b
1 - a , b 1 - a , b 1 - a , b 4 - a
Environment 8 - a , b 8 - a , b 8 - a , b 4 - b ~ d 6 - c
8 - a , b Work place/work Education 7 - a , b 7 - a , b
Environment 7 - a , b 7 - a , b Disaster prevention 8 - a ~ c 8 - a ~ c 8 - a ~ c 8 - a ~ c Communities/schools Education 5 - a ~ g
9 - b 10 - a ~ c
9 - b , c 10 - a ~ c
10 - a ~ c 10 - a ~ c
Environment 5 - b , d ~ f 9 - b ~ d
7 - a 9 - c ~ d
7 - a 9 - c ~ d
7 - a 9 - c ~ d
Others 6 - b 9 - a
6 - b 9 - a
6 - b 9 - a
6 - b 9 - a
※This table uses the numbers and codes of Safety Programs beginning in the following pages.
46
2. Long-Term and Sustainable Programs
(1) Suicide and Violence Prevention Programs Programs Target Environment Purpose Period Partners
a. Temporally protective custody program for DV victims
Victims of domestic violence
Home Protect victims of domestic violence
All year ・ Concerned divisions of Atsugi City
・ Atsugi Child Counseling Office
・ Atsugi Health and Welfare Office,
・ Atsugi Office of the Yokohama Legal Affairs Bureau,
・ Atsugi Police Department
・ Division of Children & home
b. Liaison Council for Suicide Prevention
All ages All situation and environments
Suicide prevention
All year ・ Medical Association ・ Association of
Community Social workers
・ Council of Social welfare
・ Liaison Council for Suicide Prevention
a. Temporally protective custody program for DV victims
To protect and support victims of domestic violence, the DV (Domestic Violence) Prevention Network
Council was established with relevant organizations.
b. Liaison Council for Suicide Prevention To coordinate and implement measures of suicide prevention, Liaison Council for Suicide Prevention was formed in April 2008. During the Suicide Prevention Week starting September 10, which was appointed by the national government, street campaigns are conducted and books on suicide prevention are displayed at the City Central Library.
b b
b b
47
(2) Traffic Safety Programs Programs Target Environment Purpose Period Partners
a. Car seat promotion project
Infants Automobiles Prevention of infants’ injuries
All year Division of Traffic Safety Businesses
b. Traffic Safety measures
All ages
Roads Prevention of traffic accidents caused by drinking & driving, Prevention of illegal parking
All year Traffic Safety Measure Council
Traffic Safety Guides Atsugi City Mothers
Committee Liaison Association for Traffic Safety
Ward Community Center Safe City Council, etc.
c. Repairing dangerous spots on roads
All ages
Roads
Improvement of traffic environment
All year Office of Road Repair
d. Improvement of Traffic/roads environments
Children Elderly
Roads Sidewalks
Prevention of injuries by falling
All year Division of Community Road
e. Safe Bicycle Program
All ages
Sidewalks Prevention of bicycle accidents
2009~
2012 Atsugi Police Traffic Safety Association
in Atsugi Region Traffic Safety Guides
Association Division of Traffic
Congestion f. Traffic Training
games for elderly
Elderly All traffic environment
Improvement of ability to avoid traffic accident
All year Police Department Division of Traffic safety Traffic Safety Association
in Atsugi Region Traffic Safety Guides
Association
a. Car seat promotion project
Car seats (for infants) are lent for free to drivers to protect their children from traffic accidents. By 2007,
6,775 car seats had been lent since April 2000 when the program started.
b. Traffic Safety Measures
Various programs are set up such as; setting up a private organization of traffic monitoring center,
campaigns for traffic safety, stop drinking & driving, accident prevention for elderly and stop illegal
parking.
c. Repairing dangerous spots on roads
The City inspects dangerous places on city roads by several special vehicles and repairs relatively
simple troubles at sight to ensure safety of automobiles and pedestrians.
48
d. Improvement of Traffic/roads environments
Sidewalks are improved to barrier-free by eliminating level differences and reducing the steepness of
lateral and longitudinal slopes. Beside, more traffic sighs of “STOP” have been installed on spots where
drivers are required to put special attention on the visibility.
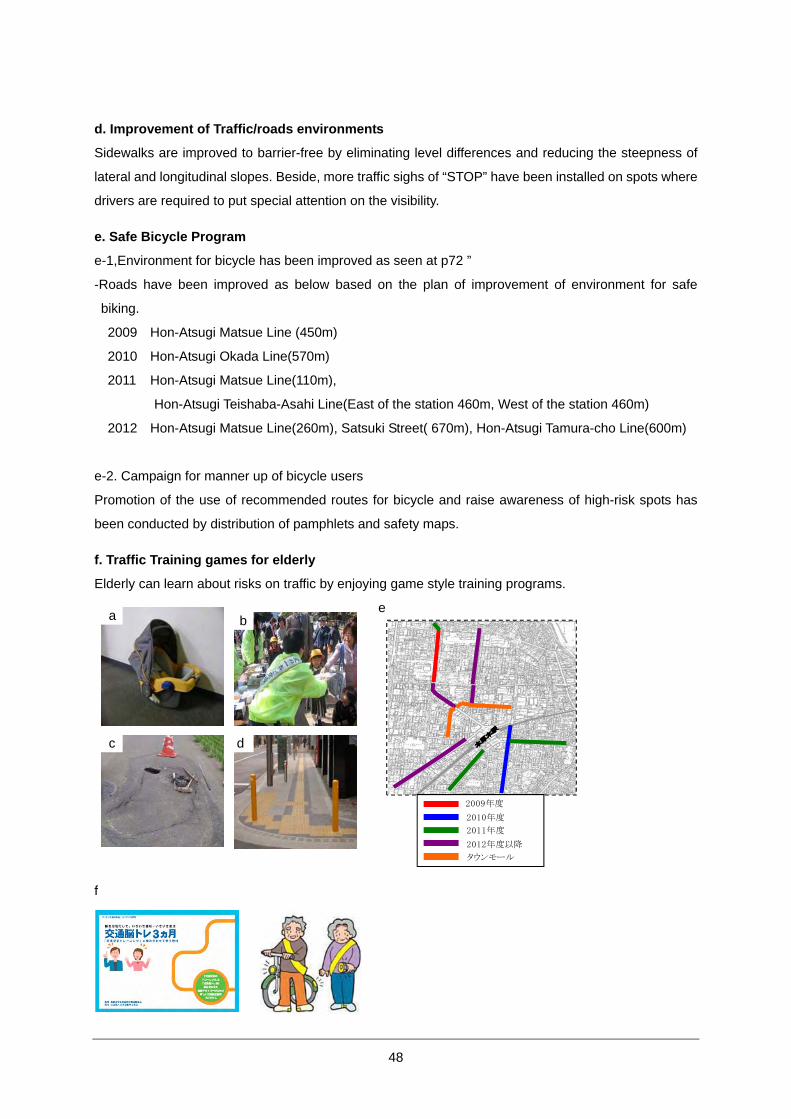
e. Safe Bicycle Program
e-1,Environment for bicycle has been improved as seen at p72 ”
-Roads have been improved as below based on the plan of improvement of environment for safe
biking.
2009 Hon-Atsugi Matsue Line (450m)
2010 Hon-Atsugi Okada Line(570m)
2011 Hon-Atsugi Matsue Line(110m),
Hon-Atsugi Teishaba-Asahi Line(East of the station 460m, West of the station 460m)
Promotion of the use of recommended routes for bicycle and raise awareness of high-risk spots has
been conducted by distribution of pamphlets and safety maps.
f. Traffic Training games for elderly
Elderly can learn about risks on traffic by enjoying game style training programs.
e
2009年度
2010年度
2011年度
2012年度以降
タウンモール
f
a b
c d
49
(3) Feeling of Safety & Public Safety Programs Programs Target Environment Purpose Period Partners
a. Street crime prevention programs
All ages All city areas prevention of Street crimes
All year ・ Atsugi Police Office ・ Division of Life Safety ・ Neighborhood Association
b. Installation of Crime prevention lights
All ages All city areas Crime prevention at night time
All year ・ Division of Life Safety ・ Neighborhood Association
c.Provision of crime rlated information
All ages All city areas Improvement of awareness about safety
All year ・ Atsugi Police Office ・ Division of Life Safety・ Ward Community
Centers
a. Street crime prevention programs
Citizen safety advisors go on patrols with
specific vehicles called “Patochan-Go” and
catch street crimes as voluntary crime
prevention activities.
b. Installation of Crime prevention lights
Crime prevention lights are installed at
dangerous locations with low visibility on
roads and dark public places.
c. Provision of crime related information
Through the Cell Phone SOS Net, information for crime prevention is provided to concerned
organizations. Furthermore, data on penal code crime are analyzed and distributed to relevant
organizations.
32W
20W
aa
b
aa
b
50
(4) Safe Elderly Programs Programs Target Environment Purpose Period Partners
a. Improvement of motility function
Elderly Homes/ Leisure setting
improvement of motility function
All year ・ Division of long-term care Insurance
・ Community General Support Center
b. Publicity of disaster information
Elderly living alone
Homes Support of elderly who need support at emergency
All year ・ Neighborhood Association
・ Community Social workers
・ Division of Fire Defense & Control
c. Installation of self-action fire distinguishers & fire alarms
Elderly -bed ridden - living alone
Homes Fire prevention for elderly who need special support
All year ・ Neighborhood Association
・ Community Social workers
・ Volunteer Fire Company ・ Division of Elderly
Welfare d. Furniture turn-over prevention
Elderly -bed ridden - living alone
Homes Injury prevention by turned over furniture
All year ・ Neighborhood Association
・ Community Social workers
・ Division of Elderly Welfare
e. Home safety support program
Elderly Homes Prevention of injuries among elderly
All year ・ Neighborhood Association
・ Community Social workers
・ Division of Elderly Welfare
f. Traffic Training games for elderly
Elderly All traffic environment
Improvement of ability to avoid traffic accident
All year Traffic Safety Association in the jurisdiction of Atsugi Police
Traffic Safety Guides Council
Division of Traffic Safety Police Office
a. Improvement of motility function
To improve motility function which effectively prevents falls and injuries, exercise instruction is given to
elderly people.
b. Publicity of disaster information
Information about senior residents living alone is stored on mapping data and made the use for
providing them with support in emergency such as natural disaster.
c. Installation of self-action fire distinguishers & fire alarms
Automatic fire extinguisher and fire alarms are supplied to senior registrants living alone, being
51
bedridden and dementia.
d. Furniture turn-over prevention
To prevent registered elderly who are living alone, bedridden and dementia from injury at disasters
such as earthquakes, panels to prevent furniture from turning over are distributed for free of charge.
e. Home safety support program
See “(6) Home and Leisure Safety Programs” in p 55
f. Traffic Training games for elderly
See “(2) Traffic Safety Programs” in p47
e
a
c d
52
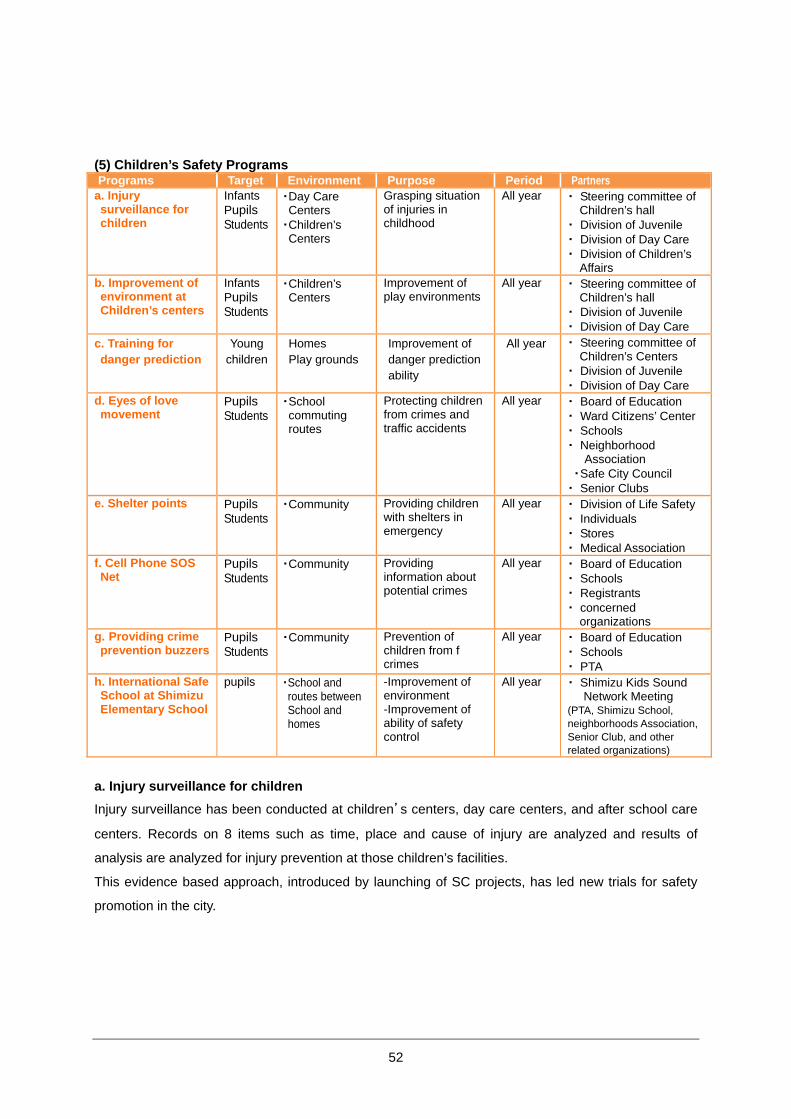
(5) Children’s Safety Programs Programs Target Environment Purpose Period Partners
a. Injury surveillance for children
Infants Pupils Students
・ Day Care Centers
・ Children’s Centers
Grasping situation of injuries in childhood
All year ・ Steering committee of Children’s hall ・ Division of Juvenile ・ Division of Day Care ・ Division of Children’s Affairs
b. Improvement of environment at Children’s centers
Infants Pupils Students
・ Children’s Centers
Improvement of play environments
All year ・ Steering committee of Children’s hall ・ Division of Juvenile ・ Division of Day Care
c. Training for danger prediction
Young children
Homes Play grounds
Improvement of danger prediction ability
All year ・ Steering committee of Children’s Centers ・ Division of Juvenile ・ Division of Day Care
d. Eyes of love movement
Pupils Students
・ School commuting routes
Protecting children from crimes and traffic accidents
All year ・ Board of Education ・ Ward Citizens’ Center ・ Schools ・ Neighborhood
Association ・ Safe City Council
・ Senior Clubs e. Shelter points Pupils
Students ・ Community Providing children
with shelters in emergency
All year ・ Division of Life Safety ・ Individuals ・ Stores ・ Medical Association
f. Cell Phone SOS Net
Pupils Students
・ Community Providing information about potential crimes
All year ・ Board of Education ・ Schools ・ Registrants ・ concerned organizations
g. Providing crime prevention buzzers
Pupils Students
・ Community Prevention of children from f crimes
All year ・ Board of Education ・ Schools ・ PTA
h. International Safe School at Shimizu Elementary School
pupils ・ School and routes between School and homes
-Improvement of environment -Improvement of ability of safety control
All year ・ Shimizu Kids Sound Network Meeting (PTA, Shimizu School, neighborhoods Association, Senior Club, and other related organizations)
a. Injury surveillance for children Injury surveillance has been conducted at children’s centers, day care centers, and after school care
centers. Records on 8 items such as time, place and cause of injury are analyzed and results of
analysis are analyzed for injury prevention at those children’s facilities.
This evidence based approach, introduced by launching of SC projects, has led new trials for safety
promotion in the city.
53
[Children’s Center]
As a result of industrialization and urbanization by high economic growth After the Second World War,
lack of playground and frequent occurrence of child's traffic accident became social issues.
Furthermore, with women started to have full time work, children became to have less opportunity to
play outside after schools. Therefore, to provide safety play environment, Atsugi City started to set up
37 Children’s Centers at ward level since 1967. Each Center has facilities such as play rooms, library
rooms and traditional Japanese rooms, and 3~5 instructors to watch children’s safety. 9 Children’s
Centers is attached to the Centers for elderly to provide communications between children and elderly
people. Children’s Centers were managed by communities and
accumulated total of 3800,000 children play at the centers every
year. Children come to the Centers after school and weekends and
play with friends at different ages and experience various activities.
There centers also offer opportunity of playing for babies and of
sharing information and experience for their parents in the weekday
mornings.
<<Survey on Children’s accidents and injuries>>
The Atsugi City conducted a surveillance of injuries and accidents at Children’s Centers. Result of
analysis revealed that frequent accidents were "fall" as 64 cases (36.2%), “collision with a person or an
object" as 57 cases (32.2%). Among them, 21 cases (11.9%) were transferred to medical facilities.
The followings are outline of the survey;
Term: May 2008―March 2010
Sample: 562,542 infants, children and students playing at Children’s Centers.
Method: Instructors fill up record sheets such as “situation of injury and causes”, Cases of injuries were
analyzed according to accidents kinds.
Based on the result of the survey, Children’s Centers improve safe environment and train children safe
education.
Fall 4.5%
Cut 10.2%
Place 13.0%
Collide withperson or
object 32.2%
Fall down36.2%
Others 3.4%Heat source
0.6%Injury cases
Fall down 64
Collide with person or object
57
Place 23
Cut 18
Fall 8
Heat source 1
Others 6
Total 177
54
b. Improvement of environment at Children’s Centers
Based on the results from the surveillance
explained above as “a. Injury surveillance for
children”, environments at children’s center had
been improved such as removing materials which
may cause accidents and injuries.
c. Training for danger prediction Children’s centers give children trainings to improve
their ability to predict and avoid possible dangers by
using pictures.
More information at “a. Training for danger prediction”
at p56
d. Eyes of love Program
To ensure pupils and students’ safety on their way to and
from school, volunteer residents stand along their routes and watch over children.
e. Shelter points
To protect pupils and students from suspicious
individuals, homes and stores are assinghed as
shelters where children can run for help whenever
they feel danger.
f. Cell phone SOS Net
To alert about crimes and suspicious individual in
communities, reported information on those cases is
provided to pupils and students at their cell phones by
cell-phone text-messaging.
g. Providing crime prevention buzzers
Crime prevention buzzers are provided to all elementary school pupils and junior high school students
who want the service.
h. International Safe School programs at Shimizu Elementary School
To make school environment safer, Shimizu Elementary School is working for safety promotion under
the seven indicators of he International Safe School Project based on activities of Shimizu kids Sound
Network Meeting. h-1. Injury surveillance at school
h-1
h-2
d e
c c
b
55
h-2. Promotion if bicycle helmet
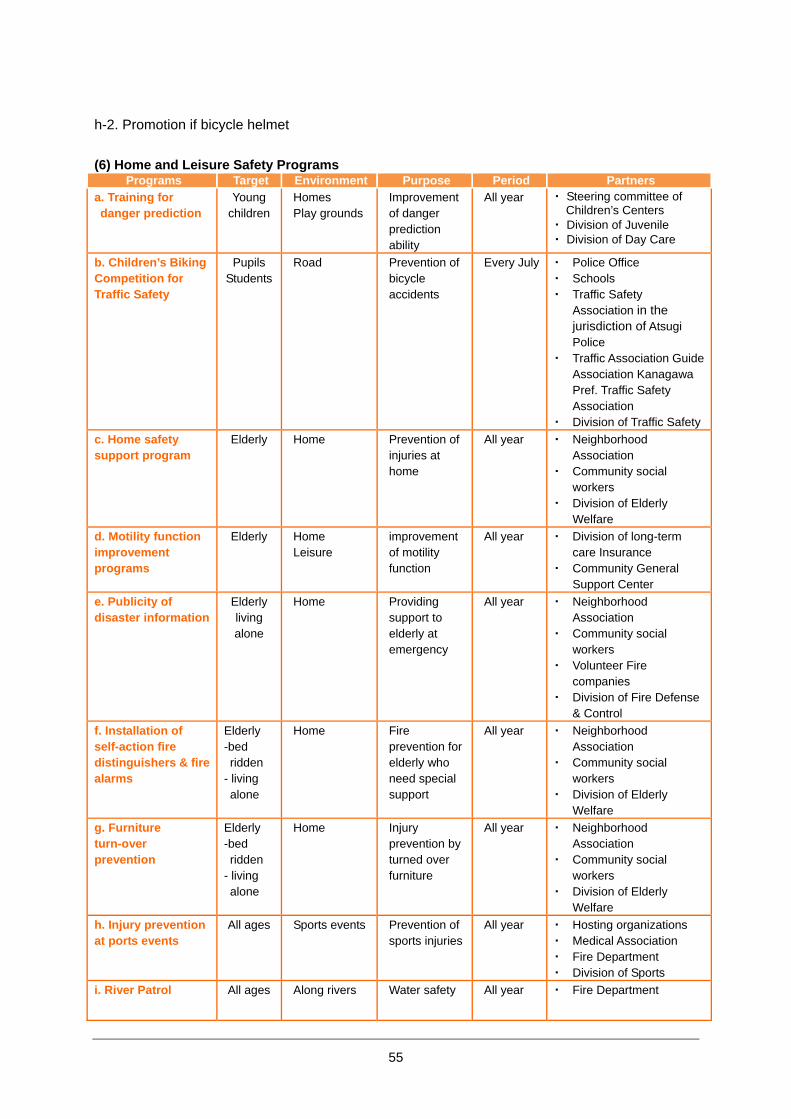
(6) Home and Leisure Safety Programs Programs Target Environment Purpose Period Partners
a. Training for danger prediction
Young children
Homes Play grounds
Improvement of danger prediction ability
All year ・ Steering committee of Children’s Centers ・ Division of Juvenile ・ Division of Day Care
b. Children’s Biking Competition for Traffic Safety
Pupils Students
Road Prevention of bicycle accidents
Every July ・ Police Office ・ Schools ・ Traffic Safety
Association in the jurisdiction of Atsugi Police
・ Traffic Association Guide Association Kanagawa Pref. Traffic Safety Association
・ Division of Traffic Safetyc. Home safety support program
Elderly Home Prevention of injuries at home
All year ・ Neighborhood Association
・ Community social workers
・ Division of Elderly Welfare
d. Motility function improvement programs
Elderly Home Leisure
improvement of motility function
All year ・ Division of long-term care Insurance
・ Community General Support Center
e. Publicity of disaster information
Elderly living alone
Home Providing support to elderly at emergency
All year ・ Neighborhood Association
・ Community social workers
・ Volunteer Fire companies
・ Division of Fire Defense & Control
f. Installation of self-action fire distinguishers & fire alarms
Elderly -bed ridden - living alone
Home Fire prevention for elderly who need special support
All year ・ Neighborhood Association
・ Community social workers
・ Division of Elderly Welfare
g. Furniture turn-over prevention
Elderly -bed ridden - living alone
Home Injury prevention by turned over furniture
All year ・ Neighborhood Association
・ Community social workers
・ Division of Elderly Welfare
h. Injury prevention at ports events
All ages Sports events Prevention of sports injuries
All year ・ Hosting organizations ・ Medical Association ・ Fire Department ・ Division of Sports
i. River Patrol All ages Along rivers Water safety All year ・ Fire Department
56
a. Training for danger prediction
Based on the results of survey explained at “Figure 30 Injuries of
Children (under 15) outside their homes” “Figure 31 Injuries of
Children (under 15) at their homes” at “(5) Children’s’ Injuries and
accidents” in p25, programs to improve ability of risk prediction has
been developed and provided to children.
b. Children’s Biking Competition for Traffic Safety
Children gain knowledge and skills of bicycle use, and learn how to prevent
accidents as well as enjoyment of riding bicycles.
c. Home safety support program
Considering that falls inside and around homes are of high risk among
elderly as seen at “Figure 35. Locations of Injury and Age Group( inside/outside home)” and “Figure 36
Causes of Injuries and Age Group (outside home)”, the city subsidizes costs of removing level
differences and installing handrails in homes for elderly who are not covered by the Long term care
insurance.
d. Motility function improvement programs
Considering fall as one of high risk of injuries among elderly as seen at
“Figure 35. Locations of Injury and Age Group( inside/outside home)” and
“Figure 36 Causes of Injuries and Age Group (outside home)”, exercise
programs are provided to senior to improve their motility function, since
improvement physical function is also expected to contribute to reduction of
injuries at cases of fire and disasters.
e. Publicity of disaster information See “(4) Safe Elderly” in p 50
f. Installation of self-action fire distinguishers & fire alarms See “(4) Safe Elderly” in p 50
g. Furniture turn-over prevention See “(4) Safe Elderly“ in p 50
h. Injury prevention at ports events
In order to provide immediate medical and health services, Public health nurses or doctors are
dispatched at various sports events. AED( automated external defibrillator) are also arranged for
emergency.
i. River Patrol
See “(8) Disaster Prevention Programs” in p57
a a
b
d
f
g h
i
57
(7) Work Place Safety Program Programs Target Environment Purpose Period Partners
a. Certification for safety with “Emergency” logo
All ages All city areas life-saving of cardiopulmonary arrest patients
All year Corporations Emergency life-saving Division
Public Facilities b. Voluntary Work Place Safety Patrol
workers Companies in industrial complexes
Prevention of accidents at work places
All year Amadera Safety and Hygiene Appointed Group,
Kanagawa Prefecture Inland Industrial Park Cooperative Association
Atsugi Labor Standards Inspection Office
a. Certification for safety with “Emergency” logo
The “emergency” logo is issued to facilities where
AED (automatic external defibrillator) are set up and
employees are trained with proper use of AED.
b. Voluntary Work Place Safety Patrol
In order to prevent injuries at work places and
improve work environment, businesses in the
Amadera Occupational Complexes go on mutual
patrol for safety check at work environment in
collaboration with the Atsugi Labor Standards
Inspection Office. More information at “(8) Work place safety” at p74
In future perspective, it is understood that trials for safety promotion should be made to contribute to communities.
(8) Disaster Prevention Programs Programs Target Environment Purpose Period Partners
a. Comprehensive disaster drill
All ages Homes Disaster correspondence
Every September
・ Volunteer fire company ・ Designated public organization ・ Division of Disaster Prevention ・ Ward Community Centers
b. River patrols All ages River Flood damage prevention
All year ・ Atsugi Fire Department
c. Installation of fire extinguishers on city streets
All ages All city areas Fire damage prevention
All year ・ Division of Disaster Prevention
aa
b b
58
a. Comprehensive disaster drill
Residents and administrative bodies cooperatively
conduct practical training in order to minimize the
damage caused by national disasters such as
earthquakes.
b. River patrols
Officials periodically go on patrol along rivers and river beds to prevent water
accidents and fires.
c. Installation of fire extinguishers on city streets
Since 1980, street fire extinguishers have been installed throughout the city. Larger
fire extinguishers have been also installed in residential areas. Those fire
extinguishers are regularly maintained by the city government. * There are now 2,750 street fire extinguishers (powder type 10) installed throughout the city, and large fire extinguishers (two type 50) are installed at 33 locations. The street fire extinguisher installation standards are appropriately 1 for every 40 households.
(9) Community Safety Programs Programs Target Environment Purpose Period Partners
a. Training course of volunteer interpreters at disaster
Citizens from foreign countries
Disaster Translation of disaster information and provision to citizens who don’t understand Japanese
All year ・Disaster volunteer interpreters ・Division of Human rights and gender equality
b. Activities by pilot groups
pupils Schools communities
-Injury prevention -Prevention of bicycle accidents
All year ・Shimizu kids Sound Network Meeting
Pupils Students
Community -Reduce victim by suspicious individuals -Prevention of bicycle accidents
・Tomuro Ward Federation of Neighborhood Association
All age Community Overall Community safety ・Kamisanda neighborhood Association
All age Community Crime Prevention Reducing risky points
Mirai Bunka Kawamoto neighborhood Association
a. Training course of volunteer interpreters at disaster Volunteer interpreters are trained to provide information to foreign residents who require
a
c
b
a a
59
assistance during disasters because of their inadequate language skill.
b. Activities by pilot groups
See activities in p43.
(10) Safe Community PR Programs Programs Target Environment Purpose Period Partners
a. Training workshops
All ages All City Areas Improvement of awareness and knowledge of Safe Community
All year ・ Neighborhood Association ・ Atsugi Police Office ・ Companies ・ Schools ・ Section of Safe Community
b. Media relations All ages All City Areas Improvement of awareness and knowledge of Safe Community
All year ・ Media ・ Section of Safe Community ・ Division of PR
c. Enlightenment activities
All ages All City Areas Improvement of awareness and knowledge of Safe Community
All year ・ Neighborhood Association ・ Companies ・ Schools ・ Section of Safe Community
a. Training workshops At training workshops held in 2008 and 2009, approximately 5,000 people including citizens, city employees, and members of relevant organizations learned about Safe Communities.
b. Media relations Information about Safe Community is provided through various channels including city newsletters, newspapers, and radio broadcasts. (40 articles on Newspaper as of Jan, 2010)
b b b b
c
a a
b
60
c. Enlightenment activities Enlightenment activities are carried out by posters with the Atsugi’s Safe Community logo. The posters are put up in public facilities, convenience stores, and on public transportation vehicles (busses) etc. Besides, banners and stickers are also used to improve awareness of importance of safety and the effort to become a Safe Community.
c c c
cc
c
61
Indicator 3: Programs that target high-risk groups and environments, and programs that promote safety for vulnerable groups In order to overcome the priority challenges at Atsugi City; (1)suicides, (2)traffic safety”,(3) feeling of safety and public safety, and (4)fall of elderly people, the following program have been conducted for high risk groups and environments.
1. Suicide prevention
(1) Characteristics An examination of deaths cases from 2002 to 2006 (Table 6) reveals that suicide takes the top cause of death between 20’s – 60’s (total of 211 people). In particular, 68% of suicides is conducted by adults at the age of 30 - 59 years old, therefore, this age group is considered as high risk of suicide.
(2) Safety improvement programs a. Forming liaison councils in organizations concerned with suicide prevention. b. Studying concrete measures with the Labor Standards Inspection Office and member
companies. c. Analyzing cases including suicide attempt by strengthening collaboration network with police
and fire department. d. Implementing “Sop Suicide” campaign to citizens, especially youth, in direct hand. e. Supporting survivors of suicide f. Studying measures of suicide prevention with consideration of possible increase in the suicide
rate.
Program Target Environment Directions Implementing organizations
- Support for failed suicides attempt
- Support for survivor of suicide
- PR activities for suicide prevention
Adults Elderly
All 【GOAL】 reduce suicides: a national challenge
Violence and Suicide Prevention Taskforce Team
62
2. Traffic safety
(1) Characteristics a. The rate of traffic accident by the elderly has been high (Table 18). Besides, in the age group of 10 - 19 years old, traffic accidents are more likely result in injuries or death other than causes. As for other age groups, traffic accidents tend to take upper ranks of cause of injuries and death. (Table 6)
b. According to police statistics in 2008, among all traffic accidents, bicycle accidents take 20% of all accidents, caused 15% of all injuries, and occurred most frequently from 6:00 a.m. to 10:00 a.m. as well as 4:00 p.m. to 8:00 p.m. c. Many elderly people get injured by causing accidents by their own. d. According to police data, cyclists who caused accidents most frequently are 15 years old or
younger, which is higher than the average for Kanagawa Prefecture. (Fig. 26) The public opinion survey has shown that most injuries were caused by cyclists falling down on sidewalks by him/her own. (Figs. 27 and 28)
(2) Safety improvement programs a. Traffic safety measures – calisthenics and a variety of traffic safety programs (Combination of
“Active Driving Lectures”, traffic safety training, and “Traffic Training games for elderly” etc.) for the elderly.
b. Programs concentrating on youth Shimizu Kids sound network Meeting takes important roles in effort of safety promotion based on
the International Safe School, especially in terms of traffic accident prevention. b-1. Going home as group
To go home in safe, pupils leave for their homes together. Children at higher grades take care of lower grade children on their way home.
b-2. Eye of love See “Eyes of Love Program” in p 54
c. Programs to reduce bicycle accidents which taking about 20% of all traffic accidents
Beside programs mentioned above, Shimizu Elementary School puts effort on prevention of bicycle accidents
c-1. Campaign program for wearing bicycle helmet
c-2. Training for safe bicycle use
c-3. Practice of bicycle use Experienced children at high grade teach younger children how to bike safely.
63
Program Target Environment Directions Implementing
organizations - Improving driving environments
- Compliance with rules and manners
- Increasing helmet use among cyclists
All age groups
Bicycle traffic 【GOAL】 -Harmonious coexistence of bicycles, pedestrians, and automobiles
-Creation of bicycle friendly streets where people can ride bicycles safely and properly.
- Safety Bicycle Use Taskforce Team
- Shimizu kids Sound Network Meeting - Tomuro Ward Federation of Neighborhood Association
3. Feeling of Safety and Public Safety /Crime Prevention
(1) Characteristics The Fact-Finding survey on suspicious activities has revealed that many elementary and middle high-school girls have been targets of accosting, stalking, chasing, and other suspicious actions by which they can be victims of crimes.
By social research, to a question asking about recent improvement of the situation, “nothing has been done to improve public safety” took 21% of all responds and “there is no change” took 62%. In this situation, the most serious anxiety is that children might be accosted or abducted, followed by anxiety about natural disaster such as earthquakes (Fig. 22). It is, therefore, necessary to strengthen crime prevention activities rooted in the community.
(2) Safety improvement programs a. Regular basis survey on suspicious activities b. Survey on Safety, Health and Community, survey on satisfaction with community and life c. Program for commuting children; Eyes of love, Shelter points, etc. d. Crime prevention and disaster prevention measures
Program Target Environment Directions Implementing organizations
- Community Safety program by vehicles equipped with rotating blue lights.
- Measures for suspicious individuals measures
- Crime prevention measures
Children Routes from homes to school
【GOAL】 prevent crimes Focus on safety at city streets so that citizens can feel they can live safely and free from anxiety.
- Community Safety Council Liaison
- Tomuro Ward federation of Neighborhood Association
- Mirai Bunka Kawamoto Neighborhood Association
64
4. Elderly safety
(1) Characteristics The most frequent cause of injuries outside home is fall. Seen by age groups, many of those injuries were caused among elderly, especially people at 75 years old or older. On the other hand, as for cases of injured at home, people at 75 years old or older also tend to be injured by fall more than other age groups. Injury at home is especially considered as high risk because possibility of ending up with hospitalization is 1.8 times more than injuries occurred outside homes.
(2) Safety improvement program a. Exercise instruction to improve locomotors functions b. Fall prevention measures
Program Target Environment Directions Implementing organizations
Preventing fall through exercise and good dietary habits
Elderly Inside and outside of home
【GOAL】 -Reducing Injuries by fall among elderly -Reduction of medical treatment and nursing care costs
Elderly Safety Taskforce Team
65
Indicator 4: Programs that document the frequency and causes of injuries
1. Injury surveillance system To improve safety, Atsugi make the use of data based on the following processes; (1) In collaboration with the Atsugi Medical Association, universities and other concerned
organizations, the Atsugi City Injury Surveillance Committee analyzes various injury data (See Table15) which was collected and sorted by staff being in charge of data collection at each organization.
(2) The surveillance committee provides results of data analysis to the section of Safety promotion at Atsugi City.
(3) The section of Safety promotion at Atsugi City government makes arrangements for interventions of safety promotion in collaboration with the surveillance committee. The taskforce teams and pilot neighborhoods communities conduct in-depth analyze to clarify the detailed situation, and then implement effective and efficient programs for specific safety problems in communities.
Figure 48. Image of injury surveillance in Atsugi
Atsugi City Injury Surveillance System
Police Data
Survey on Public Opinion
Fire Dept.Data
Administrative Data
Medical Data
Data collection and analysis by each section
Setting up priority challenges
Task Force teams Pilot neighborhood communities
Influence by programs
Feedback
Clarifying detailed situation
Clarifying detailed situation
Program 1 Program 2 Program 1 Program 2
Data Analysis by Surveillance Committee based on ICECI
Data to be collected is listed at Table 15
66
2. Injury data collection system The following sets of data are used to identify safety problems, grasp trends of our community and influence of interventions.
Table 15. Long-term Injury Data Collection Plan Recording System 2007 2008 2009 2010 2011 Interval
a. Administrative data Conducted Conducted CollectingAnalyzing
Planed Planed Annually
b. Ambulance transport data
Conducted Conducted CollectingAnalyzing
Planed Planed Annually
c. Citizen’s consciousness survey
Conducted - CollectingAnalyzing
- Planed Every 2 years
d. Survey on Citizens’ satisfaction
- Conducted CollectingAnalyzing
Planed Planed Annually
e. Survey on Safety, Health and Community
- Conducted - - Planed Every 3 years
f. Survey on Bicycle Use
- Conducted - - Planed Every 3 years
g. Survey in Pilot neighborhood communities (Bicycles)
- Conducted CollectingAnalyzing
Planed Planed Annually
h. Statistics on Demographic situation, health
Conducted Conducted CollectingAnalyzing
Planed Planed Annually
i. Kanagawa Prefecture Police statistics
Conducted Conducted CollectingAnalyzing
Planed Planed Annually
j. Injury surveillance at Children’s Centers and Day-care Centers
- Conducted CollectingAnalyzing
Planed Planed Annually
k. Data at Work Place Conducted Conducted CollectingAnalyzing g
Planed Planed Annually
a. Administrative data Data including population, children, elderly, crimes, disasters, traffic and numbers of 119 calls is collected annually through various recording systems.
b. Ambulance transport data A system of data analysis in which ambulance transport data can be converted and analyzed based ICECI has been constructed. The system is expected to make good performance to analyze data based on ICECI in future.
67
c. Citizen’s consciousness survey For randomly selected about 4,000 men and women at 18 years old and over living in Atsugi City, a survey was conducted in order to clarify what the citizens think of Atsugi City and their view of future urban development of the city so that the city government can obtain information or citizen’s need to be applied to policies. This survey is scheduled to be held every two years.
d. Survey on Citizen’s Satisfaction Citizen’s satisfaction with the policies and administrative activities of Atsugi City is surveyed and analyzed to obtain basic information to improve management of the city and to evaluate its administrative activities. This process is scheduled every year.
e. Survey on Safety, Health and Community This survey was carried out to grasp the trend of injuries including gender, age and socio-ecological aspects, clarify the actual state of the occurrence of injuries and identify high risk groups. Moreover, questions were asked to reveal elements effecting on anxiety concerning public safety (people’s anxiety regarding harm caused by crime). The results are used to develop new safe community measures.
Outline of the survey: As of September 1, 2008, 7,000 household heads and their family members registered as residents of Atsugi City (1 household questionnaire + 3 individual questionnaire were sent), and 2,044 households (4,189 individual questionnaires) were recovered, achieving an effective response rate of 29.2%.
f. Survey on Bicycle Use The survey was carried out to clarify risks posed by bicycles and the mechanisms of bicycle related incidents and accidents, by studying consciousness of bicycle use, rules and manners, causes of anxiety, dangerous locations and the actual state of incidents and accidents.
Outline of the survey: For 2,000 users of bicycle parking facilities within a radius of 4km of Hon-Atsugi Station (1,160 bicycle parking facility users + 840 cyclists who park bicycles at public facilities, companies, and universities). A total of 695 questionnaires returned for an effective response rate of 34.8%
g. Survey on bicycle helmet use This survey was conducted at all elementary schools in the city in Sept. 2009 and will be continued annually from now on.
h. Statistics on Demographic situation, health Data concerning death, illness and injuries is annually provided by the Ministry of Health, Labor and Welfare. The data is used to find problems in Atsugi City by comparing with data for the entire nation and Kanagawa Prefecture.
i. Police statistics Data on traffic accidents, suicides, and crimes etc. are collected and analyzed by Kanagawa Police Department and Atsugi Police Department.
68
j. Injury surveillance at Children’s Centers and Day-care Centers At 37 Children’s Centers and Day-care Centers, all injuries are recorded and analyzed to improve environment so that children can study and play safely.
k. Data at Work Place Data from business in the city and the Atsugi Labor Standards Inspection Office are collected and analyzed to identify problems to improve safety at work places.
69
Indicator 5: Evaluation measures to assess their programs, processes and the effects of change. In Atsugi City, the Safe Community Programs, which have been undertaken as a set of comprehensive project, will be repeatedly reviewed and improved based on administrative evaluation. The series of process in assessment, clarifying effectiveness and efficiency of the project and reflection of the result of analysis contributes to improvement of safety and citizen’s satisfaction with community as a result. The result of the evaluation and review will be reflected to programs and announced to the citizens.
1. Managing the implementation of the Safe Community Programs For effective and efficient operation of safe community project, sets of Safe Community programs are assessed based on citizens’ satisfaction and other representative measures of evaluation.
SEE Clarify the situation
Atsugi Safe Community Promotion
Association
CHECK
Evaluate measures Evaluation work and
projects
ACTION
Form new policies and reflect them in budget creation by using and
revising evaluation results
Enact new plans by using evaluation
results and reflecting citizens’
views
DOPLAN Administer the city
with priority on citizens’ degree of satisfaction and achievements
70
2. Evaluation of Safe Community Program The city will collect and scientifically analyze data listed under “the Indicator 4”, which reflects actual conditions of the communities. In cooperation with citizens, administrators, and other relative bodies share result of assessments to promote their initiatives intended to achieve our common goals. To identify influence of programs, two questionnaire surveys will be carried out as a public opinion survey and the degree of achievement of goals will be examined.
(1) Goals
2008 2014
①Citizens’ satisfaction Percentage of Citizens who feel “City has improved to provide us healthy lives without accidents and injuries, safety and less anxiety about public. ”
37.2%
60.0%
②Survey on Safety, Health and CommunityAwareness of Safe Community among citizens
33.8%
80.0%
③Representative index Number of injuries, estimated number of injuries according to the Atsugi City Survey on Safety, Health, and Community
100,007
cases 92,400
cases
*including duplicate data
3. Establishment of partnership Based on strong partnership between Dr. Yoko Shiraishi, a coordinator for the Certifying Center in Suwon, Korea, and Mr. Hiroshi Ishizuki from the Japanese Society of Safety Promotion, the evaluation system for Safe Community Program will be formed. With the effort of safety promotion based on this system will take anxiety away from citizens and make people feel Atsugi City it a safe community to live with no anxiety about safety and security.
71
4. Achievements/improvements by SC programs
(1) Violence and Suicide Prevention a. Construction of a network by establishing the Suicide Prevention Measures Internal Liaison Council
b. Conducting the Suicide Prevention Street Campaign c. Displaying suicide prevention related materials in libraries d. Having workshops for suicide prevention
(2) Traffic Safety a. Reduction of traffic accident by improvement of
traffic lights
Table 16 Number of accidents at Taya intersection 2006 2007 2008 Total
Taya Intersection 19 18 1 38
b. Highlighting the sigh of STOP on roads.
The sight of STOP is emphasized to make drivers
aware of coming intersection.
(3) Reduction of anxiety about public safety a. Installation of crime prevention lights and increase
its illumination intensity (20 → 32W) FY 2007 (as of March 31, 2008)
b. Increasing number of vehicles equipped with rotating blue lights for crime prevention FY 2007 (as of March 31, 2008)
4 registered at end of March 2007
FY 2008 (as of December 31,2009) 41 registered in December 2009
a b c d
a
b
20W
32Wa
b b
72
(4) Elderly Safety Eliminating difference in level on the sidewalk and roads
(5) Children’s Safety a. International Safe School Project a-1. decrease of injury
5,636 cases (2008) 4,734 cases(2009)
a-2. increase the rate of bicycle helmets wearing (students who wear helmet / student who have bicycles) 8.8%(20008) 35.4%(2009) a-3. make today with no traffic accident As of May 31, 2010, 380 days of no traffic accident a-4. Improvement of environments - Improvement of a slope to the play yard. - Installation of equipments to prevent pupils’ falling from opened windows
- improvement of equipment of training curse for the competition of bicycle skill
b. Safety at children Centers and Day-Care Centers
Implementing injuries surveillance and giving training to children for safety promotion -Injury surveillance (2008~) -Training for danger prediction(2008~) -Improvement and expansion of lessons of traffic rules for parents& children
c. Reducing cases of accosting of children by a suspicious individuals by using safety vests and mapping those cases 2007: 70 cases 2008: 55 cases
(6) Bicycle Safety a. Effort by the taskforce team of safe bicycle use has come up with various approaches as below. a-1. Improvement of environment for bicycle use In FY 2009; 450m on Hon-Atsugi Matsue route was improved, considering difficulty in securing enough widths on the roads as seen in the pattern A and B. For example, bicycle safety driving improvement are arranged by making a detour around dangerous intersections as indicated with ‘○’ mark and points of frequent traffic accident as indicated ‘ ’.
2009年度
2010年度
2011年度
2012年度以降タウンモール(2008年に対策済)
横傾斜角度8% 横傾斜角度1%
a-1 a-2
a-3 a-4
a-4 a-4
b b
c c
a
73
a-2 Improvement of driving environment; routes or intersections where accidents occur frequently
- Painting color on paved roads -. Installation of guardrails -. Installation of road mirrors a-3 Bicycle accidents Prevention ( elderly &children) - When the citizens purchase children’s bicycle helmet or tandem bicycle, Atsugi City subsidizes part of its cost.(since 2010) - Provide education programs of traffic safety for kindergartens, elementary school, junior high
schools and senior citizen’s clubs, - Children’s bicycle events - Bicycle events for three generations - Regional welfare, traffic safety and crime
prevention educations a-4. Enlightenment activities about compliance with
rules and manners of bicycle use - Improve awareness of traffic rules and strict
control over violation of traffic regulation. - Improvement of awareness of dangerous traffic
spots - Distribution of safety map & safer driving route advise map made in collaboration with
communities - Improvement of cyclist’s manners, carrying out
monthly program of clear away motorcycle gangs
- Setting up a private organization for traffic monitoring center
a-5. Promotion of bicycle helmet use b. Future perspective of safe bicycle use With ongoing evaluation of current safety programs, the following is initiatives are planned. b-1. Assessments of safety measure plans and
intervention of long-, mid- and short- term programs.
b-2.Development of sustainable safety measures for high risk groups in terms of age groups and
environments. b-2 Establishment of system of evaluation,
assessment and improvement
3.0m未満1.5m以上
3.0m未満
整備パターンA(車道幅員に余裕のある)車道⇒自転車通行帯(自転車一方通行)
整備パターンB(車道幅員に余裕がない)
自転車歩行者道または歩道上自転車通行可(自転車相互走行)
Pattern A Pattern B
a-2
a-2
a-3 a-3
a-4
a-5
74
(7) Home and Leisure safety a. Safety at athletic events The Atsugi City Fire Department began to deploy emergency motorcycles to support an emergency system at the city marathon since 2008. b. Fire safety In response to introducing the obligation of fire alarm installation at homes in 2006, Atsugi City has been promoting alarms installation for free to the elderly living alone in 2009. c. Checking risk spots along rivers
a. b.
(8) Work place safety
a. The taskforce team of work place safety consists of three industrial business groups in Atsugi City;
Kanagawa Prefecture Work Safety and Hygiene Association Atsugi Branch, Atsugi Medical
Association and related national, prefectural and city administrative organizations. The team is
working on the safety promotion based on the concept, “Collaborations with Business Group”
Atsugi Medical Association
Atsugi Fire Defense Agency
Kanagawa Labor Safety & Health Association-Atsugi Branch (543 members)Tie-up with Atsugi Labor Standards OfficeGeneric Level-ups of Workers’ Safety & Health
Nairiku Industrial Park Cooperative (145 companies)Safety and Health CommitteeImproving Control Level of Safety and Health
Atsugi City Bureau concerned Safety Coordinating, GA, Industries, Development and Finance Depts.
Atsugi Police Station
Atsugi Labor Standards Office
Atsugi Chamber of Commerce, Industry Section (426 members)Stimulating local economy by industrial members
Amadera Industrial Park Council(61 companies)Amadera Safety & Health Specified GroupInter-company activities over 30 years
Companies
Administration
c
1979 1989 19992009
Occurrence
Trend of Occurrence of Industrial Accidents Injury resulting in leave
Injury without need of leave
c c
a
1979 1989 1999 2009
75
b. Based on the situation of accidents and injuries at work
places, Atsugi Labor Standard Inspections Office and the
Labor Department of Kanagawa Pref. analyze data to
develop effective and efficient measures for safety
promotion.
c. Mutual Patrol for Safety and Health
・ On volunteer bases, the mutual patrol is conducted by
member companies. This patrol is conducted once for each
member company every year.
・ At patrol, with follow up about improvements of safety since
previous patrol, result of patrol is reported and information
is exchanged between a company which had patrol and a
team of companies which conducted patrol.
・ Within a month, the information is also sent to Atsugi Labor
Standard Inspections Office to share information for safety
promotion. Patrols are conducted about 10 times per year
・ Amadera Safety & Health Specified Group started
voluntary mutual patrol in thirty year ago. The results of
their activities for the last thirty years show favorable
reduction of industrial accidents.
・ Taskforce team of Work Place Safety has been trying to
develop systematic measures for improvement of safety
from new points of view trough exchange information about
the mutual patrol for safety and health
d. Effects of the SC initiatives
・Atsugi Labor Standard Inspections Office and the taskforce
team of work place safety enlighten safety awareness by
providing information about industrial accident occurrence
via Atsugi City web site.
・Promotion of Safe Community program is clearly stipulated
in annual business plan of the committee member
companies.
・ Amadera Occupational Complex and Kanagawa Inland
Industrial Park are planning to promote mutual cooperation
and exchange information on voluntary patrol for safety and
health.
d
c
76
Indicator 6: Ongoing participation in national and international Safe Community networks. Atsugi City has participated in national and international network of Safe Community to learn from other
communities and share their experience and information. Referring to various programs on safety
promotion and injury prevention by SC designated communities inside and outside of Japan, the city
has been putting further effort to improve the Atsugi City Safe Community Programs.
1. Participation in national networks
(1) Relationships with domestic Safe Communities in Japan
Through participation in the designation ceremony of Kameoka City, which is the first Japanese city to
be designated as Safe Community, Atsugi City has continually studied initiatives and strategies of
Kameoka City.
(2) Participation in the Japanese Society of Safety Promotion
By presenting its initiatives to the Japanese Society of Safety Promotion and to the Nihon Shimin
Anzen Gakkai, Atsugi City has shared its experience and worked to form a domestic Safe Community
Network.
September, 2007: Participated in the Kyoto Safe Community Symposium
March, 2008: Attended to the Kameoka City Safe Community Designation Ceremony
Participated in the International Conference on Surveillance for Safe Community
October, 2008: Participated in and gave a presentation to the 2nd Academic Conference,
Japanese Society of Safety Promotion (Tokyo)
December,2008: Attended to the 5th Nihon Shimin Anzen Gakkai, Toda city
August, 2009: Attended to the Towada City Safe Community Designation Ceremony
Participated in and made presentations at the 3rd Academic Conference, Japanese
Society of Safety Promotion (Towada City)
November, 2010: Attended to the 6th Nihon Shimin Anzen Gakkai, Yokohama
March, 2010:Participated in the International Safe School Designation Ceremony at Ikeda
Elementary School attached to Osaka Kyoiku (Normal) University (Ikeda City, Osaka)
November, 2010: Hosting the 4th Academic Conference of the Japanese Society of Safety
Promotion (Atsugi City)
77
(3) Hosting visiting study groups
As a result of the dissemination of information about Safe Community projects at Atsugi City through its
web site and other media, the city become to accept study groups from many local governments.
Through these visits, the city has worked to popularize Safe Communities and importance of safety
promotion.
July, 2008: Oyama City in Tochigi Prefecture
Jan., 2009: Tsukuba City Assembly in Ibaraki Prefecture
April, 2009: Nagano Prefectural Police Department
July, 2009: Fukuyama City Assembly in Hiroshima Prefecture
Aug.,2009: Bureau of Social Welfare and Public Health, Tokyo
Nov., 2009: Association of Deputy Mayors of Saga Prefecture, Hose University, Kanto Gakuin
First period basic plan (6 years) Second period basic plan (6 years)
Phase 1 execution
plan (3 years)
Phase 2 execution
Plan (3 years)
Phase 3 execution
Plan (3 years)
Phase 4 execution
Plan (3 years)
Basic Plan (12 years)
・Assigning an SC manager and forming an expert committee ・Establishing the SC organization at City Hall (Exploratory Committee, Task Force) ・Establishing the SC Steering Committee ・Conducting Public Opinion Survey
・Establishing Countermeasure Committees ・Establishing Pilot neighborhood communities ・Studying injuries prevention programs ・Establishing the Injuries Surveillance Committee
・SC designation ・ Establishment of national SC Community Network
・Establishment of national SC network
-SC re-designation -Expanding and continuing injuries prevention and safety promotion
-Continuously collecting and analyzing injury data
-Activities to expand SC inside and outside of Japan
・Promotion of awareness about SC activities ・Participation to domestic and international SC networks
・Executing the injuries prevention Programs by the Taskforce teams and pilot neighborhood communities
・ Operation of Safe Community programs based on the Injuries Surveillance System
2009 2014 2015 2020
82
3. Future perspective of SC movement at Atsugi City
1. Re-designation as a member of International Safe Community
2. Establishment of Safe Community Network nationally and internationally a. Forming Safe Community Network in Japan
b. Participating and contributing to the International Safe Community Network
c. Supporting communities working to be members of the International Network of Safe Community
d. Providing opportunities to develop Safe Community movements through events such as
symposiums.
3. Diffusion of concept and activities of Safe Community a. Promoting SC programs based on the Atsugi Comprehensive Plan
b. Improving social governance approach
(Collaborative management of communities by various actors in community)
c. Implementing sustainable and long-term programs
d. Developing programs which record causes and frequency of injuries and accidents
e. Developing system to asses and evaluate processes and result of Safe Community programs
f. Promoting sustainable Safe Community project
〔Contact〕 Section of Safe Community, Division of City Safety, Department of Collaborative Safety, Atsugi City tel:046(225)2865 fax:046(221)0260 e-mail:[email protected]