55
C
M
Y
CM
MY
CY
CMY
K
WHO_Cover_Climate_change_health_DruckIII.pdf 1 19.07.2013 09:53:26


CLIMATE CHANGE AND HEALTH:A TOOL TO ESTIMATE HEALTH AND ADAPTATION COSTS
ABSTRACT
The WHO Regional Office for Europe prepared this economic analysis tool to support health adaptation planning in European Member States. It is based on a review of the science. It is expected to be applied in Member States mainly by line ministries responsible for climate change adaptation. It provides step-by-step guidance on estimating (a) the costs associated with damage to health due to climate change, (b) the costs for adaptation in various sectors to protect health from climate change and (c) the efficiency of adaptation measures, i.e. the cost of adaptation versus the expected returns, or averted health costs. The tool consists of a document describing the methods step-by-step and a manual with an Excel spreadsheet, which is a visual aid for calculating costs. To obtain the Excel spreadsheet, please send an e-mail to [email protected].
Keywords:Climate change
Costs and cost analysisDecision-making
Environment and public healthHealth economics
Health policy
.
ISBN 978 92 890 0023 9
Address requests about publications of the WHO Regional Office for Europe to:
Publications WHO Regional Office for Europe UN City, Marmorvej 51 DK-2100 Copenhagen Ø, Denmark
Alternatively, complete an online request form for documentation or health information or for permission to quote or translate documents from the Regional Office web site (http://www.euro.who.int/pubrequest).
© World Health Organization 2013
All rights reserved. The Regional Office for Europe of the World Health Organization welcomes requests for permission to reproduce or translate its publications, in part or in full.
The designations employed and the presentation of the material in this publication do not imply the expression of any opinion whatsoever on the part of the World Health Organization concerning the legal status of any country, territory, city or area or of its authorities, or concerning the delimitation of its frontiers or boundaries. Dotted lines on maps represent approximate border-lines for which there may not yet be full agreement.
The mention of specific companies or of certain manufacturers’ products does not imply that they are endorsed or recommended by the World Health Organization in preference to others of a similar nature that are not mentioned. Errors and omissions excepted, the names of proprietary products are distinguished by initial capital letters.
All reasonable precautions have been taken by the World Health Organization to verify the information contained in this publication. However, the published material is being distributed without warranty of any kind, either express or implied. The responsibility for the interpretation and use of the material lies with the reader. In no event shall the World Health Organization be liable for damages arising from its use. The views expressed by authors, editors, or expert groups do not necessarily represent the decisions or the stated policy of the World Health Organization.

Contents
Page
Acknowledgements IV
Abbreviations V
Foreword VI
Executive summary VII
1. Introduction 1
1.1 Aims 1
1.2 Why this tool was prepared 2
1.3 Information that can be generated 4
1.4 Economic components 6
1.5 Input required 7
1.6 Structure 8
2. Manual for calculating health and adaptation costs 8
2.1 Step 1. Define the scope 8
2.2 Step 2. Methods, data and sources and analysis 9
2.2.1 Estimating the cost of damage to health 9
2.2.2 Estimating the cost of adaptation 22
2.3 Step 3. Comparing the costs and benefits of adaptation measures 31
2.4 Step 4. Presenting results 32
2.4.1 Damage costs 32
2.4.2 Adaptation costs 33
3. Afterword 34
4. References 35
5. Glossary 37
Annex 1. Resources for assessing health impacts, vulnerability and adaptation to climate change 41
Annex 2. Useful data sources 45
III

Acknowledgements
This document was developed by Guy Hutton (Consultant), Gerardo Sanchez and Bettina Menne (WHO Regional Office for Europe). Valuable input and comments were received from Vladimir Kendrovski, WHO Regional Office for Europe, and Margarita Spasenovska, WHO Country Office, the former Yugoslav Republic of Macedonia, who tested the tool.
The tool was sent to a large group of peer reviewers, and comments were received from Gabrielle Chan (London School of Hygiene and Tropical Medicine, London, United Kingdom), Kristie L. Ebi (Stanford University, California, USA), Elke Hellstern and Rodrigo Castro Apablaza (German Development Bank, Frankfurt, Germany), Benedikt Sigurjohnsson (Iceland University, Reykjavik, Iceland), Frank George (WHO Regional Office for Europe, Bonn, Germany), Jostacio Moreno Lapitan (WHO Centre for Health Development, Kobe, Japan) and Mariam Otmani del Barrio and Marina Maiero (WHO headquarters, Switzerland).
We warmly thank Petra Gremmelspacher for the layout and Wendy Williams and Heike Kruse for continuous administrative coordination.
The initial review of economic studies in the European Region was carried out within the Climate, Environment and Health Action Plan and Information System (CEHAPIS) project, funded by the European Commission. The tool was then tested within a project for protecting health from climate change in seven European countries, funded by the International Climate Initiative, Germany.
IV

Abbreviations
DALY disability-adjusted life-year
GDP gross domestic product
LCU local currency unit
M&E monitoring and evaluation
SWOT strengths, weaknesses, opportunities and threats
UNFCCC United Nations Framework Convention on Climate Change
VSL value of a statistical life
YLL years of life lost
YLD years lived with disability
V

Foreword
Climate change is affecting human health. Its effect—largely negative—has been observed in several countries of the WHO European Region throughout the last few decades, continues today and is projected to worsen under probable climate scenarios. In order to cope with this emerging threat, authorities must evaluate current impacts and the vulnerability of their health systems and then prepare and implement adequate adaptation measures.
The best available evidence should be used in planning adaptation to protect health from climate change. In the context of limited public resources and competing priorities, the evidence should include estimates of the costs and benefits of taking action and the economic consequences of not doing so. The economic toolkit in this document will assist decision-makers in making such evaluations by providing explicit economic costs of the health impacts of climate change and the planned costs of adaptation.
The WHO Regional Office for Europe prepared this economic analysis tool to support health adaptation planning in Member States. It is based on a review of the science, with substantive input from several experts in the field. It is expected to be applied in Member States mainly by line ministries responsible for climate change adaptation. It will enable analysts at both regional and country level to generate better, more standardized economic data, help build vital capacity for health economic assessments and provide a link to decision-makers. The health impacts of climate change not only cause suffering but also entail avoidable economic costs. Adequate adaptation can reduce those costs and even bring additional economic benefits through hitherto unrealized opportunities. Economic data can help decision-makers to stress the benefits of adaptation, strengthening the case for early action against climate change.
This tool will support the efforts of WHO Member States to meet the commitment to act made at the Fifth Ministerial Conference on Environment and Health, act on World Health Assembly resolution WHA62.19 and implement the United Nations Framework Convention on Climate Change (UNFCCC).
Srđan MatićCoordinatorDivision of Communicable Diseases, Health Security and EnvironmentWHO Regional Office for Europe
VI

Executive summary
Climate change entails a wide variety of public health risks. Authorities and other stakeholders thus need to understand current and projected impacts of climate change and their implications for health in order to prepare and implement a variety of responses to ensure an optimal level of adaptation. Examples of such responses include early warning systems, emergency management plans and provisions and health systems strengthening; other preventive measures include safer housing, flood protection, vector control and improved surveillance.
To ensure that timely, effective adaptation measures are taken, planners must provide coherence among sectors and levels of governance. This strategic approach requires an objective understanding of the full health-related economic implications of climate change and of the range of alternative or complementary adaptation activities. In general, adaptation planners need to know (1) the costs of inaction and the economic consequences of the health impacts of climate change; (2) the costs of action, including adaptation measures in the health sector and also those taken in other sectors to protect health; and (3) the residual costs, as adaptation measures usually cannot avert all climate-related health impacts. This economic valuation tool can help to analyse these costs and benefits. It comprises three main economic components:
• the health damage costs associated with a “business-as-usual” (i.e. no adaptation) scenario under climate change;
• the costs of undertaking the necessary measures to minimize or prevent the health damage of climate change; and
• summary indicators of the economic performance of adaptation measures, in terms of either cost–effectiveness or economic benefits versus costs.
These economic components can be calculated with the valuation tool described in this document. As a visual aid for application of the tool, a simple Excel file is available upon request to the WHO Regional Office for Europe ([email protected]), which consists of three spreadsheets for data input and two spreadsheets for output. The method (with the supporting spreadsheets) can be applied either at the national level of aggregation or at the subnational level.
Some of the input required for its application is beyond the scope of this tool. Thus, the analytical team should ascertain the components of health damage due to climate change before applying the economic tool. These data can be obtained either from existing national (or subnational) assessments of vulnerability, impact and adaptation or from studies on specific health outcomes. If these are not available, a health impact assessment must be carried out before estimating the costs. WHO provides guidance on quantifying the health impact of climate change at national and local levels and other resources to assist Member States in their adaptation efforts.
VII

1
1 Marginal budgeting for bottlenecks tool (United Nations Children’s Fund, World Bank, Asian Development Bank, 2012); the WHO CHOICE model (WHO, 2003a); the WHO integrated health care technology package (WHO, South African Medical Research Council, 2013); MDG needs assessment tools (United Nation Development Programme, 2010); and the OneHealth impact model (Inter-agency Working Group, 2011)
1. IntroductionOver the past few years, scientists have shown unequivocally that the climate system is warming. Climate change has already affected human health directly by changing weather patterns (temperature, precipitation, sea-level rise and more frequent extreme events) and indirectly by changing water, air and food quality and the planet’s life support systems. Tackling the root causes of climate change, investing in healthy environments, strengthening health systems and advocating for healthy development could reduce the burden of disease and promote population health (Menne et al., 2007).
The European Commitment to Act, endorsed at the Fifth European Ministerial Conference on Environment and Health in Parma, Italy, in 2010, commits European Member States to protect health and well-being, natural resources and ecosystems and to promote health equity, health security and healthy environments in a changing climate.
World Health Assembly resolution WHA61.19 (WHO, 2008) urges Member States to prepare adaptation strategies and responses. In many cases, health is an integrated component of these health adaptation action plans, while in others additional plans are being prepared.
1.1 AimsThe WHO Regional Office for Europe prepared this economic analysis tool as a support for adaptation planning for health in Member States. Specifically, it will assist in:
• estimating the costs of health damage due to climate change at national and subnational levels;
• estimating the costs of health-relevant adaptation to climate change at national and subnational levels; and
• comparing the cost of health damage averted with the cost of adaptation measures, in order to reach conclusions on value for money.
While several health costing tools exist1 this tool is specific for climate change and allows the user to conduct relatively simple analyses. Depending on requirements and capacity, the user can choose how detailed the data should be, the level of disaggregation of inputs and outputs and whether additional research should be undertaken.
This tool is intended for use by health or environment managers and stakeholders in estimating health damage and adaptation costs. It is expected that it will be used mainly in ministries responsible for climate change adaptation, including ministries of health. Government departments can expect to be supported, if necessary, by academic institutions and other partners with strong technical and analytical skills in applying the principles, including possible support from international partners (other governments or multilateral agencies). The document might also provide useful information for universities and others involved in assessing health-related impacts of climate change.
Several types of technical knowledge are needed to use the tool, including economics, epidemiology, public health and health information. The user should be prepared to seek information from several ministries and from public health and health care institutions.

2
1.2 Why this tool was preparedMcMichael (2013) wrote, “The complex nature of climate change and its environmental and social manifestations result in diverse risks to human health”. The increases in some adverse health impacts are already large enough that they can be attributed to recent climate change, while more significant effects are projected for the coming decades and centuries (Confalonieri et al., 2007). Fig. 1 illustrates some of the observed and expected health impacts of climate change.
Fig. 1. Economic analysis of the health impacts of and adaptation to climate change
Source: Adapted from McMichael (2013).
It is clear that the atmospheric concentration of greenhouse gases will rise to levels that will have significant, wide-ranging, net negative health impacts during the twenty-first century. The challenge for policy-makers is to understand the current and projected impacts of climate change and their implications for health and to prepare and implement a variety of responses to ensure optimal adaptation. This range of responses includes, for example emergency response, disaster recovery and support to environmental refugees; strengthening health systems to treat diseases and health conditions as they occur; and preventive measures, such as safer housing, flood protection, vector control, improved surveillance, early warning information systems and community-based disaster risk reduction.
A strategic approach is needed to ensure that timely, effective adaptation measures are taken that are coherent across different sectors and levels of government. This strategic approach

3
2 In the case of health, residual damage equals (1) the total health costs attributed to climate change minus (2) the health costs that could be averted through adaptation measures.
requires objective understanding of the full economic and financial impacts of climate change and the alternative and complementary actions available to respond to these health threats.
Specifically, adaptation planners must know the costs of inaction, the costs of action and the costs of residual damage.2 This means taking account of the costs and benefits incurred by the various stakeholders, their interests and the relationships and flow of resources among them (Box 1). It also means clarifying the types of economic impact: distinguishing between measures that require additional cash outlay, additional budget allocations or displacement of budget from other activities and those that involve use of resources that do not require additional cash outlay but have a clear and identifiable opportunity cost (i.e. could be used in alternative activities). The level of cost of adaptation to climate change is largely a matter of perspective, as explained in Box 1.
Box 1. Interests of different stakeholders in knowing health and adaptation costs • International climate change financers: comparison of costs and returns of increased
health spending on different programmes or in different countries• Ministries of finance: overview of the budget impact or additional budget requirements
of all government sectors for informed resource allocation per sector or line ministry • Line ministries: budgetary and resource deployment of a ministry and working with
other ministries or the private sector to mobilize support for programmes• Households: expected cash outlays, other resource investments and use of cheaper or
subsidized services or products• Private sector providers: business opportunities for the supply of goods and services
Therefore, in the context of health adaptation planning, the main questions addressed in an economic evaluation are the following.
• What evidence is available to support decisions on appropriate allocations to reduce the health impacts of climate change?
• How much will the actions cost and what benefits can they bring about?
In 2010–2011, the WHO Regional Office for Europe carried out a literature review (co-funded by the European Commission) covering the 53 countries of the WHO European Region to identify and assess studies of the economic cost of adaptation to reduce the health implications of climate change. The review showed the following.
• There are very few European-wide studies that provide a comprehensive overview of the health and adaptation costs of climate change.
• Economic outcomes are analysed and reported differently in different studies, making comparison or compilation difficult.
• Only a narrow range of health impacts has so far been included in damage and adaptation cost estimates.
• There are significant gaps in health impact research, and health outcomes are not analysed by unit attributed to climate change.
• Information is needed on baseline mitigation and adaptation scenarios in view of the long-term nature of climate change.

4
The tool described in this manual will enable analysts at both regional and country levels to generate improved, more standardized economic data, build capacity for health economic assessments and provide a link to decision-makers.
1.3 Information that can be generated With numerical input and simple calculations, a range of damage, adaptation and efficiency ratios can be generated with this tool (Table 1).
Table 1. Major quantitative outputs of the tool
Health damage costs• Total national annual cost of climate change-induced health effects• Total national annual cost of climate change-induced health effects as a proportion of
gross domestic product (GDP) (damage cost ÷ total GDP)• Annual cost per capita of climate change-induced health impacts, for example:
◦ Total costs associated with climate-attributed health effects as a proportion of total damage costs associated with all health risks to society; requires data from studies of overall damage costs
◦ Evolution over time to estimate the changing importance of health effects due to climate change
• Annual projected additional cases of climate change-induced injuries, diseases and resulting disability-adjusted life-years (DALYs)
Health adaptation costs• Annual costs to (partially) reduce climate change-induced health effects
◦ by disease grouping
◦ by financing agency and line ministry• Annual health adaptation costs as a percentage of annual budget
• Evolution of the above over time (to estimate changing adaptation costs)Efficiency ratios• Health damage costs averted by spending a unit of money on adaptation measures• Cost spent per health unit gained
Both public budgets and private funds to address new health threats, such as climate change, are constrained. In order to maximize the return on investments, spending on adaptation measures should be rational and should respond in a cost-effective manner to the risks and opportunities associated with climate change. Therefore, decision-makers—both government and private—need a strengthened evidence base and tools to help them distribute the right amount of funds and resources to safeguard health from climate change. This tool can support decision-makers in the health sector and other health-relevant areas to generate information for the following.
• Impact analysis focuses on health, social or environmental impacts of climate change, thus providing information for health impact analysis (or assessment), risk or vulnerability assessment and Intervention impact assessment.

5
• Economic analysis guides general policy or specific projects and programmes, including “damage” cost assessment (i.e. cost of no action); cost of measures to reduce the health impacts of climate change; and health economic evaluation to compare the costs and benefits of alternative policy measures to reduce the health impacts of climate change. Health economic evaluation includes cost–benefit analysis, cost–effectiveness analysis and cost–utility analysis (see Glossary).
• Planning tools define programme and project approaches or components to prevent or minimize the health impacts of climate change, including budgeting, results monitoring (e.g. the logical framework “logframe” approach); analysis of strengths, weaknesses, opportunities and threats (SWOT); and multicriteria analysis.
• Policy studies allow consideration of strategic issues, such as political, contextual and human factors, that affect decisions or their implementation, including project evaluation, strategic assessment and stakeholder analysis.
The outputs of some tools commonly feed into others. For example, health impact studies form the basis for economic analyses, and, in turn, economic analyses provide input for planning or policy studies (see Fig. 2). Before decisions are taken, attempts should be made to compile all the relevant information for making informed choices. For example, if only health impacts are considered in a decision on resource allocation, the costs of interventions (i.e. efficiency) are not taken into account, thus reducing the proportion of people who could benefit from alternative, more cost-effective interventions. If a cost–benefit analysis includes only monetized variables, it will omit effects other than those on the market. Tools such as multicriteria analysis allow a broader perspective, enabling the user to compare and contrast different outcomes, with explicit rules for balancing a range of information. Many of these analyses are enhanced by including scenario testing and sensitivity analysis, which aid decision-making when there is uncertainty.
Fig. 2. Links among decision-making tools and decision outputs
Note. M&E: monitoring and evaluation.

6
1.4 Economic components Climate change has a wide range of implications for human health, including increased mortality and morbidity from extreme temperatures and other extreme weather events, infectious diseases (waterborne, foodborne and vector-borne) and diseases resulting from air pollution (WHO, 2009). Aside from the pain and suffering caused, those illnesses result in premature mortality, additional use of health care and lost productivity, thus burdening individuals and society with additional, partially avoidable loss of welfare, which can be translated into an economic cost.
Societies and authorities can put in place policies, plans and projects to cope with or avoid the impacts of climate change, including on health. These activities are known jointly as “adaptation”. They can reduce not only health effects but also the economic costs associated with premature mortality, health care use and lost productivity (Bosello, Roson, Tol, 2006; Ebi, 2008). Furthermore, effective adaptation may bring additional economic benefits through hitherto unrealized opportunities. The economic savings and potential benefits of health-relevant adaptation must be measured against the costs of implementing adaptation measures.
This economic valuation tool can help in analysing these costs and benefits. It comprises three main economic components:
• the health damage costs associated with a “business-as-usual” (i.e. no adaptation) scenario;
• the costs of undertaking the necessary measures to minimize or prevent health damage due to climate change; and
• summary indicators of the economic performance of adaptation measures, in terms of either cost–effectiveness or economic benefits versus costs.
Health costs (alternatively called “health damage costs”or “the health costs of inaction”) are defined in this tool as “the costs associated with climate change in the absence of planned adaptation or mitigation responses”. The objective of health costing analysis in the context of climate change is to show decision-makers the costs of inaction and to provide material for advocacy to raise attention about climate change, highlighting the value of health effects and the need to avert or reduce them.
Some previous health cost studies estimated the numbers of excess or attributable deaths due to climate change and multiplied them by the average value of life (a global value or a value based on GDP per capita of the country or region in which the deaths are expected to occur), to arrive at a total welfare loss (Tol, 1995; Fankhauser and Tol, 1997; Tol, 2002). Some studies also include the costs of treating additional cases of illness (Bosello, Roson, Tol, 2006; Watkiss et al., 2009). To date, health cost studies of mortality have focused mainly on heat or cold stress and in some cases natural disasters. With more comprehensive coverage of health impacts, the picture will be more complete and, importantly, more accurate. Importantly, the economic analysis will be more comprehensive, and more socially optimal decisions will result.
The true health costs of climate change extend beyond monetary estimates and cannot be described solely in that way. In the context of policy evaluation, money is only a proxy for welfare. Moreover, the impacts on welfare are felt differently by different population groups. If a health impact and its associated cost fall on two individuals with widely different incomes, the effect will be different. Hence, analysts should explore interpretations beyond aggregate numbers.
Health adaptation costs are defined here as “the costs of taking measures to reduce or to cope with additional impacts arising as a result of climate change”. The objective of these studies is

7
to identify the expenditure required for specific actions and thus allow realistic budgeting by fund-holding decision-makers. In adaptation cost studies, the health impacts of climate change are commonly used as a basis for estimating the cost of either preventing the impact or treating the effect once it has occurred. Adaptation cost studies have so far generally focused on vector-borne disease (malaria), waterborne disease (diarrhoea) and malnutrition (Ebi, 2008; Margulis and Narain, 2009).
As to summary indicators, the tool also facilitates health economic valuation, in which the costs and benefits of health adaptation measures are compared, with an estimate of a return on spending in the form of a cost–effectiveness ratio (such as cost per death averted) or a cost–benefit ratio (monetary return per currency unit spent). These summary indicators are provided to help understanding of the overall results of the calculations, but, ultimately, disaggregated information on health damage costs and adaptation costs and benefits should be taken into account in making a decision.
1.5 Input required The valuation tool described in this manual addresses the economic aspects of the health impacts of climate change, and of the adaptation measures and policies needed to minimize those impacts. Some input necessary for its application, however, requires additional analysis, which is beyond the scope of this tool. Fig. 3 illustrates the methodological steps in a full analysis. The steps in the red squares are to be undertaken either before the economic assessment (health damage) or additionally (effectiveness of adaptation).
Fig. 3. Economic analysis of the health impacts of adaptation to climate change

8
Specifically, analysts must ascertain the health damage components of climate change before using the tool. These can be obtained either from existing national or subnational assessments of vulnerability, impact and adaptation; or studies may be available on specific health outcomes, from which mortality and morbidity attributable to climate change can be obtained. If these are not available, a health impact assessment must be carried out before costs are estimated.
WHO provides guidance on quantifying the health impact of climate change at national and local levels, as well as other resources to assist Member States in adaptation (see annexes). In addition, there is a growing body of national and subnational studies on the effects of climate variables and/or climate change on a wide range of health outcomes. Relevant examples include the health effects of temperature (Ballester et al., 2011; Schifano et al., 2012), tick-borne diseases (Danielová et al., 2010) and flood-related mortality and morbidity (Jakubicka et al., 2010). The relevant literature in this field has been summarized elsewhere (Confalonieri et al., 2007).
Much additional research is required to understand the effectiveness of public health adaptation measures in decreasing mortality and morbidity related to climate change. To date, there has been no comprehensive study on the matter. This tool will allow rough sensitivity analyses to be conducted in the absence of specific data.
1.6 StructureThe tool consists of a manual describing the steps and inputs required and the methods, data and analysis for filling in data sheets. The Excel spreadsheet comprises five worksheets – three for data input and two for outputs, which include integrated formulas to facilitate calculations. It can be requested directly from the WHO Regional Office for Europe via e-mail ([email protected]).
The tool was developed by conducting an extensive literature review, with expert advice and expert review. It was pilot tested in the former Yugoslav Republic of Macedonia.
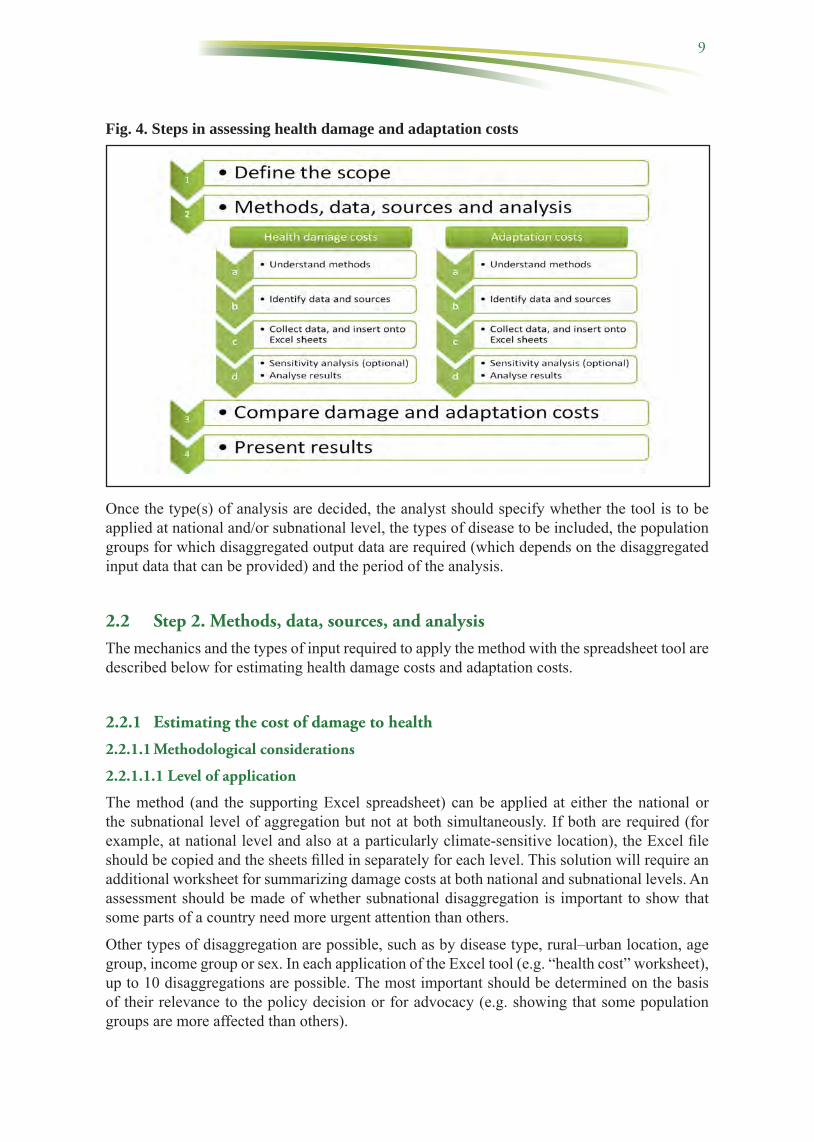
2. Manual for calculating health and adaptation costsFour steps are described for making estimates, applying the calculations proposed to assess the health cost of inaction, the cost of adaptation and efficiency ratios, and data input and analysis (Fig. 4). In the Excel file available to support application of the method, the data inputs are labelled “D” for damage cost and “A” for adaptation cost.
2.1 Step 1. Define the scope Before starting data collection and analysis, the scope of the assessment must be defined. The party that initiates the analysis must decide on the main question to be answered, for instance:
• To raise attention to climate change, highlighting the health effects and the need to avert or reduce those effects: a health damage cost analysis should be conducted.
• To identify the expenditure required for specific health actions to allow realistic budgeting by fund-holding decision-makers: a health adaptation cost analysis should be conducted.
• To compare the costs of adaptation measures with the health costs that could be averted by such measures: both a health cost and an adaptation cost analysis, with an assessment of the proportion of health impacts that could be averted by adaptation measures.
9
Fig. 4. Steps in assessing health damage and adaptation costs
Once the type(s) of analysis are decided, the analyst should specify whether the tool is to be applied at national and/or subnational level, the types of disease to be included, the population groups for which disaggregated output data are required (which depends on the disaggregated input data that can be provided) and the period of the analysis.
2.2 Step 2. Methods, data, sources, and analysisThe mechanics and the types of input required to apply the method with the spreadsheet tool are described below for estimating health damage costs and adaptation costs.
2.2.1 Estimating the cost of damage to health
2.2.1.1 Methodological considerations
2.2.1.1.1 Level of application
The method (and the supporting Excel spreadsheet) can be applied at either the national or the subnational level of aggregation but not at both simultaneously. If both are required (for example, at national level and also at a particularly climate-sensitive location), the Excel file should be copied and the sheets filled in separately for each level. This solution will require an additional worksheet for summarizing damage costs at both national and subnational levels. An assessment should be made of whether subnational disaggregation is important to show that some parts of a country need more urgent attention than others.
Other types of disaggregation are possible, such as by disease type, rural–urban location, age group, income group or sex. In each application of the Excel tool (e.g. “health cost” worksheet), up to 10 disaggregations are possible. The most important should be determined on the basis of their relevance to the policy decision or for advocacy (e.g. showing that some population groups are more affected than others).

10
2.2.1.1.2 Cost disaggregation (economic and financial)
To avoid overly burdensome data collection requirements and cumbersome spreadsheets, only a simple twofold cost disaggregation is proposed, which distinguishes between full welfare value and short-term budget impact. This disaggregation is expected to be understandable and meaningful for most decision-makers. It is useful for them to have overall estimates of impact on welfare and of the broader consequences for society of “doing nothing”, although they are also interested in direct budgetary implications. Further disaggregation of unit cost is not recommended for the damage cost tool (e.g. breaking costs down into labour costs, capital costs and materials). If the data are available, however, further disaggregation can be conducted for different population groups to allow a finer interpretation of the welfare impacts of the monetary costs. This might be useful, for example, when a given monetary loss is greater for some groups (e.g. the poor) than for others (e.g. the rich).
2.2.1.1.3 Time horizon and discounting
The “time horizon” is the number of years for which damage costs are to be measured. Owing to the time preference for money, the economic assessment “discounts” future costs and benefits to a common baseline year. The selection of the time horizon can be based on a commonly used number, such as 20 years, as used in many cost–benefit analysis studies, 100 years (WHO, 2003b) or another time based on a predefined rule. In assessing damage cost, two main factors are taken into account in deciding the time horizon:
• The size of the discount rate is the first. The higher the discount rate, the less future economic impacts are worth in the present. At a 3% discount rate (a common value in the evaluation of environmental policies) impacts in 24 years are worth half what they are today; at a 5% discount rate, impacts in 15 years are worth half what they are today; at an 8% discount rate, impacts in 9 years are worth half what they are today.
• The second is the behaviour of health impacts over time. In the case of diseases that are causing a diminishing number of cases over time because of successful control policies, there would be clear arguments for reducing the time horizon. In damage cost estimation of climate-related diseases that are expected to increase over time with little or no mitigation, there would be justification for extending the time horizon.
The model allows for 15 single-year periods from 2006 to 2020 (see “start year”, below); however, the start year can be changed and the number of years adjusted. To allow for longer time horizons, seven decade periods until 2100 are included in the spreadsheet. The future health costs expressed in current prices are likely to be important only if a very low or zero discount rate is chosen. After 100 years at a 3% discount rate, however, the impacts are worth one twentieth the same impacts occurring today. With a time horizon of 50 years, the impacts are worth one fourth the same impacts occurring today. Therefore, 50 years might be an appropriate time horizon if health impact modelling covers such a period.
2.2.1.1.4 Start year
The three main options for a start year for a damage cost study are the following.
1. Focus on past damage costs, i.e. from some past year up to the present. In this case, the number of past years to include must be decided. Given the paucity of data on past health impacts, it is not advisable to estimate damage costs before 2000.
2. Focus only on future damage costs, i.e. from the current year. In this case, the number of future years to include must be decided.

11
3. Estimate both past and future damage costs. In this case, the number of past and future years to be included must be decided.
The first year of the analysis should be entered in the first “year” column of the worksheet, and all future years will be updated. Expressing costs in currency values in the present year is usually most meaningful for decision-makers.
2.2.1.2 Data on health and health service use
Table 2 gives an overview of the data required to estimate health damage costs. In order to estimate health costs, three types of information or data are required: on health, on health service use and on economic factors.
Table 2. Data requirements for estimating health costs
Label Variable (per disease selected)D1 Health impact of selected disease in terms of number of cases and deaths
(total)D2 Health impact of selected disease that is climate sensitive (if different from
D1) in terms of cases and deaths (total)D3 Health impact of selected disease that is climate sensitive and attributed to
climate change in terms of cases and deaths (total)D4 Health-seeking behaviourD5 Rate of outpatient visitsD6 Rate of inpatient admissionsD7 Length of inpatient stayD8 Days off productive activitiesD9 Full unit costs of outpatient health careD10 Full unit costs of inpatient health careD11 Marginal unit costs of outpatient health careD12 Marginal unit costs of inpatient health careD13 Value of productive time lossD14 Value of life
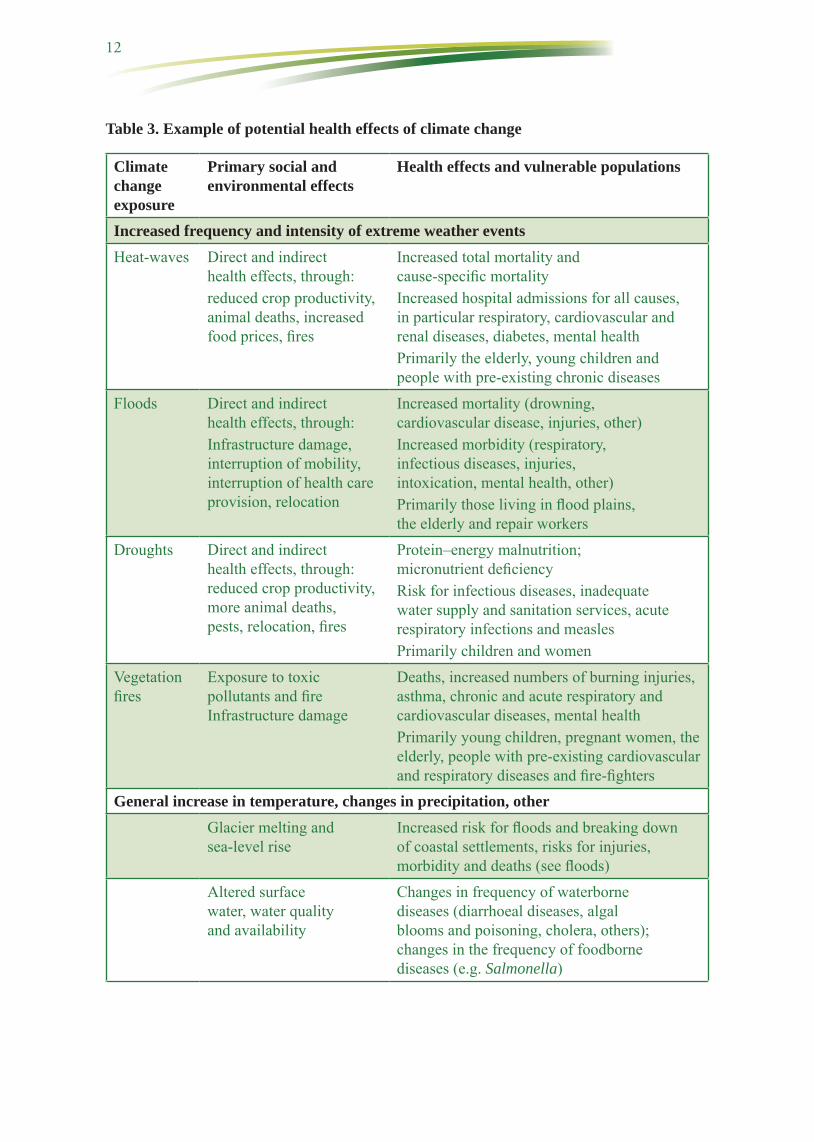
The health effects of climate change are wide-ranging (Fig. 1). To estimate the costs of damage to health, the mortality (deaths) and the number of cases in the study area per year (general) are required, as well as those attributable to climate change and other information to allow calculation of DALYs.3 Table 3 lists the potential health effects of climate change, building on Fig. 1. WHO has prepared guidance for estimating the attributable burden (see annexes). In countries that have already assessed the health effects or have undertaken studies, the data and information can readily be entered onto the spreadsheet. Countries that have not conducted studies or assessments must carry out a health impact assessment, before estimating the health costs.
3 One DALY can be considered one lost year of “healthy” life. The sum of DALYs in a population, or the burden of disease, can be considered a measure of the gap between current health status and an ideal health situation in which the entire population lives to an advanced age, free of disease and disability.
12
Table 3. Example of potential health effects of climate change
Climate change exposure
Primary social and environmental effects
Health effects and vulnerable populations
Increased frequency and intensity of extreme weather eventsHeat-waves Direct and indirect
health effects, through:reduced crop productivity, animal deaths, increased food prices, fires
Increased total mortality and cause-specific mortalityIncreased hospital admissions for all causes, in particular respiratory, cardiovascular and renal diseases, diabetes, mental healthPrimarily the elderly, young children and people with pre-existing chronic diseases
Floods Direct and indirect health effects, through:Infrastructure damage, interruption of mobility, interruption of health care provision, relocation
Increased mortality (drowning, cardiovascular disease, injuries, other)Increased morbidity (respiratory, infectious diseases, injuries, intoxication, mental health, other)Primarily those living in flood plains, the elderly and repair workers
Droughts Direct and indirect health effects, through: reduced crop productivity, more animal deaths, pests, relocation, fires
Protein–energy malnutrition; micronutrient deficiencyRisk for infectious diseases, inadequate water supply and sanitation services, acute respiratory infections and measlesPrimarily children and women
Vegetation fires
Exposure to toxic pollutants and fire Infrastructure damage
Deaths, increased numbers of burning injuries, asthma, chronic and acute respiratory and cardiovascular diseases, mental health Primarily young children, pregnant women, the elderly, people with pre-existing cardiovascular and respiratory diseases and fire-fighters
General increase in temperature, changes in precipitation, otherGlacier melting and sea-level rise
Increased risk for floods and breaking down of coastal settlements, risks for injuries, morbidity and deaths (see floods)
Altered surface water, water quality and availability
Changes in frequency of waterborne diseases (diarrhoeal diseases, algal blooms and poisoning, cholera, others); changes in the frequency of foodborne diseases (e.g. Salmonella)
13
Table 3. contdClimate change exposure
Primary social and environmental effects
Health effects and vulnerable populations
Reduced food yields, changed food prices and availability
Malnutrition and micronutrient deficiencies; child development
Ecosystem changes and changes in microbial ecology (host animals, vectors, pathogen multiplication)
Changes in the frequency of vector- and rodent-borne diseases (e.g. dengue, malaria, tick-borne diseases, Leishmania, depending on present or potential diseases that could appear in the study area)
Changes in air pollutant concentrations
Deaths and morbidity from cardiovascular and respiratory diseases
Conflicts and displacement Mental health and potential other risksLoss of jobs and livelihood Mental health and general capacity
to finance health services
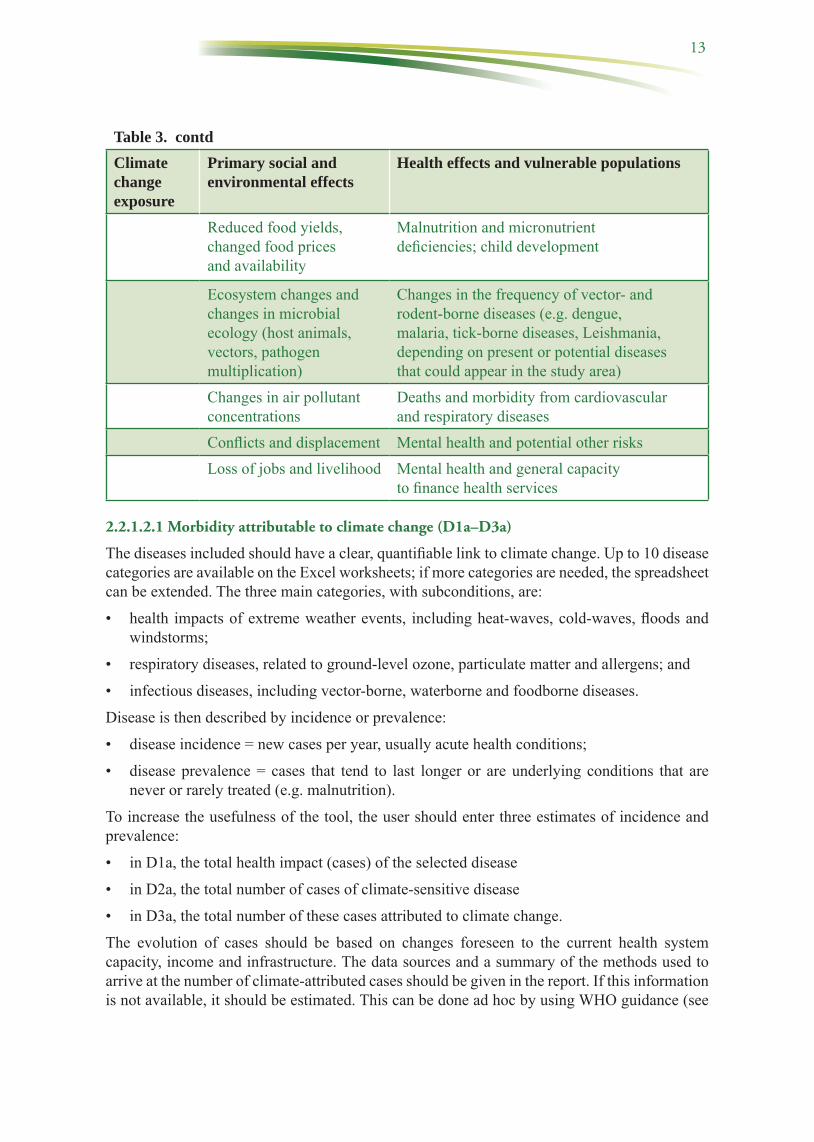
2.2.1.2.1 Morbidity attributable to climate change (D1a–D3a)
The diseases included should have a clear, quantifiable link to climate change. Up to 10 disease categories are available on the Excel worksheets; if more categories are needed, the spreadsheet can be extended. The three main categories, with subconditions, are:
• health impacts of extreme weather events, including heat-waves, cold-waves, floods and windstorms;
• respiratory diseases, related to ground-level ozone, particulate matter and allergens; and
• infectious diseases, including vector-borne, waterborne and foodborne diseases.
Disease is then described by incidence or prevalence:
• disease incidence = new cases per year, usually acute health conditions;
• disease prevalence = cases that tend to last longer or are underlying conditions that are never or rarely treated (e.g. malnutrition).
To increase the usefulness of the tool, the user should enter three estimates of incidence and prevalence:
• in D1a, the total health impact (cases) of the selected disease
• in D2a, the total number of cases of climate-sensitive disease
• in D3a, the total number of these cases attributed to climate change.
The evolution of cases should be based on changes foreseen to the current health system capacity, income and infrastructure. The data sources and a summary of the methods used to arrive at the number of climate-attributed cases should be given in the report. If this information is not available, it should be estimated. This can be done ad hoc by using WHO guidance (see

14
Annex 2) or by using available health impact estimates, for instance from countries with similar climatic conditions.
2.2.1.2.2 Mortality attributable to climate change (D1b–D3b)
The premature deaths entered should be those attributable to climate change. The evolution of the number should be based on changes foreseen to the current health system capacity, income and infrastructure. The data sources and a summary of the methods used to arrive at the number of climate-attributable deaths should be given in the report. If this information is not available, it should be estimated. As for morbidity, this can be done ad hoc by using WHO guidance (see Annex 2) or health impact estimates from countries with similar climatic conditions. Three estimates of mortality must be entered:
• in D1b, the total health impact (deaths) of the selected disease
• in D2b, the total number of climate-sensitive deaths
• in D3b, the total number of these deaths attributable to climate change.
In countries still undergoing rapid development, it is important to determine whether the future disease burden will be reduced by general development within and beyond the health sector. Hence, current disease burdens may be lower in the future not because of climate adaptation or response measures but due to a strengthened health system and greater resilience to the impacts of climate change. This distinction is, however, difficult to make quantitatively.
2.2.1.2.3 DALYs (D1c–D3c)
DALYs are calculated automatically from the numbers of cases and deaths entered in D1 and D2, combined with other data, which should be entered on the “inputs” worksheet, as follows:
• the discount rate (default of 3% per annum provided; Drummond et al., 2005);
• the duration of disability per case, in years, compiled from expert opinion, surveys and the literature (including WHO documents);
• the disability weight (loss in quality of life during illness from a perfect health score of 1.0), from WHO documents; and
• the average life expectancy of people who die prematurely from each disease (based on the average life expectancy in the country) at the average age of death from the given health condition.
Three estimates of DALYs are made automatically in the sheets:
• in D1c, the total health impact (cases) of the selected disease
• in D2c, the total number of cases of climate-sensitive disease
• in D3c, the total number of these cases attributed to climate change.
To avoid adding excessive complexity to the spreadsheets, the tool does not require the user to add age and sex disaggregation of disease burden. While this approach simplifies the analysis, it may result in some avoidable inaccuracies in the final damage cost estimates. For example, health care-seeking behaviour, length of treatment, days lost from work and unit costs can vary significantly by case and level of the health system, making it hard to enter “average” input values for the affected populations. A second disadvantage of not disaggregating health impacts by age and sex, and hence damage cost results, is that potential differences in health impact

15
distribution in the population are ignored; hence, response measures may be inappropriate for specific groups. If the analyst intends to enter age or sex disaggregation, the following three alternatives are proposed.
• List important disaggregation in the 10 spaces provided for health conditions, for example, distinguishing between adults and children for diarrhoeal diseases, for which the rates are usually specific to age. In this case, the analyst should specify the disaggregation in the worksheet (e.g. “cases of diarrhoea, adults”; “cases of diarrhoea, children”).
• Copy a new worksheet for each subset of the population, for example disaggregating between men and women or between adults and children. This solution requires an additional worksheet for summarizing health costs.
• Reformulate the current worksheet, adding rows to extend the number of possible disaggregations.
2.2.1.2.4 Sources of essential health data
Sources of essential health data are listed in Table 4. Further information is given in the annexes.
Table 4. Essential health data and their sources
Epidemiological parameter Data sourceNumber of cases of any particular condition
Number of cases attributed to climate change
Epidemiological studies, e.g. time series analysisHealth information systems Health surveys General surveys that include health variablesHealth impact analysis (attributable disease)
Number of deaths from any particular condition
Number of deaths attributed to climate change
Epidemiological studies, e.g. time series analysisHealth information systems Health surveysGeneral surveys that include health variablesHealth impact analysis (attributable disease)Scenario-based analysis
Proportion of cases attributed to climate change that are prevented by any given intervention
Health intervention studiesAssumptions
DALYs lost per case or per death Standard methods based on length of disease, severity weighting, life expectancy
2.2.1.2.5 Health service use data
Five main types of data on health service use and disease impact are required.
(1) The data on health care-seeking behaviour (D4) entered should reflect the proportion (%)

16
of patients seeking care from each main category of health care provider. A key variable in calculating health care costs is the proportion of patients who seek treatment. Some seek treatment from formal health providers, while others rely on informal health providers or treat themselves. All treatment has a cost, which should be quantified. Disaggregated input data for each type of disease may be lacking, and few sources can provide these data. Routine health information systems do not collect them, and other national surveys should be consulted.
(2) Outpatient visit rates (D5) are also required. To determine the costs associated with a patient seeking treatment, the average number of visits must be known, as some diseases require follow-up treatment, while for other diseases the first treatment may not work and the patient must return to the same or a different provider for a different type of treatment. The data sources on visits per case are, however, limited. Routine health information systems may have such information. The default value is 1 visit per case, unless data or arguments exist to modify it to another value. In fact, one visit per case is the minimum, as the variable is “Average visits per case of disease seeking treatment from a provider”.
(3) To determine the rate of inpatient admissions (D6) the figure needed is the proportion (%) of people seeking formal outpatient care who are admitted to hospital. Data from sample hospitals can be used, in which the number of outpatients is compared with the number of inpatients by disease grouping. These data can be compared with other types of survey data.
(4) The Length of inpatient stay (D7) stay can be accessed from hospital records or from expert opinion (e.g. ward nurses). It should reflect the lower level of inpatient facilities (e.g. district hospitals), to which most patients are admitted. If more than one level of inpatient care must be reflected, additional categories should be added to the sheet.
(5) The average number of days off productive activities (D8) is a key variable. Loss of time due to morbidity can cause welfare loss from loss of income or productive work, loss of school time and loss of leisure or non-productive activities, which also have a value. It is important to base this variable on data rather than assumptions. The number of days of lost productivity does not necessarily correspond directly to the length of an episode. People with mild acute disease or chronic diseases may work while they are sick, but they may be debilitated—either working fewer hours or less efficiently than if they were healthy. People with more severe acute diseases (malaria, typhoid, hepatitis) will not work at all during a period of their illness, before they feel able to return to their daily activities or their place of work. In both cases, the number of full-day equivalents lost from productive activities should be used. Productive time losses can also include the time and travel costs of family members, friends and paid carers accompanying the sick person to a health facility or collecting medications from a health facility, such as a pharmacy. This variable is clearly sensitive to the severity of disease, and severity can vary significantly within a single disease category. Hence, it may be worthwhile to distinguish two or more categories of high-impact diseases.
2.2.1.2.6 Sources of data on health service use
Essential data sources are listed in Table 5. Further information is given in the annexes.

17
Table 5. Essential data on health services use and their sources
Epidemiological and health service parameter
Data sources
Proportion of patients who seek treatment Health surveysHealth service dataAssumption
Outpatient visit rates Published studies Health service data (medical records)
Inpatient admission rates Published studies Health service data (medical records)Interview with health providers
Length of inpatient stay Published studies Health service data (medical records)Interview with health providers
Length of illness (for productivity loss) Published studiesHealth surveysHealth service data (medical records)Interview with health providers
Note that use rates may be less than optimal because of unexpressed need for health services. Interpretation of damage cost results is therefore clearer if health service availability, such as population coverage of primary and secondary health facilities, is recorded separately.
2.2.1.3 Economic data and their sources
The valuation method used in the tool follows conventional market-based costing techniques, with current prices of labour, services and products that are used or affected by the health impact (Sugden and Williams, 1978; Pearce and Nash, 1981; Hanley and Spash, 1993). Information is required on five economic variables.
2.2.1.3.1 Full unit costs of outpatient health care (D9)
Unit costs should include all aspects of treatment, including fixed costs such as staff and medical and non-medical equipment, as well as variable costs, such as supplies, medications and laboratory tests. Unit costs should be as specific as possible to each type of disease. As not all patients with a particular disease will receive exactly the same treatment (because of non-availability of medications or laboratory tests or differences in severity that require different protocols), the average cost per patient should be estimated. For most diseases, the consultation costs at public clinics and hospitals within a country will be similar, with variation mainly in the supplies and medications used and, in some instances, diagnostic laboratory tests. For each disease, the percentage of patients who receive different types of medication, laboratory tests, intravenous drips and referral to higher-level facilities should be assessed.
18
For the purposes of economic evaluation, it is important to note that the price of publicly subsidized treatments and medications does not represent their full cost to society. For the purposes of cost estimation, the cost of unsubsidized, privately purchased goods and services is the best. To ensure that the full costs of resources are captured, the prices or tariffs of any publicly subsidized services should be adjusted to omit the subsidy element (WHO, 2010b). Services at public facilities, such as medication prices, should be compared with those of private pharmacies or health care providers. Furthermore, the available unit cost data should be assessed for completeness and national representativeness. For example, unit costs from studies conducted in tertiary hospitals should not be used when most patients are treated in primary facilities.
For patients who buy their medications from private pharmacies, the average prices in those pharmacies should be used as the unit cost. The prices of medications are assumed to include a mark-up for the cost of pharmacy staff, distribution and transport and a (small) profit. The same is true for private shops or stalls (without a qualified pharmacist) at which sick people commonly purchase their medications, which tend to be cheaper than at a pharmacy.
The prices of private health care providers, such as nongovernmental clinics or hospitals, may be obtainable from these facilities. Patients’ bills are usually broken down by the treatment they received and the unit cost per treatment subtype. Hence, patients’ bills in theory include all the services they received.
For some diseases, unit costs vary by age group. For example, children are more likely to need a drip, whereas the dose of medication they require may be lower than for adults. The costs should be assessed case-by-case.
For formal health care, which is more likely to require transport to a health care establishment, travel costs per return visit are also required. Travel costs include the costs to both the patient and any accompanying people, especially for children. The unit cost should reflect the average transport cost for people attending any formal health care facility (clinic or hospital). The main cash outlays will be for taxi fares and bus tickets. When possible, the fuel cost for patients who use their own motorbikes or cars should be estimated and included. The average unit cost should reflect that for patients who use a mixture of forms of paid transport and for those who live close enough to walk or cycle to the nearest formal facility. Ambulance costs are not included in this category and, when possible, should be covered in the costs of health care.
2.2.1.3.2 Full unit costs of inpatient health care (D10)
The same principles apply to inpatient care. The inpatient cost per day should be estimated when possible and multiplied by the average length of stay per disease to estimate the total cost per admitted patient. When only the cost per admission is available from a study, one can either estimate cost per day on the basis of the average length of stay (in days) recorded in the study or insert the cost per admission in the “Cost per day” cells, and enter the number “1” in the “Average length of stay” cell to avoid multiplying by the average length of stay.
2.2.1.3.3 Marginal unit costs of outpatient (D11) and inpatient (D12) health care
For some budgeting decisions, marginal costs provide useful additional information on the immediate financial implications of changes in patient load. The marginal costs of outpatient care include additional items used in the care of one patient. Typically, staff, overhead and capital or building costs are not affected by the treatment of one additional patient. For example,

19
if a clinic receives and treats 100 patients in a morning, the listed costs would not be affected if an additional patient (the 101st) presented for treatment. Medications, supplies and chemicals used for laboratory tests and bus fares are, however, all additional costs that at some point involve additional cash outlay by the health system or the patient. The treatment of the 101st patient would have led to additional use of some of these resources, depending on the condition and the availability of diagnostic and treatment options. Therefore, when collecting health care unit costs, a breakdown between full and marginal cost should be made when possible.
2.2.1.3.4 Value of productive time loss (D13)
The value of labour time should be based on a nationally representative figure, such as the average wage, median wage or GDP per capita. These values are typically available from published economic statistics or from relevant government departments. International statistics provide standardized GDP measures.4 The annual value should be converted to a daily value on the basis of the number of working days per year.
The fraction of this value to be used for the estimated welfare impact should also be ascertained, as potential income foregone may not be a good measure of welfare loss. The value of time has been researched most thoroughly in the field of transport economics, in which it was shown to vary by travel mode, travel purpose and income (Gwilliam, 1997). The value of time lost from productive activities due to illness can be assessed by collecting information on what the sick person would have been doing with his or her time. If the person would have been working in a remunerated activity, the value of the lost production or income would be recorded as the economic loss due to their illness. If the person would have been working in a non-remunerative activity, the cost of replacing the person would be recorded, approximated by the average or minimum wage. If the person would have been enjoying leisure time, a value related to suffering from the pain and inconvenience of the sickness and not being able to undertake leisure activities would have to be recorded. Given the complex computations required to assess comprehensively the economic losses associated with many different foregone activities, some studies have applied an average value of productive time lost—30% of the average GDP per capita—to represent the overall opportunity cost of sickness time for the entire population (Hutton, 2012). This reflects an average for working populations, non-working populations and schoolchildren. If the majority of sick people are working, however, this percentage would be an underestimate of the value of productive loss.
Financial value depends on the loss of income of those who would have worked for a wage or whose own production leads to an income. It requires information on the proportion of sick people of working age and the proportion of those who lose income due to illness.
2.2.1.3.5 Value of life (D14)
The economic benefit for society of preventing premature mortality can be estimated by various methods. A “value of a statistical life” (VSL) is frequently used, representing the value that a given population places on the avoidance of one premature death. The concept is sometimes referred to as “value of a prevented fatality”, such as in the literature on transport safety. In the VSL, the qualifier “statistical” refers to the fact that the value does not refer to any one individual but to a statistical construct. In applying VSL values, it is important to avoid any misinterpretation (such as the notion of a price on human life), as the underlying concept of VSL is ultimately a society’s willingness to invest in the prevention of premature mortality.
4 Relevant examples are the databases of world development indicators compiled by the World Bank: http://data.worldbank.org/indicator/NY.GDP.PCAP.CD.

20
Another approach to the value of an avoided fatality is aggregating the income foregone by the premature death of an individual, a method known as the “human capital approach”. There are several other methods, but the VSL and human capital approach are the most widely used. WHO uses VSL in the context of another health valuation tool, the “health economic assessment tool” for cycling and walking (WHO Regional Office for Europe, 2008).
The basic method is VSL, with documented estimates of willingness to pay, while the alternative method is the “human capital” approach. The VSL method typically gives a higher value than the human capital approach. The algorithms are found on the worksheet.
The best estimates of VSL are obtained from well-conducted, relevant studies. When local studies are not available, analysts often draw on studies conducted mainly in countries of the Organisation for Economic Co-operation and Development. US$ 2 million is a common mid-range VSL in richer countries, although it varies from around US$ 1 million to US$ 10 million (Lindhjem, Analyse and Navrud, 2012).5 Extrapolation is typically made by adjusting for the proportional difference between the GDP of two countries.6 Extrapolation therefore requires updated GDP values for both the country and the country or countries for which VSL values are being extrapolated. VSL values should not be directly extrapolated from richer countries to lower-income countries of the European Region. For several reasons, including differences in income elasticity and risk perceptions, direct extrapolation is bound to severely affect the validity of the VSL.
Estimation of the value of life by the human capital approach requires: the average annual income per capita, annual discount rate of future income and income per capita real annual growth rate. The latter should be relatively conservative, reflecting expected long-term trends: for example, no more than a 5% growth rate, even if current economic growth rates are higher. The values should reflect average nationwide values. The cost for society of the premature death of an individual goes far beyond foregone economic income, so the human capital approach is widely considered to be an underestimate of costs. As it is based on market earnings, it also yields particularly low values for people not in the formal labour market, like children and retirees (Landefield and Seskin, 1982).
2.2.1.3.6 Sources of economic data
Table 6 gives the sources for finding data for estimating the various economic parameters.
In interpreting health cost results, it is important to understand that estimates of mortality carry a significantly higher proportion of the cost than health care and morbidity-related productivity; hence, the importance of correctly estimating the value of life. Illustrative examples are found in economic analyses of other global environmental health impacts (Hutton et al., 2006; Hutton, 2012) and country environment analyses (World Bank, 2008).
Any health service inefficiency can lead to an overestimate of true health costs, because observed unit costs and hospital length of stay are higher than in an efficiently operating system. In contrast, unmet demand for health services can lead to a lower rate of treatment-seeking than would be the case if services were more accessible. Also, some cost elements may be omitted, such as unpaid inputs (e.g. informal caregivers) and self-treatment, the costs of which may not be fully included in health service costing.
5 On the basis of over 900 observations, a study by the Organisation for Economic Co-operation and Development gave mean VSLs for three risk types: environment (US$ 8.7 million), health (US$ 4.7 million) and traffic (US$ 6.9 million), in 2005 prices
6 Multiply the VSL estimate by (the GDP per capita of the target country) ÷ (the GDP per capita of the country with VSL estimates).

21
Table 6. Essential economic parameters and their data sources
Economic parameter Data sources
Unit costs of health care (D9–D12)
Published literature Accounting data
Value of productive time (D13)
Proxy such as average wage, median wage, minimum wage or GDP per capita, converted to hourly or daily values
Value of premature death (D14)
VSL benefits transfera from published meta-analyses, adjusted to the countryVSL from country-specific studiesLocal estimate of value of life from lost wages (human capital approach)
a Taking a value from a study in one context and transferring it to another context. Usually, when there is a difference in income between settings, the VSL is adjusted by the difference in income.
2.2.1.4 Sensitivity analysis
Given the uncertainty inherent in various data inputs (e.g. estimates of attributable mortality and morbidity), it is informative to conduct a sensitivity analysis in order to assess the probable range of outputs from the model with different data inputs. To keep the sensitivity analysis simple, one- or multiway analyses can be conducted, with extreme scenarios for individual or multiple variables together. To conduct a one-way sensitivity analysis, the user should enter the high value for a single input variable and then record the results; the same procedure is followed for low values for the same input variable. This can be done, for example, with the disease or unit cost variables. For the value of life, the value for the human capital approach can be selected instead of the VSL value (in “health cost” worksheet, section D14).
To conduct a multiway sensitivity analysis, the user should enter the high values for several input variables together and then record the results; the same procedure is followed for low values for the same input variables. The high and low values this produces should be presented with the base case results and a conclusion drawn on how robust the estimates are.
2.2.1.5 Data analysis
From the data on the costs of mortality, health care and productivity losses, the spreadsheet calculates the welfare economic impact of the health damage and the financial impact of the damage.
2.2.1.5.1 Full damage costs (D16)
Estimation of full damage costs is handled automatically by the “damage cost” worksheet, and the summary figure should be transferred to the “outputs” worksheet (rows 69 and 73) for comparison with the adaptation costs. The numbers will reflect the full impact on social welfare. Any changes in the number of disaggregations (in D1–D3) or in the cost estimation method will therefore require updated algorithms in D15 and D17. Also, to produce graphics and summary tables, the analyst should structure the results accordingly. Table 7 shows the calculation algorithms used.

22
Table 7. Calculation of full damage costs
Type of cost FormulaFull health costs = Full health care costs + Health-related productivity costs +
Premature mortality costsFull health care costs = Full outpatient costs + Full inpatient costsFull outpatient costs = Health cases x Proportion of patients seeking outpatient care
x Number of outpatient visits per patient seeking treatment x (Full unit cost of health service per consultation + Full patient transport cost per visit + Pharmacy unit cost)
Full inpatient costs = Health cases x Proportion of patients seeking outpatient consultation x Hospital admission rate (admissions per outpatient) x Average length of hospital admission x (Full unit cost of inpatient health service per day + Full patient transport cost per visit)
Health-related productivity costs
= Health cases x Average number of days off productive activities x Economic value of a day spent sick
Premature mortality costs = Number of deaths x Value of life
2.2.1.5.2 Marginal (budget) damage costs (D17)
Estimation of financial damage costs is handled automatically by the “damage cost” worksheet, and the summary figure should be transferred to the “outputs” worksheet (rows 70 and 74) for comparison with the adaptation costs. The numbers will reflect marginal budget impacts (covering both households and public budgets). Any changes in the number of disaggregations (in D1–D3) or in the cost estimation method will therefore require updated algorithms in D16 and D18. Also, to produce graphics and summary tables, the analyst should structure the results accordingly. Table 8 shows the calculation algorithms used.
2.2.2 Estimating the cost of adaptation
2.2.2.1 Methodological considerations
2.2.2.1.1 Selection of health conditions
If a damage cost study has been conducted, the analyst will have a good indication of the main health impacts of climate change in terms of cases and deaths. The damage costs associated with the health impacts can guide the choice of the most important health impacts for inclusion in the adaptation cost exercise. There are no rules for selecting health impacts that are worthy of inclusion in an adaptation plan. To ensure that the main health impacts are covered, all the quantified health impacts that account for 90% of deaths or 90% of morbidity might be included. This is a two-stage criterion, as mortality and morbidity should be considered separately; for example, important health impacts may have low case fatality rates and would be included in the costing study because of the large number of cases of illness.
Some health impacts may be included in an adaptation costing which were not included in the damage cost study, either because there are no quantified health impacts for the disease or because the observed increase in the number of cases is not necessarily linked to climate change.

23
Table 8. Calculation of marginal damage costs
Type of cost FormulaMarginal health costs = Marginal health care costs + Health-related productivity
costsMarginal health care costs = Marginal outpatient costs + Marginal inpatient costsMarginal outpatient costs = Health cases x Proportion of patients seeking outpatient
consultation x Number of outpatient visits per patient seeking treatment x (Marginal unit cost of health service per consultation + Marginal patient transport cost per visit + Pharmacy unit cost)
Marginal inpatient costs = Health cases x Proportion of patients seeking outpatient consultation x Hospital admission rate (admissions per outpatient) x Average length of hospital admission x (Marginal unit cost of inpatient health service per day + Marginal patient transport cost per visit)
Health-related productivity costs
= Health cases x Average number of days off productive activities x Economic value of a day spent sick
In such cases, the adaptation costs for these health conditions can be included but with statements about the uncertainty involved. In the comparison of adaptation costs and damage costs averted, the adaptation costs related to these diseases should be removed from the comparison.
2.2.2.1.2 Selection of interventions
Once the health impacts have been agreed, the interventions that are likely to be needed for a rational, affordable response should be planned or simulated. Therefore, the interventions should be related to current sector policies, health and other infrastructure, human resource availability and probable effectiveness. As the calculation is a projection, any ongoing sector reforms likely to affect the interventions selected should be taken into account. The interventions will not respond to the actual health impact but will prepare for possible future impacts (i.e. risk).
Other sectors that affect health should also be considered and included in the estimate of adaptation costs, depending on the allocation of responsibilities and other activities in the country, such as:
• water supply and wastewater service providers: to protect these utilities from extreme weather events, to protect the environment from pollution and to provide clean water;
• industry and energy suppliers: to ensure a supply of clean energy and to regulate food safety;
• agriculture in its broadest sense, including land management, forestry and fisheries: to protect these resources from extreme weather events (e.g. droughts, floods) and their consequences, such as wild-fires, malnutrition and infectious diseases;
• municipal services: to protect municipalities from extreme weather events, support “green” transport and energy policies, provide “green” spaces and provide or regulate health services;
• housing and infrastructure: to protect these structures from extreme weather events, such as heat-waves and other health risks (infectious, respiratory);

24
• meteorological services: to prepare for extreme weather events and hence prevent some of the predicted effects;
• emergency services: to prepare and respond to extreme weather events and other health emergencies (e.g. outbreaks); and
• social welfare services: to support low-income households that do not have the financial means to pay for adaptive responses.
General adaptation measures that may be required to reduce the health effects of climate change and to protect population health7are the following.
• Integrate consideration of climate change into national and subnational health planning.
• Strengthen primary health care and public health action.
• Build capacity in the health workforce.
• Build climate-resilient infrastructure.
• Conduct advocacy and awareness-raising.
• Strengthen surveillance and early warning for climate-sensitive disease.
Table 9 lists measures required for specific health risks. Neither the preceding list nor this one is exhaustive; they should be adjusted on the basis of local and national public health adaptive capacity and systems. Annex 1 gives sources of information on adaptation measures that have been taken in various WHO regions.
For the purpose of improved cost presentation, interventions have been classified as being of two types:
• The first not specific to health conditions and may benefit a range of health conditions related to climate change. Some examples of this type of interventions are:
◦ sensitization and advocacy on climate change and health;
◦ policy on climate change adaptation;
◦ capacity-building, such as training and infrastructure projects; and
◦ technical work, such as building an evidence base.
These activities are not motivated by a single health condition. Further activity headings can be added when relevant. These costs can either be apportioned across the health conditions according to some allocation rule or kept as a separate category.
• Thesecondtypeofinterventionisspecifictohealthconditions. Activities and their costs are identified to target a single disease or health condition, such as hospital care, vaccination or community sensitization, and include health campaigns for a single health issue.
When there are alternative, competing interventions, it is best if the analyst explicitly estimates the costs of each but avoids adding the costs. The tool can be adapted to include costing of minimum, medium and maximum packages or policy responses.
7 A public health approach to climate change. In: Implementing the 7 country initiative on protecting health from climate change. Internal project document.
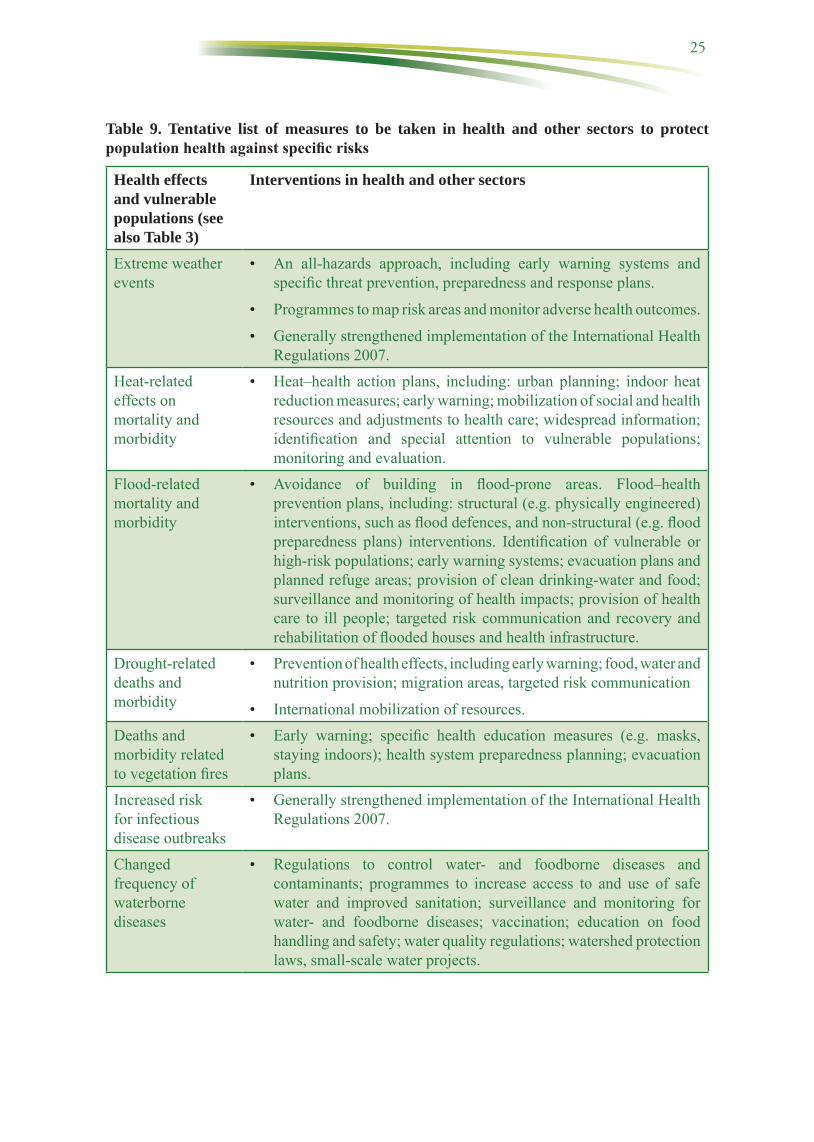
25
Table 9. Tentative list of measures to be taken in health and other sectors to protect population health against specific risks
Health effects and vulnerable populations (see also Table 3)
Interventions in health and other sectors
Extreme weather events
• An all-hazards approach, including early warning systems and specific threat prevention, preparedness and response plans.
• Programmes to map risk areas and monitor adverse health outcomes.
• Generally strengthened implementation of the International Health Regulations 2007.
Heat-related effects on mortality and morbidity
• Heat–health action plans, including: urban planning; indoor heat reduction measures; early warning; mobilization of social and health resources and adjustments to health care; widespread information; identification and special attention to vulnerable populations; monitoring and evaluation.
Flood-related mortality and morbidity
• Avoidance of building in flood-prone areas. Flood–health prevention plans, including: structural (e.g. physically engineered) interventions, such as flood defences, and non-structural (e.g. flood preparedness plans) interventions. Identification of vulnerable or high-risk populations; early warning systems; evacuation plans and planned refuge areas; provision of clean drinking-water and food; surveillance and monitoring of health impacts; provision of health care to ill people; targeted risk communication and recovery and rehabilitation of flooded houses and health infrastructure.
Drought-related deaths and morbidity
• Prevention of health effects, including early warning; food, water and nutrition provision; migration areas, targeted risk communication
• International mobilization of resources.Deaths and morbidity related to vegetation fires
• Early warning; specific health education measures (e.g. masks, staying indoors); health system preparedness planning; evacuation plans.
Increased risk for infectious disease outbreaks
• Generally strengthened implementation of the International Health Regulations 2007.
Changed frequency of waterborne diseases
• Regulations to control water- and foodborne diseases and contaminants; programmes to increase access to and use of safe water and improved sanitation; surveillance and monitoring for water- and foodborne diseases; vaccination; education on food handling and safety; water quality regulations; watershed protection laws, small-scale water projects.

26
Table 9. contdHealth effects and vulnerable populations (see also Table 3)
Interventions in health and other sectors
Changes in the frequency of foodborne diseases
• Regulations to control foodborne diseases and contaminants; food and nutrition action plans, surveillance and monitoring for foodborne diseases; education on food handling and safety.
Changes in the frequency of vector- and rodent-borne diseases
• Early warning systems; surveillance and monitoring for malaria and other vector-borne and zoonotic diseases; maternal and child health programmes, including vaccination campaigns; integrated vector management and environmental hygiene; education for individuals, communities and health-care workers for identifying and treating diseases.
Health effects related to air quality
• Strengthened air quality monitoring; programmes to alert the population and health-care providers on days with poor air quality or fires and appropriate personal protection measures to be taken; education for individuals, communities and health-care workers on the risks of poor air quality and appropriate protection measures to be taken; air quality regulations to control emissions of contaminants from traffic, industry and other sources.
Malnutrition and micronutrient deficiencies
• Monitoring programmes for malnutrition in vulnerable populations; programmes to support local food production and sustainable food sources; emergency response plans to increase food security; nutrition education for individuals and communities.
Mental health and possible other risks
• Mental health programmes, counselling.
General household ability to finance health care
• Programmes to protect financially weak families and households.
2.2.2.1.3 Expected health impact
The numbers of cases and deaths likely to be averted (that is, the effectiveness of adaptation) should be estimated on the basis of the health burdens and the selected interventions, as well as how many cases are correctly treated in a timely fashion.
In the simplest of cases, the assumption in the tool is that all mortality and morbidity could be avoided by adaptation. If that is considered unrealistic, successive iterations of the tool could be run in a sensitivity analysis, for instance assuming that adaptation can prevent 25%, 50% or 75% of all climate–change–related mortality and morbidity. Other proportions can be chosen, depending on the availability of data to support the choice, e.g. if a heat–health action plan has been running long enough to evaluate its effectiveness in a time series analysis. The

27
proportion chosen will affect the efficiency ratio, thus giving the analyst and end users a broader understanding of the magnitude of costs and benefits in different scenarios.
Note that the averted health impact will be not only that of the climate change-attributed burden but also the entire health impact. Estimating the health impact averted is an important step towards an economic evaluation, such as a cost–effectiveness or cost–benefit analysis. The analyst is referred to other guidelines for conducting economic evaluations (Tan-Torres Edejer et al., 2003; Organisation for Economic Co-operation and Development, 2006).
2.2.2.1.4 Level of analysis
The worksheets are flexible enough to be applied at any level of administration, such as district, region, oblast or country. The relevant parts of the worksheets can even be applied at health facility level, such as a hospital. If a single analyst does not have access to the full range of policies, interventions and costs, the worksheet can be broken up and distributed to different agencies to fill in and then reassembled.
2.2.2.1.5 Level of detail
To increase the accuracy and reliability of the costing exercise, the worksheets require specification of activities and hence the quantity of resources or services required, with unit prices. This enables the analyst or a third party to rerun the calculations when quantities or prices change or to conduct scenario and sensitivity analyses for risk management. As many stakeholders are involved in health adaptation, those responsible for implementation and financing are recorded with the activities and costing data. Adaptation cost estimates are made for different health conditions and implementation agents, as there may be competition for budget provision.
While the worksheets are currently not designed to provide a breakdown of subsector activities, which would help planning at the sector level, adjustments can be made. For example, it may be useful to know the type of service (preventive, curative, palliative) or the level of service (primary, secondary, tertiary, emergency) in the health system. For this, columns can be added with subservice types. Similarly, the costs of specific resources (e.g. staff, transport, overheads, equipment, medicines) can be shown, from the components of unit costs of different services.
2.2.2.1.6 Cost disaggregation
As stated in the introduction, a selection of cost disaggregations will allow use of the results by a range of stakeholders for different purposes. The following are considered important.
• Distinguish financial costs from economic ones. Financial cost figures show how much money must be raised from government budgets, donors or beneficiaries of the programmes, such as households. Economic costs summate the financial and non-financial costs, non-financial costs being resources that have an opportunity cost but that are not paid for in cash (e.g. volunteer time) or are already paid for and should be used for a different purpose (such as government staff and buildings). The inclusion of non-financial costs recognizes the fact that few resources are truly free, and resources usually have alternative uses, which justifies estimation of “opportunity cost”.
• Distinguish costs by who pays for the service provided. For costs met by government agencies, it is necessary to know to which ministry the funds should be channelled. For costs met by beneficiaries, an appropriate charging mechanism should be set up. To protect the poor and vulnerable groups, the mechanism may involve reducing the burden of payment, such as a targeted subsidy or a cross-subsidy from other services.

28
• Distinguish when a cost has to be paid. Not all costs have to be paid now; hence, for planning purposes, it is necessary to know when budgets have to be mobilized. Because of uncertainty in health impacts, responses and their costs in the longer term, a 10-year time horizon was selected for this costing study. Future costs are discounted to the present value at the selected discount rate. Costs are disaggregated, whether they refer to investments (which have to be paid at the start of a programme but have a lifetime of more than 1 year) or recurrent items, such as routine service provision, operations and maintenance. As some activities may be implemented for a limited period, the worksheet requests the analyst to distinguish when within the 10-year period a specific activity is expected to be carried out.
2.2.2.1.7 Period of analysis
The investment for some cost items lasts more than 1 year. The expected duration of investment must be recorded so that planning agencies know approximately when a re-investment is needed. It also allows calculation of annual equivalent costs (similar to a depreciation calculation in accounting). Some activities may have limited life span, as they are part of other activities or are expected to be replaced by other policies or technologies in the future. The starting and end year can be entered here. For activities that are required each year, a start date “1” and end date “10” are entered.
2.2.2.2 Data input
Table 10 gives an overview of the data required to estimate health damage costs.
Table 10. Overview of data requirements to estimate adaptation costs
Label For each adaptation action (A1), the following data are requiredA2 Resource use actionsA3 Responsible implementing agentA4 Percentage of final cost incurred by different agentsA5 Actual resource use and unit costA6 Economic costA7 Financial costA8 Period of validityA9 Period undertaken
2.2.2.2.1 Adaptation actions (A1)
Adaptation actions are classified as targeted at a single health condition (e.g. action to prevent malaria) or a general one, covering more than one health condition, such as health promotion or disease surveillance. For each health condition targeted with specific activities, a different “Adaptation specific” worksheet should be filled out. General actions that cover more than one health condition should be entered on the “Adaptation general” worksheet.
2.2.2.2.2 Resource use actions (A2)
Several actions may be recorded under a given activity. The purpose of the “action” description is to provide the level of detail required for costing. When there is more than one type of

29
resource use for a single action, additional rows on resource use should be added under that action. For example:
Activity: strengthened health services to treat additional cases in a timely fashion
Action 1: outpatient services provided
Resource use 1: diagnostic care (e.g. laboratory tests)
Resource use 2: consultation with professional provider
Action 2: inpatient services provided
Resource use 1: appropriate medications
Resource use 2: inpatient stay
It is important that it be possible to identify an appropriate “unit of measurement” and an associated unit cost at the level of “resource use” (see A5). Further disaggregation of activities might require significantly more data. For example it is easier to derive the unit cost of a hospital service, such as an outpatient visit, from the literature than to estimate the costs accurately on the worksheet from all the service and resource components (e.g. staff, equipment, materials, laboratory).
2.2.2.2.3 Responsible implementing agent (A3)
For the purposes of cost presentation, the analyst should pre-define the main actors and institutions that will implement the activity. There may be only two or three responsible agencies for a specific health condition. On the worksheet, the agency should be identified at its highest unit, such as the line ministry in the case of government. Other examples include a water utility or an inter-ministerial partnership. The responsible departments or units within the line ministry can be identified in the description of activities in separate documentation (i.e. the report).
2.2.2.2.4 Percentage of final cost incurred by different agents (A4)
The data entered in these cells should reflect who pays what percentage of the final service. The cells should add up to 100%, and the values should be explained in separate sheets. When the “Other” column is used, a footnote should be added stating who bears this cost. This is necessary for later calculation of the total costs to be financed by each sector or agency.
These data do not reflect the actual mechanism by which costs are financed, such as an up-front subsidy that is later recovered in service tariffs. It also does not show the role of foreign donors in lending money to governments, which is later paid back. Such transfers of money can be recorded separately to aid interpretation.
2.2.2.2.5 Actual resource use and unit cost (A5)
This section consists of four variables.
• “Units of measurement” show the units in which data are shown in the following column. The units could be e.g. “inpatient days”, “trained personnel”, “laboratory tests” or “vehicle kilometres”.
• “Units” are the numbers of units consumed in this activity.

30
• “Full unit price” reflects the full cost of the activity. When possible, actual production cost should be used rather than the prices charged to the service user. Some prices may be underestimates of the true cost of producing the service (e.g. a public health provider that charges tariffs below full cost), while other prices may be overestimates of the true cost of producing the service (e.g. high profits of a private provider). When unit cost studies were conducted before or after the base year, adjustments should be made.7
• “Marginal cost” includes resource uses that lead to an additional cost. For health services, for example, such costs are those for treating an additional patient or requiring an outlay in money (cash or credit). For outpatient care, they include the cost of medicines and supplies used by the patient. In other words, equipment and health personnel are usually not included in financial cost; the price paid should be used. All of the costs for new investments that must be made to increase capacity, including human resources, are counted as financial costs.
2.2.2.2.6 Total economic cost (A6)
These columns contain multiples of the economic unit price and quantity consumed. The result is presented in local currency units (LCUs).
2.2.2.2.7 Total financial cost (A7)
These columns present multiples of the financial unit price and quantity consumed. The result is presented in (LCUs).
2.2.2.2.8 Lifespan of investment (A8)
For some cost items, the investment lasts more than 1 year. It is important to record the expected duration of investment so that planning agencies know approximately when a re-investment is required and to enable calculation of annual equivalent costs (similar to a depreciation calculation in accounting).
2.2.2.2.9 Period of activity (A9)
Some activities may be implemented over a limited time; some may precede others or are to be replaced by different policies or technologies at some point. The starting and end years can be entered here. For activities that are required every year, the start date “1” and end date “10” are entered. Ten years is proposed as the maximum number of years for which policy-makers can plan future activities, given the significant degree of uncertainty in many variables after 10 years.
2.2.2.3 Data analysis
For the sake of simplicity, sensitivity analysis is not built into the tool. A sensitivity analysis can, however, be conducted by entering alternative input values and assessing the effect on the output. Alternative input values can be chosen on the basis of the available data, or a variation can be proposed by the user. This analysis can be conducted at the discretion of the user.
7 Multiply the inflation rate for the years between the cost data and the baseline year. For example: if the baseline year is 2008 and cost data are available for 2004, the cost value is multiplied by the inflation rate for each of the four intervening years. Likewise, if the base year is before the year of the available unit cost data, then unit costs should be adjusted downwards.

31
The purpose of the summary table is to estimate the costs for different government sectors (line ministries) over 10 years. An example table is presented in Table 11. Financial and economic costs are filled in separately in LCUs (see “output” worksheet). The private sector is not represented, as it operates on a cost recovery basis and hence either government or households pay for services. When donors or nongovernmental organizations are present, their activities can be represented separately on the worksheet. The sheets allow different types of presentation, such as by health condition, but these are not the focus of the summary presentation.
Table 11. Proposed final presentation of adaptation costs
Cost type and payee Total cost per year1 2 3 4 5 6 7 8 9 10 Total Present value
Annual recurrent costs Sector 1 Sector 2 Sector 3 Sector 4 Households Total Investment costs Sector 1 Sector 2 Sector 3 Sector 4 Households Total
2.3 Step 3. Comparing the costs and benefits of adaptation measuresWhen both climate-attributed health costs and adaptation costs have been estimated, the foundations have been laid for a crude cost–benefit assessment. Whatever adaptation measures are taken, however, they are unlikely to avert the full health costs, and there will therefore be residual costs. The residual costs are calculated as follows:
Residual costs = Total health costs attributed to climate change – Health costs that could be averted by adaptation measures
The health costs that can be averted by adaptation measures should be estimated by assessing the reduction in the numbers of cases and deaths that will result from the measures. It is simplest to apply a proportional reduction in health impact (cases and deaths) based on either the published literature, if available, or informed judgement.
The amount of resources invested in an adaptive measure (intervention “x”) depends on the reductions in health (and other) costs that can be bought with the measure. Efficiency ratios can be calculated from the collected data:
Benefit–cost ratio = Averted damage costs (intervention x): Adaptation costs (intervention x)
Three cost–effectiveness ratios can be calculated:

32
Cost per case averted = Adaptation costs (intervention x): Cases averted (intervention x)
Cost per death averted = Adaptation costs (intervention x): Deaths averted (intervention x)
Cost per DALY averted = Adaptation costs (intervention x): DALYs averted (intervention x)
2.4 Step 4. Presenting resultsThe results derived with the tool can be presented in various ways, depending on the target audience and communication needs. This section provides some examples of how data can be presented, reflecting for example the health damage and adaptation costs of heat and heat-waves at national level.
2.4.1 Damage costs
After having calculated the number of deaths or cases attributable to climate change, averaged over the period assessed, conventional economic methods can be used to value premature death, health-related productive time losses and health care costs. Fig. 5 shows an example of those costs attributed to climate change, which can be translated into total national annual costs as a percentage of GDP (Fig. 6).
Fig. 5. Costs of cardiovascular and respiratory diseases attributed to climate change (through heat waves), over a 5-year period
Note. LCU: local currency units.
On the one hand, because of the comparatively high value of a statistical life, premature death accounts for over 99% of the total costs, at an average of 72 million LCU per year. On the other hand, the health care cost, which is close to 600 000 LCU per year, constitutes an important monetary cost to the health system. Similarly, although productivity losses may seem comparatively small, they can provide solid arguments in advocacy and policy promotion.

33
Fig. 6. Damage cost of climate-change-attributed health effects of heat waves as percentage of GDP
2.4.2 Adaptation costs
Preventing the health effects of heat-waves requires a series of actions. Optimally, a country prone to hot spells should have a full heat–health action plan. Minimum measures range from early warnings to outreach and risk communication and investing in and mobilizing health and social services. Costs are incurred in a variety of ways. Fig. 7 gives an example of annual recurrent costs, at close to 3 million LCU per year. Over half of these costs fall on support agencies, and the rest are divided between health agencies and other national agencies.
Investment costs such as infrastructure, equipment and training are important for effective health preparedness and response. These are different in every country. In this example, the main one-off investment is made by the ministry of health, and social infrastructure and lesser investments by local governments (Fig. 8). These costs include energy efficiency measures, air-conditioning and water fountains in hospitals and nursing homes, and communication and awareness-raising for medical staff and the general public.
Fig. 7. Annual recurrent costs of adaptation measures to mitigate health risks due to heat-waves resulting from climate change

34
Fig. 8. One-off investment costs of adaptation measures to mitigate health risks due to heat-waves resulting from climate change
Damage and adaptation costs can be compared at the end of the costing exercise. In this example, it is possible to compare the damage costs of the increase in disease cases and deaths that was not averted with the costs of adaptation and, it is expected, a partial reduction in the health impact. If the adaptation cost is estimated at 3 million LCU annually plus 90 million LCU investment costs, and if investments are expected to last 10 years (a conservative assumption), the total annualized cost will be 12 million LCU. When compared with the total damage costs in the years considered of around 170 million LCU per year, the adaptation costs appear to be relatively small. However, the analyst must always acknowledge the uncertainty in the proportion of disease cases and deaths attributed to climate change and how many could be averted by the adaptation measures. Hence, it is difficult to make full cost–benefit comparisons.
3. AfterwordThis toolkit and the accompanying spreadsheet are intended to support efforts by Member States and policy-makers to plan and implement climate change adaptation policies. Advocates and citizens are also encouraged to use it, with other tools made available by WHO (see Annex 1). Calculation of the health costs of climate change can provide overall estimates of the economic magnitude of the problem, and estimates of adaptation costs illustrate the relative affordability of mitigating the health impacts of climate change. While health impacts cannot be fully represented in economic terms, many stakeholders respond more proactively when presented with climate change impacts in economic language. Furthermore, credible estimates of adaptation costs provide a basis for budgeting as well as assessing value for money.
Like other decision support aides, this tool is open to improvements, and feedback from users will be used to revise subsequent versions. Ultimately, the outputs from this toolkit will represent only one of several inputs to be considered in decision-making and policy cycles. By making explicit the economic consequences of the health impacts of climate change, planners, policy-makers and other actors can further strengthen the case for early adaptation.
WHO offers both on-site and long-distance training on how to use and implement the tool. To make a request, please send an e-mail to [email protected].

35
4. ReferencesBallester J et al. (2011). Long term projections and acclimatization scenarios of temperature-related mortality in
Europe. Nature Communications, 2:358.Bosello F, Roson R, Tol R (2006). Economy-wide estimates of the implications of climate change: human health.
Ecological Economics, 58:579–581.Confalonieri U et al. (2007). Human health. Climate change 2007: Impacts, adaptation and vulnerability.
Contribution of Working Group II to the fourth assessment report of the Intergovernmental Panel on Climate Change. In: Parry ML et al., eds. Fourth assessment report of the Intergovernmental Panel on Climate Change. Cambridge, Cambridge University Press:391–431.
Danielová V et al. (2010). Integration of a tick-borne encephalitis virus and Borrelia burgdorferi sensu lato into mountain ecosystems, following a shift in the altitudinal limit of distribution of their vector, Ixodes ricinus (Krkonose mountains, Czech Republic). Vector Borne Zoonotic Diseases, 10:223–230.
Drummond MF et al. (2005). Methods for the economic evaluation of health care programmes. 3rd ed. Oxford, Oxford University Press.
Ebi KL (2008). Adaptation costs for climate change-related cases of diarrhoeal disease, malnutrition, and malaria in 2030. Globalization and Health, 4:9.
Fankhauser S, Tol R (1997). The social costs of climate change: the IPCC second assessment report and beyond. Mitigation and Adaptation Strategies for Global Change, 1:385-403.
Gwilliam K (1997). The value of time In economic evaluation of transport projects. Lessons from recent research. Infrastructures notes (Transport NO. OT-5). Washington DC, World Bank.
Hanley N, Spash C (1993). Cost–benefitanalysisandtheenvironment. Cheltenham, Edward Elgar.Hutton G (2012). Globalcostsandbenefitsofdrinking-watersupplyandsanitation interventions toreach the
MDG target and universal coverage. Geneva, World Health Organization (WHO/HSE/WSH/12.01).Hutton G et al. (2006). Evaluationofthecostsandbenefitsofhouseholdenergyandhealthinterventionsatglobal
and regional levels. Geneva, World Health Organization.Inter-agency Working Group (2011). The OneHealth impact model. Geneva, The Partnership for Maternal,
Newborn & Child Health, World Health Organization (http://www.who.int/pmnch/topics/economics/costing_tools/en/index4.html).
Jakubicka T et al. (2010). HealthimpactsoffloodsinEurope:datagapsandinformationneedsfromaspatialperspective. A MICRODIS report. Brussels, Centre for Research on the Epidemiology of Disasters.
Landefield J, Seskin E (1982). The economic value of life: linking theory to practice. American Journal of Public Health, 72:555–566.
Lindhjem H, Analyse V, Navrud S (2012). Meta-analysisofstatedpreferencevalueofastatisticallifestudies:further model sensitivity and benefit transfer issues. Paris, Working Party on National Environmental Policies, Organisation for Economic Co-operation and Development (ENV/EOPC/WPNEP(2010)10/Final).
Margulis S, Narain U (2009). The costs to developing countries of adapting to climate change. New methods and estimates. Washington DC, World Bank
McMichael AJ (2013). Globalization, climate change, and human health. New England Journal of Medicine. 368: 1335–1343.
Menne B et al (2008). Protecting health in Europe from climate change. Copenhagen, WHO Regional Office for Europe.
National Research Council. (2011). Climate change, the indoor environment, and health. Washington, DC, The National Academies Press.
Organisation for Economic Co-operation and Development (2006). Metricsforassessingtheeconomicbenefitsofclimatepolicies:sealevelrise. Paris, Organisation for Economic Co-operation and Development, Paris.
Pearce D, Nash C (1981). Thesocialappraisalofprojects:atextincostbenefitanalysis. London, Macmillan.Schifano P et al. (2012) Changes in the effects of heat on mortality among the elderly from 1998–2010: results
from a multicenter time series study in Italy. Environmental Health, 11:58.Sugden R, Williams A (1978). Principlesofpracticalcost–benefitanalysis. Oxford, Oxford University Press.

36
Tan-Torres Edejer T et al., eds (2003). Making choices in health:WHO guide to cost–effectiveness analysis.Geneva, World Health Organization.
Tol R (1995). The damage costs of climate change: toward more comprehensive calculations. Environmental and Resource Economics, 5:353–374.
Tol R (2002). Estimates of the damage costs of climate change: Part I. Benchmark estimates. Environmental and Resource Economics, 21:47–73.
United Nations Children’s Fund, World Bank, Asian Development Bank (2012). Marginal budgeting for bottlenecks (MBB) tool. New York, UNICEF (http://www.devinfolive.info/mbb/mbbsupport/).
United Nations Development Programme (2010) MDG needs assessment tools. Vienna, United Nations Development Programme (http://www.undp.org/content/undp/en/home/librarypage/poverty-reduction/mdg_strategies/mdg_needs_assessmenttools/mdg_needs_assessmenttools.html).
Watkiss P et al. (2009). Impactsofclimatechangeonhumanhealth inEurope.PESETA-Humanhealthstudy.Brussels, European Commission Joint Research Centre, Institute for Prospective Technological Studies.
World Bank (2008). Tajikistan country environmental analysis. Washington DC, Environment Department and Poverty Reduction and Economic Management Unit, Europe and central Asia Region.
WHO (2003a). The WHO Choice model. Geneva, World Health Organization (http://www.who.int/choice/publications/p_2003_generalised_cea.pdf).
WHO (2003b). Climatechangeandhumanhealth:risksandresponses. Geneva, World Health Organization.WHO (2006). Guidelines for conducting cost–benefit analysis of household energy and health interventions.
Geneva, World Health Organization.WHO (2008). Resolution WHA61.19. Climate change and health. In: Sixty-firstWorldHealthAssembly,Geneva,
19–24 May 2008. Vol. 1. Resolutions and decisions. Geneva, World Health Organization (WHA61/2008/REC/1), 26–28.
WHO (2009). Protecting health from climate change: connecting science, policy and people. Geneva, World Health Organization.
WHO (2010a). Fifth European Ministerial Conference on Environment and Health, Parma, Italy Geneva, World Health Organization (http://www.euro.who.int/en/what-we-do/event/fifth-ministerial-conference-on-environment-and-health).
WHO (2010b). Worldhealthreport.Healthsystemsfinancing—thepathtouniversalcoverage. Geneva, World Health Organization.
WHO, South African Medical Research Council (2013). Integrated health care technology package. Geneva, World Health Organization (http://www.who.int/pmnch/topics/economics/costing_tools/en/index9.html).
WHO Regional Office for Europe (2008). Health economic assessment tool (HEAT) for cycling and walking. Copenhagen, WHO Regional Office for Europe (http://www.euro.who.int/en/what-we-do/health-topics/environment-and-health/Transport-and-health/activities/promotion-of-safe-walking-and-cycling-in-urban-areas/quantifying-the-positive-health-effects-of-cycling-and-walking/health-economic-assessment-tool-heat-for-cycling-and-walking).

37
5. Glossary8
Adaptation*
Initiatives and measures to reduce the vulnerability of natural and human systems against actual or expected climate change effects. Various types of adaptation exist, e.g. anticipatory and reactive, private and public, and autonomous and planned. Examples are raising river or coastal dikes and substitution of more temperature-shock resistant plants for sensitive ones.
Adaptation benefits*
The avoided damage costs or the accrued benefits following the adoption and implementation of adaptation measures.
Adaptation costs*
Costs of planning, preparing for, facilitating and implementing adaptation measures, including transition costs
Benefit–cost ratio+
A benefit–cost ratio is an indicator used in the formal discipline of cost–benefit analysis to summarize the overall value for money of a project or proposal. A benefit–cost ratio is the ratio of the benefits of a project or proposal, expressed in monetary terms, relative to its costs, also expressed in monetary terms. All benefits and costs should be expressed in discounted present values. A benefit–cost ratio takes into account the amount of monetary gain realized by performing a project versus the amount it costs to execute the project. The higher the benefit–cost ratio, the better the investment. A general rule of thumb is that the project is a good investment if the benefit is higher than the cost.
Climate change*
Climate change refers to a change in the state of the climate that can be identified (e.g. by statistical tests) by changes in the mean and/or the variability of its properties and that persists for an extended period, typically decades or longer. Climate change may be due to natural internal processes or external forcing or to persistent anthropogenic changes in the composition of the atmosphere or in land use. Note that the UNFCCC, in its Article 1, defines climate change as: “a change of climate which is attributed directly or indirectly to human activity that alters the composition of the global atmosphere and which is in addition to natural climate variability observed over comparable time periods”. The UNFCCC thus makes a distinction between climate change attributable to human activities that are altering the atmospheric composition and climate variation attributable to natural causes.
Climate scenario*
A plausible and often simplified representation of future climate, based on an internally consistent set of climatological relationships that has been constructed for explicit use in investigating the potential consequences of anthropogenic climate change, often serving as input to impact models. Climate projections often serve as the raw material for constructing climate scenarios, but climate scenarios usually require additional information, such as about the observed current climate. A climate change scenario is one that shows the difference between a climate scenario and the current climate.
Cost*
The consumption of resources, such as labour time, capital, materials and fuels, as a consequence of an action. In economics, all resources are valued at their opportunity cost, which is the value of the most valuable alternative use of the resources. Costs are defined in a variety of ways and under a variety of assumptions that affect their value. Cost types include: administrative costs, damage costs (to ecosystems, people and economies due to negative effects of climate change) and implementation costs of changing existing rules and regulation, capacity-building, information, training and education, etc. Private costs are carried by individuals, companies or other private entities that undertake the action, whereas social costs include also the external costs on the environment and on society as a whole. The negative of costs is benefits(also sometimes called negative costs). Costs minus benefits are net costs.
Cost–benefit analysis+
A cost–benefit analysis is a systematic process for calculating and comparing the benefits and costs of a project, decision or government policy (hereafter, “project”). Cost–benefit analysis has two purposes: (1) to determine if a project is a sound investment or decision (justification or feasibility), and (2) to provide a basis for comparing
8 The two main sources used were the glossary of the IPCC Fourth assessment report (*) and the report of the WHO Regional Office for Europe (2013) Towards a European strategy for environmental health economics (+).

38
projects. It involves comparing the total expected cost of each option against the total expected benefits, to see whether the benefits outweigh the costs and by how much. In cost–benefit analysis, benefits and costs are expressed in monetary terms and are adjusted for the time value of money, so that all flows of benefits and of project costs over time (which tend to occur at different times) are expressed on a common basis in terms of their “net present value”. The objective of a researcher conducting a cost–benefit analysis is to quantify in monetary terms every possible aspect or attribute (risk, quality, quantity, equality, utility, etc.) that has a cost or benefit as a consequence of the decision. This monetary quantification can be very difficult and controversial.
Cost–effectiveness analysis+
Cost–effectiveness analysis is a form of economic analysis for comparing the relative costs and outcomes (effects) of two or more courses of action. Cost–effectiveness analysis is distinct from cost–benefit analysis, which assigns a monetary value to the measure of effect. Cost–effectiveness analysis is often used in the field of health services, where it may be inappropriate to monetize health effect. Typically, cost–effectiveness is expressed in terms of a ratio, in which the denominator is a gain in health due to a measure (years of life, premature births averted, sight-years gained), and the numerator is the cost associated with the health gain.
Cost–utility analysis+
In health economics, the purpose of cost–utility analysis is to estimate the ratio between the cost of a health-related intervention and the benefit it produces in terms of the number of years lived in full health by the beneficiary. Hence, it can be considered a special case of cost–effectiveness analysis, and the two terms are often used interchangeably. Cost is measured in monetary units. Benefit should be expressed in a way that gives quantitative values to health states that are considered less preferable to full health. Unlike cost–benefit analysis, the benefits need not be expressed in monetary terms. Usually, they are expressed in DALYs, quality-adjusted life years or healthy life years. Putting a price tag on the health indicator effectively changes this type of analysis into a cost–benefit analysis.
Disability-adjusted life-year+
The disability-adjusted life year (DALY) is a measure of overall disease burden, expressed as the number of years lost due to ill health, disability or early death. Mortality and morbidity are combined into a single, common metric. Health liabilities have hitherto been expressed by one measure: (expected or average number of) “years of life lost” (YLL); however, this measure does not take into account the impact of disability, which can be expressed as “years lived with disability” (YLD). DALYs are calculated by taking the sum of these two components in the formula: DALY = YLL + YLD. The DALY relies on acceptance that the most appropriate measure of the effects of chronic illness is time—both time lost due to premature death and time spent disabled by disease. One DALY, therefore, is equal to 1 year of healthy life lost. Japanese life expectancy statistics are used as the standard for measuring premature death, as the Japanese have the longest life expectancy. The study of global burden of disease 2001–2002 counted life-years equally, but the 1990 and 2004 studies used the formula W = 0.1658 Y e–0.04 Y, where Y is the age at which the year is lived, and W is the value assigned to it relative to an average value of 1. In these studies, future years were discounted at a 3% rate, so that a weighted year of life saved next year is worth 97% of a year of life saved this year. The effects of the interplay between life expectancy and years lost, discounting and social weighting are complex, depending on the severity and duration of illness. For example, the parameters used in the 1990 study generally give more weight to deaths in any year before the age 39 than afterwards, with the death of a newborn weighted at 33 DALYs and the death of someone aged 5–20 years weighted at approximately 36 DALYs.
Discounting*
A mathematical operation in which monetary (or other) amounts received or expended at different times (years) are made comparable over time. The operator uses a fixed or possibly time-varying discount rate (> 0) from year to year that makes future value worth less today. In a descriptive discounting approach, one accepts the discount rates that people (savers and investors) actually apply in their day-to-day decisions (private discount rate). In a prescriptive (ethical or normative) discounting approach, the discount rate is fixed from a social perspective, e.g. based on an ethical judgement about the interests of future generations (social discount rate).
Gross domestic product+
Gross domestic product (GDP) is the market value of all officially recognized final goods and services produced within a country in a given period (usually a calendar year). GDP can be determined in three ways, all of which should, in principle, give the same result: the product (or output) approach, the income approach and the expenditure approach. In the expenditure method, GDP = private consumption + gross investment + government

39
spending + (exports – imports). The gross domestic Income is the total income received by all sectors of an economy in a nation. It includes the sum of all wages, profits and taxes, minus subsidies. As all income is derived from production (including the production of services), the gross domestic income of a country should be exactly equal to its GDP. Nevertheless, the listed figures are different in practice, as they are calculated in different ways. This difference is known as the “statistical discrepancy”. GDP per capita is deducted by dividing the GDP by the population of the country.
Human capital approach+
Before the concept of willingness to pay became widely accepted by economists as the appropriate evaluation method, the human capital approach was the main procedure used to appraise the social value of a lost life. In this approach the “value of life” is the value of the individual’s market productivity, assumed to be reflected by the individual’s earnings. The human capital is calculated as the individual’s present value of future expected earnings. The approach has two major drawbacks: it assigns a zero value to non-market production, implying that e.g. unemployed and retired persons have a value equal to zero; and it does not reflect individual preferences for safety.
Health impact assessment+
A health impact assessment is defined as “a combination of procedures, methods and tools by which a policy, programme or project may be judged as to its potential effects on the health of a population, and the distribution of those effects within the population”. The aim of a health impact assessment is to maximize the positive health impacts and minimize the negative health impacts of proposed policies, programmes or projects. The procedures for such assessments are similar to those for other forms, such as environmental and social impact assessments. The main objective of health impact assessment is to apply existing knowledge and evidence about health impacts to specific social and community contexts, to make evidence-based recommendations as a basis for decision-making in order to protect and improve community health and well-being. Because of financial and time constraints, health impact assessments do not generally involve new research or the generation of original scientific knowledge; however, the findings of these assessments, especially when they have been monitored and evaluated over time, can be used as a basis for other health impact assessments in similar contexts. The recommendations may focus on both the design and operational aspects of a proposal.
Market exchange rate*
The market exchange rate is the rate at which foreign currencies are exchanged. Most economies post such rates daily, and they vary little across exchanges. In some developing economies, official and black-market rates may differ significantly, and the market exchange rate is difficult to define.
Morbidity*
Rate of occurrence of disease or other health disorder within a population, taking into account age. Morbidity indicators include the incidence and prevalence of chronic disease, rates of hospitalization, primary care consultation rates, disability days (days of absence from work) and prevalence of symptoms.
Mortality*
Rate of occurrence of death within a population. Calculation of mortality takes into account age-specific death rates and can thus yield measures of life expectancy and the extent of premature death.
Net present value+
Net present value is the value of future (or past) payment(s) in current currency. The discount rate is the defining factor. An income of US$ 300 a year for 3 years starting today has a net present value of US$ 857.82 if the discount rate is 5%: year 1 (today); 300/(1 + 0.05)^0 + year 2; 300/(1 + 0.05)^1 + year 3; 300/(1 + 0.05)^2 = 300 + 285.71 + 272.11 = US$ 857.82. The further the payment is into the future, the less is its value today. This effect increases with a higher discount rate and vice versa. If the discount rate is 0%, a US$ 300 payment is worth as much today as it would be if it were received in 200 years. If the discount rate is set as negative (e.g. –1%), the US$ 300 in 200 years would be worth much more than if it were received today.
Non-market impacts*
Impacts that affect ecosystems or human welfare but that are not easily expressed in monetary terms, such as an increased risk for premature death or an increase in the number of people at risk for hunger.

40
Social discount rate+
The social discount rate is a measure used to guide choices regarding the value of diverting funds to social projects. It is defined as “the appropriate value of r to use in computing present discount value for social investments”. Determining this rate is not always easy and can result in discrepancies in the true net benefit to certain projects, plans and policies. It is the key input into calculating net present value. The social discount rate is directly analogous to concepts used in corporate finance, such as the hurdle rate or the project appropriate discount rate, so the calculations are identical. The benefit or cost per US$ can be calculated from: (1/(1 + r)^t), where r equals the social discount rate and t equals time. For benefits or costs that have no end, the rate is just (1/r). The social discount rate is a reflection of a society’s relative valuation of today’s well-being versus well-being in the future. Appropriate selection of a social discount rate is crucial for cost–benefit analysis and has important implications for resource allocation. Social discount rates very widely, developed nations typically applying a lower rate (3–7%) than developing nations (8–15%).
Value of a statistical life+
In social and political sciences, the VSL is the marginal cost of death prevention in a certain class of circumstances. It is therefore a statistical term for the cost of reducing the (average) number of deaths by one. In industrial nations, the justice system considers a human life “priceless”, thus illegalizing any form of slavery; i.e. humans cannot be bought for any price. With a limited supply of resources and infrastructural capital (e.g. ambulances) or skills, however, it is impossible to save every life, so some trade-off must be made. Furthermore, this argumentation neglects the statistical context of the term: it is not commonly attached to the lives of individuals or used to compare the value of one person’s life to that of another. It is used mainly in the context of saving lives as opposed to taking lives or “producing” lives. The VSL is the value that an individual places on a marginal change in his or her likelihood of death. It is thus different from the value of an actual life, as it is the value placed on changes in the likelihood of death, not the price someone would pay to avoid certain death. Developing markets have smaller VSLs. The VSL also decreases with age.
Willingness to pay+
Used in valuation techniques to determine “How large a lump sum of cash would you be willing to pay to not have contaminated drinking-water?” or “How large a lump sum of cash would you be willing to pay to have clean drinking-water?” A transaction occurs when willingness to pay exceeds the market price. Unlike the willingness to accept approach, willingness to pay is constrained by an individual’s wealth. For example, a person’s willingness to pay to stop ending his or her own life can only be as high as his or her wealth, while the willingness to accept payment to end one’s life would be extremely high, perhaps approaching infinity.
ReferencesPachauri RK, Reisinger A, eds. (2007). ContributionofWorkingGroupsI,IIandIIItotheFourthAssessment Report of the Intergovernmental Panel on Climate Change. Geneva, Intergovernmental Panel on Climate Change
WHO Regional Office for Europe (2013). Towards a European strategy for environmental health economics. Copenhagen, WHO Regional Office for Europe.

41
Annex 1. Resources for assessing health impacts, vulnerability and adaptation to climate changeWHO has been providing leadership and guidance on prevention of the health effects of climate change ever since it was identified as a public health threat by the scientific community. WHO has therefore published several documents and tools to assess health impacts and design health-protective climate change adaptation. These resources can be used by Member States in conjunction with the present one as support for analysing their adaptation efforts. Especially relevant resources are the following.
• WHO Regional Office for Europe (2003), which provides an overview of climate change risks for health and adaptation strategies;
• Campbell-Lendrum D, Woodruff R (2007), which provides guidance for estimating the health impacts of climate change, gives specific health outcomes as examples (temperature-related deaths, deaths and injuries from coastal and inland flooding, malaria and diarrhoeal disease) but can be used for any climate-sensitive outcome;
• Pan American Health Organization (2011), which provides a set of steps for assessing current health vulnerability to climate change and adaptation status, as well as future adaptation needs; and
• European Centre for Disease Control (2010), a handbook that provides a method for assessing national vulnerability to, impact of and adaptation to climate change and communicable diseases.
Training materials
WHO conducts capacity-building through seminars in Member States and by issuing training material. Some of these materials can be found on the WHO headquarters web site (http://www.who.int/globalchange/training/en/) and at WHO (2008a).
• The WHO Regional Office for Europe offers a range of training sessions on request (contact [email protected]). Further information is available online (http://www.euro.who.int/climate change).
• A training course for public health professionals on protecting health from climate change is available in South-East Asia (http://www.who.int/globalchange/training/health_professionals/en/index.html).
• An atlas of health and climate is available on the WHO headquarters web site (http://www.who.int/globalchange/publications/atlas/en/index.html).
• WHO has published a training manual, Heat waves, floods, and health impacts of climate change: training manual for city health officials, which is available on the WHO headquarters web site (http://web.wkc.who.int/projects/uhe/heatw/).
General United Nations training resources on climate change are available from the United Nations Institute for Training and Research (http://www.unitar.org/ny).
Global and regional strategies
World Health Assembly resolution WHA61.19 (WHO, 2008b).
WHO Regional Office for Europe (2010).

42
WHO Regional Office for the Americas (2011).
WHO Regional Office for South-East Asia (2010).
WHO Regional Office for Africa (2012).
WHO Regional Office for the Western Pacific (2012).
Other strategies
Mainstreaming gender in health adaptation to climate change (WHO, 2012a).
Adaptation measures
WHO (2011a) provides a list of measures and future adaptation needs.
Menne et al. (2008) give suggestions for strengthening health systems.
Emergency preparedness
Information on various aspects of emergency preparedness and response is available on the WHO headquarters web site (http://www.who.int/hac/techguidance/preparedness/en/):
• risk management.(WHO, 2011b);
• definitions of natural hazards (WHO, 2011c);
• hazard-specific:
◦ health in hot weather (WHO Regional Office for Europe, 2008);
◦ public health advice for heat (WHO Regional Office for Europe, 2011);
◦ water supply and sanitation (WHO Regional Office for Europe, United Nations Economic Commission for Europe, 2011);
• disaster preparedness in the Americas (http://new.paho.org/disasters/newsletter/index.php).
Infectious diseases
• International Health Regulations (WHO, 2005).
• Integrated vector management (WHO, 2013).
• Control of vector-borne disease (WHO Regional Office for the Western Pacific, 2012).
• Water and health (http://www.who.int/topics/water/en/).
• Food safety (http://www.who.int/foodsafety/en/).
Air pollution
• Air pollution (http://www.who.int/topics/air_pollution/en/).
• Black smoke (WHO Regional Office for Europe, 2012).
• Indoor environment (National Research Council, 2011).

43
Mental health
• Prevention of suicide (WHO, 2012b).
• WHO mental health gap action programme (http://www.who.int/mental_health/mhgap/en/).
Migration
• Forced migration (Piguet, 2008).
ReferencesCampbell-Lendrum D, Woodruff R (2007). Climatechange:quantifyingthehealthimpactatnationalandlocal
levels. Geneva, World Health Organization (Environmental Burden of Disease Series No. 14).European Centre for Disease Control (2010). Climate change and communicable diseases in the EU Member States.
Handbook for national vulnerability, impact and adaptation assessments. Stockholm, European Centre for Disease Control (http://www.ecdc.europa.eu/en/publications/Publications/1003_TED_handbook_climatechange.pdf).
Menne B et al. (2008). Protecting health in Europe from climate change. Copenhagen, WHO Regional Office for Europe.
National Research Council (2011). Climate change, the indoor environment, and health. Washington DC, The National Academies Press (http://www.paho.org/tierra/index.php?option=com_multicategories&view=article&id=192%3Aclimate-change-the-indoor-environment-and-health&catid=22%3Aair-contaminationpollution-and-health&Itemid=68&lang=es).
Pan American Health Organization (2011). Protecting health from climate change. Vulnerability and adaptation assessment. Washington, DC, Pan American Health Organization (http://www.who.int/globalchange/publications/Final_Climate_Change.pdf).
Piguet, E. (2008). Climate change and forced migration. Geneva, United Nations High Commissioner for Refugees (http://www.bvsde.paho.org/bvsacd/cd68/newissues153.pdf).
WHO (2003). Climatechangeandhumanhealth:risksandresponses. Geneva, World Health Organization (http://whqlibdoc.who.int/publications/2003/9241590815.pdf).
WHO (2005). International health regulations. 2nd Ed. Geneva, World Health Organization (http://www.who.int/ihr/en/).
WHO (2008a). Climate change and human health. Training course for public health professionals on protecting our health from climate change Geneva, World Health Organization (http://www.who.int/globalchange/training/health_professionals/en/index.html; accessed 12 April 2013).
WHO (2008b). Resolution WHA61.19. Climate change and health. In: Sixty-firstWorldHealthAssembly,Geneva,19–24 May 2008. Vol. 1. Resolutions and decisions. Geneva, World Health Organization (WHA61/2008/REC/1), 26–28.
WHO (2011a). Vulnerability and adaptation assessment. Geneva, World Health Organization (http://www.who.int/globalchange/publications/Final_Climate_Change.pdf).
WHO (2011b). Disaster risk management for health. Climate risk management. Geneva, World Health Organization (Disaster Risk Management for Health Fact Sheets) (http://www.who.int/hac/events/drm_fact_climate_risk_management.pdf).
WHO (2011c). Naturalhazardsdefinitions (Disaster Risk Management for Health Fact Sheets). Geneva, World Health Organization (http://www.who.int/hac/events/drm_fact_sheet_early_warning_natural_hazards.pdf; accessed 7 March 2013).
WHO (2012a). Mainstreaming gender in health adaptation to climate change programmes. Geneva, World Health Organization (http://www.who.int/globalchange/publications/mainstreaming_gender/en/index.html).
WHO (2012b). Public health action to prevent suicide. Geneva, World Health Organization (http://www.who.int/mental_health/publications/prevention_suicide_2012/en/index.html).
WHO (2013). Health and Environment Linkages Initiative. Geneva, World Health Organization (http://www.who.int/heli/risks/vectors/vector/en/).

44
WHO Regional Office for Africa (2012). AdaptationtoclimatechangeinAfrica:healthsectorplan2012–2016. Brazzaville, WHO Regional Office for Africa (http://www.afro.who.int/en/clusters-a-programmes/hpr/protection-of-the-human-environment/phe-publications.html; accessed 14 March 2013).
WHO Regional Office for the Americas (2011). Strategy and plan of action on climate change. Washington, DC, WHO Regional Office for the Americas (http://www.paho.org/hq/index.php?option=com_docman&task=doc_view&gid=20292&Itemid=; accessed 14 March 2013).
WHO Regional Office for Europe (2003). Methods of assessing human health vulnerability and public health adaptation to climate change. Copenhagen, WHO Regional Office for Europe (http://www.euro.who.int/__data/assets/pdf_file/0009/91098/E81923.pdf).
WHO Regional Office for Europe (2008). Heat–health action plans: guidance. Copenhagen, WHO Regional Office for Europe (http://www.euro.who.int/en/what-we-do/health-topics/environment-and-health/Climate-change/publications/pre-2009/heathealth-action-plans).
WHO Regional Office for Europe (2010). Protecting health in an environment challenged by climate change. Copenhagen, World Health Organization Regional Office for Europe (http://www.euro.who.int/en/what-we-do/health-topics/environment-and-health/Climate-change/publications/2010/protecting-health-in-an-environment-challenged-by-climate-change-european-regional-framework-for-action; accessed 14 March 2013).
WHO Regional Office for Europe (2011). Public health advice on preventing health effects of heat. Copenhagen, WHO Regional Office for Europe (http://www.euro.who.int/en/what-we-do/health-topics/environment-and-health/Climate-change/publications/2011/public-health-advice-on-preventing-health-effects-of-heat.-new-and-updated-information-for-different-audiences).
WHO Regional Office for Europe (2012). Health effects of black carbon. Copenhagen, WHO Regional Office for Europe (http://www.euro.who.int/en/what-we-do/health-topics/environment-and-health/Climate-change/publications/2012/health-effects-of-black-carbon).
WHO Regional Office for Europe, United Nations Economic Commission for Europe (2011). Guidance on water supply and sanitation in extreme weather events. Copenhagen, WHO Regional Office for Europe.
WHO Regional Office for South-East Asia (2010). Regional strategy for protecting health from climate change. New Delhi, WHO Regional Office for South-East Asia (http://www.searo.who.int/entity/climate_change/documents/sea_ehc_575/en/index.html; accessed 14 March 2013).
WHO Regional Office for the Western Pacific (2012). Strengthencontrolofvector-bornediseasestolessentheimpactofclimatechangeintheWesternPacificRegionwithfocusonCambodia,MongoliaandPapuaNewGuinea. Manila, WHO Regional Office for the Western Pacific.
WHO Regional Office for Europe, United Nations Economic Commission for Europe (2011). Guidance on water supply and sanitation in extreme weather events. Copenhagen, WHO Regional Office for Europe (http://www.euro.who.int/en/what-we-do/health-topics/environment-and-health/Climate-change/publications/2011/guidance-on-water-supply-and-sanitation-in-extreme-weather-events).

45
Annex 2. Useful data sources
Mortality and burden of disease
• Mortality statistics, country data and WHO estimates (http://www.who.int/healthinfo/statistics/mortality/en/index.html and http://www.who.int/gho/countries/en/index.html).
• Over 50 datasets on health priorities, including mortality and burden of disease, the Millennium Development Goals, noncommunicable diseases and risk factors, epidemic-prone diseases, health systems, environmental health, violence and injuries and equity (http://apps.who.int/gho/data/view.main).
• Climate change and burden of disease by region (http://apps.who.int/gho/data/node.main.132?lang=en).
• Detailed mortality database for Europe (International Classification of Diseases, revisions 9 and 10 and mortality tabulation list of the revision 10) (http://data.euro.who.int/dmdb/.
• European Surveillance System database on infectious diseases (only for experts nominated by European Union member states; subsets available for researchers after due process) (http://ecdc.europa.eu/en/activities/surveillance/tessy/pages/tessy.aspx).
• World development indicators: economic indicators and country indicators in several fields (http://data.worldbank.org/data-catalog/world-development-indicators).
Environment
• European environmental indicators, including several types of health-relevant climatic impacts (http://www.eea.europa.eu/data-and-maps).
• United Nations Environment Programme (http://www.unep.org).
Current and past meteorological data
• World climate applications and services programme (http://www.wmo.int/pages/prog/wcp/wcasp/wcasp_home_en.html).
• Humanitarian early warning service (http://www.hewsweb.org).
• Climate prediction centre (http://www.cpc.ncep.noaa.gov).
• National climate services (http://www.climate.gov).
• International Research Institute for Climate and Society, Earth Institute Lamont-Doherty Earth Observatory climate data library (http://iridl.ldeo.columbia.edu/).
• International Research Institute for Climate and Health resource room (http://iridl.ldeo.columbia.edu/maproom/.Health/).
Climate change scenarios
• Inventory of United Nations climate change learning and training materials (http://www2.unitar.org/oneun/in ventory/database/inventory_search_rv1.aspx).

C
M
Y
CM
MY
CY
CMY
K
WHO_Cover_Climate_change_health_DruckIII.pdf 1 19.07.2013 09:53:26


