1 Who Did Safety Nets Catch During the Great Recession and How? A Comparison of Eleven OECD Countries Katherine Baird Associate Professor of Economics University of Washington Tacoma Abstract How adequately did governments protect their citizens over the Great Recession? The recent recession, the worst since the Great Depression, provides an opportune moment to investigate the adequacy and fairness of countries’ responses to an economic crisis. Using household-level LIS data from eleven OECD nations, I calculate the recession’s impact among the non-elderly population on earned income across the income distribution, and investigate the degree to which additional government transfers compensated for these losses. While the recession’s impact on earned income varied significantly both across and within countries, in most countries additional government transfers to citizens offset the steep declines in household incomes that occurred along the income distribution, and reversed increases in inequality. A notable shortcoming across many countries was that the protection provided to income shocks was not progressively distributed; in a number of countries, the lowest income citizens experienced the sharpest drops in disposable income. Investigating patterns of responses across the different countries fails to verify “path dependency” claims about how welfare state regimes differ, and how their responses to income shocks might vary; instead I find support for predictions of a convergence in welfare state policy. Key Words Great Recession, Income Redistribution, Inequality, Comparative Social Policy, Luxembourg Income Study
Transcript
1
Who Did Safety Nets Catch During the Great
Recession and How? A Comparison of Eleven OECD
Countries
Katherine Baird
Associate Professor of Economics
University of Washington Tacoma
Abstract
How adequately did governments protect their citizens over the Great Recession? The recent
recession, the worst since the Great Depression, provides an opportune moment to investigate the
adequacy and fairness of countries’ responses to an economic crisis. Using household-level LIS
data from eleven OECD nations, I calculate the recession’s impact among the non-elderly
population on earned income across the income distribution, and investigate the degree to which
additional government transfers compensated for these losses. While the recession’s impact on
earned income varied significantly both across and within countries, in most countries additional
government transfers to citizens offset the steep declines in household incomes that occurred
along the income distribution, and reversed increases in inequality. A notable shortcoming
across many countries was that the protection provided to income shocks was not progressively
distributed; in a number of countries, the lowest income citizens experienced the sharpest drops
in disposable income. Investigating patterns of responses across the different countries fails to
verify “path dependency” claims about how welfare state regimes differ, and how their responses
to income shocks might vary; instead I find support for predictions of a convergence in welfare
state policy.
Key Words Great Recession, Income Redistribution, Inequality, Comparative Social Policy, Luxembourg
Income Study
2
One legacy of the devastation wrought by last century’s Great Depression is the sizable
resources countries now devote to social policies. In one form or another, these protect citizens
from various personal risks, chief among them income shocks. While the recent Great Recession
of 2008, the worst since the Great Depression, challenged nations’ capacity to respond, emerging
evidence suggests that for the most part, government policy successfully cushioned households
from the steep declines in income (Jenkins et al 2013; OECD 2011d). We know less, though,
about how countries compared in the protection they provided. Given wide differences in
countries’ social policies and in the additional measures they enacted over the Great Recession,
we would expect to see significant variation among countries in how effective and fair their
safety nets proved to be. While income shocks are not the only risk we should care about, it is a
central purpose of social policy, and the protection provided the poor during such times should
be a key criterion by which to assess countries’ social protection policies.
This paper compares nations’ safety net by investigating who they caught and how well
they were supported over the recession by examining household-level data from eleven European
and North American countries. Using Luxembourg Income Study (LIS) data, I investigate the
recession’s effect on earned income across the income distribution, and examine how effectively
governments’ used tax and social policy to insure citizens from income shocks. The eleven
OECD countries in this study include ones representing a range of welfare-regimes types as well
as enduring differing degrees of economic distress over the recession. The study thus includes a
wide variety of country-specific contexts.
3
Background
Intense interest surrounds how governments’ role in social protection will be shaped by
the twenty-first century’s evolving political and economic challenges. Many contend that
internal and external pressure on nations are causing a “welfare retrenchment” (Streeck 2011), as
might, too, be the growing presence of immigrants within many European nations (Eger 2010).
Moreover, past trends are worrisome. Before the financial crisis, many scholars found that
governments had scaled back on features of their safety net, especially those protecting low
income citizens, for instance by reducing unemployment insurance and minimum income
benefits (Immervoll and Pearson 2009; Marchal, Marx, and van Mechelen 2011; Nelson 2010;
OECD 2011b). Some have warned that such trends may not bode well for the poor (Kenworthy
2011). Most troubling is that such reversals were occurring while inequality in most OECD
countries rose; and in the decade leading up to the financial crisis, countries’ redistributive
efforts had waned (Immervoll and Richardson 2011; OECD 2011b; Bertola 2010).
Given this backdrop, it perhaps is surprising that evidence indicates nations significantly
increased their income support expenditures over the recession (Jenkins 2013; OECD 2011d). A
good deal of this additional effort reflects the “automatic stabilizers” built into existing policies,
as when those losing jobs collect unemployment checks and owe less in income taxes. But most
OECD countries also undertook additional measures, for example by increasing unemployment,
public assistance and family benefits, and cutting taxes (OECD 2014; OECD 2011c; OECD
2011d; Bonnet, Sage and Weber 2012). Such measures ensured that large decreases in income at
the national level did not translate into similar losses at the household level (Jenkins 2013).
According to the OECD (2011d), social spending grew by almost two percentage points in
member nations over the recession, with variation in growth corresponded with the degree of
4
economic distress each experienced. Not only did countries spend more, but they also did so in
ways that largely reversed the increases in earnings inequality that was a feature of the recession
(OECD 2014).
Yet to date we know much less about exactly how much income protection citizens were
provided, who received it, and how countries compare on this score. Given the increasing
pressure on safety nets, it is essential to understand how the poor in particular fare, and to
identify the policy mix that most effectively reaches them. The Great Recession presents an
important opportunity to investigate countries’ responses to the crisis. How much protection did
they provide, how did they provide it, and how fairly was it distributed?
A prior, we should expect to see considerable variation in the size and distributional
nature of nations’ efforts. Not only does each differ in the personal risks they cover and the
generosity of that coverage, so too do they vary in the extent to which they redistribute income
(Wang et al 2012; OECD 2011a; OECD 2011d). Reasonably, then, the expansion in social
insurance policies such as those around disability, unemployment, retirement, and the broadening
of second tier public assistance programs should have had different distributional impacts across
countries. Moreover, countries were far from similar in the additional measures they enacted in
response to the recession (ILO and World Bank 2012; OECD 2011d; Chung and Thewissen
2011), which further should suggest variation in their outcomes.
The comparative social policy literature suggests two different theories for how we might
anticipate countries’ social policies to have responded to the Great Recession, both nicely
summarized by Chung and Thewissen (2011). One is path dependence theory--put simply, the
past is a good predictor of the future. There are a number of reasons to expect that existing
practices and the outcomes they generate might influence countries response to a sharp recession.
5
Nations have particular sets of institutions and policies which already reflect their different
politics, interest groups, and ideological beliefs; all of these also help to set citizens’ expectations
of how their government should respond. To use Francis Castles evocative phrase (which he
borrows from Karl Hinrichs), welfare regimes are like “elephants on the move,” and not easily
diverted, turned or reversed (2010, 91). Central to this perspective, too, is that different welfare
regimes have their own political tendencies, a position articulated by the sociologist Gøsta
Esping-Andersen in 1990, with alterations to or elaborations made since (see Arts and Gelissen
2002; Ferragina and Seeleib-Kaiser 2011). While much of this welfare-regime literature
analyzes each category’s longer-term trajectory (Castles 2010), one might reasonably expect that
their institutional and political tendencies will also influence their response to an economic crisis.
The general consensus in this literature is that welfare regimes cluster around four
different “types.” The “Liberal” model, with Canada, the US, Ireland, Australia, the UK, and
sometimes Japan and Switzerland as members, typically provide minimum benefits based
primarily on social assistance policies, and reflect a belief that social policies should foremost
address poverty. The Corporatist (or Conservative) model includes countries such as Austria,
Germany and Luxembourg, and relies heavily on social insurance policies with earnings-based
benefits for occupationally-segmented groups. A third Social Democratic model usually
provides the most generous benefits, many of which are from universal policies made available
to all citizens, and these frequently make up a significant share of citizens’ income. Finland,
Norway, Sweden, and Denmark are typically grouped in this category. Scholars have recently
placed Spain, Italy, Portugal and Greece into a fourth “Southern European” category. While
similar to the Corporatist model, social insurance policies are closely tied with employment
6
status and occupation, with a larger expected family role; for these two reasons, these countries
tend to have safety nets that are both weak and porous (Moreno 2006; Matsaganis et al. 2003).
Korpi and Palme’s (1998) contention that Liberal regimes, with their extensive reliance
on social assistance policies, result in weak support for the welfare state compared with the more
generous and widely-distributed benefits provided by Corporatist and Social Democratic
regimes, has been a widely accepted one (although also increasingly contested, see Marx et al.
2013). Korpi and Palme famously coined the term “The Paradox of Redistribution:” Liberal
regimes that target the poor through social assistance policies accomplish less for them than do
regimes that target a broader income spectrum through social insurance and universal benefits.
A singular focus on redistribution, in other words, fails in its objective: “The more we target
benefits to the poor ….the less likely we are to reduce poverty and inequality” (661). Indeed,
one concern voiced during the recession was the potentially limited ability of countries with low
levels of unemployment insurance and meager social assistance policies--such as in the US and
Greece--to respond effectively given the large increases in working-age individuals with neither
income nor unemployment benefits (OECD 2011d, Figure 1.20).
As support for this path dependency perspective, Chung and Thewissen (2011) conclude
that in the UK, Germany and Sweden, their distinct political and institutional legacies explain
differences among them in the added measures they enacted over the recession, and that “the
degree of policy innovation was limited” (p. 367). Their study, however, only compares certain
measures each nation took, and does not compare their magnitude or distributional impact. On
the other hand, Jenkins et al. (2013) undertook a quantitative analysis of how countries
responded to the crisis; they conjecture that countries with strong social safety nets are probably
7
the ones that responded most vigorously over the recession, a conclusion that if true, would fit
with path dependency predictions.
A contrasting theory of how we might expect countries to have responded to the
recession is “convergence theory,” which contends that since countries’ social policies are
becoming more similar over time, and we might expect them to respond in similar fashions
(Chung and Thewissen 2011). We see evidence of convergence, for instance, in a broad
movement across countries toward greater use of labor activation policies, family-based policies,
encouragement of mothers in the workforce, and growth in social spending within low spending
countries and cutbacks in those with larger budgets (Chung and Thewissen 2011; Starke,
Obinger and Castles 2008; Daly 2010). We also see it in the growth of countries prioritizing
those within the labor force, as opposed to those out of it (Marchal, Marx and Van Mechelen
2014; Marx et al 2013; Immervoll and Pearson 2009). Such trends coupled with the fact that the
recession presented countries with similar challenges and common constraints could lead to
predictions of similarity in their responses.
Data Description
How well did countries cushion the blow of lost income over the Great Recession, and
how do their responses compare? To investigate this I use micro-level data from the
Luxembourg Income Study’s (LIS) most recent waves of data: the 2007 wave represents a
baseline before the crisis, and the 2010 wave with information obtained during the recession’s
wake. Each year and country dataset in LIS includes detailed income data, typically from tens of
thousands of households. Among members of the Organization for Economic Cooperation and
Development (OECD) that provide LIS with data, I selected all except for Estonia, Israel and
8
Poland that contained complete pre- and post-government income data. The eleven resulting
countries represent the four different welfare regimes. Within the Liberal paradigm are Canada,
the UK, the US, and Ireland; the Corporate regime features Germany, Luxembourg and the
Netherlands; and Finland and Denmark represent the Social Democratic tradition, while Spain
and Greece the Southern European model.
To separate out the effect of public pensions from other forms of social transfers, I limit
this study to the non-elderly population, defined as those below the age of sixty. Social transfers
to the elderly are fairly immune to economic downturns (Jenkins et al. 2013), and are also
especially redistributive (Wang, Caminada, and Goudswaard 2012). While a comparative
analysis of the effect of the recession on the elderly population is also important, this is best done
separately so as not to conflate or hide tendencies among the two sub-populations.
To arrive at market income, I adjust household income data for household size by
calculating an “equivalized income” for each person in the household based on LIS’s
recommended formula (see Appendix for detail). I divide everyone in a country and year into
quintiles based on their (equivalized) market income to separate out individuals along the income
distribution within countries. Market income (which I also refer to in this paper as “earnings”) is
defined as all income from capital and labor, plus any income from private pensions (see the
Appendix for more detail). All figures are adjusted for inflation based on the OECD’s consumer
price index, and are expressed in 2010 dollars. “Income” in this paper always refers to
equivalized income, whether disposable or market, and all data presented here are based on the
weighted observations of each county’s fifty-nine and under population.
To quantify the effect of government policy on income, I define a second variable
“government transfers.” This variable captures the combined contribution to individuals’ income
9
of both taxes paid and social benefits received; the latter includes the value of both cash and
near-cash (such as housing and food vouchers) benefits. As with income, I report the value of
“government transfers” in its equivalized form. Typically, government transfers will be high for
low income households because they receive larger social benefits while also paying less in
taxes. We similarly would expect government transfers to decline with income, and at some
income range turning negative when a household pays more in taxes than it receives in
government benefits. A final key variable, disposable income or “post-government” income,
accounts for the effect of government redistribution on income, and is calculated as market
income plus the value of government transfers.
Changes in Market Income and Government Transfers over the Great Recession
National-Level Indicators
The macroeconomic impact of the Great Recession varied widely among OECD
countries. While the reason for this variation is not the focus of this paper,1 the eleven countries
in this study represent the range, as shown in table 1 column 1. Between 2007 and 2010, average
market income remained essentially unchanged in Germany, fell by 5.9 percent in the United
Kingdom, and dropped a sharp 15.3 percent in Ireland.
While average market income fell in eight of the eleven countries, government transfers
to individuals also increased in eight of them, as shown in column 2 of table 1. For instance, in
the UK, the equivalized value of government transfers increased an average of about £600 (not
shown), which column 2 displays as equal to 2.6 percent of average national income in 2007. As
shown, and consistent with other studies (OECD 2011d, p. 47), countries experiencing greater
1In this paper I treat income changes as exogenous, and thus ignore any potential endogeneity between it and income
inequality or social policies.
10
economic distress tended to respond with larger increases in government transfers. Column 3,
which shows the combined effect of changes in earned income and government transfers,
demonstrates that in every country but the Netherlands and Ireland, average disposal income
declined by less than did market income.
Table 1. Change in Average Income and Government
Transfers, 2007 to 2010
Market
Government Disposable
Income Transfers Income
Liberal
US -7.8% 3.2% -5.5%
UK -5.9% 2.6% -3.8%
Canada 2.7% 1.1% 4.5%
Ireland -15.5% -0.7% -16.6%
Corporatist
Germany 0.2% 0.4% 0.7%
Luxembourg -5.9% 3.2% -3.0%
Netherlands -3.0% -0.4% -4.7%
Social Democracy
Denmark -2.2% 4.0% 2.5%
Finland 2.0% -0.2% 2.1%
S. European
Spain -14.6% 5.0% -10.4%
Greece -18.3% 9.6% -10.7%
Source: Author calculation based on the non-elderly population
and equivalized values. All percentages expressed as a share of
their 2007 value, except changes in government transfers is
expressed as a share of average 2007 market income.
How were average decreases in market income and average increases in government
transfers distributed along the income distribution? Some indication of this can be gleaned from
Gini coefficients, the most common indicator of income inequality. A Gini coefficient of one
11
designates complete income inequality (one person has all the income), whereas a value of zero
represents complete income equality (everyone has identical income). In practice Gini
coefficients fall somewhere between these two extremes, with higher numbers signifying greater
inequality.
Table 2. Change in Inequality and Countries’ Redistributive Effort, 2007-2010
Market Gini Redistrib. Effort Change
2007 2010 Change 2007 2010 Change Disp Gini
Liberal
US 0.45 0.48 0.03 0.07 0.09 0.023 0.003
UK 0.46 0.48 0.02 0.09 0.11 0.014 0.006
Canada 0.41 0.42 0.00 0.09 0.10 0.006 -0.005
Ireland 0.46 0.53 0.06 0.17 0.23 0.064 0
Corporatist
Germany 0.27 0.26 -0.01 0.08 0.08 -0.002 -0.011
Luxembourg 0.38 0.40 0.02 0.10 0.12 0.021 -0.006
Netherlands 0.38 0.36 -0.02 0.09 0.1 0.006 -0.022
Social Democracy
Denmark 0.35 0.38 0.03 0.12 0.13 0.014 0.014
Finland 0.38 0.39 0.00 0.14 0.14 -0.001 0.005
S. European
Spain 0.37 0.41 0.05 0.06 0.08 0.014 0.032
Greece 0.40 0.41 0.01 0.08 0.08 0 0.005
Source: Author calculation based on the non-elderly population and equivalized values. See text for definitions.
May not add due to rounding.
Table 2 displays the market-income Gini coefficients in 2007 (column 1) and 2010
(column 2). The difference in the two Gini coefficients (column 3) captures growth in inequality
between 2007 and 2010. With the exception of the Netherlands and Germany, market income
inequality grew in each country. Generally, the growth in inequality corresponded with the
recession’s depth, as there is a .66 correlation between declines in market income and increases
12
in inequality between 2007 and 2010. This relationship underscores the recession’s
disproportionate impact on lower-income households.
Since government transfers grew more in countries that suffered harsher downturns, did
these offset the rise in higher earnings inequality that occurred? Table 2 column 4 presents
country’s “redistributive effort” defined as the reduction in the Gini coefficient from government
transfers—in other words, the difference between the market income Gini and the disposable
income Gini. In 2007, the average redistributive effort in all countries was .10 and was largest in
Ireland (.17). Countries’ 2010 redistributive effort is shown in table 2 column 5, and column 6
presents the difference between countries’ redistributive effort in 2010 and 2007. As shown in
this column, on the whole government transfers in 2010 did more to redistribute income than
they did in 2007, with only Germany and Finland showing a decreased redistributive effort.
The net effect of greater market inequality and greater redistributive effort is summarized
in table 2 column 7 by changes in the disposable income Gini between 2007 and 2010. As
shown, government transfers nearly reversed the growth in market income inequality: In four
nations, inequality in disposable income was lower in 2010 than it was in 2007, and among those
countries where it grew, it did so by more than .01 points only in Denmark (.014) and Spain
(.032).
The evidence in this sample of countries, then, confirms that during the recession income
inequality grew in concert with income losses, but larger increases in government transfers
succeeded in at least partly, and often completely, reversing the recession’s disproportional
impact on lower income individuals.
How do we explain variation in countries’ redistributive efforts? Was this reflective of
their past welfare state legacies, and/or the extent of their prior degree of income redistribution?
13
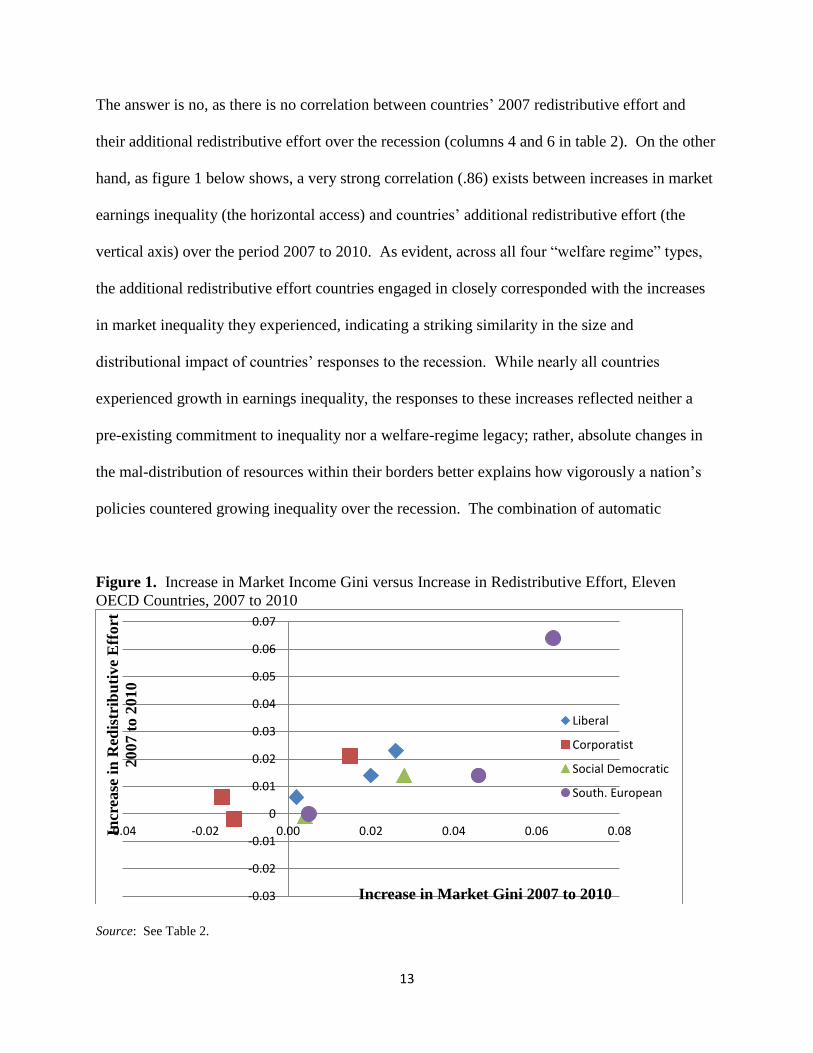
The answer is no, as there is no correlation between countries’ 2007 redistributive effort and
their additional redistributive effort over the recession (columns 4 and 6 in table 2). On the other
hand, as figure 1 below shows, a very strong correlation (.86) exists between increases in market
earnings inequality (the horizontal access) and countries’ additional redistributive effort (the
vertical axis) over the period 2007 to 2010. As evident, across all four “welfare regime” types,
the additional redistributive effort countries engaged in closely corresponded with the increases
in market inequality they experienced, indicating a striking similarity in the size and
distributional impact of countries’ responses to the recession. While nearly all countries
experienced growth in earnings inequality, the responses to these increases reflected neither a
pre-existing commitment to inequality nor a welfare-regime legacy; rather, absolute changes in
the mal-distribution of resources within their borders better explains how vigorously a nation’s
policies countered growing inequality over the recession. The combination of automatic
Figure 1. Increase in Market Income Gini versus Increase in Redistributive Effort, Eleven
OECD Countries, 2007 to 2010
Source: See Table 2.
-0.03
-0.02
-0.01
0
0.01
0.02
0.03
0.04
0.05
0.06
0.07
-0.04 -0.02 0.00 0.02 0.04 0.06 0.08Incr
ease
in
Red
istr
ibu
tive
Eff
ort
2007 t
o 2
010
Increase in Market Gini 2007 to 2010
Liberal
Corporatist
Social Democratic
South. European
14
stabilizer policies coupled with additional policy measures during the recession produced similar
redistributive effects across the eleven countries. While Chung and Thewissen (2011) might
have been right that countries’ response to the recession were shaped by their past practices—I’ll
soon present evidence to support this—so far the evidence in this paper suggests a good deal of
convergence in outcomes.
Indicators by Quintile Analysis
Government transfers in the eleven countries significantly reduced the impact of the
recession on individuals’ income, reversed increases in income inequality, and different
countries with different sets of welfare policies responded with similar results. To investigate
the effectiveness of social policy over the recession more closely, I turn now to examine the
effect of countries’ policies for those at different points in the income distribution.
Table 3 presents average changes in earned income between 2007 and 2010, first overall
(column 1), and then by income quintiles (columns 2-6). In Spain, for instance, average market
income fell by 14.6 percent, but for those in the bottom quintile it dropped by an average of 63
percent (column 2). As shown, average income losses shrink as one climbs the income ladder.
Without exception in the eleven countries, losses were heaviest among the poor, and most
countries show a pattern of losses similar to Spain’s.
How well did government transfers target households with larger income losses? Table 4
presents changes in disposable income by quintile. In six of the eleven countries, government
transfers buffered the recession’s impact on all income groups. In every country, though, the
bottom quintile experienced the largest relative increases in disposable income compared with
market income. As an extreme example, the poorest quintile in Ireland saw their average earned
15
Source: Author calculation based on the non-elderly population and equivalized values. All percentages
expressed as a share of their 2007 value.
income decline by an enormous 93 percent (table 3), while disposal income among this group
fell by an average of only 15 percent (table 4).
Two distinct features of government policy explain how well citizens were protected
from income losses over the recession. One is the size of government transfers in 2007. If these
were positive, as they typically are for the poor, this income source buffers individuals from
declines in market income; if they are negative, as is generally the case for richer households, the
opposite holds true as decreases in market income (holding government transfers constant) result
in larger declines in disposable income. A second feature of government policy is what I term
“insurance:” the amount of additional government transfers above and beyond the amount
received in 2007, as a share of income lost over this same period. Some of this insurance reflects
automatic policy responses (those who lose their jobs become eligible for unemployment
Table 3. Percent Change in Average Market Income By Quintile, 2007-2010
First Second Third Fourth Fifth
All Quintile Quintile Quintile Quintile Quintile
Liberal
US -7.8% -33.9% -16.5% -10.1% -5.8% -4.7%
UK -5.9% -31.2% -14.4% -7.9% -6.5% -2.6%
Canada 2.7% -8.5% -0.9% 1.7% 1.3% 0.0%
Ireland -15.6% -93.3% -45.0% -22.5% -9.0% -8.0%
Corporatist
Germany 0.2% -9.8% -1.7% 0.3% 1.4% 0.4%
Luxembourg -5.9% -20.4% -10.6% -6.5% -2.9% -4.5%
Netherlands -3.0% -4.5% -0.8% 0.1% 0.9% -6.9%
Social Democratic
Denmark -2.2% -28.3% -7.9% -3.2% -0.9% 2.0%
Finland 2.0% -9.1% 0.9% 3.5% 3.5% 1.7%
Southern European
Spain -14.6% -63.0% -26.1% -15.6% -10.7% -8.1%
Greece -18.3% -44.3% -19.4% -19.0% -17.1% -16.0%
16
Source: Author calculation based on the non-elderly population and equivalized values.
All percentages expressed as a share of their 2007 value.
benefits), and some originates from the additional policy measures countries enacted over the
recession.
Particularly for the poor, it is important to separate out these two features of
governments’ safety net, as it is the initial size and the growth in government transfers that
together explain how well they weathered the recession. To my knowledge, this decomposition
has not been done.2 Some comparison of how countries might respond to a recession can be
inferred by comparing their income-stabilization policies, a task Dolls et al. (2012) undertook.
Before the recession, they calculated that insurance levels within countries varied significantly,
2 A recent OECD report does calculate the average percentage of income lost in the US between 2007 and 2009 by
quintile that was offset by reduced taxes and increased benefits (“insurance”) (OECD 2011d, 61. But it does not
compare this across countries nor provide information on baseline amounts).
Table 4. Percent Change in Average Disposal Income by Quintile,
2007 -2010
First Second Third Fourth Fifth
Quintile Quintile Quintile Quintile Quintile
Liberal
US -11.2% -7.0% -5.4% -2.9% -5.8%
UK -3.2% -6.3% -5.3% -4.6% -2.1%
Canada 4.7% 2.7% 4.2% 3.1% 1.6%
Ireland -15.0% -17.7% -15.9% -14.9% -17.1%
Corporatist
Germany -1.3% 0.1% 1.1% 2.0% 0.4%
Luxembourg 3.1% -7.1% -2.8% 0.5% -5.3%
Netherlands -0.3% -2.4% -2.3% -1.6% -9.7%
Soc Democracy
Denmark -2.0% -1.4% 1.0% 2.9% 6.1%
Finland -1.9% 0.1% 2.7% 3.5% 3.2%
S. European
Spain -24.1% -16.8% -11.6% -8.0% -5.9%
Greece -12.6% -13.3% -10.9% -9.8% -9.9%
17
and most fell within the 30-40 percent range. They do not, however, disaggregate their analysis
to examine differences in insurance rates along the income distribution. In a study of the
distributional effect of the recession and governments’ response to it among 21 OECD countries,
Jenkins et al. (2013, 23) tentatively conclude: “The degree of distributional stabilization [that
countries provided over the recession] may be associated with already having a relatively strong
welfare state in general and social safety net in particular.” They predict, in other words, that
nations with stronger welfare states provided their citizens with stronger insurance for income
losses.
Was indeed the amount of insurance countries provided over the recession positively
correlated with the prior size of countries’ safety nets? Borrowing Nelson’s (2008, 113)
descriptive terminology, did welfare laggards continue to lag over the recession by providing low
levels of insurance, while frontrunners’ generosity continued to outpace the others? Comparing
similar quintile groups across countries reveals that citizens with larger government transfers in
2007 (the horizontal axis of figure 2) in fact received less insurance over the recession (the
vertical axis); this general finding holds up across all five quintiles, although with correlations
between -.5 and -.85, the pattern is especially robust for those in the middle three.3
Here again the evidence fails to support contentions that the magnitude of countries’
responses to the recession were influenced by the prior size of their social policies. Instead, I
find that where government transfers were larger, nations tended to provide less additional
support. This is consistent with Dolls et al.’s (2012) finding that countries with less generous
social policies generally spent more on fiscal stimulus measures over the recession.
3 The relationship is slightly more robust at the tails of the distribution if the value of government transfers is
defined relative to quintile income rather than to average national income.
18
Figure 2. Average Government Transfers in 2007 and Average Income Insurance 2010,
by Country and Quintile
Source: Author calculation based on non-elderly population and equivalized income, for quintiles with
average income losses. See Table 5 for bottom quintile figures. Government Transfers is average amount
within each quintile as a share of average national income. Income Insurance is average increase in
government transfers from 2007 to 2010 divided by average income losses over that period, by quintile and
country.
Unfortunately, LIS data does not distinguish between government transfers originating from
automatic stabilizers versus additional measures, but decomposing countries responses into these
two components would shed additional light on the effectiveness of their different responses.
Greater detail on the size and type of social policies nations relied on in 2007, as well as
similar information on their response to the recession, is presented in table 5. Here I focus
specifically on the bottom quintile in each country. The first column presents the average value
of government transfers to this quintile as a share of national income. As shown, they were
highest in Ireland (37 percent of average national income), and lowest in the US (10 percent of
national income). The fourth column presents the insurance rate provided this group, meaning
the value of additional government transfers expressed as a share of average quintile income
-75%
-25%
25%
75%
125%
175%
225%
-0.900 -0.700 -0.500 -0.300 -0.100 0.100 0.300
Inco
me
Insu
ran
ce 2010
Government Transfers 2007
First Quintile
Fifth Quintile
Fourth Third Second
Quintile Quintile Quintile
19
losses between 2007 and 2010. While in 2007 Ireland furnished its low income citizens with the
largest government transfers, it also provided them with the least income insurance over the 2007
-2010 period (7 percent). Compare this with Greece, where government transfers to the bottom
quintile in 2007 equaled a low 15 percent of national income, while 49 percent of income losses
over the recession were replaced by additional government transfers. The general pattern of an
inverse relationship between transfers in 2007 and insurance rates over the recession bring to
mind Castle’s (2010) conjecture that minimalist welfare states will change the most during an
economic crisis, speculating that “Here, I think, are the origins of …add-on schemes” (p. 99)--by
which he means that during such times, the shortcomings of weak welfare states are revealed,
and stronger responses required of them.
Table 5, which decomposes the generosity of countries’ safety net for the bottom quintile
into their pre-crisis and insurance (column 1 and 4) components, also lists the policy type that
most contributed to the lowest quintile’s income (columns 3 and 6), with the four policy options
being social assistance, social insurance, universal benefits, and taxes. As evident, no distinct
pattern emerges. Except in Denmark (universal), in 2007 the poor gained the most either from
social insurance or social assistance policies, and the size of transfers received is not associated
with one particular policy measure. What we do see in column 6 is that the additional transfers
over the crisis commonly match the measure identified in column 3, but again absent a particular
pattern in terms of magnitude. While not reported here, there is in fact a strong correlation
between the contribution each of the four policy measures made to the bottom quintile’s income
in 2007, and the extent to which each measure also propped up their income over the 2007-2010
period.
20
The evidence, then, is that the “elephants on the move” metaphor fits in terms of policy
mechanisms used over the recession, but not in terms of the size and distributional impact of
these policies. Indeed, we might conclude that while taking different paths, the elephants all
seemed to be headed in the same direction.
Four observations stand out from both the summary information in Table 5 as well as
greater detail on the policy measures countries relied on but not revealed here. With the
exception of the US, UK, Ireland and Germany, taxes considerably reduced the net size of
government transfers to the bottom quintile; and over the recession, tax increases in the
Netherlands completely reversed the increases in both social insurance and social assistance
provided those in the bottom quintile. This points to the non-progressive nature of tax policy in
many countries that also could be indicative of the poor coordination between social and tax
policies. Second, universal benefits account for a relatively small amount of transfers to the
bottom 20 percent; only in Denmark is this the largest source of social transfers. Third, the
importance of earned income to disposable income varies significantly, ranging from the
equivalent of 6 percent of average national income in the UK, to 26 percent in Luxembourg. As
a share of their disposable income, earned income among the bottom quintile ranged from a low
of around 20 percent in Ireland and the UK, to 60 percent in the US and Netherlands. Finally, as
noted above, there is no correlation between the amount of transfers provided in 2007 to the poor
(column 1) and the amount of additional support provided over the recession (column 4).
In addition to cross-national comparisons, a key concern of this paper is to investigate the
treatment of income groups within countries. Comparing responses across the income
distribution suggests that overall countries provided lower income citizens with only slightly
more insurance than they did wealthier citizens; we see this in the slight upward trend in
21
insurance rates in figure 2 from the top of the income distribution to the bottom (moving from
the left side of figure 2 to the right side), although any relationship is weak: the average
insurance provided for most quintiles across the income spectrum clusters around the 50 percent
level. Thus within countries, insurance against income losses was not as progressive as one
might hope, especially considering the much larger income losses suffered by the poor. In fact,
only two of the eleven countries (Luxembourg and Netherlands) furnished the bottom quintile
with the highest rate of insurance against income losses. Moreover, in the US, Germany,
Denmark, Spain and Finland (and nearly so in Greece), the poorest 20 percent suffered the
largest percentage losses in disposable income of all five quintiles. Only in Canada,
Luxembourg and the Netherlands did the poorest quintile fare better relative to their 2007
income than did the other four quintiles.
Table 5. Size of Safety Net to Bottom Quintile 2007 and Changes to it, 2007-2010
2007 Safety Net Changes to Safety Net 2007-2010
Average Gov Transfer Protection From Income Losses
Amount Rank Source Amount Rank Source
Ireland
Finland
.38
.27
1
2
SA
SI
.07
.47
11
8
SA
U
Germany .23 3 SA .62 5 U/SA
Luxembourg .22 4 SI 1.29 2 SI
UK .21 5 SA .51 6 SA
U
SI Denmark
Spain
.18
.17
6
7
U
SI
.86
.33
4
10
Greece .16 8 SI .49 7 SI
Canada .14 9 N/A 2.00 1 N/A
Netherlands
US
.13
.10
10
11
SI
SA
.89
.43
3
9
Taxes (neg.)
SI Source: Author calculation for non-elderly population based on equivalized income. Government transfers in 2007
calculated as the average value to bottom quintile as a share of average national income that year. “Protection from
income losses” calculated as average increase in government transfers for bottom quintile as a share of average