1 Who Gains from the Demographic Dividend? Forecasting Income by Age By Sang-Hyop Lee and Andrew Mason Changes in population age structure have led to growth in per capita income substantially higher than growth in output per worker in the US (Cutler and et al. 1990), East Asia (Bloom and Williamson 1998; Mason 2001b), Egypt (Bloom and Canning 2003), and in many other countries around the world (Kelley and Schmidt 2001; Mason and Lee 2004). This has occurred in large part because changes in age structure lead to a divergence between population growth and growth of the working age population. Unfortunately, the phenomenon is beginning to work in reverse in Japan and many European countries. Inevitably other countries will find that their working age populations are growing more slowly (or shrinking more rapidly) than their total populations. As this occurs, the demographic dividend may become a demographic burden depressing per capita income growth relative to growth in labor productivity. Relatively little is known about who benefits from the demographic dividend and who is likely to suffer if population aging turns the dividend into a burden. Yet, this is an important issue. First, changes in age structure may have important and persistent effects on generational differences in income depending on the response of public and familial transfer systems. Second, whether the demographic dividend will have lasting favorable effects may depend on whether it leads to increased human and physical capital formation. This may be more likely to occur if the young are disproportionately favored by the dividend. Third, the welfare implications of the dividend, and the lower fertility that underlies it, depend on to whom the benefits flow. If favorable demographics lead to higher per capita income among families that have reduced their childbearing, no spillovers are associated with the bonus. If, on the other hand, the dividend is shared more broadly the positive or negative spillovers associated with fertility decline will be more important. Who gains from the demographic dividend depends to a great extent on how changes in age structure influence transfers from those in their economically productive ages to those who are not. Young dependents rely almost exclusively on transfers from their parents and, to a lesser extent, public transfers to meet their material needs. In contrast, elderly dependents have more varied sources of support. In traditional societies, they may rely on familial transfers and their own continuing work effort. In modern economies, public transfer systems and lifecycle saving are more important. 1 1 For a formal and comprehensive approach to transfers and saving in a lifecycle context see (Lee 1994; Lee 2000)
Transcript
1
Who Gains from the Demographic Dividend?
Forecasting Income by Age
By
Sang-Hyop Lee and Andrew Mason Changes in population age structure have led to growth in per capita income substantially higher than growth in output per worker in the US (Cutler and et al. 1990), East Asia (Bloom and Williamson 1998; Mason 2001b), Egypt (Bloom and Canning 2003), and in many other countries around the world (Kelley and Schmidt 2001; Mason and Lee 2004). This has occurred in large part because changes in age structure lead to a divergence between population growth and growth of the working age population. Unfortunately, the phenomenon is beginning to work in reverse in Japan and many European countries. Inevitably other countries will find that their working age populations are growing more slowly (or shrinking more rapidly) than their total populations. As this occurs, the demographic dividend may become a demographic burden depressing per capita income growth relative to growth in labor productivity.
Relatively little is known about who benefits from the demographic dividend and who is likely to suffer if population aging turns the dividend into a burden. Yet, this is an important issue. First, changes in age structure may have important and persistent effects on generational differences in income depending on the response of public and familial transfer systems. Second, whether the demographic dividend will have lasting favorable effects may depend on whether it leads to increased human and physical capital formation. This may be more likely to occur if the young are disproportionately favored by the dividend. Third, the welfare implications of the dividend, and the lower fertility that underlies it, depend on to whom the benefits flow. If favorable demographics lead to higher per capita income among families that have reduced their childbearing, no spillovers are associated with the bonus. If, on the other hand, the dividend is shared more broadly the positive or negative spillovers associated with fertility decline will be more important. Who gains from the demographic dividend depends to a great extent on how changes in age structure influence transfers from those in their economically productive ages to those who are not. Young dependents rely almost exclusively on transfers from their parents and, to a lesser extent, public transfers to meet their material needs. In contrast, elderly dependents have more varied sources of support. In traditional societies, they may rely on familial transfers and their own continuing work effort. In modern economies, public transfer systems and lifecycle saving are more important.1
1 For a formal and comprehensive approach to transfers and saving in a lifecycle context see (Lee 1994; Lee 2000)
2
Figure 1, based on 1998 data for Taiwan described in more detail below, illustrates the importance of intergenerational reallocations of income across age groups that underlie the analysis presented here. The age profile of mean earnings for Taiwan is typical of many countries with earnings concentrated in the working ages of 20-65. Per capita income varies much less across age than earnings because the young receive transfers and because the old receive transfers and have non- labor income.2
Figure 1. Average earnings and per capita household income by age (1998, Taiwan $) The importance of age structure is immediately obvious from Figure 1. The two age profiles would be impossible if there were equal numbers in each age group – the profile of per capita income could not possibly be so high unless non- labor income was much higher than it is in Taiwan. But in 1998, Taiwan had a very favorable age distribution. About 31% were under age 20 and 10% were over age 65 while 59% were in the working ages 20-65. Thus a very high income profile was consistent with the prevailing earnings profile. Given the age earnings profile, the effect of population aging in Taiwan is also clear – either non- labor income must increase substantially or per capita income must decline.
What is entirely unclear is the ages that will experience the greatest declines. Nor can we rule out the possibility that per capita income for some age groups will actually increase at the expense of further declines in other age groups.
To address this issue we propose a model that emphasizes intergenerational transfers and de-emphasizes saving responses. We draw an important distinction between the effects of changes in population age structure and familial age structure. The reason for doing so is that public transfers are influenced by population age structure while familial transfers are influenced by the age structure of the family. In the analysis, the separate effects of population and family age structure are obtained by distinguishing what we call family cohorts.
The model is estimated using age-specific data from annual income and expenditure surveys conducted in Taiwan between 1978 and 1998. Taiwan’s experience is instructive because it experienced such rapid fertility decline and significant and favorable changes in age structure over the twenty-one year period analyzed. Like many other countries, however, Taiwan will experience rapid population aging in the coming decades with unfavorable implications for per capita income.
Subject to qualifications discussed in more detail below, the analysis leads to the following conclusions. First, changes in age structure had a favorable effect. The demographic dividend raised per capita income by about 50% between 1978 and 1998. All age groups did not share equally in the gains. Second, generational differences in income per capita changed, in part, because of changes in the intergenerational differences in earnings. If transfers were governed by effective altruism, we would not expect this to be the case. Third, generational differences in income are influenced both by population age structure and by family age structure. The per capita incomes of children and young adults are adversely affected by an increase in the population dependency ratio and by an increase in the family dependency ratio. As a result, they benefited the most from the favorable 2 Per capita household income is the mean of the per capita income of households in which persons aged a live. Household income is equally shared among all household members.
3
changes in age structure during the 1980s and 1990s. In contrast, the per capita income of the elderly does not appear to have been influenced by family age structure and was somewhat less affected by changes in population age structure. As a result, they benefited less from demographic change in the past. Fourth, demographics conditions have greatly favored some birth cohorts over others. The 1978 cohort is the most favored with an average per capita income about 20% higher than that of the 1949 birth cohort and 30% higher than projected for the 2014 birth cohort. Fifth, population aging will adversely influence growth in per capita income in the coming decades. We predict that, on average, per capita income growth will be lower in the future because of changes in age structure. This does not mean that per capita income will decline. If productivity increases continue at the pace consistent with the 1978-98 period, per capita income will increase at an annual rate of about 5.6% per year during the 1999-2030 period. Five-year-olds will experience growth of 4.5% as compared with 5.8% for sixty-five-year-olds.
I. Age-Structure, Transfers, and Per Capita Income Labor income is taken as given in the analysis and forecasts of per capita income are conditioned on growth in output per worker. Per capita income can diverge from labor income both because of transfers and non- labor factor income. In this section, however, we assume a consumption-loan economy in which all non- labor income is zero.3
Thus, the divergence of per capita labor income from earnings is modeled here as the outcome of intergenerational transfers, i.e., ( ) ( ) ( )ly a y a aτ= + (1) where ( )y a is per capita income of persons aged a, ( )ly a is labor income of persons aged a, and ( )aτ is net transfers to persons aged a. Changes in age structure affect both public and private transfers. Consider first public transfers. Public transfers are subject to a social budget constraint: public transfers must sum to zero. Designating the average net transfer for the population in the dependent age groups as ( )g Dτ and the average net transfer for the population in the non-dependent age groups as (~ )g Dτ : ~(~ ) ( )g D g DD N D Nτ τ− = (2) where DN is the population in the dependent age groups and ~DN is the population in the non-dependent age groups. Rearranging terms yields the relationship between transfers and the population dependency ratio implied by the social budget constraint:
~
(~ )( )
g D
g D
D ND N
ττ
−= (3)
An increase in the dependent population must lead to a rise in the average net public transfer paid by the non-dependent population and a corresponding decline in y(~D); or, a decline in the average net public transfer received by the dependent population and a corresponding decline in y(D); or both. The social budget constraint does not rule out the
3The empirical model estimated below does not distinguish transfers from non-labor income. Thus, to the extent that changes in age structure influence either, they are captured by the empirical model.
4
possibility that an increase in the dependency ratio will lead to an expansion of transfer programs, i.e., an increase in the average transfer payment to members of the dependent population (Razin, Sadka et al. 2002). If this happens, then the tax burden on members of the non-dependent population will be even greater by virtue of the upward shift in the dependency ratio.
Several previous studies have addressed the relationship between age structure and public transfers. Preston (1984) argues that an increase in the size and political power of the elderly population has led to a rise in transfers to the elderly accounting for a substantial improvements in their relative economic status. In contrast, Becker and Murphy (1988) argue that the rise in public pensions in the US is part of an intergenerational contract. Elderly are receiving larger public pensions as repayment for the greater investment they made in public education programs. Recent work by Bommier, Lee, and Miller (2004) calls into question the Becker and Murphy interpretation of US experience, but if Becker and Murphy are correct then an increase in old age dependency has not led to greater transfers to the elderly. Gruber and Wise (2001) provide recent empirical work that is relevant to the issue. Their ana lysis of OECD data concludes that population aging has led to a decline in average transfers to the elderly and a rise in average tax payments by the non-elderly. The costs of higher dependency are being shared by workers and retirees. To summarize, an increase in the population dependency ratio must lead to a decline in the per capita income of one or more age groups. If public transfers are governed by generational politics, an increase in the dependency may lead to an increase in the per capita income of population age group with larger numbers. If public transfers are influenced by altruism, then it is more likely that all age groups will experience declining per capita income. Even if changes in population age structure lead to important changes in the age profile of public transfer programs, the effect on per capita income may be neutralized in part or entirely by familial transfers. If prime age earners act as effective altruists with regard to their family members, redistributions from changes in public transfers will have no effect on the distribution of consumption. Public transfers induce an offsetting change in familial transfers. Thus, an increase in the population dependency ratio may lead to a decline in the per capita income of all age groups even if public transfer programs change in a way favorable to one group over another. The effect of age structure on familial transfers is by no means limited to responses to shifts in public transfers. Families and family transfers are subject to their own budget constraint. Net familial transfers, defined as transfers within the family, must also sum to zero. Thus, an increase in the dependency ratio within the family must lead to a decline in the average familial transfer received by dependents or an increase in the average familial transfer made by non-dependent family members. Likewise, the income of dependent family members or non-dependent family members must decline with a rise in the family dependency ratio.
To say more about the response of familial transfers to changes in age structure requires a behavioral model of the family. There are competing models of family transfers and extensive empirical evidence based on micro-level surveys. The theoretical models that have guided research on the determinants of transfers reflect the diverse roles of the family. Altruism and efficiency concerns are both at work in economic models of family
5
transfers (Becker and Tomes 1976; Becker and Murphy 1988). Effective altruists allocate resources across the family – investing in human capital, smoothing over the lifecycle and across uncertain states of the world – meeting both efficiency and distributional objectives. Lillard and Willis (1997) provide a succinct summary of competing models. The old age security hypothesis posits that children are the old age security plan for parents. In countries with under-developed capital markets, accumulating financial wealth is not a viable option. As capital markets improve, parents can rely more on saving and less on children (Willis 1980). The parental repayment hypothesis emphasizes constraints on borrowing to invest in human capital rather than deficiencies in capital markets. Efficient investment in human capital is achieved only if children can “borrow” from their parents. Depending on the extent of altruism, an implicit contract may exist that requires children to repay their parents (Becker and Tomes 1976). If the family insures members against risk, inter vivos transfers will arise when members face bouts of unemployment. Protection against longevity risk will lead to bequests by elderly who die at a young age and support by children for elderly who live longer than expected (Kotlikoff and Spivak 1981). An alternative or perhaps complementary approach to family transfers emphasizes the exchange motive. Transfers of money between parents and children may be implicit payments for services provided. Children may provide personal care to elderly parents with failing health. Grandparents may provide childcare services and receive “compensation” from their children (Cox 1987). As is clear from Samuelson’s (1958) seminal work, however, exchange cannot satisfy the lifecycle problems that are under consideration here.
It is empirically difficult to distinguish alternative models of transfers. Motivations underlying transfers vary from one setting to the next, and transfers often fill a multiplicity of purposes. In studies of inter-household transfers in Malaysia and Indonesia, no single model explains transfers. The evidence there points to exchange, insurance, and repayments for educational “loans” as important motives for transfers (Lillard and Willis 1997; Frankenberg, Lillard et al. 2002). Inter-generational transfer arrangements in Taiwan are consistent with a variety of interpretations but not the use of bequests to enforce old age support (Lee, Parish et al. 1994). Altonji et al. (2000) conclude that in the US money transfers respond to income difference and appear to be motivated by altruism rather than by implicit exchange. Time flows from children to parents are not accompanied by money flows from parents to children. However, the very low responsiveness of transfers to inter-generational income differences is at odds with the standard altruism model (Altonji, Hayashi et al. 1992; Altonji, Hayashi et al. 2000). The Model The paper employs a model, the overlapping families (OLF) model, which allows the analysis of intergenerational familial effects using age- or cohort-specific aggregate data. The model allows us to analyze independent effects of the family dependency ratio and population dependency ratio. The population and family dependency ratios may differ substantially at any point in time for two reasons. First, extended families are subject to age or lifecycle effects. Over the lifecycle families have periods of high dependency when relatively few family members are in the working ages and period of low dependency when relatively more family members are in the working ages (Chayanov 1966). Second,
6
the demographic transition produces important cohort effects. During periods of fe rtility decline (given child mortality) the youth dependency ratio will decline for successive cohorts.4 Thus, the family dependency structure will vary across cohorts while the population dependency structure will be the same for all cohorts at any point in time.
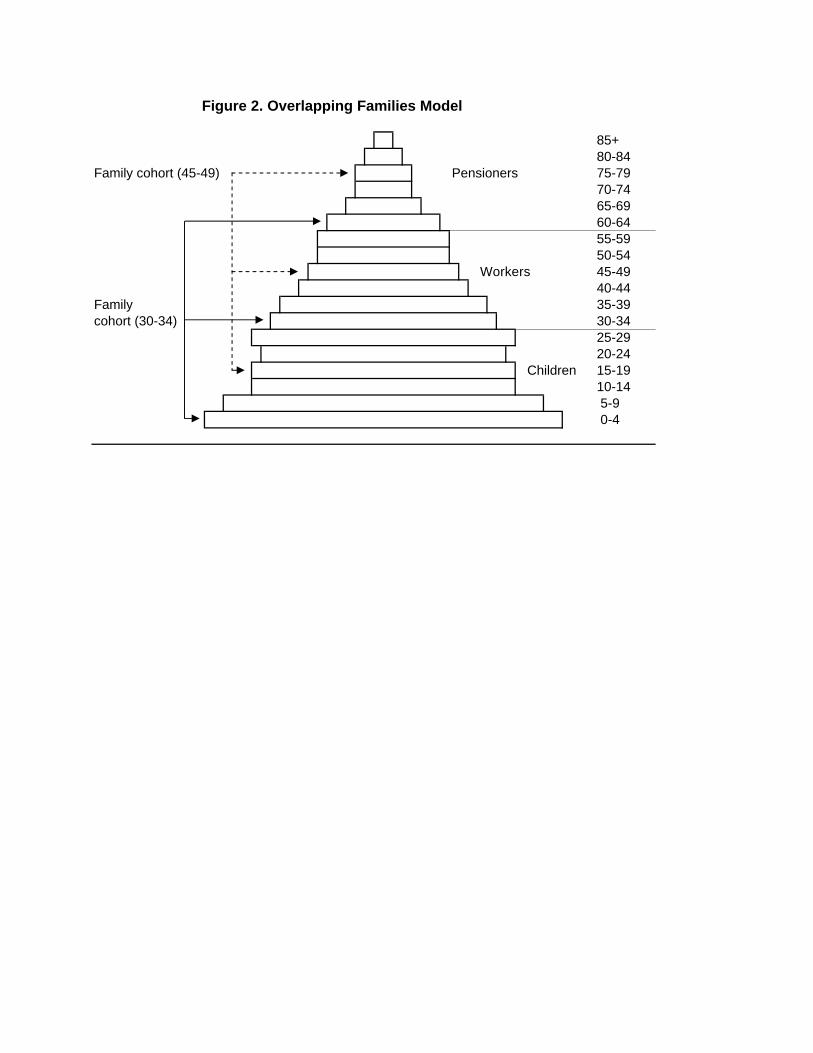
The OLF model treats families in a highly stylized manner. A family is a kin-group, who may or may not share a residence, consisting of 3 generations: workers, their children, and the workers pro rata share of their parents, called pensioners. We assume that all individuals are born to persons of age g, the generation length. Thus, families with workers aged a, have children aged a-g and pensioners aged a+g. A family cohort consists of all workers born in the same year, a, and their family members. Two family cohorts are shown in Figure 2: the family cohort that consists of workers aged 30-34, pensioners aged 60-64, and children aged 0-4 and the family cohort consisting of workers aged 45-49, pensioners 75-79, and children 15-19. Although the model is represented using five-year age groups, any age grouping can be used in principle.
Figure 2. Overlapping Families Model
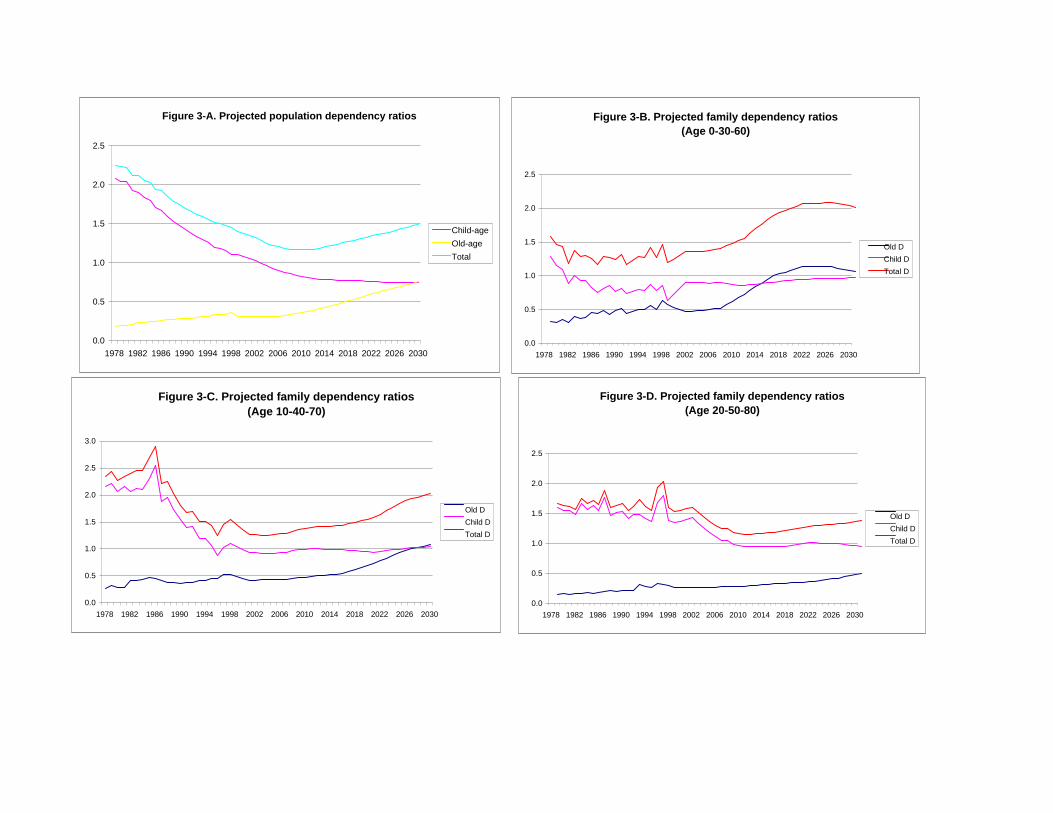
The distinction between the population dependency ratio and the family dependency ratio is readily illustrated using the OLF model. In Figure 3 we show the population dependency ratios and the family dependency ratios for three family cohorts based on a generation length of 30 years. The 0-30-60 cohort consists of families consisting of newborns, thirty-year-olds, and sixty-year-olds in each year. The 10-40-70 and 20-50-80 cohorts are similarly defined. Thus, the family dependency ratios are dependency ratios within each family cohort. There are striking differences between the population dependency ratios and the family dependency ratios. In particular, the child population dependency ratio declined rapidly and smoothly during the historical period. The family child dependency ratio for the 10-40-70 families increased between 1978 and 1986 and then declined very rapidly. The decline in the family child dependency ratios for the 0-30-60 and 20-50-80 families were much more gradual. Figure 3. Projected population and family dependency ratios
We normalize on the number of workers per family, so that the number of workers per family is equal to 1. For families with workers aged a, children per family is equal to n(a-g,t) and pensioners per family is equal to n(a+g,t). The variable n(a-g,t) is the ratio of the population aged a-g to the population aged a (the family child dependency ratio) and n(a+g,t) is defined as the ratio of the population aged a+g to the population aged a (the family old-age dependency ratio).
Consider a simple consumption-transfer model. In each period consumption by the family is constrained by the labor earnings of the family’s members and net public transfers. There is no saving. Thus, per capita income and consumption are equivalent. As an accounting convenience, public transfers are assumed to flow to and from the worker generation, although the size of the transfer may depend on the age composition of the family. Familial transfers, which flow to and from the worker generation and 4 If there are important changes in the timing of fertility (tempo effects), cohort fertility will decline more slowly or more rapidly than period measures of fertility.
7
dependent generations (children and retirees), provide the means by which any distribution of consumption can be obtained. The consumption of each dependent generation is equal to that generation’s labor income and its net familial transfers. The consumption of the worker generation is equal to its labor earnings plus net public transfers plus net familial transfers. Suppose that per capita consumption of each generation is determined by an altruistic family utility function. ( ( , ), ( , ), ( , ); ( , ), ( , ))U c a t c a g t c a g t n a g t n a g t− + − + (4) subject to:
( , ) ( , ) ( , ) ( , ),
( , ) ( , ) ( , ),
( , ) ( , ) ( , ), and
( , ) ( , ) ( , ) ( , ) ( , ) 0.
l p f
l f
l f
f f f
y a t a t a t c a t
y a g t a g t c a g t
y a g t a g t c a g t
a t n a g t a g t n a g t a g t
τ τ
τ
τ
τ τ τ
+ + =
− + − = −
+ + + = +
+ − − + + + =
(5)
where ( , )ly x t is the per capita labor income of persons aged x, c(x,t) is per capita consumption of persons aged x, ( , )p x tτ is the net public transfer to households with workers aged x, and ( , )f x tτ is the net familial transfer to individuals aged x.5 Net public transfers received by the household are exogenous to the family decision-making process, but depend on the composition of the household, the effects of age structure on the political decision-making process, and the social budget constraint.
2 1 3
2 1 1 2 3
( , ) ( , ) ( , )
( ) ( ) 0
p P P P
P P P
a t n a g t n a g t
DR t DR t
τ τ τ τ
τ τ τ
= + − + +
+ + =
% % %% % % (6)
where P
iτ% is the per capita net public transfer payment to generation i (children, workers,
or retirees) and 1( )DR t is the ratio of the children to workers in the population and 2( )DR t is the ratio of retirees to workers in the population.
Suppose that the bundles of goods consumed by children, workers, and pensioners do not differ in their composition, so that changes in relative prices do not influence the family’s allocation problem. If this is the case, then the share of the family’s budget consumed by children, workers, and pensioners (w) will be affected only by total family income, ( , ),Ty a t and population age structure, n(a+g,t), and n(a-g,t):
1
2
3
( , ) ( ( , ), ( , ), ( , ))
( , ) ( ( , ), ( , ), ( , ))
( , ) ( ( , ), ( , ), ( , )),
T
T
T
w a g t f n a g t n a g t y a t
w a t f n a g t n a g t y a t
w a g t f n a g t n a g t y a t
− = − +
= − +
+ = − +
(7)
where ( , ) ( , ) ( , ) ( , ) ( , ) ( , ) ( , ).T p l l ly a t a t y a t n a g t y a g t n a g t y a g tτ= + + − − + + + (8)
5 Positive transfers are receipts and negative transfers are payments.
8
In a consumption loan economy, the per capita income by age for each of the three generations is:
( , ) ( , ) ( , ) / ( , )
( , ) ( , ) ( , )
( , ) ( , ) ( , ) / ( , ).
T
T
T
y a g t y a t w a g t n a g t
y a t y a t w a t
y a g t y a t w a g t n a g t
− = − −
=
+ = + +
(9)
From equations (7), (8) and (9), the social budget constraint on public transfers, and relaxing the altruism assumption, the reduced form of the per capita income by age for each of the three generations is:
y a g t g n a g t n a g t y a t y a g t y a g t DR t DR t
y a t g n a g t n a g t y a t y a g t y a g t DR t DR t
y a g t g n a g t n a g t y a t y a g t y a g t
− = − + − +
= − + − +
+ = − + − + 1 2( ), ()).DR t DR t (10) The earnings of dependent generations relative to the generation of the worker
generation is measured using 1r and 2r , where 1 2( , ) ( , )
and ( , ) ( , )
l l
l l
y a g t y a g tr r
y a t y a t− +
≡ ≡ .
A convenient empirical formulation is:
0 1 2 1 3 2 4 5 6 1 7 2
0 1 2 1 3 2 4 5 6 1 7 2
0 1 2 1 3 2 4 5
ln ( , ) ln ( , ) ( , ) ( , ) ( ) ( )
ln ( , ) ln ( , ) ( , ) ( , ) ( ) ( )
ln ( , ) ln ( , ) ( , ) (
l
l
l
y a g t y a t r r n a g t n a g t DR t DR t
y a t y a t r r n a g t n a g t DR t DR t
y a g t y a t r r n a g t n a
α α α α α α α α
β β β β β β β β
γ γ γ γ γ γ
− = + + + + − + + + +
= + + + + − + + + +
+ = + + + + − + 6 1 7 2, ) ( ) ( ).g t DR t DR tγ γ+ + + (11) Thus, per capita income of any generation depends on the earnings of workers, the earnings of children and pensioners relative to workers, and child and old-age family dependency ratios and the child and old-age population dependency ratios.
We can elaborate several hypotheses from equation (11). Some of the following hypotheses are linked to each other. Thus, if one hypothesis is rejected, then it affects the other hypothesis. However, we can still compare the size of the effects across generations because the measures of independent variables are identical across all three regressions.
First, in a true consumption-loan economy 1 1 1, , and α β γ may not all be greater than 1 given r1 and r2. One generation can gain relative to its earnings only at the expense of another generation’s loss. If preferences are homothetic and effective altruism governs transfers, then these coefficients would not be significantly different from 1, and age structure will be independent of the generational distribution of income. The existence of non- labor income adds additional complications. If growth in earnings is associated with a change in the relative importance of non-labor income, then per capita income for any age group may grow more rapidly or more slowly than labor income.
9
Second, if the family is altruistic, then the income of each generation will be independent of their share of family earnings contributed by members of that generation. That is, given effective altruism, we expect 2 3 2 3 2 3; ; .α α β β γ γ= = = Homothetic preferences and effective altruism together imply that the coefficients are all zero. If the results are inconsistent with the pure altruism hypothesis, then the magnitude of these coefficients will depend on the degree of altruism governing transfers.
Third, if preferences are homothetic and the family is altruistic, then changes in family age structure are neutral with respect to the generational distribution of income. In this case, we would expect 4 4 4 5 5 5 and α β γ α β γ= = = = , and that all will be negative. If either altruism or homothetic preferences fails, then the income effect of dependency will differ across generations, although at least one coefficient must be negative due to the familial budget constraint.
Fourth, there is only an income effect associated with changes in public transfers induced by an increase in the population dependency ratio. Given the social budget constraint, an increase in either the youth dependency ratio or the old age dependency ratio must produce a decline in per capita income given per capita earnings. Thus, the coefficients of the population dependency ratio will be negative. If altruism holds and tastes are homothetic, all generations will experience an equivalent percentage decline in their incomes with an increase in the population dependency ratio, i.e.,
6 6 6 7 7 7 and α β γ α β γ= = = = . II. Empirical Analysis Although the major emphasis of this paper is methodological, the analysis of income growth in Taiwan is of interest in its own right. Taiwan has experienced rapid demographic and economic change. Life expectancy at birth increased from roughly 25 in 1900 to 78 for females and 72 for males in 1999. The total fertility rate declined from over 6 births per woman in the 1950s to replacement level by 1984. The age structure has changed rapidly. Since 1960 Taiwan’s economy has been among the most dynamic in the world. How demographic change has affected economic growth and transfer systems in Taiwan could be an important development policy issue.
Data for Empirical Analysis The values of all variables that compose the synthetic panel are constructed from the Survey of Family Income and Expenditure in Taiwan (FIES), also known as the Survey of Personal Income Distribution in Taiwan until 1993. The number of household surveyed has varied over time, but the sample size is more than sufficient for our purposes. In 1998, about 0.4 percent of all households (14,031 households and 52,610 individuals) were interviewed. These are not panel data, but repeated cross-sections.
The data set consists of mean values for single-year family cohorts for 21 consecutive years. The generation length g is set to 30 years. This estimate is based on the difference in the average age of different generations observed in the sample. The
10
generation length is quite stable across time for family cohorts under the age of 50.6 Thus, the data consists of 30 family cohorts for each year consisting of workers aged 30-59, their children aged 0-29, and seniors aged 60-89. Those aged 90 and older are included with the 89-year-old pensioners. Thus, the data set consists of 21 years times 30 age groups, yielding 630 observations. The oldest members were born in 1891 and the youngest in 1998, but for these two groups we have only one observation. Family cohorts with workers born near the middle of the span of birth years covered (1955) can be tracked over the entire 21-year span of the data.
An attractive feature of the FIES is that each component of household income is assigned to members of the household. Although there is a residual category for income that cannot be assigned to an individual, this category is rarely used. Consequently, we can calculate earnings, defined as wages plus two thirds of business income, separately for each generation by age. Per capita household income is estimated for each household member by allocating total current disposable income equally among all household members. Average earnings and per capita income by age are estimated using sample weights.
The family dependency ratios in Figure 3 are obviously noisy measure of true family dependency ratio in part because the generation gap is not exactly 30 years and it differs by household. To diminish the potential bias from this problem, we use a five-age moving average to measure family dependency ratios. Thus, the number of observations decreases to 546.
The source of information for population forecasting is the Projection of the Population of Taiwan conducted by the Taiwan Council for Economic Planning and Development. The data includes Taiwan population projection between 1951 and 2101. The data set is used for both counter factual analysis and forecasting income.7
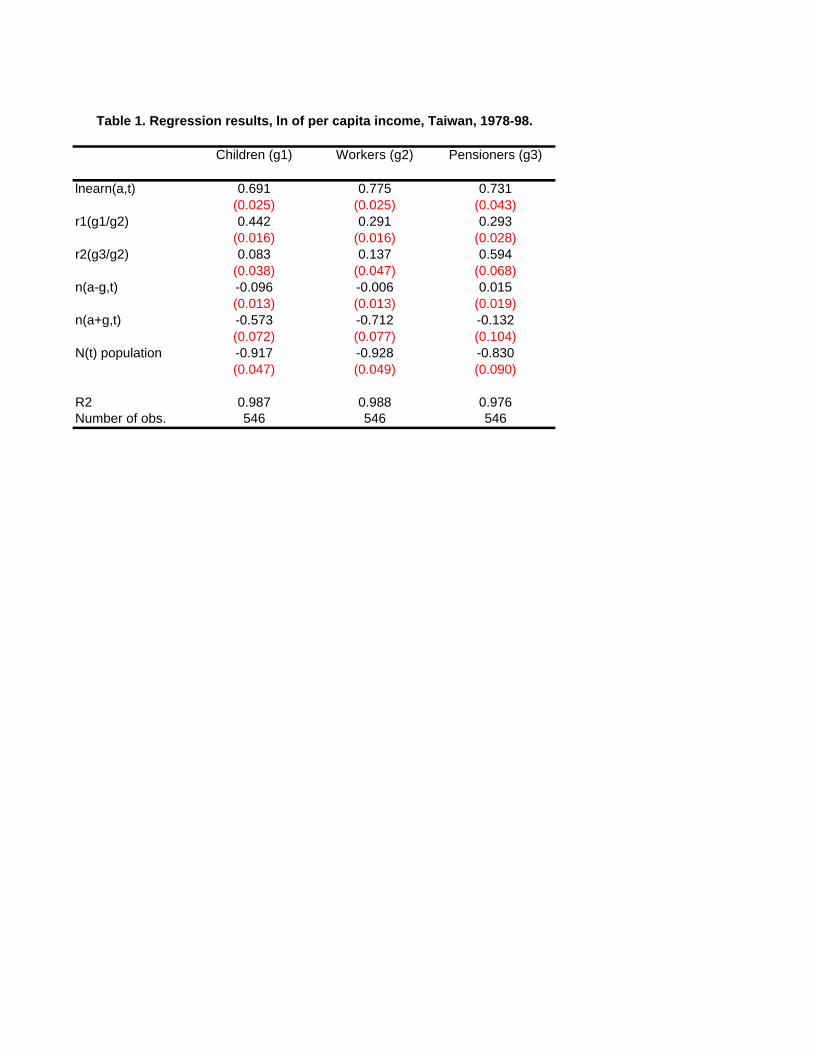
Regression Results Regression estimates for the per capita income of each generation are reported in Table 1. All regressions are estimated using ordinary least squares. We include the combined population dependency ratio instead of distinguishing the child dependency ratio and the old age dependency ratio due to the extremely high correlation between these two variables (ρ=0.990). The modified Durbin-Watson test statistics implies that we may not include a trend variable in the model. All estimates in this paper were obtained using the consistent variance-covariance matrix estimator of White (1980). The standard errors are thus robust to heteroscedasticity.
The coefficient of the log earnings of workers (lnearn) captures the effect of general increases in earnings because the ratios of worker earnings to children and pensioner earnings are controlled. The coefficients of the log earnings of workers are positive and significant at 1 percent level for all regressions. The larger coefficient for the worker generation (g2) implies that earnings growth leads to an increased concentration of per capita income in the worker generation. The lnearn coefficient for the worker
6 For older cohorts the age difference declines due to the effects of mortality on the survival of pensioners leading to an underestimate of the generation length. 7 Although we focus on our income forecast during 1978-2030, we do need the projection data of 1951-1977 and 2031-2101 to construct the lifetime income by birth cohorts.
11
generation, however, is not significantly different than that for the pensioner generation. That the coefficients are significantly less than one suggests that the share of non- labor income has increased over time.
Table 1. Regression results, log of per capita income, Taiwan, 1978-98. The coefficients of the earnings ratios between generations (r1 and r2) are positive
for all regressions and they are also statistically significant. If the earnings of the child generation increase, holding the earnings of other generations constant, the per capita incomes of all generations increase. Likewise, if the earnings of the pensioner generation increase, all generations enjoy an increase in their per capita incomes. This supports a weak form of altruism. However, the distribution of per capita income is by no means entirely independent of the distribution of earnings. Any change always favors the generation experiencing a relative increase in its own income. Thus, we reject the pure effective altruism hypothesis.
An interesting feature of the results is that transfers do not favor adjacent generations. The pensioner generation gains as much as the worker generation from an increase in the earnings of the child generation. Likewise, the gain for the child generation is not significantly different from the gain for the worker generation resulting from an increase in the earnings of the pension generation.
The estimated effects of age structure are consistent with social and familial budget constraints. An increase in any dependency ratio must lead to a decline in the per capita income of one of the generations. An increase in the family child dependency ratio leads to a significant decline in the per capita income of the child generation; an increase in the family old-age dependency ratio leads to a significant decline in the per capita income of the child and worker generations; an increase in the population dependency ratio leads to a significant decline in the per capita income of all three generations. Other effects are statistically insignificant.
The estimated effects of age structure vary substantially across generation. In particular, the pensioner generation appears to be less susceptible to changes in age structure. Their per capita incomes are not affected by changes in the family dependency ratios. The estimated effect of the population dependency ratio is somewhat less than for the other generations, although the difference is not statistically significant. This suggests that the pensioner generation gained less from the favorable changes in age structure that have occurred in Taiwan and that they will suffer less from the unfavorable changes on the horizon. The counterfactual analysis presented below confirms that this is the case.
In contrast, the per capita incomes of the child and worker generations are more sensitive to changes in age structure. Children were the only generation to benefit from a decline in the familial child dependency ratio, although the effects of the population dependency ratio are much stronger.
A surprising feature of the results is the strength of the population dependency ratio relative to the familial dependency ratio. As discussed above, the familial dependency ratio should have a stronger effect on per capita income when transfers are primarily familial whereas the population dependency ratio may have a stronger effect when transfers are primarily public. Given the importance of family transfers to children, our expectation was that family age structure would have a much more important effect than
12
population age structure for the per capita income of the child generation. The child generation is the only generation for which the family child dependency ratio is negative, however the population dependency ratio has a much stronger effect. It is unclear exactly what mechanism would lead to this result.
Even in the case of the pensioner generation, the strength of the population dependency ratio and the weakness of the familial dependency ratios are surprising. A high percentage of the elderly in Taiwan still co-reside with their children. Public transfers have increased in recent years, but are a much smaller share of the incomes of the pensioner generation than would be the case in the US, Europe, or many Latin American countries.
It may be that a more refined measure of the familial dependency ratios than the ones used here would lead to larger estimated effects. This is an issue that warrants further attention in future research.
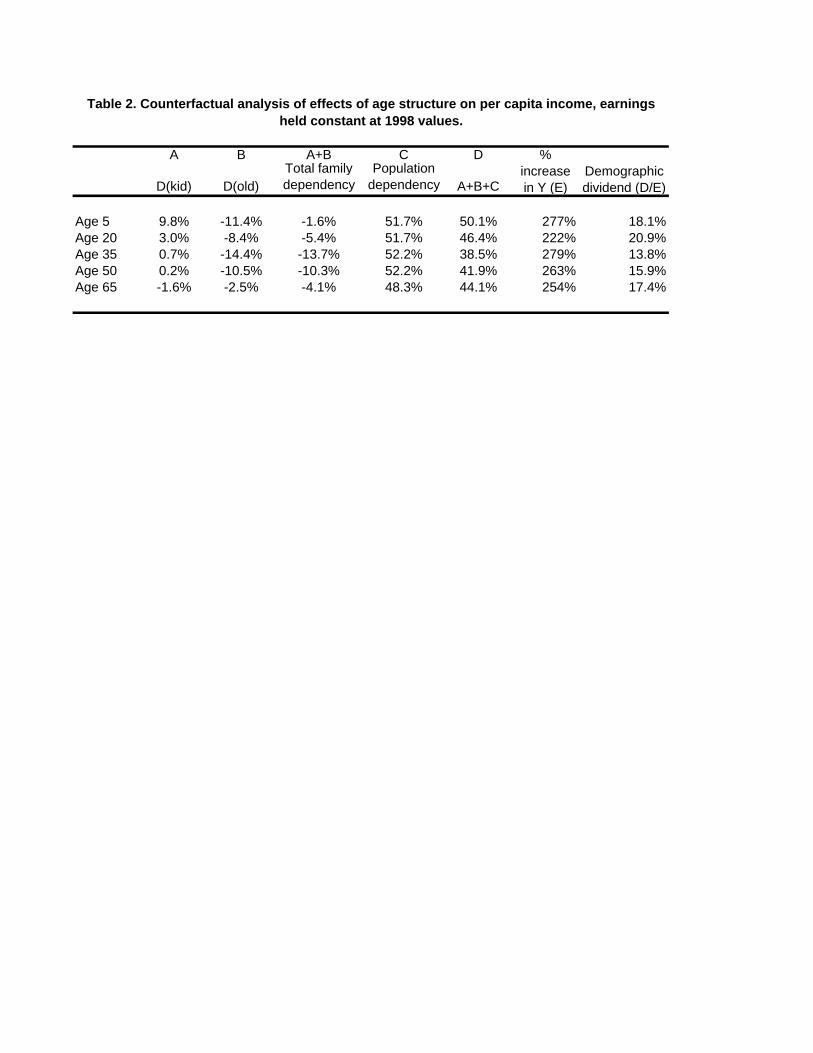
Counter-Factual Analysis The historical implications for transfers of changes in earnings and aging are assessed using simulation techniques. We construct a series of counter-factual simulations that allow dependency structures to change in accordance with their observed historical trend while holding all other variables constant at their 1998 levels. Using the coefficient estimates reported in Table 1 we calculate how per capita income would have evolved given the counter- factual values. All calculations employ the observed values by single years of age for the year in which the calculations are being made. Results for selected ages are presented in Table 2.
The combined effect of changes in age structure on per capita income between 1978 and 1998 were very substantial in Taiwan. The increase in per capita income due to changes in age-structure (A+B+C) ranged from 38.5% for 35-year-olds to 50.1% for five-year-olds. The effect was a substantial share of the total increase in per capita income in Taiwan during the entire period (column E). Demographic change accounted for between 13.8 percent and 20.9 percent of all economic growth. The effects are somewhat smaller than other estimates of the demographic bonus (Bloom and Williamson 1998; Mason 2001a), however the estimates are robust to slight changes in the definition of income and specification.
Table 2. Counterfactual analysis of effects of age structure on per capita income,
earnings held constant at 1998 values. The dominance of the population dependency ratio as compared with the familial
dependency ratio is clear from the counterfactual analysis. The familial child dependency ratio had a negligible effect for ages reported in Table 2 except for five-year-olds. The rise in the familial old-age dependency ratio has a modest negative effect for the non-elderly – reducing per capita income by about 10% over a twenty year period. The negative impact of the old-age family dependency ratio was overwhelmed by the favorable effect of the population dependency ratio. Forecasting Income by Age
13
We use the empirical results for forecasting income until 2030. Obviously our forecast belongs to the regression based econometric models rather than time-series based models. The usual problem of the regression based econometric models is that we need to know the future values of independent variables. In this paper, we focus on conditional forecasts in which the value on future population structure is given. Thus, although the forecast involves unconditional forecasting elements, we are mostly interested in the effect of the population structure on per capita income contingent on knowing the future population structure.
Based on the projected dependency structure, we simulate the net effects of changes in dependency structure on per capita income allowing dependency structures to change while controlling the other variables to hold constant at 1998 level. Regression estimates are again used to forecast what per capita income would be by birth cohort if only population structure changes.
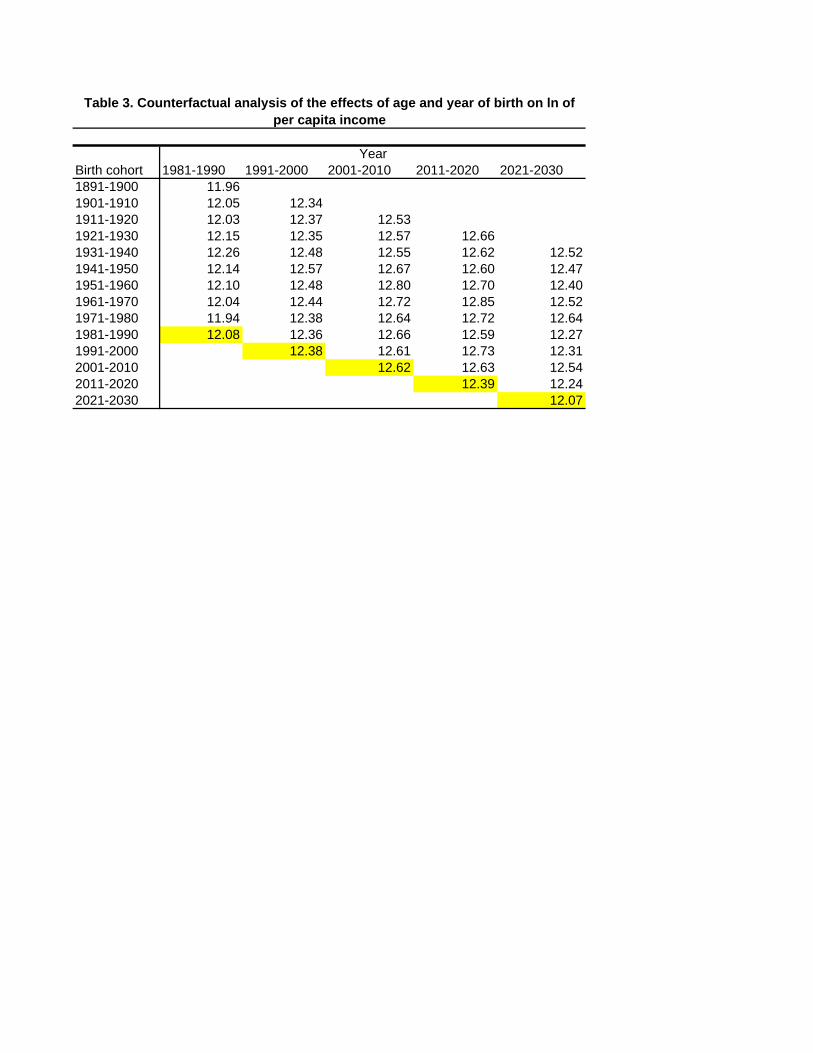
Table 3 documents the total effect of all dependency ratios up to year 2030 by age and by birth cohort. One follows a birth cohort ove r time by moving horizontally across columns within the same row. One follows the same age group over time by moving downward along a diagonal. Within cohort, income changes over time are attributable to age effects. In contrasts, changes in income within an age group are due to cohort effects. Because all other variables are held constant at 1998 level, there is no time effect resulting from productivity changes.
The table suggests that demographic dividend varies substantially by age. For example, the log income of age 0 (the bottom diagonal) decreases from 12.39 in 2011-20 to 12.07 in 2021-30 when population aging turns the dividend into a burden. However, the decrease for age 90 (the top diagonal) is much less, from 12.66 to 12.52. Likewise, the effect of change in dependency ratios is not neutral across birth cohort. The log income of 1991-2000 birth cohort increases from 12.31 to 12.61 as they move from age 0 to age 10. But the log income of 2001-10 birth cohort changes little (12.62 to 12.63) for the same changes in age.
Table 3. Counterfactual analysis of the effects of age and year of birth on log of per
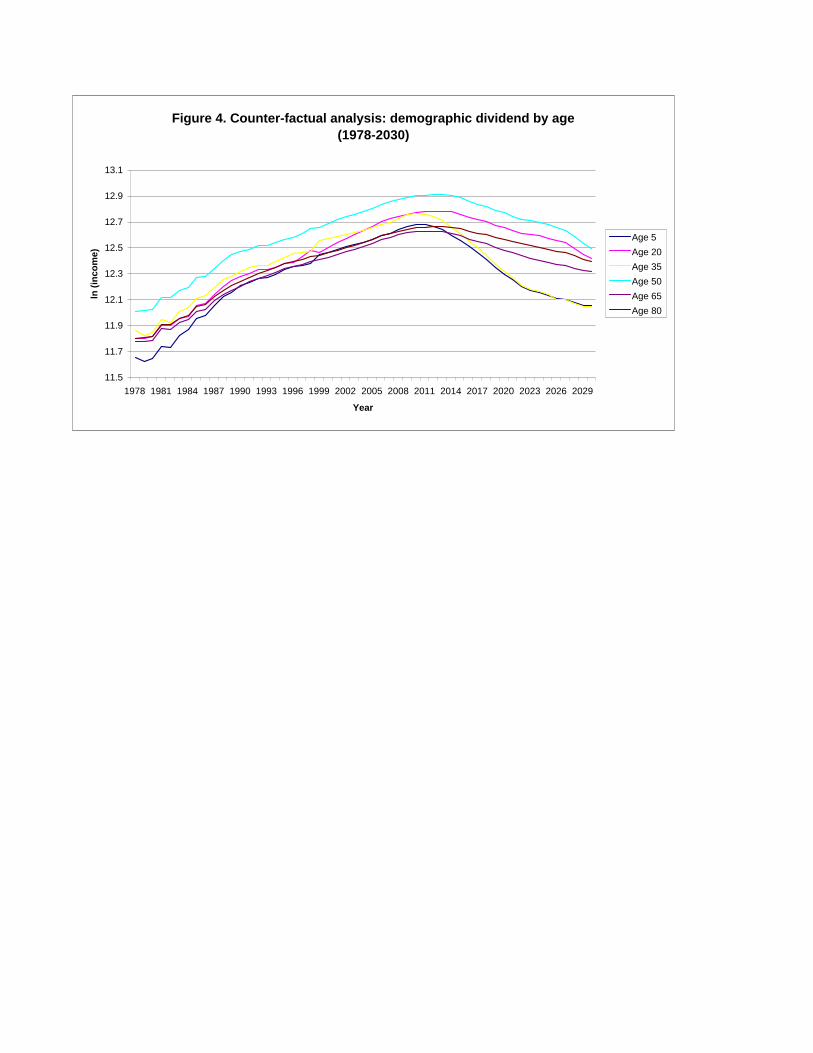
capita income. Figure 4 summarizes the effect of all dependency ratios by age over time. The
figure indicates that child generations will suffer most when population aging turns the dividend into a burden and that pensioners will suffer least from population aging.
Figure 4. Counterfactual analysis : demographic dividend by age (1978-2030) Which birth cohort benefits the most from changes in age structure? To answer the
question, we use predicted values of income at each age for cohorts born between 1949 and 2014 holding all other variables constant.8 To construct population and family
8 Predicted values are available only for ages 2-27, 32-57, and 62-87 because of our reliance on five-year moving averages of family dependency ratios. Thus, the counter-factual values are simple averages for these age groups. The earliest birth cohort for which predicted values at all included ages can be obtain is the 1949
14
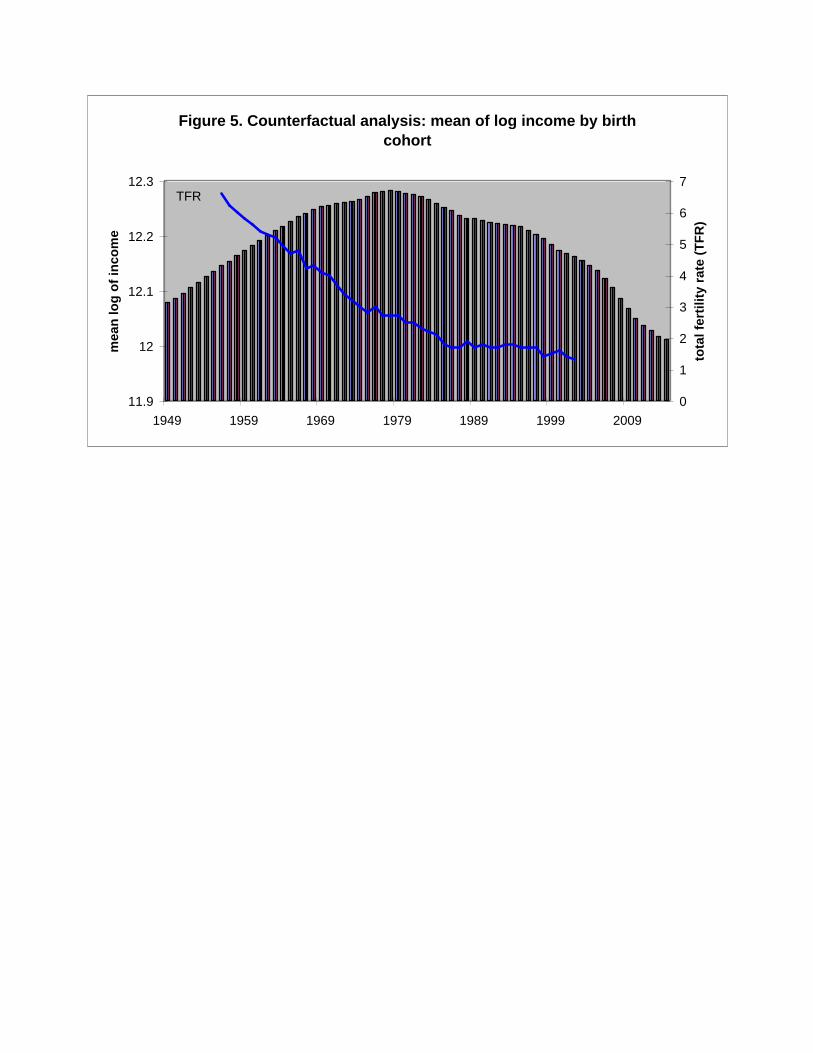
dependency ratios we use a population projection for 1951 to 2101 provided by the Taiwan Council for Economic Planning and Development. Figures 5 presents the results – the log of income averaged over the available ages for each birth cohort. Figure 5 indicates that it is people born between 1974 and 1983 who benefit most from demographic change. The 1978 cohort is most favored with an average per capita income about 20% higher than that of the 1949 birth cohort and 30% higher than the 2014 birth cohort. The adverse effects of demographics among future generations are felt by cohorts born after 2004. Relative to the 1949 birth cohort, the demographic dividend is entirely dissipated by 2008.
Figure 5. Counterfactual analysis: mean of log income by birth cohort (1949-2012)
Although mortality decline made an important contribution to the changes in age structure that underlie the demographic dividend, the precipitating event was fertility decline. Of particular policy interest then is whether the gains in per capita income accrued to those who decided to have fewer children or to someone else? A comparison of the gains charted in Figure 5 to Taiwan’s total fertility rate (TFR) sheds light on this issue.
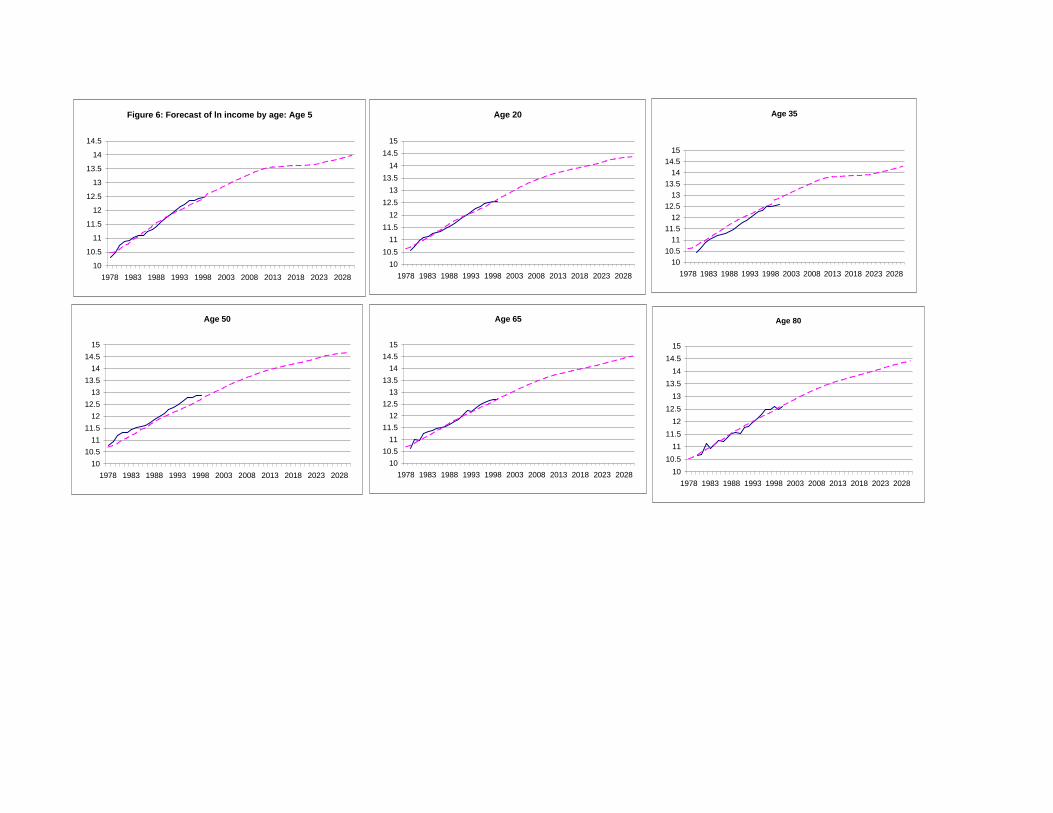
Roughly speaking, the greatest beneficiaries were members of the first low-fertility birth cohorts – the children of those who chose to have lower fertility. Their advantage relative to their parents is that they experienced low child dependency, both in their families and in their population, throughout their entire lives. Their parents, on the other hand, experienced high child dependency during their childhood and low child dependency only as workers and pensioners. Because both generations had few children, they both will experience elevated old-age dependency ratios when they become pensioners. The continued dissipation of the dividend in Figure 5 reflects continued improvements in life expectancy and the consequent rise in the proportion of the population at older ages. Based on the regression results, we also forecast the log per capita income by age allowing productivity to increase. We predict log earnings using year, age and age squared. The relative income variables, r1 and r2, exhibit irregular trends that are implausible for some ages. Consequently, we assume that the ratios of earnings by generation (r1 and r2) are fixed at the average of 1978-1998 level. The forecasts are also conditioned on the projected population age structure. Figure 6 presents the results. If productivity increases continue at the pace consistent with the 1978-98 period, per capita income will increase at an annual rate of about 5.6% per year during the 1999-2030 period. Five-year-olds will experience growth of 4.5% as compared with 4.9% for thirty five-year-old and 5.8% for sixty-five-year-olds. Twenty-year-olds will experience growth of 5.6% as compared with 5.8% for fifty-year-olds and 6.0% for eighty-year-olds.
Figure 6. Forecasts of log income by age (1978-2030)
III. Conclusion
birth cohort which was age 2 in 1951. The latest birth cohort for which calculations are possible is the 2014 birth cohort that would have been 87 in 2101.
15
Previous studies of the effects of age structure on income do not consider the possibility that effects differ by age group. If public transfer programs are influenced by age structure – and available evidence suggests this to be the case – then it seems likely that gains and losses associated with the demographic transition may be shifted across age groups, protecting some and burdening others. The public sector is not, however, the only force at play. In many countries, families play an important role in allocating income across generations or age groups. One possibility is that they will neutralize intergenerational transfers undertaken by the public sector as suggested by Barro (1974). But in many societies, the public sector plays a relatively modest role – particularly with regard to children, but also with respect to the elderly.
Family transfers may be influenced by the family’s age structure in ways that are very similar to the ways that public transfers are influenced by population age structure. For either unit, changes in age structure can lead to tighter or more relaxed budget constraints. However, at any point in time the demographic situation for families will differ from those for the population. This is true because families have a demographic lifecycle with favorable demographics at some ages and less favorable demographics at others. It is also true because families alive at the same time have different demographic experiences. Especially in a country with rapid demographic change, completed family size can vary considerably from one cohort to the next.
An integrated analysis of population and family- level age effects is not common in the literature because it seems to involve different levels of analysis. The overlapping families (OLF) model proposed here offers one approach to dealing with the problem. The model relies on a highly stylized view of the family. One way to improve on the research presented here would be to refine the way in which the family is modeled within the OLF framework.
The empirical results in the paper lead to several interesting conclusions. First, both population age structure and family age structure influence per capita income. Population age structure, however, has a much stronger effect than family age structure. This result seems surprising to us, especially for a society like Taiwan’s, and warrants further attention. Second, the analysis provides support for only a weak form of altruism. Increased earnings among members of one generation lead to higher incomes for members of other generations. A surprise here is that adjacent generations do not benefit more than non-adjacent generations. If the earnings of pensioners decline, for example, the incomes of workers and children are adversely affected by roughly equal amounts.
Who gained from the demographic dividend? The biggest winners were members of the first low-fertility generation – not the parents who first chose to have low fertility. The parents did gain, but by less than their children. The policy implications of this depend to an extent on one’s view of the world. If the gains were to the children of those who decided to have lower fertility and parents are altruistic towards their children, then gains to children were captured by their parents. The empirical work presented here casts doubt on this view in two ways. First, the empirical analysis supports only a weak form of altruism. Second, the population dependency ratios have much greater force than the family dependency ratios. This suggests social reallocations of the gains from fertility decline that limit the extent to which they are captured by those who opt to have fewer children.
16
References Altonji, J. G., F. Hayashi, et al. (1992). "Is the Extended Family Altruistically Linked?
Direct Evidence Using Micro Data." American Economic Review 82(5): 1177-98. Altonji, J. G., F. Hayashi, et al. (2000). The Effects of Income and Wealth on Time and
Money Transfers between Parents and Children. Sharing the Wealth: Demographic Change and Economic Transfers between Generations. A. Mason and G. Tapinos. Oxford, Oxford University Press: 306-357.
Barro, R. J. (1974). "Are Government Bonds Net Worth?" Journal of Political Economy 82(6): 1095-117.
Becker, G. S. and K. M. Murphy (1988). "The Family and the State." Journal of Law & Economics XXXI(April): 1-18.
Becker, G. S. and N. Tomes (1976). "Child Endowments and the Quantity and Quality of Children." Journal of Political Economy 84(4 pt. 2): S143-62.
Bloom, D. E. and D. Canning (2003). "From demographic lift to economic lift-off: the case of Egypt." Applied Population and Policy 1(1): 15-24.
Bloom, D. E. and J. G. Williamson (1998). "Demographic Transitions and Economic Miracles in Emerging Asia." World Bank Economic Review 12(3): 419-56.
Bommier, A., R. Lee, et al. (2004). The Development of Public Transfers in the US: Historical Generational Accounts for Education, Social Security, and Medicare. Annual Meeting of the Population Association of America, Boston, MA.
Chayanov, A. V. (1966). The Theory of Peasant Economy. Homewood, Il, Irwin. Cox, D. (1987). "Motives for Private Income Transfers." Journal of Political Economy 95:
508-46. Cutler, D. M. and et al. (1990). An Aging Society: Opportunity or Challenge?, Mit. Frankenberg, E., L. A. Lillard, et al. (2002). "Patterns of Intergenerational Transfers in
Southeast Asia." Journal of Marriage and the Family 64(August): 627-41. Gruber, J. and D. Wise (2001). "An International Perspective on Policies for an Aging
Society." NBER Working Papers W8103. Kelley, A. C. and R. M. Schmidt (2001). Economic and Demographic Change: A
Synthesis of Models, Findings, and Perspectives. Population Matters: Demographic Change, Economic Growth, and Poverty in the Developing World. N. Birdsall, A. C. Kelley and S. W. Sinding. Oxford, Oxford University Press: 67-105.
Kotlikoff, L. J. and A. Spivak (1981). "The Family as an Incomplete Annuities Market." Journal of Political Economy 89(2): 372-91.
Lee, R. D. (1994). The Formal Demography of Population Aging, Transfers, and the Economic Life Cycle. Demography of Aging. L. G. Martin and S. H. Preston. Washington, D.C., National Academy Press: 8-49.
Lee, R. D. (2000). Intergenerational Transfers and the Economic Life Cycle: A Cross-cultural Perspective. Sharing the Wealth: Demographic Change and Economic Transfers between Generations. A. Mason and G. Tapinos. Oxford, Oxford University Press: 17-56.
Lee, Y.-J., W. L. Parish, et al. (1994). "Sons, Daughters, and Intergenerational Support in Taiwan." American Journal of Sociology 99(4): 1010-41.
Lillard, L. A. and R. J. Willis (1997). "Motives for Intergenerational Transfers: Evidence from Malaysia." Demography 34(1): 115-34.
17
Mason, A. (2001a). Population and Economic Growth in East Asia. Population Change and Economic Development in East Asia: Challenges Met, Opportunities Seized. A. Mason. Stanford, Stanford University Press: 1-30.
Mason, A. (2001b). Population Change and Economic Development in East Asia: Challenges Met, Opportunities Seized. Stanford, Stanford University Press.
Mason, A. and R. Lee (2004). Reform and Support Systems for the Elderly in Developing Countries: Capturing the Second Demographic Dividend. International Seminar on the Demographic Window and Healthy Aging: Socioeconomic Challenges and Opportunities, China Centre for Economic Research, Peking University, Beijing.
Preston, S. H. (1984). "Children and the Elderly: Divergent Paths for America's Dependents." Demography 21(4): 435-457.
Razin, A., E. Sadka, et al. (2002). "The Aging Population and the Size of the Welfare State." Journal of Political Economy 110(4): 900-918.
Samuelson, P. (1958). "An Exact Consumption Loan Model of Interest with or without the Social Contrivance of Money." Journal of Political Economy 66: 467-82.
Willis, R. J. (1980). The Old Age Security Hypothesis and Population Growth. Demographic Behavior: Interdisciplinary Perspectives on Decision-making. T. Burch. Boulder, Westview Press: 43-69.