31
1 Who Gets to Share in the “Sharing Economy”? Racial Discrimination in Participation, Pricing and Ratings on Airbnb by Mehmet Cansoy and Juliet Schor Boston College Department of Sociology
| Date post: | 16-Feb-2019 |
| Category: |
Documents |
| Upload: | nguyenphuc |
| View: | 223 times |
| Download: | 0 times |
1
Who Gets to Share in the “Sharing Economy”? Racial Discrimination in Participation,
Pricing and Ratings on Airbnb
by
Mehmet Cansoy and Juliet Schor
Boston College
Department of Sociology

2
The “sharing economy,” almost a decade after its inception, remains a contested subject.
The digitally mediated platforms for goods and services that have become the most familiar venue
for “sharing,” have been growing rapidly, with entrepreneurs and investors constantly on the
search for new markets to disrupt. Demand for their services has also been fairly high, with almost
57% of Americans having used two or more of them (Pew Research Center 2016). Airbnb and
Uber, the two giants of the sharing economy, are valued at 30 and 68 billion respectively,
surpassing many established companies in the conventional economy (O’Brien 2016; Sorkin
2016). The companies and their proponents argue that this is for good reason as their innovative
approach has significant competitive advantages. The digital mediation they provide lowers
transaction costs, crowd-sourced reliability and reputation information support exchange in ways
that conventional reputation systems like branding could not, and the peer-to-peer structure of the
platform lowers the barriers to entry for new actors. Coupled with a strongly positive press
coverage the companies have made the case that these advantages allow them to create inclusive
opportunity structures that benefit broad swathes of society.
However, the reality of the sharing economy is much more complex, with debates on
everything from consumer safety to labor conditions. The classification of “providers” on the
platforms as independent contractors is the subject of several lawsuits. The lack of regulation on
how the platforms operate has raised public concerns over tax avoidance and even the local
housing markets. Some have even questioned their claims to competitive advantage, claiming that
their business success is rooted in this lack of regulation more than the organizational and technical
innovations they bring to their sectors.
More recently, a set of studies have brought the racial inequality in the sharing economy
platforms to prominence. These show how racial minorities, specifically African-American
people, face significant discriminatory behavior both as consumers and providers on the platforms
(Edelman and Luca 2014; Edelman, Luca, and Dan 2015; Ge et al. 2016; Thebault-Spieker,
Terveen, and Hecht 2015). These findings have found some resonance in the public debate around
Airbnb, with African-American users of Airbnb sharing their personal experiences of
discrimination on the platform over social media and in various news outlets, two Airbnb
competitors being founded on the premise of being explicitly accommodating to all racial groups
and Airbnb taking highly publicized steps to change their policies and practices.
Yet these few studies and the public conversation does not provide an adequate picture of
the size and extent of discrimination in the home sharing platform, as they tend to rely on either
anecdotal evidence, or are limited by small samples or the geographic extent of their data. In this
paper, using a unique data set we provide the first nation-wide look at discrimination in the sharing
economy, focusing on the home-sharing platform Airbnb. Our sample, covering more than
220,000 listings in 104 metropolitan areas in the United States, allows us to go beyond the smaller
scales of previous studies and represents a viable way to overcome the dearth of publicly available
data due to the sharing economy companies’ reluctance to cooperate with independent researchers.
Analyzing our data on the Airbnb platform in conjunction with demographic data from the
US Census Bureau, we find that in areas with higher concentrations of minority residents, Airbnb
participation is significantly lower, with those that participate in these areas charging lower prices
3
for their services and earning lower ratings from their guests. Our data indicates that on average
we should expect a census tract that has an all-white population to have about 4 listings on the
platform, while a comparable all non-white tract would have only about 2 listings. A listing in the
former tract is expected to charge 120$ per night (excluding fees) and have about 96 of 100 rating,
while a comparable listing in the latter will charge 13$ less and have a rating that’s about 2 points
lower. These patterns show that racial discrimination in the sharing economy go beyond isolated
incidents and suggest that the sharing economy may be reproducing existing structural inequalities
found in the conventional economy.
Sharing Economy and Airbnb:
The “sharing economy,” emerged into the post-Great Recession era consciousness as a mix of
novel organizational forms and technical tools that offered powerful alternative ways to
collaborate, produce and consume. Its constituents ranged in size from local tool libraries, to online
services for “micro tasks” that organized thousands of workers around the globe, from time banks
that eschewed money, to global marketplaces in which you could pay for all types of services.
Over time, the most visible part of the sharing economy has become the tech-based “platforms”
which bring together a multiplicity of providers and consumers to facilitate what has been called
“peer-to-peer” or person-to-person structured exchange. On the platforms, sophisticated software
yields timely information on prices and availability, reduces transactions costs and handles
payments electronically and seamlessly. In many of them, crowd-sourced information is used to
establish user ratings and reputation, thereby addressing issues of trust which arise in cases of
stranger exchange (Schor and Fitzmaurice 2015).
One of the biggest of these platforms is the “home sharing” giant Airbnb. Founded in 2008, it
is an online marketplace for short-term rentals, of anything between medieval castles to a futon in
a studio apartment. The lodgings shared on the platform range from “shared rooms” in which the
prospective guest doesn’t have a guarantee of privacy, to “private rooms” in which the guest is the
only occupant, to “entire residences” in which the host is not present for the duration of the stay.
Hosts on the platform provide details on the space they are willing to rent, including photos, and
select the dates for which they want to make their “listing” available. Guests can then search the
platform for the location, dates, prices, and the types of spaces they want to rent. In order to
facilitate trust in the exchange, the company verifies the identities of both parties and provides
reviews and ratings for them from previous exchanges on the platform. Airbnb itself earns revenue
by taking a fee from each transaction on the platform. With low barriers to entry for providers, it
has attracted large user base with more than 2 million “listings” worldwide. It has also witnessed
skyrocketing demand for its services with 17 million people using the service in the summer of
2015, compared to 47,000 for the same period in 2010 (Airbnb 2015a).
Literature Review:
There is a large amount of evidence in the literature that racial inequality and racial
discrimination remain important structural features of the conventional U.S. economy. This
entrenchment of racial inequality, its “sedimentation” (Oliver and Shapiro 1995:5), has created
material and social conditions under which enacting meaningful change in economic outcomes is

4
increasingly difficult. Three key components of this inequality -employment, housing and use of
digital resources- are the key to understanding racial inequality on Airbnb, and they provide insight
into racial discrimination in the broader sharing economy.
Employment in the conventional economy is biased against non-white racial groups in a
number of ways. Race, especially in lower paying jobs, is used as a mechanism to filter job
applicants, in a manner that heavily favors whites over other racial groups (Pager 2003; Pager,
Western, and Bonikowski 2009). Beyond the hiring decision, it is also used to channel non-white
people into lower-paying jobs, or into positions without opportunities for advancement (Braddock
et al. 1986; Royster 2003). Similar trends are also found in the conventional hospitality sector
(Costen, Cliath, and Woods 2002). These practices, along with others, have resulted in a significant
and consistent “wage gap” between different racial groups. On average white workers enjoy hourly
wages much higher than minorities and while Asian wage earners have closed the gap in recent
years, Black and Hispanic workers’ earnings have not improved in a similar manner (Patten 2016).
In fact, a recent EPI report (Wilson and Rodgers 2016) suggests that the gap between white and
black wage earners is actually growing worse.
This broad range of discrimination and unequal outcomes in the conventional economy is
one of the primary reasons why the sharing economy is seen as a venue for the “democratization
of opportunity” (Sundararajan 2016:125). The lower formal barriers to entry, flexibility in hours
worked, autonomy in choice of jobs, and more transparent pay structures are likely important
incentives for people of color to pick work on the platforms over the conventional economy. In
fact, by allowing assets that are traditionally reserved for consumption, like personal cars and
housing, to be monetized these platforms offer lower-income people opportunities to both acquire
those assets at lower costs, and to tap into new revenue streams (Fraiberger and Sundararajan
2015).
Yet, this egalitarian potential in the sharing economy does not preclude discriminatory
outcomes altogether, and one of the biggest sources for them, specifically on Airbnb, is housing
inequality. In the conventional economy, housing inequality across racial lines, takes multiple
forms. First of all, white people, compared to people of color, are much more likely to be home
owners. At the end of the third quarter of 2016, the home-ownership rate among non-Hispanic
whites stood at 71.9%, compared to 55.6%, 47.0%, 41.3% for Asians, Hispanics and Blacks,
respectively. These rates are the result of decades of exclusionary practices and policies, from
“redlining” of neighborhoods and denial of credit to minorities, to discriminatory tax policies and
“white flight” out of the city centers (Frey 1979; Hirsch 2009; Rugh, Albright, and Massey 2015;
Rugh and Massey 2010; Squires 1992) (Squires 1992).
These policies and practices coupled with other factors like immigration patterns (Iceland
and Nelson 2008), have also resulted in the segregation of residential spaces across racial and class
lines (Lichter, Parisi, and Taquino 2012; Massey and Denton 1993; Quillian 2012). While
segregation at the neighborhood level has declined modestly between blacks and whites in recent
years, it has actually increased for Asians and Hispanics, and members of minority groups still live
in neighborhoods that are highly dissimilar to those of whites in terms of their racial composition
(Logan and Stults 2011). Moreover, segregation above the neighborhood level has increased

5
significantly, with larger areas within cities, and the cities themselves becoming more racially
homogeneous (Lichter, Parisi, and Taquino 2015; Parisi, Lichter, and Taquino 2011). The negative
impacts on the disadvantaged minority communities, in terms of reduced public services and
amenities, exclusion from social, professional, and financial networks, reduction in health and
well-being measures are very well documented (Jencks and Mayer 1990; Rugh et al. 2015; Rugh
and Massey 2010; Sampson 2008; Wilson 2012).
These complex inequalities in housing stand to impact the participation and success in the
sharing economy in significant ways. First, while renters are allowed to become hosts, the legality
and practicality of their doing so is hotly contested by landlords and local governments alike
(Dannen 2012; Kokalitcheva 2016). This places a significant proportion of minority groups at a
significant disadvantage in the home-sharing market. Moreover, the reality of residential
segregation means that the real estate that the minority groups are able to put on the platform, is
likely to be less desirable for travelers due to factors resulting from concentration of poverty and
lacking public resources and amenities.
Finally, we have to look at the racial inequalities in having access to and utilizing digital
resources both of which are prerequisites for taking part in the sharing economy. In the late 90s
and early 2000s, the racial and class-based differences in internet access served as the focus of the
debate over “digital divide” (Compaine 2001; DiMaggio et al. 2001:310–11). However, the
disadvantage faced by minorities and lower income people in having access to the internet has
shrunk significantly since then. Today the real digital divide is found in usage patterns that show
significant and durable differences between racial groups, compounded by factors like income and
education (Boyd 2012; Nakamura and Chow-White 2011; Wilson and Costanza-Chock 2012;
Zillien and Hargittai 2009). Low-income, non-white populations tend to use digital technologies
primarily for entertainment and socialization purposes, while their counterparts are much more
likely to employ it in ways that are likely to provide economic benefits. This can be seen in studies
of electronic banking which show that it is adopted at higher rates by whites, people with higher
incomes or more education (Pew Research Center 2013). Additionally, Hargittai (2012) finds that
people from different racial groups tend to self-select into different online services, in her case
social networking sites, re-creating patterns of segregation in the digital world. It is not clear if
“digital segregation” dynamics are at play in Airbnb (see below for more on the racial makeup of
the platform), or in the sharing economy platforms in general. Nonetheless, this literature makes
it clear that the closing gap in internet access does not necessarily translate to equal usage.
Inequality on Airbnb:
Data on the sharing economy platforms, including on their users, remains sparse. This is
partially due to the unwillingness of the companies to provide it to researchers, to which Airbnb is
no exception. However, the same company have capitalized on the optimistic views of the sharing
economy’s egalitarian prospects by producing sponsored research on their positive impacts. For
Airbnb, the latest such effort provides a look at the experiences of hosts, guests and the local
impacts of their platform in twelve major cities around the world (Airbnb 2015b). In these reports,
the company claims to have a positive impact in the regions it operates in by driving tourists and
revenue to areas underserved by traditional hotels, providing lower-income residents with a
6
revenue stream, helping them stay in their homes and building up interpersonal trust (Airbnb
2015b). Another report (Sperling 2015), prepared by an economic advisor to the company,
suggests that home-sharing might be the solution for income stagnation for the middle class.
However even if we take these findings at face value, independent sources of data about platform
use have contradictory implications. A report by Pew Research Center (2016:33) shows that the
general user base of the home-sharing platforms tends to be whiter, younger, better educated and
have higher income than the general population (Pew Research Center 2016:33). Another study
on providers in all sharing economy platforms, found similar trends among them (JPMorgan Chase
and Company Institute 2016).
These findings are not particularly surprising, since as we discussed at length in the
previous section, participation and success in the sharing economy is based on employment,
housing and the use of digital resources that are unequally distributed among racial groups.
However, on Airbnb, yet another source of unequal outcomes stems from the basic premises of
the sharing economy business model in which regulated provision of services in the conventional
economy are replaced by unregulated exchange through the platform. In the conventional
economy, large hotels and Bed and Breakfasts are required by law to avoid racial discrimination
in who they accommodate. While this does not apply to smaller providers, who are more like the
typical Airbnb host, Airbnb nonetheless competes with the larger and regulated institutions as well.
The impact of this has been identified by a number of working papers. Edelman, Luca and Dan
(2015) have found that hosts on the platform regularly discriminate against guests that they
perceive to be African-American, refusing their requests to book even if it means losing revenue.
Similar discriminatory behavior from providers on other sharing economy platforms have been
identified by a number of other studies as well (Glusac 2016; Thebault-Spieker et al. 2015;
Vedantam, Penman, and Nesterak 2016). Discrimination also might be running the other way on
the platforms. Another working paper (Edelman and Luca 2014) shows that hosts identified as
Black based on their pictures charge less than non-Black hosts for similar listings, potentially in
order to compensate for lower demand for their services at higher price points.
Based on this body of work, and the racial inequalities in employment, housing and the
digital realm, we expect that Airbnb is likely to have lower participation in areas with a higher
concentration of minority residents, despite the more egalitarian work opportunities presented by
the platform. Moreover, we also expect that listings in these areas will charge lower prices and
receive lower ratings relative to comparable listings elsewhere, due to the individual prejudices of
the guests, as well as the disadvantages caused by racial segregation in things like public services
and amenities.
Methods:
In order to understand the patterns of access and outcomes for Airbnb hosts, and investigate
potential discrimination in the platform, we chose to analyze the listings matched with US Census
data at the census tract level, rather than employ potentially more intrusive data collection methods
about the users of the platform. The information on Airbnb listings was collected by a program
7
which queried the website’s search function with geographical locations.1 These locations were
city and neighborhood names, as well as latitude and longitude values for the same, in metropolitan
statistical areas (MSAs) in the USA which have a population above 500,000.2 Each location name
was queried on four separate occasions between November 2015 and June 2016. All of the unique
listings returned by the query were then processed to extract their geographical location (latitude
and longitude), alongside other data which we present below. Similarly scraped data from the
platform has been used before in studies of discrimination on the platform (Edelman and Luca
2014; Edelman et al. 2015), the dynamics of room bookings (Lee et al. 2015), how the ratings
system operates (Zervas, Proserpio, and Byers 2015a) and the impact of home sharing on the
hospitality industry (Zervas, Proserpio, and Byers 2015b). Moreover, scraped data about the
platform is available, for sale from commercial data companies as well as for free from a public
awareness campaign (Inside Airbnb 2016).
Our scraping efforts provided us with information on roughly 220,000 Airbnb listings in the
relevant MSAs. Currently there are legitimate concerns about data validity while conducting online
research, especially in the sharing economy (Gelman 2016). This is case with our data as well,
since we no way of ascertaining how much of the total Airbnb listings we were able to capture
with our methods. However, comparing our findings to other publicly available datasets on Airbnb
listings for the same period suggests that we have relatively comprehensive coverage, with the
caveat that our scraping efforts might have somewhat underperformed in the larger Airbnb
markets.
We used the scraped location of listings to match3 them with census tracts using the US Census’
Geocoder API (US Census 2016c). We then merged the listing-level data with the 5-year estimates
of the American Community Survey’s 2014 (US Census Bureau 2016d) for the same census tract.
In our analysis of this data we use hierarchical mixed-effects models4 with spatial lag terms.
Studying geographical data in this manner, using tracts and other census units as a proxy for
individual, household and/or “neighborhood” characteristics is a well-established practice (Krivo
and Peterson 2000; Lee et al. 2009; Quillian 2012), including two recent studies of online sharing
economy platforms (Edelman et al. 2015; Thebault-Spieker et al. 2015). While there are some
1 The program is broadly similar to the one described by Tom Slee (2016) and the code provided by Hamel Husain
(2016). We would like to extend our thanks to both of them for sharing parts of their code and coding logic. 2 The metropolitan area population statistics are based on 2014 Annual Estimates of the Resident Population (US
Census Bureau, 2016a). There are 104 MSAs within the USA (excluding non-state territories) that fit this criteria
and were included in our study, see Appendix 1 for a list. The names of cities in the MSAs were obtained from the
table “Principal cities of metropolitan and micropolitan statistical areas” from the US Census Bureau (US Census
Bureau, 2016b). There are 224 principal cities in the MSAs that fit our criteria. The neighborhood names within the
cities are from “Zillow Neighborhood Boundaries” data. There are 4629 neighborhoods that are located within the
cities which fit our criteria. A list of cities and neighborhood names is available upon request. We obtained the
geographical locations of the centroids of the census tracts from the US Census Geocoder API (US Census 2016c). 3 Airbnb does not provide accurate geographical location of listings, but provides a roughly 0.5 mile-wide “circle”
within which the property is located. We used the center of these circles as the locations of the listings. While it is
possible that this might result in faulty matches to census tracts, we believe that given the limited nature of the data
and the size of Census Tracts, the level of aggregation is appropriate and that any mismatches will be randomly
distributed across tracts. 4 The specific distributions assumed by the models as well as details about model specification are provided below
in our discussion of individual variables.

8
advantages to abandoning the pre-defined units of the census (Lee et al. 2008) or using other
geographical units like census blocks (Hansen and Reich 2015; Parisi et al. 2011:835), we believe
our use of the slightly larger tracts is justified due to data availability and the uncertainty over the
exact listing locations. The spatial lag term, calculated as the sum of the dependent variable in any
neighboring listings (or, where applicable, tracts) within 3 miles divided by the distance between
the two listings is intended to control for any spatial autocorrelation in our model.5
1) Dependent Variables:
Number of Listings: This variable measures the total number of listings in a census tract.
Census tracts with no listings were assigned a value of zero. Since this is a count variable with a
large number of zero values, we used a mixed-effects negative binomial model in our analysis6,
with the census tracts clustered at the MSA level. Exposure was assumed to be uniform across all
census tracts and thus was not modeled, because there is no reliable way to trace Airbnb’s roll-out
in the various MSA’s, and the platform has been available nation-wide for a number of years.
Nightly Price: This is the nightly price of a listing as it was listed at the most recent date the
listing was accessed. Due to deviations from normality, the variable was log transformed. We used
a linear mixed-effects model in our analysis of this variable, with listings clustered at the census-
tract level, and tracts clustered at the metropolitan statistical area level, as well as a crossed
clustering of listings at the host level (due to hosts that had multiple listings).7
‘Reverse’ Rating: On Airbnb, guests provide a numerical rating for listings they have stayed
in, on a scale ranging from 0 to 10 (on the site the average of these ratings is displayed as a 5-star
scale with half stars). While the guests can rate several aspects of a listing like location or check-
in process separately we only focused on the overall rating and captured the average of all ratings
on a scale from 0-100. However, bad ratings on the site are very rare and in our sample more than
31% of all listings with a rating had a perfect rating of 100 and a further 60% had ratings between
85 and 99. In order to analyze the values we reverse-coded the variable so that a listing with a 100
rating would have a value of 0 and higher scores would indicate worse listings. This resulted in a
distribution that closely approximated a negative binomial distribution, even though the variable
was not a count variable. So we used a mixed effects negative-binomial model in our analysis,
with listings clustered at the census-tract level, and tracts clustered at the metropolitan statistical
area level, as well as a crossed clustering of listings at the host level (due to hosts that had multiple
listings).8 Exposure was assumed to be uniform across all listings and thus was not modeled,
5 We have alternately used both smaller and larger distances (1-5 miles) to create spatial lag terms, as well as
specifying a number of closest neighbors rather than restricting them to a pre-set distance. Runs using these terms
provided substantively similar results, with model fits favoring the 3-mile term in models where the spatial lag was
the only variable. 6 We investigated poisson models as well as zero-inflation for both negative binomial and poisson models for this
variable, all of which produced substantively similar results. The reported results were produced with the lme4
package in R (Bates et al. 2014) using Gauss-Hermite Quadrature with 10 integration points. Zero-inflation models
were estimated with the glmmADMB package (Fournier et al. 2012; Skaug et al. 2012). 7 The reported results were produced with the lme4 package in R (Bates et al. 2014). 8 The reported results were produced with the lme4 package in R (Bates et al. 2014). They are substantively similar
to linear models run using the same package, which nonetheless suffered from severe heteroscedasticity issues. The

9
because ratings only become publicly visible on the platform after a certain number of reviews
have been left for a listing.9
2) Independent Variables:
a. Listing Level: The variables below are based on data from the Airbnb platform.
Number of Amenities: For every listing we calculated a variable that indicated the number of
amenities the listing had or provided to guests. The potential amenities (the most widely available
amenities other than the safety equipment) includes A/C, Breakfast, Cable TV subscription,
doorman, dryer, essentials, fireplace, gym, hairdryer, hangers, hot tub, intercom, internet access,
clothes iron, kitchen access, on-site parking, pool, shampoo, TV and washing machine. This is
intended to capture the quality of the listing and is used as a control variable. The variable is
standardized and grand mean centered for ease of interpretation.
Room Type: Airbnb offers three main types of accommodations: “shared rooms” in which the
guest has access to a shared room in the unit, “private rooms” in which the guest has the sole use
of a private room, and “entire home” listings in which the host is not present in the unit for the
duration of the guests’ stay. Since the factors described by these categories are likely to have
significant impact on prices, dummy variables for the first two are included in out models, with
“entire home” listings as the reference category.
Maximum Number of People Accommodated: Airbnb allows hosts to list the maximum
number of people their property can accommodate, ranging from 1 to 16 or more. We use this
number as a control in our models, top-coded to a maximum value of 16, grand mean centered and
standardized.
Instant Booking: Some of the listings on the Airbnb platform allow guests to make finalized
bookings immediately, without requiring the host to confirm a request. We believe this plays an
important role in pricing and bookings and therefore a dummy variable indicating whether the
listing can be booked instantly is included as a control in our models.
Number of Reviews: On Airbnb, guests are encouraged to provide a review of listings they
have stayed in. This variable codes the number of such reviews for a listing that is visible to a
guest (the hosts can see some reviews before they are made public). The number of bookings
reflects both the success of a listing in attracting guests and indicates how trustworthy the listing
is for prospective guests, so it is expected to play an important role in determining price, though
the exact nature of the relationship might be hard to parse with cross sectional data (in-demand
listings can increase their prices, but cheaper listings might get more guests on average).
b. Host-Level: All of the variables below are based on data from the Airbnb platform
results presented here used the Laplace approximation, due to the crossed mixed-effects design of the model. Results
for models that only modeled clustering at the census tract level, using Gauss-Hermite Quadrature with 10
integration points were substantively similar. 9 Our data suggest that the cut-off is 2 reviews, but we do have a small number of listings with more than 2 reviews
that did not have a rating.

10
Length of Membership: For every listing we calculated how many months the user had been
a member of Airbnb. This is clearly not a perfect way to measure the length of time a given listing
has been on the platform, since hosts do manage multiple listings (at the same time and
consecutively). However, it is still the best measure available and we use it as a control variable in
many of our models. The variable is standardized and grand mean centered for ease of
interpretation.
Number of Listings from the Host: Hosts on Airbnb are allowed to list multiple units on the
platform. While the majority of users have only a few listings (in our sample around 85% of listings
were managed by hosts with four or less listings), there is a significant subset that have a large
number of them. While not all of these multiple-listing hosts are individuals (we identified several
property management companies that were listed as hosts) it is still conceivable that the number
of listings a host has on the platform might impact the price they charge. Therefore, it is included
as a control variable.
c. Tract Level: The variables below are from the American Community Survey’s 2014
5-year data release.
Population of the Census Tract: This is the total population of a given census tract. The
variable is standardized and grand mean centered for ease of interpretation. Tracts without
residents are excluded from the analysis, and many of the tracts with low population (usually less
than 100 residents) are dropped due to missing data, see below.
Median Age: The median age of all tract residents. We expect age to play an important role
in participation on Airbnb as previous research indicates that younger people participate on the
platform at much greater rates. However, there are also some reports of a critical mass of older
(female) hosts (Castrodale 2016). Finally, age might also be a factor on the neighborhood-level
with residents of older neighborhoods placing social stigma on the practice of hosting. The variable
is standardized and grand mean centered for ease of interpretation.
Median Housing Cost: The median value of how much of the household income is spent on
housing costs (rent, mortgage payments, etc.). This variable is one of the two housing related
factors that we believe will influence participation on the platform as well as prices, since
households that spend more of their income on housing will have a higher incentive to monetize
their housing and get higher prices. The variable is standardized and grand mean centered for ease
of interpretation.
% Renter: The percentage of households that do not own but rent the unit they are occupying.
This is the second housing variable that we believe will be a key factor in Airbnb participation and
prices. While the legal and practical concerns over Airbnb participation tends to favor home
owners rather than renters, the financial and lifecycle factors that impact homeownership might
incentivize renters to participate on the platform more heavily. On the other hand, several reports
have documented the practice of “illegal” rentals (Cox and Slee 2016; Streitfeld 2014) where a
landlord makes housing units exclusively available for short term rentals and lists multiple units
11
on the platform at the same time. This practice is also more likely to drive up participation in areas
with a higher proportion of rentals. The variable is standardized and grand mean centered for ease
of interpretation.
Per Capita Income: This is the per capita income for all residents within a census tract. We
expect income to play an important but complex role in our models, since having access to real
estate assets to monetize on Airbnb is a requirement to participate and make money, but the amount
of additional income to be made can be relatively small in areas with high incomes. This is why
we investigate a quadratic relationship between income and our dependent variables. The variable
is standardized and grand mean centered for ease of interpretation.
Gini Coefficient: In order to measure the income distribution within a census tract we are
using the Gini coefficient. We believe that areas with higher income inequality are more likely to
participate on the platform, because these tend to be the “gentrifying” neighborhoods that tend to
attract Airbnb activity (BJH Advisors LLC 2016). The variable is standardized and grand mean
centered for ease of interpretation.
% with BA or Higher: This is the percentage of the total population 25 and over, that has the
equivalent of a BA degree or higher educational credentials. We expect tracts that have a higher
percentage of residents with post-secondary education to participate on the platform at higher rates,
in line with the survey findings on the platform demographics, while the relationship between
education and prices is harder to predict. On the one hand, these areas could be charging higher
prices, because they are more desirable on the platform due to homophily behavior (Ikkala and
Lampinen 2015). On the other hand, the highly educated participants of the sharing economy often
highlight non-monetary motivations for their participation and therefore might not display profit-
maximizing behavior on the platform. The variable is standardized and grand mean centered for
ease of interpretation.
% non-White: This variable is the percentage of the total population in a tract that did not
identify as White, non-Hispanic (including those that identified as more than one race, even if one
of the races was White). We have investigated other measures of race, including a diversity index
as well as the percentages of specific racial and ethnic groups (Black and Hispanic) with broadly
similar results. The % non-White was ultimately selected due to the unequal geographical
distribution of racial and ethnic minority groups, so that we could show overarching trends
associated with the racial composition of a census tract. The variable is standardized and grand
mean centered for ease of interpretation.
d. MSA Level:
Total Population of MSA: This is the total population for the MSA that a given listing or tract
is in. The variable is standardized and grand mean centered for ease of interpretation.
Region: The US Census Bureau divides the United States into 4 geographic regions: Northeast,
South, Midwest and West. Instead of creating another level of clustering in our models, we opted
to use dummy variables, with the Midwest as the reference category. MSAs that were on the border
12
between two or more regions were assigned to the one in which the majority of their census tracts
lay.
We chose to handle missing data (from the US Census data) with listwise deletion to keep our
models simpler. Since the number of cases for which there was any missing data is at most around
1% of all valid cases, we believe that listwise deletion does not impact our results in any
substantive manner.
Limitations:
The nature of the data we are using places a number of significant limitations on our analysis.
First of all, despite being as thorough as possible, we cannot be sure that we captured all of the
listings within the geographies we are interested in. Despite comparable results to other Airbnb
scraping efforts, we simply have no way of establishing our coverage rate, short of obtaining data
from Airbnb. Therefore, our results could be biased in unforeseeable ways and we are open to
reconsidering our findings if and when better data becomes available. However we still believe
that this is the best independent way to study Airbnb listings and that careful data scraping efforts
can potentially be the answer to the dearth of large-scale data in the studies of the sharing economy.
The second limitation of our data is that it is cross-sectional. Despite searching for listings in
the same location on four different occasions, the time differences between the searches we
conducted were not meaningful, and we chose to aggregate results from the four searches. This
means that we are not able to control for time and time-variant changes in the Airbnb platform in
our analysis, including the churn of users and hosts and the success of listings in attracting guests.
While causal relationships can be inferred between the census data and platform outcomes, these
are not as strong as what could be established with time-series data.
The third and most important limitation of our data is that hosts self-select into participating in
Airbnb and since we study the listings that are already on the platform, without access to
individual-level data, we have no way of identifying trends at this level that might be influencing
the patterns of participation and pricing that we study. Especially with racial discrimination, we
know from the existing literature that individual-level factors play a critical role, however there is
no easy way to obtain such data without cooperation from Airbnb and more intrusive data
collection methods about the hosts. In the absence of such cooperation and without the large
resource commitment, studying neighborhood-level patterns is an efficient way to study patterns
of discrimination. Additionally, it allows us to capture broader trends that a singular focus on
individual-level discrimination would not be able to capture.
Findings:
a. Number of Listings
(Table 1 about here)
The results of our analysis on the number of listings can be found in Table 1 above. The
racial composition of the census tract, measured as the percentage of the population that identified
as non-White in all six models, is a significant predictor of the number of Airbnb listings in a

13
census tract. The goodness-of-fit measures indicate that Model 1, where the racial composition of
the census tract is the only predictor of interest in the model, might be the best fit for the data.
However in our analysis, the goodness-of-fit values fluctuated between the various models for
various different estimation techniques, therefore it is hard to conclude which model is the actual
best fit. Ultimately we opted to present the set of models with the lowest AIC and BIC values.
In Model 1, when the percentage of non-White residents is the only predictor of interest
in the model, higher concentration of non-White residents in a census tract is associated with lower
number of listings. A very similar relationship between the two variables is also present in Models
2 and 3, when we introduce age and housing variables into the model. In Model 4, with the addition
of the income inequality and the linear per capita income variable, race ceases to be a significant
predictor of the number of listings. Finally, in Models 5 and 6, as we add the quadratic income and
education variables to the model, the relationship between race and number of listings changes
directions –with census tracts that have higher concentrations of non-White groups having more
listings. The relationship between the race variable and the predicted incidence rates of listings in
a tract for all six models can be found in Figure 1 below.
(Figure 1 about here)
This change in the relationship between the racial makeup of the census tract and the
number of listings on Airbnb across these models indicates that the effect of race on Airbnb
participation is being mediated through the income, housing, education and age variables. In other
words, the racially unequal participation rates identified in the first model plays itself out through
racial inequalities in these factors themselves. However, the latter two models also identify a
positive relationship between the percentage of non-White residents in a tract and the number of
listings, we discuss possible explanations for this association in the discussion section below.
Looking at the other predictors, we find that income has a significant quadratic
relationship with the number of Airbnb listings in a census tract in models 5 and 6. In model 5 this
indicates that that participation on the platform rises with per capita neighborhood income, for per
capita incomes lower than 88,000$, while the opposite is true for incomes that are higher. In model
6, the linear component is not significant, suggesting that higher income neighborhoods simply
participate on the platform at lower rates. As mentioned above, it is hard to disqualify either result
due to model fit and, in fact in our analysis the models with the linear term tended to fit the data
better more often than the more complex quadratic models. This leads us to believe that if any
quadratic relationship exists between participation and per capita income, it is more likely to
resemble the one in model 5 than the one in model 6. We also see that tracts with a higher
percentage of renters, higher income inequality and higher median age tend to have more listings
in most of the models. High housing costs, on the other hand, is associated with a significant
positive impact on the number of listings in only half of the models it is included in. Perhaps the
most important finding to note here is that the education variable is the strongest predictor in Model
6 (ignoring the variables for geographic regions), with census tracts with a higher proportion of
college grads participating in the platform at much greater rates. A standard deviation increase in
the education variable is associated with a 122% increase in the number of listings in Model 6.

14
b. Nightly Price:
(Table 2 about here)
The results of our analysis of the nightly price of listings can be found in Table 2 above.
All six models presented show that in neighborhoods with higher concentrations of non-White
residents, listings charge significantly lower nightly prices, with the final model including all of
the predictors of interest providing the best fit for the data. As more variables are introduced the
size of the effect that the race variable has on nightly prices shrinks, but remains significant.
The change in effect size indicates that the impact of the race variable on nightly prices is
also mediated through the housing, income, education and age variables. However, the fact that
the relationship consistently remains negative also indicates that independent of all these factors,
areas with higher concentrations of non-White residents are at a disadvantage in terms of the prices
they can charge on the platform. In Figure 2 below, we can see the marginal effects of the race
variable on nightly price for all six models. The predicted price differential between an all-White
and an all non-White neighborhood ranges from around 43$ less per night in model 1 to about 13$
less per night in Model 6.
(Figure 2 about here)
There is a significant quadratic relationship between income and nightly prices, at income
levels lower than around 148,000$ per capita, nightly prices tend to increase with income. At
higher income levels the prices tend to decrease. However, we have relatively few observations in
census tracts above that income level (about 0.2% of the sample clustered in only two dozen tracts)
and therefore we believe that a simpler linear relationship, while a slightly worse fit for our data,
might not be too inaccurate. In model 6, we see that listings in tracts with a higher percentage of
renters, higher housing costs, higher income inequality and higher median age tend to tend to
charge higher nightly prices. The education variable, on the other hand, has a negative relationship
with nightly prices. Listings in tracts that have a higher concentration of college graduates tend to
charge lower prices.
c. Ratings:
(Table 3 about here)
Our analysis of the ratings of listings can be found in Table 3 above. All six models
presented show that in census tracts with a greater proportion of people of color, the ratings for
listings are significantly worse (the dependent variable is reverse coded, so an increase in it
indicates lower ratings). The final model, with the full set of predictors is the best fit for the data.
While the effect size of one standard deviation change in the proportion of non-White residents
decreases as more predictors are introduced into the model, the direction of the effect remains
stable indicating a potential mediation relationship suggested in the model for nightly price, above.
In Figure 3, below, we can see the marginal effects of the race variable on the ratings for all six

15
models. The predicted difference in ratings between an all-White neighborhood and an all non-
White neighborhood, ranges from 2.5 points out of 100, to 1.5.
(Figure 3 about here)
In Model 6, we see that listings in tracts that have higher income inequality and have more
renters tend to have worse ratings. The significant quadratic relationship between per capita
income and ratings suggests that, ratings for listings get better with rising per capita income
levels until about 75,630$ per capita, and then begin worsen.
Discussion:
Our findings demonstrate that participation, pricing and ratings on Airbnb show clear
evidence of racial bias against areas with high concentrations of minority populations. For nightly
prices and ratings of listings, the bias is rather straightforward to unpack. Even when controlling
for a host of factors that are themselves racially unequal, like housing and income, listings in areas
with a higher proportion of non-White residents charge significantly lower prices and receive
worse ratings. This can be a function of lower demand for lodgings in these areas, either through
outright bias or some combination of factors not in our models, such as access to transportation or
distance to points of interest for travelers, which would also influence the ratings. The various
pricing tools for hosts provided by Airbnb and other companies, which take into account local
demand and competitor pricing, would provide exceptionally strong market feedback mechanisms
for making nightly prices highly responsive to such changes in demand.
Studying the number of listings on the platform, however, provides us with a more complex
picture of the relationship between race and Airbnb participation. First and foremost, it shows that
racial inequalities in income, education and housing depress participation in neighborhoods that
have a higher percentage of non-White population. However, controlling for them, we see that
people living in these areas tend to participate on the platform more. There are a number of
potential explanations for this. First of all, there could be higher demand from guests to stay in
these areas, in line with Airbnb’s claims about guest preferences, explained perhaps by the desire
to consume “the other” on the part of the mostly white and well-educated clientele. Yet, in light of
the findings regarding nightly prices and ratings, as well as the previous literature on
discrimination and the studies on discriminatory practices in the sharing economy, the existence
of a high enough demand to drive up participation in non-White areas appears doubtful. It is much
more likely that the higher participation is driven by the hosts, for whom the Airbnb platform is
more accessible than traditional markets and offers higher potential earnings relative to their
prospects in traditional markets. Another potential explanation is that an unobserved factor like
gentrification might be playing an important role in Airbnb participation in these areas, with a
subset of gentrifying neighborhoods driving up participation rates for the whole group. This
scenario is further supported by the strong positive relationship between income inequality and the
number of listings.
Moving beyond the findings directly related to the racial composition, we believe that our
findings point towards two broad trends. The first is that on average, areas that are already
privileged, above all with a higher concentration of white residents, but also with higher incomes,

16
higher proportion of college graduates, or older residents, seem to be taking advantage of the
opportunities presented by Airbnb at greater rates. They also tend to charge higher prices for their
services and have better ratings.10 This is not an unexpected trend, since these areas have the
resources to participate and do so successfully in the sharing economy. Nonetheless, it critically
undermines the arguments that the sharing economy is going to lead to egalitarian outcomes, and
result in a democratizing of opportunity. There are some institutional reasons why the sharing
economy in general, and Airbnb in particular, may be less discriminatory than traditional markets,
like the lower barriers to entry we have discussed above. Yet they still operate in a society that is
the product of significant structural inequalities, which they can’t help but reproduce.
Nonetheless, it is hard to claim outright that the institutional novelties of the sharing
economy do not matter which brings us to the second trend we observe in the findings. Some of
our models suggest that areas with higher percentages of non-White populations might actually
participate more on Airbnb, once you control for factors that depress participation. We also find
that census tracts with high income inequality both participate at greater rates and command higher
prices. On their own, these findings might support the conclusion that individuals in these areas,
who find themselves at a disadvantage in the traditional market might be using Airbnb successfully
to generate income. This would mean that the Airbnb is having an ameliorative effect on overall
inequality by empowering these individuals in a meaningful way. However, the same set of results
could also be the result of relatively privileged individuals in these areas using the sharing
economy to further grow the gap between them and their less well-off neighbors. Our methods do
not allow us to answer which of the two dynamics is at play, but we believe this question of how
the sharing economy changes existing inequalities even as it reproduces them should be at the
heart of the debate going forward.
Conclusion:
Despite optimistic assessments of the egalitarian potential of the sharing economy, and
institutional qualities of Airbnb that appear to support them, we show that existing inequalities,
and specifically race, and its impact on employment, housing and use of digital resources, play a
key role in determining participation and outcomes on the platform.
Airbnb presents potential hosts with lower barriers to entry than traditional markets, and
has a clear public stance against discrimination. However, utilizing a unique dataset of all Airbnb
listings in major metropolitan areas of the US, we show that these factors are not enough to ensure
racial equality on the platform. Using the platform-specific data in conjunction with geospatial
information on residents we demonstrate that census tracts with a higher proportion of non-White
residents participate on the platform at lower rates, and listings in them charge lower prices. Some
of this relationship may be attributed to structural inequalities in things like housing and income,
and it’s not hard to imagine other inequalities we do not account for in our models play a role in
creating the observed patterns of inequality. However, given the growing literature on individual-
level racial discrimination in the sharing economy, it seems likely that our findings also capture
10 The education variable, in a model without tract level co-variates other than population, has a strong positive
association with nightly prices. The negative relationship found in model 6 in Table 2 might reflect the aversion to
profit-maximizing behavior among the more educated participants of the sharing economy we noted above.

17
inequalities fostered by racial attitudes that depress participation in minority areas and reduce the
demand for staying there. In short, the broader patterns of inequality, in areas like employment,
housing and digital resources, are reproduced within the sharing economy.
Our findings come with a number of limitations due to the nature of our data. First of all,
it is impossible to validate our coverage of the intended population (all Airbnb listings in the areas
we studied). While our data is similar to other public datasets collected with a similar methodology,
our findings remain subject to change if we have systematically failed to capture some listings.
Second of all, because we treat our data as cross-sectional, we might be missing key time-variant
factors that would have challenged our findings (like user churn, or success on the platform).
Finally, our data does not include variables at the individual level that are key to both
understanding how these discriminatory patterns operate and what they can tell us about how
Airbnb, and the sharing economy, impact inequality.
We believe that all of these limitations are also starting points for further studies of
inequality in the sharing economy. Efforts to improve data quality would certainly be welcome to
us, as would greater independent access to data provided by the companies themselves. Longer
term data collection, which would be able to capture time-variant qualities of the sharing economy
are likely to provide us with key insights into how inequality operates. Yet perhaps the biggest
promise is held by understanding the individual-level dynamics at play in the context of the
structural inequalities. Specifically, a focus on other outcome measures like booking rates or
ratings, or the role Airbnb might be playing in urban gentrification, sorely needs this individual
level understanding. While these questions would lend themselves to qualitative research designs,
some larger scale individual-level data can be captured with more extensive scraping efforts as
well.

18
REFERENCES:
Airbnb. 2015a. Airbnb Summer Travel Report 2015. Retrieved November 2, 2016
(http://blog.airbnb.com/wp-content/uploads/2015/09/Airbnb-Summer-Travel-Report-1.pdf).
Airbnb. 2015b. “The Economic Impacts of Home Sharing in Cities around the World.” Airbnb.
Retrieved November 2, 2016 (https://www.airbnb.com/economic-impact).
Bates, Douglas, Martin Mächler, Ben Bolker, and Steve Walker. 2014. “Fitting Linear Mixed-
Effects Models Using lme4.” Submitted to Journal of Statistical Software 67(1):51.
BJH Advisors LLC. 2016. Short Changing New York City: The Impact of Airbnb on New York
City’s Housing Market. Retrieved November 2, 2016 (http://www.mfy.org/wp-
content/uploads/Shortchanging-NYC.pdf).
Boyd, Danah. 2012. “White Flight in Networked Publics? How Race and Class Shaped
American Teen Engagement with Myspace and Facebook.” Pp. 203–22 in Race after the
Internet. z, edited by L. Nakamura and P. Chow-White. New York, NY: Routledge.
Braddock, Henry Jomills, Robert L. Crain, James M. McPartland, and Russell L. Dawkins. 1986.
“Applicant Race and Job Placement Decisions: A National Survey Experiment.”
International Journal of Sociology and Social Policy 6(1):3–24.
Castrodale, Jelisa. 2016. “Why an Older Woman May Be Your next Airbnb Host.” USA Today,
March 31. Retrieved November 2, 2016
(http://www.usatoday.com/story/travel/roadwarriorvoices/2016/03/31/airbnb-hosts-women-
seniors/82462120/).
Compaine, Benjamin M. 2001. The Digital Divide: Facing a Crisis or Creating a Myth? Mit
Press.
Costen, Wanda M., Alison G. Cliath, and Robert H. Woods. 2002. “Where Are the Racial and
Ethnic Minorities in Hotel Management? Exploring the Relationship Between Race and
Position in Hotels.” Journal of Human Resources in Hospitality & Tourism 1(2):57.
Cox, Murray and Tom Slee. 2016. How Airbnb’s Data Hid the Facts in New York City.
Retrieved December 2, 2016 (http://insideairbnb.com/reports/how-airbnbs-data-hid-the-
facts-in-new-york-city.pdf).
Dannen, Chris. 2012. “My Airbnb Biz Got Me Evicted, Here’s What I Learned.” Fast Company.
Retrieved November 23, 2016 (https://www.fastcompany.com/1840715/my-airbnb-biz-got-
me-evicted-heres-what-i-learned).
DiMaggio, Paul, Eszter Hargittai, W.Russell Neuman, and John P. Robinson. 2001. “Social
Implications of the Internet.” Annual Review of Sociology 27(1):307–36.
Edelman, Benjamin and Michael Luca. 2014. “Digital Discrimination: The Case of Airbnb.com.”
Harvard Business School 21. Retrieved December 2, 2016 (http://www.west-
info.eu/files/airbnb_research.pdf).
Edelman, BG, Michael Luca, and Svirsky Dan. 2015. “Racial Discrimination in the Sharing
Economy: Evidence from a Field Experiment.” HBS Working Paper 1–34.

19
Fournier, David a. et al. 2012. “AD Model Builder: Using Automatic Differentiation for
Statistical Inference of Highly Parameterized Complex Nonlinear Models.” Optimization
Methods and Software 27(2):233–49.
Fraiberger, Samuel P. and Arun Sundararajan. 2015. “Peer-to-Peer Rental Markets in the Sharing
Economy.” NYU Stern School of Business Research Paper 1–44.
Frey, William H. 1979. “Central City White Flight : Racial and Nonracial Causes.” American
Sociological Review 44(3):425–48.
Ge, Yanbo, Christopher R. Knittel, Don MacKenzie, and Stephen Zoepf. 2016. "Racial and
Gender Discrimination in Transportation Network Companies." NBER Working Paper No.
22776.
Gelman, Andrew. 2016. “How Do We Research the ‘sharing’ Economy — When the Data Can’t
Be Validated ?” Washington Post, June 6. Retrieved December 2, 2016
(https://www.washingtonpost.com/news/monkey-cage/wp/2016/06/06/how-do-we-research-
the-sharing-economy-when-the-data-cant-be-validated)
Glusac, Elaine. 2016. “As Airbnb Grows, So Do Claims of Discrimination - The New York
Times.” New York Times, June 21. Retrieved December 2, 2016
(http://www.nytimes.com/2016/06/26/travel/airbnb-discrimination-lawsuit.html).
Hansen, John D. and Justin Reich. 2015. “Democratizing Education? Examining Access and
Usage Patterns in Massive Open Online Courses.” Science 350(6265):1245–48.
Hargittai, Eszter. 2012. “Open Doors, Closed Spaces? Differentiated Adoption of Social
Network Sites by User Background.” Pp. 223–45 in Race after the Internet. New York:
Routledge, edited by L. Nakamura and P. Chow-White. New York, NY: Routledge.
Hirsch, Arnold R. 2009. Making the Second Ghetto: Race and Housing in Chicago 1940-1960.
University of Chicago Press.
Husain, Hamel. 2016. “Python Function To Scrape Airbnb.” GitHub. Retrieved December 2,
2016 (https://github.com/hamelsmu/AirbnbScrape).
Iceland, J. and K. a. Nelson. 2008. “Hispanic Segregation in Metropolitan America: Exploring
the Multiple Forms of Spatial Assimilation.” American Sociological Review 73(5):741–65.
Ikkala, Tapio and Airi Lampinen. 2015. “Monetizing Network Hospitality: Hospitality and
Sociability in the Context of Airbnb.” Proceedings of the 18th ACM Conference
Companion on Computer Supported Cooperative Work & Social Computing - CSCW’15
Companion 1033-1044.
Inside Airbnb. 2016. “Get the Data.” Inside Airbnb. Retrieved January 1, 2016
(http://insideairbnb.com/get-the-data.html).
Jencks, Christopher and Susan E. Mayer. 1990. “The Social Consequences of Growing up in a
Poor Neighborhood.” P. 186 in Inner-city poverty in the United States, vol. 111, edited by
L. Lynn and M. McGreary. Washington, D.C.: National Academies Press.
JPMorgan Chase and Company Institute. 2016. Paychecks , Paydays , and the Online Platform
20
Economy: Big Data on Income Volatility.
Kokalitcheva, Kia. 2016. “Airbnb Debuts Program for Building Owners to Partake in Home-
Sharing.” Fortune. Retrieved November 23, 2016 (http://fortune.com/2016/09/13/airbnb-
building-owners-program/).
Krivo, Lauren J. and Ruth D. Peterson. 2000. “The Structural Context of Homicide: Accounting
for Racial Differences in Process.” American Sociological Review 65(4):547.
Lee, Barret A. et al. 2008. “Beyond the Census Tract: Patterns and Determinants of Racial
Segregation at Multiple Geographic Scales.” American Sociological Review 73(5):766–91..
Lee, Donghun et al. 2015. “An Analysis of Social Features Associated with Room Sales of
Airbnb.” Proceedings of the 18th ACM Conference Companion on Computer Supported
Cooperative Work & Social Computing - CSCW’15 Companion 219–22.
Lee, R. et al. 2009. “Progress in Human Geography?” Progress in Human Geography 33(1):3–6.
Lichter, Daniel T., Domenico Parisi, and Michael C. Taquino. 2012. “The Geography of
Exclusion: Race, Segregation, and Concentrated Poverty.” Social Problems 59(3):364–88.
Lichter, Daniel T., Domenico Parisi, and Michael C. Taquino. 2015. “Toward a New Macro-
Segregation? Decomposing Segregation within and between Metropolitan Cities and
Suburbs.” American Sociological Review 80(4):843–73.
Logan, John R. and Brian Stults. 2011. The Persistence of Segregation in the Metropolis: New
Findings from the 2010 Census.
Massey, Douglas S. and Nancy A. Denton. 1993. American Apartheid: Segregation and the
Making of the Underclass. Harvard University Press.
Nakamura, Lisa and Peter Chow-White. 2011. “Introduction–race and Digital Technology: Code,
the Color Line, and the Information Society.” n Race after the Internet. New York:
Routledge, edited by L. Nakamura and P. Chow-White. New York, NY: Routledge.
O’Brien, Sara Ashley. 2016. “Airbnb’s Valuation Soars to $30 Billion.” CNN, August 8.
Retrieved December 2, 2016 (http://money.cnn.com/2016/08/08/technology/airbnb-30-
billion-valuation/).
Oliver, Melvin L. and Thomas M. Shapiro. 1995. “Black Wealth/White Wealth.” Chicago, IL:
University of Chicago Press
Pager, Devah. 2003. “The Mark of a Criminal Record.” American Journal of Sociology
108(5):937–75.
Pager, Devah, Bruce Western, and Bart Bonikowski. 2009. “Discrimination in a Low-Wage
Labor Market: A Field Experiment.” American Sociological Review 74(5):777–99.
Parisi, Domenico, Daniel T. Lichter, and Michael C. Taquino. 2011. “Multi-Scale Residential
Segregation: Black Exceptionalism and America’s Changing Color Line.” Social Forces
89(3):829–52.
Patten, Eileen. 2016. “Racial, Gender Wage Gaps Persist in U.S. despite Some Progress.” Pew

21
Research Center 1–9.
Pew Research Center. 2013. 51 % of U.S. Adults Bank Online.
Pew Research Center. 2016. Shared, Collaborative and On Demand: The New Digital Economy.
Quillian, Lincoln. 2012. “Segregation and Poverty Concentration: The Role of Three
Segregations.” American Sociological Review 77(3):354–79.
Royster, Deirdre A.(Deirdre Alexia). 2003. Race and the Invisible Hand : How White Networks
Exclude Black Men from Blue-Collar Jobs. University of California Press.
Rugh, J. S., L. Albright, and D. S. Massey. 2015. “Race, Space, and Cumulative Disadvantage:
A Case Study of the Subprime Lending Collapse.” Social Problems 62:186–218.
Rugh, Jacob S. and Douglas S. Massey. 2010. “Racial Segregation and the American Foreclosure
Crisis.” American Sociological Review 75(5):629–51.
Sampson, Robert J. 2008. “Moving to Inequality: Neighborhood Effects and Experiments Meet
Social Structure.” American Journal of Sociology 114(1):189–231.
Schor, Juliet B. and Connor Fitzmaurice. 2015. “Collaborating and Connecting: The Emergence
of the Sharing economy(Chapter 26).” Pp. 410–25 in Handbook of Research on Sustainable
Consumption, edited by L. A. Reisch and J. Thorgensen. Northampton, MA: Edward Elgar
Publishing.
Skaug, H., D. Fournier, A. Nielsen, A. Magnusson, and B. Bolker. 2012. “Generalized Linear
Mixed Models Using AD Model Builder.” R Package Version 0.7 2.
Slee, Tom. 2016. “Airbnb Data Collection: Methodology and Accuracy.” Retrieved December 2,
2016 (http://tomslee.net/airbnb-data-collection-methodology-and-accuracy).
Sorkin, Andrew Ross. 2016. “Why Uber Keeps Raising Billions.” The New York Times, June 20.
Retrieved December 2, 2016 (http://www.nytimes.com/2016/06/21/business/dealbook/why-
uber-keeps-raising-billions.html?_r=0).
Sperling, Gene. 2015. How Airbnb Combats Middle Class Income Stagnation. Retrieved
December 2, 2016 (http://publicpolicy.airbnb.com/new-report-impact-airbnb-middle-class-
income-stagnation/).
Squires, Gregory D. 1992. “Community Reinvestment: An Emerging Social Movement.” Pp. 1–
37 in Redlining To Reinvestment, edited by G. D. Squires. Philadelphia, PA: Temple
University Press.
Streitfeld, David. 2014. “Airbnb Listings Mostly Illegal, New York State Contends.” New York
Times, October 15. Retrieved December 2, 2016
(http://www.nytimes.com/2014/10/16/business/airbnb-listings-mostly-illegal-state-
contends.html?_r=0).
Sundararajan, Arun. 2016. The Sharing Economy: The End of Employment and the Rise of
Crowd-Based Capitalism. MIT Press.
Thebault-Spieker, Jacob, Loren G. Terveen, and Brent Hecht. 2015. “Avoiding the South Side

22
and the Suburbs: The Geography of Mobile Crowdsourcing Markets.” Pp. 265–75 in
Proceedings of the 18th ACM Conference on Computer Supported Cooperative Work &
Social Computing.
Vedantam, Shankar, Maggie Penman, and Max Nesterak. 2016. “#AirbnbWhileBlack: How
Hidden Bias Shapes The Sharing Economy : NPR.” NPR, April 26. Retrieved December 2,
2016 (http://www.npr.org/2016/04/26/475623339/-airbnbwhileblack-how-hidden-bias-
shapes-the-sharing-economy).
Wilson, Ernest J. and Sasha Costanza-Chock. 2012. “New Voices on the Net? The Digital
Journalism Divide and the Costs of Network Exclusion.” in Race after the Internet, edited
by L. Nakamura and P. Chow-White. New York, NY: Routledge.
Wilson, Valerie and William M. Rodgers. 2016. Black-White Wage Gaps Expand with Rising
Wage Inequality. Washington, D.C.
Wilson, William Julius. 2012. The Truly Disadvantaged: The Inner City, the Underclass, and
Public Policy. University of Chicago Press.
Zervas, Georgios, Davide Proserpio, and John W. Byers. 2015a. A First Look at Online
Reputation on Airbnb, Where Every Stay Is Above Average. Retrieved December 2, 2016
(http://papers.ssrn.com/sol3/papers.cfm?abstract_id=2554500).
Zervas, Georgios, Davide Proserpio, and John W. Byers. 2015b. “The Impact of the Sharing
Economy on the Hotel Industry.” Proceedings of the Sixteenth ACM Conference on
Economics and Computation - EC ’15 637–637.W
Zillien, Nicole and Eszter Hargittai. 2009. “Digital Distinction: Status-Specific Types of Internet
Usage.” Social Science Quarterly 90(2):274–91.

23
Table 1: Number of Airbnb Listings in Census Tract
VARIABLES Model 1 Model 2 Model 3 Model 4 Model 5 Model 6
MSA-level
MSA Population 1.043 1.027 0.833* 0.882 0.871 0.964
(0.097) (0.095) (0.091) (0.108) (0.116) (0.121)
Northeast (Ref=Midwest) 1.228 1.211 1.040 1.176 1.230 1.376
(0.178) (0.175) (0.164) (0.185) (0.194) (0.198)
South (Ref=Midwest) 2.047*** 2.007*** 1.839*** 1.809*** 1.782*** 1.806***
(0.151) (0.149) (0.139) (0.155) (0.162) (0.164)
West (Ref=Midwest) 2.874*** 2.821*** 2.072*** 2.364*** 2.329*** 2.728***
(0.169) (0.165) (0.157) (0.177) (0.185) (0.190)
Tract-level
% Residents, Nonwhite 0.818*** 0.838*** 0.823*** 0.983 1.091* 1.163***
(0.037) (0.042) (0.040) (0.046) (0.045) (0.044)
Tract Population 1.067* 1.077* 1.145*** 1.185*** 1.173*** 1.184***
(0.032) (0.032) (0.032) (0.031) (0.030) (0.029)
Median Age 1.048 1.364*** 1.127** 1.057 1.221***
(0.037) (0.038) (0.042) (0.040) (0.042)
% Occupied Households, Renter 2.177*** 1.727*** 1.710*** 1.557***
(0.046) (0.050) (0.047) (0.047)
Median Monthly Housing Expense 1.674*** 1.188* 1.094 0.961
(0.048) (0.068) (0.064) (0.062)
Gini Coefficient 1.234*** 1.243*** 1.222***
(0.036) (0.034) (0.033)
Per capita Income 1.602*** 2.234*** 0.990
(0.071) (0.074) (0.098)
Income, Quadratic 0.890*** 0.967**
(0.008) (0.011)
% Residents with BA, 25+ 2.216***
(0.064)
Spatial Decay+ 2.670*** 2.710*** 2.022*** 1.819*** 1.793*** 1.637***
(0.060) (0.061) (0.053) (0.050) (0.048) (0.044)
Constant 1.672*** 1.697*** 1.712*** 1.528** 1.644*** 1.338
(0.132) (0.129) (0.122) (0.140) (0.148) (0.153)
Observations 47,099 47,099 47,099 47,099 47,099 47,099
Number of MSAs 104 104 104 104 104 104
Log Likelihood -2,508.30 -2,509.14 -2,699.57 -2,770.61 -2,915.66 -3,033.67
AIC 5,036.60 5,040.28 5,425.14 5,571.22 5,863.32 6,101.35
BIC 5,124.20 5,136.64 5,539.02 5,702.62 6,003.48 6,250.27
Standard errors in parentheses, *** p<0.01, ** p<0.05, * p<0.1

24
Table 2: Nightly Prices
VARIABLES Model 1 Model 2 Model 3 Model 4 Model 5 Model 6
MSA-level
MSA Population 0.048 0.044 0.014 0.017 0.016 0.015
(0.025) (0.025) (0.024) (0.024) (0.024) (0.024)
Northeast (Ref=Midwest) 0.137*** 0.137*** 0.131*** 0.146*** 0.147*** 0.146***
(0.026) (0.026) (0.025) (0.025) (0.025) (0.025)
South (Ref=Midwest) 0.043* 0.042* 0.043* 0.051** 0.052** 0.051**
(0.019) (0.019) (0.019) (0.019) (0.019) (0.019)
West (Ref=Midwest) 0.048 0.046 0.024 0.040 0.041 0.038
(0.031) (0.031) (0.029) (0.030) (0.030) (0.030)
Tract-level
% Residents, Nonwhite -0.043*** -0.036*** -0.021*** -0.013*** -0.011*** -0.013***
(0.001) (0.001) (0.001) (0.001) (0.001) (0.001)
Tract Population -0.006*** -0.004*** -0.007*** -0.005*** -0.004*** -0.005***
(0.001) (0.001) (0.001) (0.001) (0.001) (0.001)
# of Listings in Tract 0.001*** 0.001*** 0.001*** 0.001*** 0.001*** 0.001***
(0.0001) (0.0001) (0.0001) (0.0001) (0.0001) (0.0001)
Median Age 0.016*** 0.021*** 0.010*** 0.009*** 0.008***
(0.001) (0.001) (0.001) (0.001) (0.001)
% Occupied Households, Renter 0.016*** 0.003* 0.003* 0.005**
(0.001) (0.001) (0.001) (0.001)
Median Monthly Housing
Expense 0.044*** 0.027*** 0.026*** 0.028***
(0.001) (0.002) (0.002) (0.002)
Gini Coefficient 0.017*** 0.017*** 0.018***
(0.001) (0.001) (0.001)
Per capita Income 0.025*** 0.031*** 0.040***
(0.002) (0.002) (0.003)
Income, Quadratic -0.003*** -0.004***
(0.001) (0.001)
% Residents with BA, 25+ -0.010***
(0.002)
Listing-level
Private Room -0.199*** -0.199*** -0.199*** -0.198*** -0.198*** -0.198***
(0.001) (0.001) (0.001) (0.001) (0.001) (0.001)
Shared Room -0.357*** -0.356*** -0.356*** -0.356*** -0.356*** -0.356***
(0.003) (0.003) (0.003) (0.003) (0.003) (0.003)
# of Amenities -0.0001 -0.0001 -0.0005 -0.0005 -0.001 -0.001
(0.001) (0.001) (0.001) (0.001) (0.001) (0.001)
# of Guests Accommodated 0.152*** 0.152*** 0.151*** 0.152*** 0.152*** 0.152***
(0.001) (0.001) (0.001) (0.001) (0.001) (0.001)
Book Instantly -0.029*** -0.029*** -0.029*** -0.029*** -0.029*** -0.029***

25
(0.001) (0.001) (0.001) (0.001) (0.001) (0.001)
# of Reviews -0.024*** -0.024*** -0.024*** -0.024*** -0.024*** -0.024***
(0.001) (0.001) (0.001) (0.001) (0.001) (0.001)
Host-Level
# of Listings per host -0.002*** -0.002*** -0.002*** -0.002*** -0.002*** -0.002***
(0.0002) (0.0002) (0.0002) (0.0002) (0.0002) (0.0002)
Length of Membership 0.003*** 0.003*** 0.003*** 0.003*** 0.003*** 0.003***
(0.001) (0.001) (0.001) (0.001) (0.001) (0.001)
Spatial Decay+ 0.022*** 0.026*** 0.023*** 0.014*** 0.015*** 0.015***
(0.002) (0.002) (0.002) (0.002) (0.002) (0.002)
Constant 2.067*** 2.069*** 2.086*** 2.078*** 2.081*** 2.084***
(0.027) (0.027) (0.026) (0.026) (0.026) (0.026)
Observations 221,050 221,050 221,050 221,050 221,050 221,050
Number of Unique Hosts 158,560 158,560 158,560 158,560 158,560 158,560
Variance at Host Level 0.036 0.036 0.036 0.036 0.036 0.036
Number of Census Tracts 27505 27505 27505 27505 27505 27505
Variance at Tract Level 0.008 0.007 0.007 0.006 0.006 0.006
Number of MSAs 104 104 104 104 104 104
Variance at MSA Level 0.012 0.012 0.011 0.011 0.011 0.011
Residual Variance 0.018 0.018 0.018 0.018 0.018 0.018
Log Likelihood 25,548.51 25,654.37 26,171.19 26,486.85 26,489.88 26,498.11
AIC
-
51,055.03
-
51,264.74
-
52,294.38
-
52,921.70
-
52,925.76
-
52,940.22
BIC
-
50,838.60
-
51,038.00
-
52,047.03
-
52,653.74
-
52,647.49
-
52,651.65
Standard errors in parentheses, *** p<0.01, ** p<0.05, * p<0.1

26
Table 3: Ratings
VARIABLES Model 1 Model 2 Model 3 Model 4 Model 5 Model 6
MSA-level
MSA Population 1.057 1.060 1.063 1.065* 1.078* 1.078*
(0.030) (0.032) (0.031) (0.031) (0.031) (0.031)
Northeast (Ref=Midwest) 1.159** 1.166** 1.166** 1.165** 1.160** 1.160**
(0.051) (0.053) (0.052) (0.053) (0.052) (0.052)
South (Ref=Midwest) 1.035 1.048 1.053 1.054 1.056 1.056
(0.043) (0.045) (0.044) (0.044) (0.044) (0.044)
West (Ref=Midwest) 0.977 0.987 1.000 1.005 1.006 1.006
(0.048) (0.050) (0.049) (0.049) (0.049) (0.049)
Tract-level
% Residents, Nonwhite 1.128*** 1.117*** 1.095*** 1.094*** 1.070*** 1.071***
(0.005) (0.005) (0.006) (0.006) (0.007) (0.007)
Tract Population 0.988** 0.986*** 0.997 0.998 0.997 0.997
(0.004) (0.004) (0.004) (0.004) (0.004) (0.004)
# of Listings in Tract 1.001*** 1.001*** 1.000 1.000 1.000 1.000
(0.0001) (0.0001) (0.0002) (0.0002) (0.0002) (0.0002)
Median Age 0.976*** 1.002 0.999 1.009 1.009
(0.005) (0.006) (0.006) (0.006) (0.006)
% Occupied Households,
Renter 1.057*** 1.049*** 1.052*** 1.052***
(0.006) (0.007) (0.007) (0.007)
Median Monthly Housing
Expense 0.985* 0.989 1.003 1.002
(0.006) (0.008) (0.009) -0.009
Gini Coefficient 1.021*** 1.021*** 1.021***
(0.005) (0.005) (0.005)
Per capita Income 0.992 0.933*** 0.930***
(0.008) (0.011) (0.013)
Income, Quadratic 1.023*** 1.024***
(0.003) (0.003)
% Residents with BA, 25+ 1.003
(0.009)
Listing-level
Private Room 0.924*** 0.925*** 0.937*** 0.937*** 0.935*** 0.936***
(0.009) (0.009) (0.009) (0.009) (0.009) (0.009)
Shared Room 1.111*** 1.110*** 1.112*** 1.113*** 1.108*** 1.108***
(0.023) (0.023) (0.023) (0.023) (0.023) (0.023)
# of Amenities 0.807*** 0.807*** 0.809*** 0.809*** 0.810*** 0.810***
(0.004) (0.004) (0.004) (0.004) (0.004) (0.004)
# of Guests Accommodated 1.075*** 1.077*** 1.082*** 1.083*** 1.081*** 1.081***
(0.005) (0.005) (0.005) (0.005) (0.005) (0.005)
Book Instantly 1.246*** 1.246*** 1.244*** 1.244*** 1.243*** 1.243***

27
(0.009) (0.009) (0.009) (0.009) (0.009) (0.009)
# of Reviews 0.993* 0.993* 0.991** 0.991** 0.991** 0.991**
(0.003) (0.003) (0.003) (0.003) (0.003) (0.003)
Nighlty Price 0.839*** 0.839*** 0.841*** 0.840*** 0.840*** 0.840***
(0.014) (0.014) (0.014) (0.014) (0.014) (0.014)
Host-Level
# of Listings per host 1.012*** 1.012*** 1.012*** 1.012*** 1.012*** 1.012***
(0.001) (0.001) (0.001) (0.001) (0.001) (0.001)
Length of Membership 1.011** 1.011** 1.012** 1.012** 1.012** 1.012**
(0.004) (0.004) (0.004) (0.004) (0.004) (0.004)
Spatial Decay+ 1.001 1.001 1.002 1.002 1.002 1.002
(0.003) (0.003) (0.003) (0.003) (0.003) (0.003)
Constant 4.271*** 4.230*** 4.234*** 4.233*** 4.118*** 4.115***
(0.042) (0.044) (0.043) (0.044) (0.044) (0.044)
Observations 149,882 149,794 149,566 149,566 149,566 149,561
Number of Unique Hosts 108945 108946 108947 108948 108949 108950
Number of Tracts 22964 22965 22966 22967 22968 22969
Number of MSAs 104 104 104 104 104 104
Log Likelihood
-
409,139.50
0
-
408,882.80
0
-
408,220.80
0
-
408,212.30
0
-
408,173.20
0
-
408,157.10
0
AIC
818,323.00
0
817,811.70
0
816,491.50
0
816,478.60
0
816,402.40
0
816,372.30
0
BIC
818,541.10
0
818,039.80
0
816,739.40
0
816,746.30
0
816,680.00
0
816,659.80
0
Standard errors in parentheses, *** p<0.01, ** p<0.05, * p<0.1

28
Figure 1: Marginal Effect of % non-White on Predicted Incidences of Number of Listings

29
Figure 2: Marginal Effect of % non-White on Nightly Price of a Listing

30
Figure 2: Marginal Effect of % non-White on the Rating of a Listing
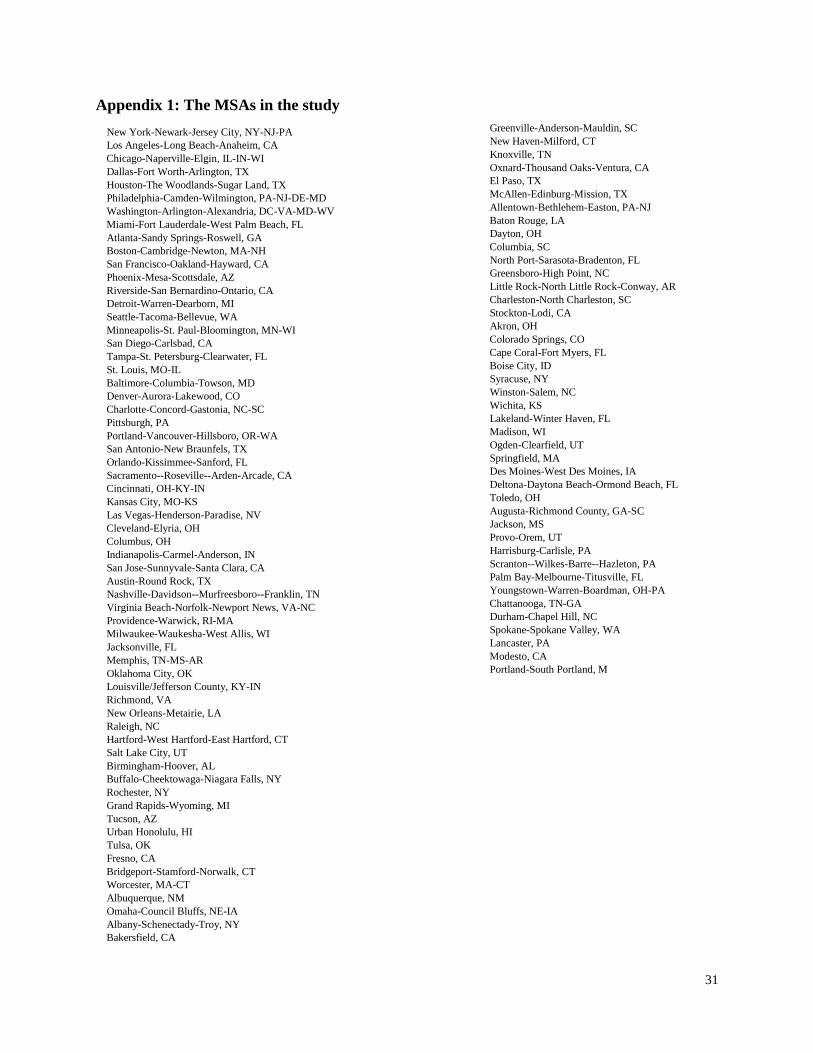
31
Appendix 1: The MSAs in the study
New York-Newark-Jersey City, NY-NJ-PA
Los Angeles-Long Beach-Anaheim, CA
Chicago-Naperville-Elgin, IL-IN-WI
Dallas-Fort Worth-Arlington, TX
Houston-The Woodlands-Sugar Land, TX
Philadelphia-Camden-Wilmington, PA-NJ-DE-MD
Washington-Arlington-Alexandria, DC-VA-MD-WV
Miami-Fort Lauderdale-West Palm Beach, FL
Atlanta-Sandy Springs-Roswell, GA
Boston-Cambridge-Newton, MA-NH
San Francisco-Oakland-Hayward, CA
Phoenix-Mesa-Scottsdale, AZ
Riverside-San Bernardino-Ontario, CA
Detroit-Warren-Dearborn, MI
Seattle-Tacoma-Bellevue, WA
Minneapolis-St. Paul-Bloomington, MN-WI
San Diego-Carlsbad, CA
Tampa-St. Petersburg-Clearwater, FL
St. Louis, MO-IL
Baltimore-Columbia-Towson, MD
Denver-Aurora-Lakewood, CO
Charlotte-Concord-Gastonia, NC-SC
Pittsburgh, PA
Portland-Vancouver-Hillsboro, OR-WA
San Antonio-New Braunfels, TX
Orlando-Kissimmee-Sanford, FL
Sacramento--Roseville--Arden-Arcade, CA
Cincinnati, OH-KY-IN
Kansas City, MO-KS
Las Vegas-Henderson-Paradise, NV
Cleveland-Elyria, OH
Columbus, OH
Indianapolis-Carmel-Anderson, IN
San Jose-Sunnyvale-Santa Clara, CA
Austin-Round Rock, TX
Nashville-Davidson--Murfreesboro--Franklin, TN
Virginia Beach-Norfolk-Newport News, VA-NC
Providence-Warwick, RI-MA
Milwaukee-Waukesha-West Allis, WI
Jacksonville, FL
Memphis, TN-MS-AR
Oklahoma City, OK
Louisville/Jefferson County, KY-IN
Richmond, VA
New Orleans-Metairie, LA
Raleigh, NC
Hartford-West Hartford-East Hartford, CT
Salt Lake City, UT
Birmingham-Hoover, AL
Buffalo-Cheektowaga-Niagara Falls, NY
Rochester, NY
Grand Rapids-Wyoming, MI
Tucson, AZ
Urban Honolulu, HI
Tulsa, OK
Fresno, CA
Bridgeport-Stamford-Norwalk, CT
Worcester, MA-CT
Albuquerque, NM
Omaha-Council Bluffs, NE-IA
Albany-Schenectady-Troy, NY
Bakersfield, CA
Greenville-Anderson-Mauldin, SC
New Haven-Milford, CT
Knoxville, TN
Oxnard-Thousand Oaks-Ventura, CA
El Paso, TX
McAllen-Edinburg-Mission, TX
Allentown-Bethlehem-Easton, PA-NJ
Baton Rouge, LA
Dayton, OH
Columbia, SC
North Port-Sarasota-Bradenton, FL
Greensboro-High Point, NC
Little Rock-North Little Rock-Conway, AR
Charleston-North Charleston, SC
Stockton-Lodi, CA
Akron, OH
Colorado Springs, CO
Cape Coral-Fort Myers, FL
Boise City, ID
Syracuse, NY
Winston-Salem, NC
Wichita, KS
Lakeland-Winter Haven, FL
Madison, WI
Ogden-Clearfield, UT
Springfield, MA
Des Moines-West Des Moines, IA
Deltona-Daytona Beach-Ormond Beach, FL
Toledo, OH
Augusta-Richmond County, GA-SC
Jackson, MS
Provo-Orem, UT
Harrisburg-Carlisle, PA
Scranton--Wilkes-Barre--Hazleton, PA
Palm Bay-Melbourne-Titusville, FL
Youngstown-Warren-Boardman, OH-PA
Chattanooga, TN-GA
Durham-Chapel Hill, NC
Spokane-Spokane Valley, WA
Lancaster, PA
Modesto, CA
Portland-South Portland, M


