+ All Categories
Home > Documents > Who Gets What? Shareholder Value of Acquirers and Targets ... · Indian Takeovers 1. Introduction...

Who Gets What? Shareholder Value of Acquirers and Targets ... · Indian Takeovers 1. Introduction...

Date post: 25-Apr-2020
Category:
Upload: others
View: 7 times
Download: 0 times
Share this document with a friend
29
POST-GRADUATE STUDENT RESEARCH PROJECT Who Gets What? Shareholder Value of Acquirers and Targets in Indian Takeovers Prepared by Ajit Kumar Student, PGPM (2013-2015) Indian Institute of Management, Tiruchirappalli Supervised by Prof. Bipin Kumar Dixit Assistant Professor, Finance and Accounting Area Indian Institute of Management, Tiruchirappalli February 2015
Transcript

POST-GRADUATE STUDENT RESEARCH PROJECT

Who Gets What? Shareholder Value of Acquirers

and Targets in Indian Takeovers

Prepared by

Ajit Kumar

Student, PGPM (2013-2015)

Indian Institute of Management, Tiruchirappalli

Supervised by

Prof. Bipin Kumar Dixit

Assistant Professor, Finance and Accounting Area

Indian Institute of Management, Tiruchirappalli

February 2015

1

Who Gets What? Shareholder Value of Acquirers and Targets in

Indian Takeovers

Prepared by: Ajit Kumar*

Abstract

This paper examines the shareholder value of acquirers and targets in India during the period

2007–2013. Shareholder value is calculated around the acquisition announcement using the

market model, market-adjusted method, and mean-adjusted method. Using acquisition data of

54 deals involving change in control during this period, we find that acquirers do not create

value to their shareholders at the time of the acquisition announcement. We obtain similar

results for target firms. The combined returns of acquirers and targets are also statistically

insignificant. This is the first study that examines the shareholder value of both acquirers as

well as targets in India. Significantly, our results are in complete contrast with the findings

reported for developed markets.

* Ajit Kumar is a PGPM (Finance) student at Indian Institute of Management, Tiruchirappalli (email:

[email protected]). The author would like to express gratitude to Prof. Bipin Kumar Dixit, Assistant

Professor at Indian Institute of Management, Tiruchirappalli for his constant support and valuable comments

with this paper. The author also acknowledges the opportunity as well as the research grant provided by the

National Stock Exchange of India Ltd. The views expressed in the paper are those of the author and do not

necessarily reflect the opinions of the National Stock Exchange of India Ltd.

2

Who Gets What? Shareholder Value of Acquirers and Targets in

Indian Takeovers

1. Introduction

India was one of the fastest growing emerging economies in the world in the last

decade. In 2014, India displaced Japan to become the third largest economy in the world in

terms of purchasing power parity (PPP).1 Despite a sluggish market in the recent past, India

managed to grow at 6.96% in the last 15 years.2 The value of merger and acquisition (M&A)

deals in India during the first half of 2014 (January–June 2014) stood at USD 23 billion,

showing an impressive growth of 30.68% from the previous year (USD 17.6 billion).3 The

number of deals also increased from 460 to 560 in the same period. According to Fitch

Ratings, India will grow at 5.5% in the current financial year (FY 2015) and at 6.5% in FY

2016.4

Mergers and acquisitions should create value for the shareholders of the acquirers and

targets. However, in the U.S. market, it has been observed that in the short-run (3-day

period), acquirers lose shareholder value by around 0.7%, whereas the shareholder value of

the target increases by approximately 16 % (Andrade et al 2001). Similarly, in long run, the

acquirer‟s shareholder value decreases by 3.8%, and the target shareholder value increases by

23.8%. These results are attributed to various factors such as the lack of expected synergies,

winners‟ curse, agency issue, and overconfidence of the managers (Jensen, 1986; Roll, 1986;

Varaiya, 1988; Morck et al., 1989; Malmendier and Tate, 2008).

However, in an emerging economy like India, the pattern of results is different. Extant

studies report that Indian acquirers create shareholder value at the time of acquisition

(Chakrabarti, 2008; Zhu and Malhotra, 2008; Gubbi et al., 2010; Banerjee et al., 2014). Using

the data of Indian public acquirers during the period 2000 to mid-2007, Chakrabarti (2008)

illustrated that Indian acquirers create shareholder value. This is in sharp contrast with the

findings of studies conducted in developed markets. Banerjee et al. (2014) found that Indian

1 “India displaces Japan to become third-largest world economy”, The Economic Times, April 30, 2014.

2 The World Bank, World Development Indicators (2013). Retrieved from

http://data.worldbank.org/indicator/NY.GDP.MKTP.KD.ZG 3 M&A values in India up 31% at $23 bn”, The Economic Times, Sunday, July 18, 2014.

4 “Fitch revises India‟s economic growth forecast to 5.5%”, Indian Express, July 1, 2014.

3

acquirers created shareholder value until 2007; the returns accrued to Indian acquirers were

negative during 2008 to 2011. To the best of our knowledge, there is no extant study that

examines the shareholder value of target firms in Indian M&As.

In this paper, we examine the shareholder value of acquirers and targets in India during

the period 2007–2013. The key research questions are:

1. Do Indian acquirers and targets create shareholder value?

2. If yes, how is the wealth distributed among the shareholders of acquirers and targets?

This study contributes to the literature in the area of value creation for the shareholders of

Indian acquirers and targets, which is an area where limited research has been conducted.

This is the first study to examine the shareholder value of Indian target firms. Our study

contributes to the understanding of the impact of a change in control on the returns for targets

and acquirers. Based on data from the 2007–2013 period, the results show that Indian

acquirers and targets neither create nor destroy shareholder value.

2 Literature Review

2.1 Global M&A Literature

Jensen and Ruback (1983), in their survey paper, presented evidence regarding the

market for corporate control. They defined corporate control as the right to manage corporate

resources such as the right to set the compensation for top-level managers, the right to set the

HR policies, and so on. In the market of corporate control, firms compete for the right to

manage these corporate resources. They mentioned that corporate takeovers generate positive

returns for the target firms, and the shareholders of the acquirers do not necessarily lose.

Further, they stated that takeovers reduce the conflict between shareholders and managers

and limit the ability of managers to diverge from the objective of shareholder wealth

maximisation.

Huang and Walking (1987) analysed the abnormal returns accrued to targets by

examining all initial acquisition announcements that appeared on the front page of the Wall

Street Journal from April 1977 to September 1982. They examined the sample from three

angles: type of offer (merger, tender, or undisclosed), form of payment (cash, stock, mixed,

or undisclosed), and degree of target management resistance (friendly, unfriendly, or neutral).

They found that the abnormal returns to targets are higher in the case of tender offers as

4

compared to mergers. Cash offers also involve the accrual of higher abnormal returns to

targets as compared to stock offers. While managerial resistance is correlated with abnormal

returns to targets, it is insignificant and marginal.

Bradley et al. (1988) analysed the synergistic gains from an acquisition and the division

of the gains between the shareholders of the acquirer and the target using a sample of

successful tender offers during 1963–1984. They found that a successful tender offer

increases the combined value of the acquirer and the target by an average of 7.4%. This gain

is mainly due to more efficient utilisation of corporate resources. The shareholders of both

acquirers and targets earn significantly positive abnormal returns; however, most of the gains

are accrued to the shareholders of the target firms only. The authors stated that because of

competition among multiple bidders, the return accrued to the target firm increases, and the

return to the acquiring firm decreases. However, this contest is not a zero-sum game. The

target firm gains not only at the expense of the acquirers but also through the loss of realised

synergy.

Andrade et al. (2001) reviewed the extant literature with respect to shareholder value

creation/destruction in the U.S. M&A market. They presented the evidence based on their

analysis of a much larger sample. They concluded that overall, M&A activity does create

shareholder value; however, only the target gets the benefit, and the acquirer loses or at best

does not create any value. They showed that mergers occur in waves, and mergers are

strongly clustered within a wave. However, each wave is associated with a particular

industry. For a particular industry, a high level of M&A activities in one decade will not

necessarily ensure the same level of M&A activities in other decades. This happens mainly

because of shocks such as technological or regulatory shocks. The shocks could be supply

shocks, technological innovations, industry consolidation, or deregulations. They found that

for both acquirers and targets, the post-merger operating margins improve relative to industry

benchmarks.

Bae et al. (2002) tested the tunnelling hypothesis by analysing acquisitions made by

Korean business groups during 1981–1997. They found that when a Korean business group

makes an acquisition, its stock price drops on average. The minority shareholders of the

acquiring Korean business group lose while the controlling shareholder of that firm benefits

on average. This is because the acquisition increases the value of the other firms in the group.

Thus, their results support the tunnelling hypothesis.

5

Moeller et al. (2005) examined the shareholder returns that accrued to the acquiring

firms by analysing acquisitions that happened during 1998–2001; they compared these

returns to the shareholder returns that accrued to the acquiring firms due to acquisitions that

happened in the 1980s. According to this study, during 1998–2001, the shareholders of

acquiring firms lost 12 cents on average around the acquisition announcement per dollar

spent on acquisition. On the other hand, during the 1980s, the acquiring firms‟ shareholders

lost only 1.6 cents around the acquisition announcement per dollar spent on acquisition (on

average). Further, they showed that the firms that make large loss deals are serial acquirers

who are successful with acquisitions until they make the large loss deal.

Draper and Paudyal (2006) examined the takeovers of private companies by listed U.K.

acquirers during 1981–2001. They contested the extant evidence that acquirers do not create

shareholder value. They further argued that the gain from the acquisition depends on the

status of the target, the mode of payment, and the relative size of the partners. First, they

found that the listed acquirers of private target companies gain significant positive returns

during the period surrounding the announcement date. This is in direct contrast with the

evidence that acquirers do not gain in the short run. Second, they stated that the gain to the

acquiring firms depends on the mode of payment. In cash transactions, the acquirers gain in

the case of private targets, while acquirers generally break even in the case of listed targets.

In transactions involving shares, the acquirers gain the largest excess returns in the case of

private targets, while they lose in the case of listed targets. Third, the gain to acquirers

depends on the relative size of targets.

Alexandridis et al. (2010) examined the shareholder value of acquirers using data from

several countries. They found that the level of competition is negatively associated with the

acquirers‟ returns and positively associated with the target‟s returns. They measured market

competitiveness as the number of targets in the completed deals as a percentage of the total

listed companies in the country for each year. Based on this measure, they reported that the

U.S., the U.K., and Canada are the most competitive markets. The average premium paid to

acquire the targets in these three countries stood at 41% compared to only 31.91% for the rest

of the world. The results from this study demonstrate that the well-accepted notion that the

acquirer loses in an acquisition is confined to the U.U.C. region (U.S., U.K., and Canada);

acquirers in the rest of the world (ROW) gain an average abnormal return of 1.56% in the

short run. The returns of the target firms from ROW are almost half compared to those of the

targets from the U.U.C. region.

6

Chari et al. (2010) analysed a sample that involved M&A deals that happened during

1986–2006. They found that when acquirers from developed markets acquire emerging

market targets, they experience significant positive abnormal returns of 1.16% over a three-

day event period. However, this phenomenon is not replicated when the same acquirers from

developed markets acquire firms in developed markets. This difference is due to the greater

asymmetry between developed and emerging markets. Moreover, this difference is large

when the control is acquired in industries where most of the assets are intangible.

Atkas et al. (2011) examined CEO behaviour and learning during a series of

acquisitions. They analysed a sample of CEOs of U.S. acquirers who handled two

consecutive deals with U.S. public targets over a 12-month period between 1992–2007. They

concluded that CEOs acknowledge market signals and modify their beliefs and bidding

aggressiveness in subsequent acquisitions. The CEOs increase (decrease) their bidding

aggressiveness in subsequent deals after positive (negative) market reactions to their previous

deal.

2.2 Indian M&A Literature

Pawaskar (2001) analysed a sample of 36 Indian firms involved in mergers during

1992–1995. The results show that when firms with higher than average industry performance

acquire a firm with lower than industry average profitability and size, there is no

improvement in terms of profitability. That is, mergers do not create any monopoly effect by

reducing competition. Agarwal and Bhattacharjea (2006) examined whether industry shock

contributes to merger activities. They used a sample of mergers in India during 1973–2003.

They identified three sub-periods of merger activities in India with varying degree of

intensity: low intensity period: 1973–1988; moderate intensity period: 1988–1994; and high

intensity period: 1995–2001. Using empirical analysis, they demonstrated that mergers are

clustered in a few industries within a wave.

Kumar et al. (2007) examined the financial characteristics of Indian firms involved in

mergers. They analysed 227 acquirers and 215 target firms involved in mergers during 1993–

2004. They found that acquiring firms have higher cash flow, PE ratios, book value, liquid

assets, and lower debt to total assets as compared to target firms. The cash flow and net profit

of target companies were approximately 25% and 19% that of the respective value of

acquiring companies. However, the long-term debt of target companies was 80% that of the

long-term debt of acquirer companies. A company‟s chances of becoming a target increase as

7

its liquidity decreases. Additionally, smaller companies have higher chances of becoming a

target.

Mathew (2007) analysed the prospects of hostile takeovers in the Indian M&A market

by examining the shareholding pattern of 500 Indian companies. She predicted that in the

near future, hostile takeovers will be rare for three reasons: the presence of founding

members or promoters with dominant shareholding position; the burdensome government

approvals that are required; and the provision in the Indian takeover code that favours

promoters. Additionally, due to the favourable economic conditions in India, the share prices

of companies continue to grow, leading to very few targets for hostile acquisitions. However,

as the business cycle comes down and share price start falling, Indian companies will face the

threat of hostile acquisition.

Agarwal and Bhattacharjea (2008) analysed the regulations in place for the Indian

M&A market. They examined the Competition Act 2002 and its subsequent amendments by

the Competition Commission of India (CCI). They stated that due to the free trade and

economic cooperation agreements signed by India with other countries, the entry barrier will

become lower, and foreign firms with no current business in India may enter the Indian

market. This may eliminate potential competition in India. The CCI ignored the competition

that small firms can give to their large, established rivals by introducing disruptive

innovation. The regulation allows the acquisition of these small firms by established firms,

thereby removing competition.

Beena (2008) analysed various ratios of acquirers in India during 1995–2000. She

stated that the profitability ratios of all the acquiring firms in the post-M&A period either

remained the same or declined as compared to those in the pre-M&A period. The capacity

utilisation ratio and R&D intensity declined after M&As. The shareholders of acquirers were

paid higher returns in the form of dividends to win their confidence after the acquisition. The

financing structure also changed from 1995 to 2005. In 1995, firms were dependent more on

external financing, with 34% of financing coming from capital markets, 22% from

borrowing, 17% from current liabilities, and the remaining 27% from internal sources. In

2005, only 7% of financing came from capital markets; 37% came from borrowing, 30%

from current liabilities, and the remaining 20% from internal sources. This change in the

pattern of financing structure conforms to the pecking order theory, which states that a firm

prefers internal financing followed by borrowings; a firm goes for financing from external

capital markets as a last resort.

8

Bhagat et al. (2011) studied cross-border acquisitions done by firms from emerging

economies like India, Malaysia, China, and Brazil during 1991–2008. The value of

international acquisitions stood at USD 182 billion in 2008, constituting 66% of the total FDI

outflow from the emerging economies. Most of the targets were from developed countries. In

such international acquisitions, the acquirers from emerging economies gain an average of

1.09% on the announcement date. This positive return is directly related to the improved

corporate governance standards in the target country. Bhaumik and Selarka (2012) examined

Indian M&As that happened during 1954–2004. They analysed the impact of owner

concentration on the post-M&A performance of firms. The result suggests that the post-M&A

performance of companies may improve if a significant portion of its ownership is in the

hands of company directors. However, ownership concentration in the hands of domestic

promoters does not impact the post-M&A performance of a company.

Banerjee et al. (2014) considered all the acquisitions done by Indian acquirers during

1995–2011. They showed that Indian acquirers created shareholder value until 2007; from

2008 to 2011, the returns accrued to Indian acquirers were negative. There was a steep

decline in the abnormal returns accrued to the acquirers in 2008–2011. This study determined

the increasing intensity of the market for corporate control as measured by an increased

number of participants in M&A activities to be the reason for the declining acquirer returns in

Indian M&As.

3. Data

The Substantial Acquisition of Shares and Takeovers (SAST) Regulation 1997 and its

subsequent modifications require any acquisition where the target company is a listed entity

to be reported to the respective stock exchange(s). The target companies need to report

various details of the deal (such as the name of the acquirer, name of the target, number of

shares transacted, number of shares transacted in percentage, holding after the transaction,

transaction period, and the reported to exchange date) to the exchange. From the website of

the Bombay Stock Exchange (BSE), we collect data pertaining to 77605 acquisitions that

happened in India during 2007–2013 and reported to exchange(s) as mandated by the SAST.

We apply various filtering criteria to get the final dataset for analysis. The sample includes

two kinds of transactions: one where the acquirer company reduces its stake in the target

company, denoted by “SALE;” and second where the acquirer buys stake in the target

9

company, denoted by “ACQ.” Since we are interested in examining the shareholder value in

mergers and acquisitions, all sales transactions were filtered out. This leaves us with 57301

transactions.

In this study, we want to examine the impact that the change in control in the target

firm has on the shareholder value of acquirers and targets. Therefore, we want only those

transactions where change of control has happened. To satisfy this requirement, the sample

was filtered with the following criteria: pre-acquisition holdings should be less than or equal

to 50%, and post-acquisition holdings should be greater than 50%. This intermediate sample

consists of 2953 data points. This sample included publicly listed target companies and

acquirers who were individuals, trusts, private companies, and publicly listed companies.

Those data points where the acquirers were individuals, trusts, and private companies were

not considered since we need the share price data of acquirers in order to examine the

shareholder value of acquirers. In some data points, the holdings after transaction or the

transaction amounts were not given. Therefore, those transactions were not considered either.

The filtered sample consists of 69 transactions. The reason for less data points was the

filtering criteria that we used in order to examine our intended research questions. Our two

important filtering criteria are: (1) both the acquirers and the targets should be publicly listed

Indian companies; and (2) there should be a control shift from <=50% pre-acquisition stake

to >50% post-acquisition stake for acquirers.

The daily adjusted closing share price of all the acquirers and targets during 2007–2013

is taken from Prowess Database of the Centre for Monitoring the Indian Economy (CMIE).

However, for some companies, the share prices were not available. The transactions

containing those companies were ignored. Hence, the final sample has 54

takeovers/acquisitions (Table 1).

Under the SAST, for every deal, the transaction period as well as the reported to

exchange date is reported to the exchange(s). In some cases, the transaction period was a

particular date, and in other cases, it was a period. The transaction period was 4–5 days closer

or away compared to the reported to exchange date. The reported to exchange date was taken

as the announcement date. To minimize the impact on the results of the analysis due to the

difference between the reported to exchange date (announcement date) and the transaction

period, the regression coefficients were estimated using the firms‟ share price data and

market returns starting 240 days prior to the announcement date and ending 30 days prior to

the same date.

10

Under the SAST, for every deal, whether the acquirer was a promoter or part of the

promoter group of the target at the time of acquisition also needs to be reported. These deals

are termed as intra-group acquisitions or restructurings. In the data sample, 11 of the 54 data

points involved such deals.

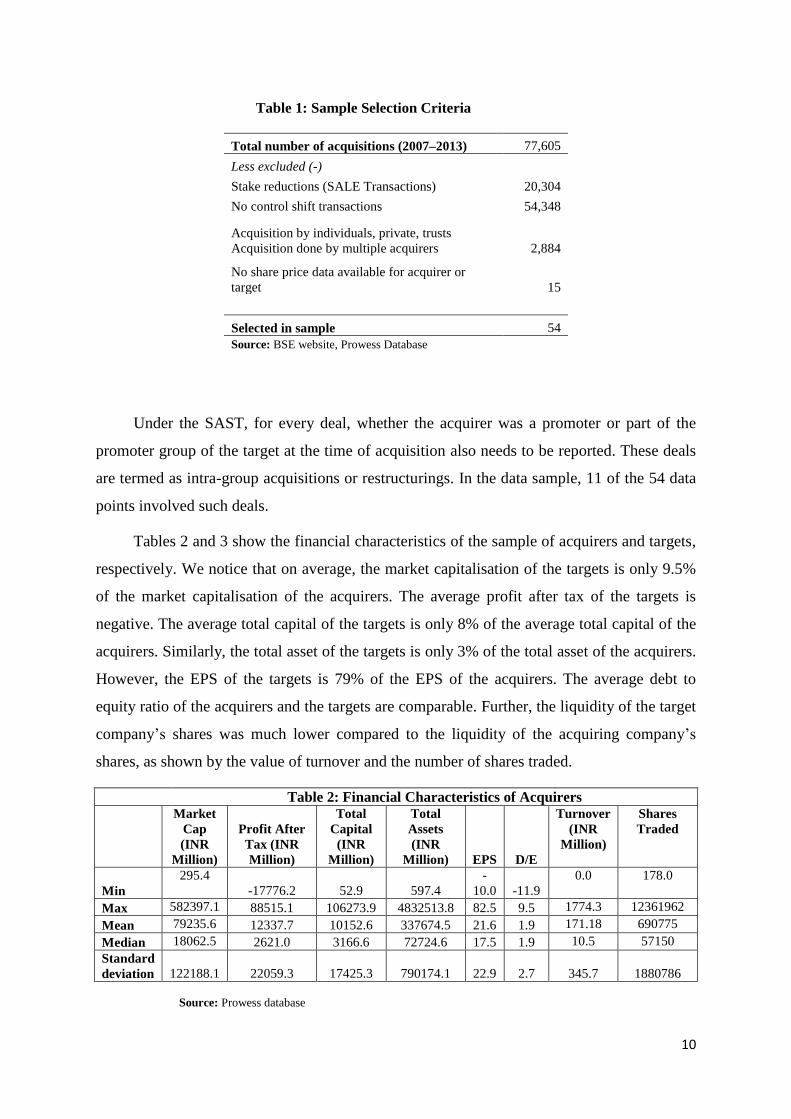
Tables 2 and 3 show the financial characteristics of the sample of acquirers and targets,

respectively. We notice that on average, the market capitalisation of the targets is only 9.5%

of the market capitalisation of the acquirers. The average profit after tax of the targets is

negative. The average total capital of the targets is only 8% of the average total capital of the

acquirers. Similarly, the total asset of the targets is only 3% of the total asset of the acquirers.

However, the EPS of the targets is 79% of the EPS of the acquirers. The average debt to

equity ratio of the acquirers and the targets are comparable. Further, the liquidity of the target

company‟s shares was much lower compared to the liquidity of the acquiring company‟s

shares, as shown by the value of turnover and the number of shares traded.

Table 2: Financial Characteristics of Acquirers

Market

Cap

(INR

Million)

Profit After

Tax (INR

Million)

Total

Capital

(INR

Million)

Total

Assets

(INR

Million) EPS D/E

Turnover

(INR

Million)

Shares

Traded

Min

295.4

-17776.2 52.9 597.4

-

10.0 -11.9

0.0 178.0

Max 582397.1 88515.1 106273.9 4832513.8 82.5 9.5 1774.3 12361962

Mean 79235.6 12337.7 10152.6 337674.5 21.6 1.9 171.18 690775

Median 18062.5 2621.0 3166.6 72724.6 17.5 1.9 10.5 57150

Standard

deviation

122188.1 22059.3 17425.3 790174.1 22.9 2.7

345.7

1880786

Source: Prowess database

Table 1: Sample Selection Criteria

Total number of acquisitions (2007–2013) 77,605

Less excluded (-)

Stake reductions (SALE Transactions) 20,304

No control shift transactions 54,348

Acquisition by individuals, private, trusts

Acquisition done by multiple acquirers 2,884

No share price data available for acquirer or

target 15

Selected in sample 54

Source: BSE website, Prowess Database

11

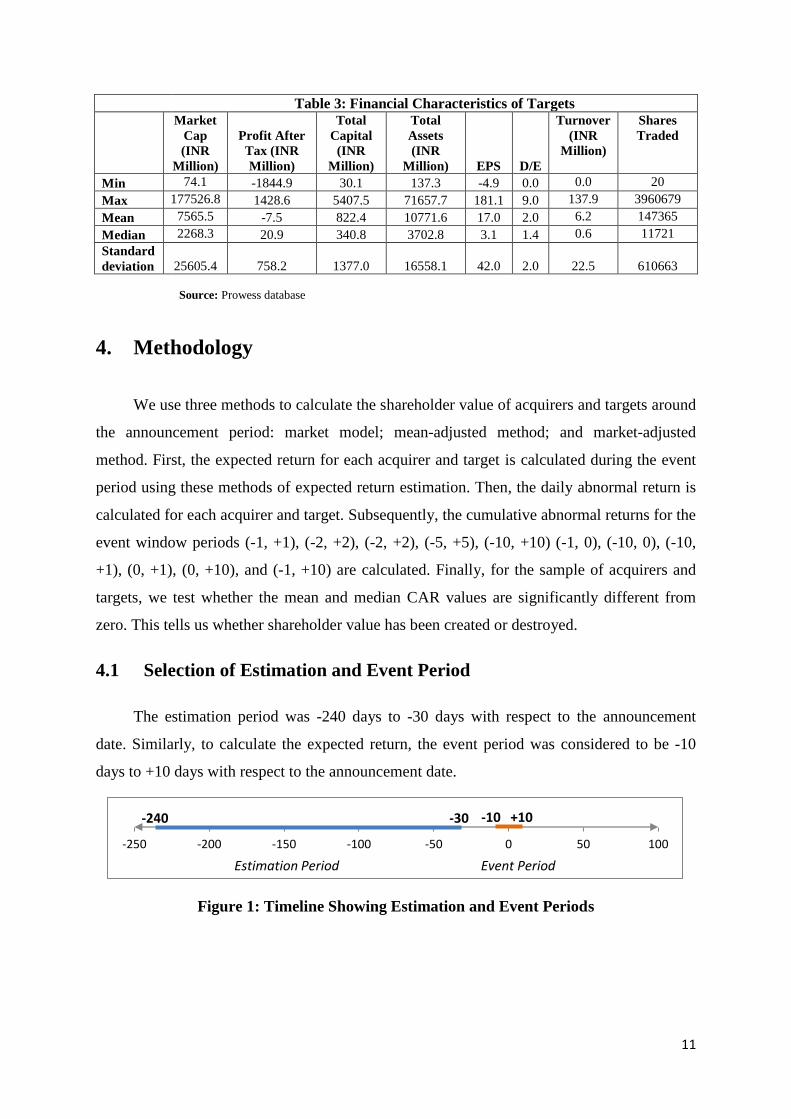
Table 3: Financial Characteristics of Targets

Market

Cap

(INR

Million)

Profit After

Tax (INR

Million)

Total

Capital

(INR

Million)

Total

Assets

(INR

Million) EPS D/E

Turnover

(INR

Million)

Shares

Traded

Min 74.1 -1844.9 30.1 137.3 -4.9 0.0 0.0 20

Max 177526.8 1428.6 5407.5 71657.7 181.1 9.0 137.9 3960679

Mean 7565.5 -7.5 822.4 10771.6 17.0 2.0 6.2 147365

Median 2268.3 20.9 340.8 3702.8 3.1 1.4 0.6 11721

Standard

deviation

25605.4 758.2 1377.0 16558.1 42.0 2.0

22.5

610663

Source: Prowess database

4. Methodology

We use three methods to calculate the shareholder value of acquirers and targets around

the announcement period: market model; mean-adjusted method; and market-adjusted

method. First, the expected return for each acquirer and target is calculated during the event

period using these methods of expected return estimation. Then, the daily abnormal return is

calculated for each acquirer and target. Subsequently, the cumulative abnormal returns for the

event window periods (-1, +1), (-2, +2), (-2, +2), (-5, +5), (-10, +10) (-1, 0), (-10, 0), (-10,

+1), (0, +1), (0, +10), and (-1, +10) are calculated. Finally, for the sample of acquirers and

targets, we test whether the mean and median CAR values are significantly different from

zero. This tells us whether shareholder value has been created or destroyed.

4.1 Selection of Estimation and Event Period

The estimation period was -240 days to -30 days with respect to the announcement

date. Similarly, to calculate the expected return, the event period was considered to be -10

days to +10 days with respect to the announcement date.

Figure 1: Timeline Showing Estimation and Event Periods

-250 -200 -150 -100 -50 0 50 100

-240 -30 -10 +10

Estimation Period Event Period

12

4.2 Estimation of Expected Returns

To calculate the expected returns during the event period of -10 to +10 days, three different

models are used to make the analysis much more robust and to verify whether the findings

are the same across the methodologies.

4.2.1 Market Model

To calculate the shareholder value, Brown and Warner (1985) provided a framework

for estimating the expected returns, and thus, the daily excess returns during the event period.

First, daily security return before the event is regressed on the market return:

Ri,t = αi + βiRm,t +error

where αi and βi are the ordinary least square (OLS) values from the estimation period. Using

this regression during the estimation period, the regression coefficients are estimated. These

regression coefficients are used to estimate the expected return during the event period:

E(Ri,t) = αi + βiRm,t

Brown and Warner (1985) assumed that the data in the sample is randomly selected;

thus, the corresponding result would be least biased. However, the sample data in event

studies are generally grouped by certain characteristics such as valuation, size, and

momentum. In the case of non-random sampling, Ahern (2009) stated that the results of the

Brown and Warner methodology will be biased. Here, we assumed random sampling of the

data.

4.2.2 Market-Adjusted Method

According to the market-adjusted method, the expected return of the acquirer or sample

during the event period is taken to be the market return only:

E(Ri,t) = Rm,t

4.2.3 Mean-Adjusted Method

According to the mean-adjusted method, the expected return of the firm during the

event period is based on the average of the market return during the estimation period:

E(Ri,t) = Average (Ri,t-240 to t- 31)

13

4.3 Calculation of Daily Abnormal Return

If Ri,t denotes the arithmetic return for security i on day t, the abnormal return (ARi,t)

will be:

ARi,t= Ri,t - E(Ri,t)

Based on these three methods, the daily abnormal return was calculated for each

acquirer/target.

4.4 Calculation of Cumulative Abnormal Returns

The cumulative abnormal returns for the (-1, +1), (-2, +2), (-2, +2), (-5, +5), (-10, +10)

(-1, 0), (-10, 0), (-10, +1), (0, +1), (0, +10), and (-1, +10) event windows were calculated as:

CAR (m, n) = ∑

4.5 Hypothesis Testing

After calculating the CAR for different time periods, the statistical significance of the

CAR for each event period was assessed.

4.5.1 Hypothesis Testing for Mean

The null hypothesis and alternate hypothesis are structured as a two-tailed test:

H10: The mean cumulative abnormal return (CAR) for acquirers/targets is zero.

H11: The mean cumulative abnormal return (CAR) for acquirers/targets is different

from zero.

That is, H10: µ = 0; H11: µ ≠ 0.

The mean CAR is calculated as the average of the CAR of each acquirer/target.

t = (1/Nt) ∑

The standard deviation of CAR is calculated using the standard formula given below:

S ( ) =Sqrt (∑

2/Nt)

The standard error of CAR is calculated using the following formula:

( ) = S ( )/ Sqrt (Nt)

The test statistic is the ratio of mean excess return to its estimated standard error.

14

Thus, the test statistic = t/ ( )

Here, Nt is the number of observations/transactions. Since the number of samples

exceeds 30, according to the central limit theorem, we can assume that the test statistic has a

normal distribution.

The calculated test statistic is compared with the critical test statistic at the 5%

significance level to test for the rejection or acceptance of the null hypothesis. The critical

test statistic at the 5% significance level is 1.96.

The following decision criteria are used to reject or accept the null hypothesis:

If – critical test statistic < calculated test statistic < critical test statistic, do not reject the

null hypothesis; else, reject the null hypothesis.

4.5.2 Hypothesis Testing for Median

The null hypothesis and alternate hypothesis are structured as a two-tailed test:

H20: The median CAR for acquirers/targets is zero.

H21: The median CAR for acquirers/targets is different from zero.

That is, H20: Mdn = 0; H21: Mdn ≠ 0.

The median splits a sample into half such that 50% of the values are above the median,

while the remaining 50% are below the median. Sign test (non-parametric test) is used to test

the hypothesis whether the median CAR is significantly different from zero. First, the number

of data points with values above and below the hypothesised value (i.e., zero) is calculated.

Any data with value equal to the hypothesised value is discarded. To test for the plus signs,

the mean and median are calculated based on the following formula (Anderson et al., 2011):

Mean = 0.50 × Nt

Median = Sqrt (0.25 × Nt)

where Nt is the number of observations/transactions.

The test statistic is calculated as:

Test stat = (x-mean)/median

where x is number of values greater than the hypothesised value, i.e., zero.

15

The calculated test statistic is compared with the critical test statistic at the 5%

significance level to check for the rejection or acceptance of the null hypothesis. The critical

test statistic at the 5% significance level is 1.96.

If – critical test statistic < calculated test statistic < critical test statistic, do not reject the

null hypothesis; else, reject the null hypothesis.

5. Results and Discussion

5.1 Shareholder Value of Acquirers

The results of the mean and median cumulative abnormal return (CAR) of the acquirers

with various event windows using the market model, market-adjusted, and mean-adjusted

methods are shown in Tables 4, 5, and 6, respectively.

The results using the market model (Table 4) show that the mean CAR value for the 3-

day (-1, +1) event window is positive (0.36%), while its value for the 21-day (-10, +10) event

window is 1.74%. The median CAR values are negative for the 21-day event window.

However, none of the values (neither mean nor median) are significant at the 5% level. The

results show that the mean CAR values increase as the event window period increases. This

shows that share prices take time to show the positive impact of an acquisition. However, the

statistical significance of these values is not established at the 5% level.

Table 4: Shareholder Value of Acquirers Using Market Model

Mean Median

Period

CAR Value

(%) Z-value

Null

Hypothesis

CAR

Value (%) Z-value

Null

Hypothesis

(-1, +1) 0.36 0.53 Fail to reject 0.33 0.27 Fail to reject

(-2, +2) 1.13 1.38 Fail to reject 0.79 0.27 Fail to reject

(-5, +5) 1.61 1.37 Fail to reject 1.26 1.63 Fail to reject

(-10, +10) 1.74 0.90 Fail to reject -2.19 -1.63 Fail to reject

(-1, 0) 0.33 0.57 Fail to reject 0.10 0.27 Fail to reject

(-10, 0) 0.31 0.23 Fail to reject 1.19 0.82 Fail to reject

(-10, +1) 0.34 0.27 Fail to reject 0.92 1.09 Fail to reject

(0, +1) 0.24 0.46 Fail to reject 0.16 0.82 Fail to reject

(0, +10) 1.65 1.08 Fail to reject -1.36 -1.09 Fail to reject

(-1, +10) 1.77 1.09 Fail to reject -1.40 -1.36 Fail to reject

16

The results using the market-adjusted method (Table 5) illustrate that the mean CAR

value for the 3-day (-1, +1) event window is negative (-1.69%), while its value for the 21-day

(-10, +10) event window is 1.69%. For an asymmetrical event window such as a 12-day (-1,

+10) window, the CAR value stands at 1.27%, while for a 2-day (-1, 0) window, the CAR

value stands at -0.82%. Once again, we notice that the mean CAR increases with an increase

in the event window period. However, the statistical significance of these values is not

established.

Table 5: Shareholder Value of Acquirers Using Market-Adjusted Method

Mean Median

Period

CAR

Value

(%) Z-value

Null

Hypothesis

CAR

Value

(%) Z-value

Null

Hypothesis

(-1, +1) -1.69 -1.46 Fail to reject -2.30 -1.91 Fail to reject

(-2, +2) -0.28 -0.21 Fail to reject 0.72 0.82 Fail to reject

(-5, +5) 2.20 1.17 Fail to reject 1.40 0.54 Fail to reject

(-10, +10) 1.69 0.65 Fail to reject -0.08 0.00 Fail to reject

(-1, 0) -0.82 -0.87 Fail to reject -0.64 -1.63 Fail to reject

(-10, 0) -0.40 -0.19 Fail to reject 2.22 0.82 Fail to reject

(-10, +1) -1.27 -0.60 Fail to reject 1.19 0.82 Fail to reject

(0, +1) -0.84 -0.93 Fail to reject -0.58 -0.54 Fail to reject

(0, +10) 2.12 1.06 Fail to reject 2.16 1.63 Fail to reject

(-1, +10) 1.27 0.60 Fail to reject 2.67 1.36 Fail to reject

The results of the mean-adjusted method (Table 6) show that the mean CAR value for 3

days (-1, +1) is negative (-0.61%), while its value for 21 days (-10, +10) is 1.35%. For an

asymmetrical event window like 12 days (-1, +10), the CAR value stands at 1.22%, while for

2 days (-1, 0), the CAR value stands at -0.18%. Once again, we notice that the CAR value

increases as the event window increases. That is, the share price takes time to reflect the

positive impact of an acquisition. However, the mean and median CAR are not significant at

the 5% level.

Therefore, based on all three methods of abnormal return estimation, we report that the

Indian acquirers neither create nor destroy shareholder value. Our results of the shareholder

value of acquirers are very similar to the results of Banerjee et al. (2014), who showed that

Indian acquirers did not create shareholder value during or after 2007. Our sample starts from

the year 2007. One of the important contributions of our analysis is to show that the results

are robust across several methodologies and event windows. These results are based on a

17

recent acquisition sample while most prior studies examining the shareholder value of Indian

acquirers did not use recent acquisitions data.

Table 6: Shareholder Value of Acquirers Using Mean-Adjusted Method

Mean Median

Period

CAR

Value

(%) Z-value

Null

Hypothesis

CAR

Value

(%) Z-value

Null

Hypothesis

(-1, +1) -0.61 -0.77 Fail to reject -1.47 -1.36 Fail to reject

(-2, +2) 0.41 0.43 Fail to reject 0.08 0.00 Fail to reject

(-5, +5) 1.64 1.10 Fail to reject 1.60 1.36 Fail to reject

(-10, +10) 1.35 0.61 Fail to reject -1.88 -0.27 Fail to reject

(-1, 0) -0.18 -0.26 Fail to reject -0.41 -0.27 Fail to reject

(-10, 0) -0.06 -0.04 Fail to reject 0.46 0.27 Fail to reject

(-10, +1) -0.49 -0.33 Fail to reject -0.37 -0.27 Fail to reject

(0, +1) -0.31 -0.51 Fail to reject -0.23 -0.27 Fail to reject

(0, +10) 1.53 0.90 Fail to reject 0.07 0.00 Fail to reject

(-1, +10) 1.22 0.67 Fail to reject -0.46 -0.54 Fail to reject

5.2 Shareholder Value of Targets

The results of the mean and median cumulative abnormal return (CAR) of the targets

with various event windows using the market model, market-adjusted, and mean-adjusted

methods are shown in Tables 7, 8, and 9, respectively.

Table 7: Shareholder Value of Targets Using Market Model

Mean Median

Period

CAR

Value

(%) Z-value

Null

Hypothesis

CAR

Value

(%) Z-value

Null

Hypothesis

(-1, +1) 0.51 0.42 Fail to reject 0.91 1.36 Fail to reject

(-2, +2) 0.68 0.54 Fail to reject 2.00 1.36 Fail to reject

(-5, +5) 0.83 0.42 Fail to reject 0.63 1.09 Fail to reject

(-10, +10) -1.19 -0.34 Fail to reject 1.40 0.82 Fail to reject

(-1, 0) 0.24 0.26 Fail to reject 0.39 0.27 Fail to reject

(-10, 0) -0.44 -0.17 Fail to reject 0.09 0.00 Fail to reject

(-10, +1) -0.17 -0.06 Fail to reject 0.77 0.54 Fail to reject

(0, +1) 0.42 0.46 Fail to reject -0.30 -0.54 Fail to reject

(0, +10) -0.60 -0.31 Fail to reject -2.09 -1.09 Fail to reject

(-1, +10) -0.51 -0.25 Fail to reject -0.76 -0.54 Fail to reject

18

Table 8: Shareholder Value of Targets Using Market-Adjusted Method

Mean Median

Period

CAR

Value

(%) Z-value

Null

Hypothesis

CAR

Value

(%) Z-value

Null

Hypothesis

(-1, +1) -1.45 -0.93 Fail to reject -0.48 -0.27 Fail to reject

(-2, +2) -0.86 -0.52 Fail to reject 0.62 0.27 Fail to reject

(-5, +5) 1.33 0.56 Fail to reject 0.95 0.27 Fail to reject

(-10, +10) -1.37 -0.36 Fail to reject 2.48 1.09 Fail to reject

(-1, 0) -0.83 -0.71 Fail to reject 0.36 0.27 Fail to reject

(-10, 0) -0.77 -0.24 Fail to reject 1.65 0.82 Fail to reject

(-10, +1) -1.39 -0.41 Fail to reject 2.98 1.09 Fail to reject

(0, +1) -0.61 -0.51 Fail to reject -0.26 -0.82 Fail to reject

(0, +10) -0.59 -0.24 Fail to reject 0.49 0.27 Fail to reject

(-1, +10) -1.43 -0.56 Fail to reject 1.32 0.27 Fail to reject

The results of the mean and median CAR of targets with different event windows using

the market model show that the targets do not create shareholder value since neither the mean

nor the median CAR is significant at the 5% level. The results obtained using the market-

adjusted and mean-adjusted methods are qualitatively very similar. However, there is a lot of

variation in the value of the mean and median CAR based on the abnormal return estimation

method and the event window period. These results are important since the results from

developed markets show that targets create significant shareholder value at the time of

acquisitions (Andrade et al., 2001). Our results are in complete contrast with the findings

reported for developed markets.

Table 9: Shareholder Value of Targets Using Mean-Adjusted Method

Mean Median

Period

CAR

Value

(%) Z-value

Null

Hypothesis

CAR

Value

(%) Z-value

Null

Hypothesis

(-1, +1) -0.35 -0.27 Fail to reject 0.03 0.00 Fail to reject

(-2, +2) -0.13 -0.10 Fail to reject 1.10 0.82 Fail to reject

(-5, +5) 0.84 0.39 Fail to reject 1.01 1.09 Fail to reject

(-10, +10) -1.55 -0.42 Fail to reject 0.68 0.27 Fail to reject

(-1, 0) -0.18 -0.19 Fail to reject 0.30 0.82 Fail to reject

(-10, 0) -0.36 -0.13 Fail to reject -0.60 -0.27 Fail to reject

(-10, +1) -0.53 -0.17 Fail to reject -1.48 -0.27 Fail to reject

(0, +1) -0.06 -0.06 Fail to reject -0.40 -1.36 Fail to reject

(0, +10) -1.08 -0.51 Fail to reject -1.12 -0.54 Fail to reject

(-1, +10) -1.37 -0.60 Fail to reject 0.38 0.27 Fail to reject

19

These results are surprising since one expects the targets to be acquired at a premium.

The change in the share price of target firms should adjust accordingly at the time of

acquisition. Although we are not certain why we get these surprising results, we postulate two

possible reasons for these results. First, we notice that 11 of the 54 deals in our sample were

intra-group acquisitions or restructurings. Since there is no change in control/management in

intra-group mergers, the shareholders of the target firms do not benefit from the acquisition.

Second, the sample period of this study is from 2007 to 2013. This period coincided

with the global financial crisis and relatively slower economic growth in India, especially

during 2012 and 2013. This period was not a “normal period” for restructuring activities.

Therefore, the market reaction to target firms during this period may not have been same as

the market reaction during a “normal period” of economic activities would be. Further

investigation is required to determine the exact reason for these results.

5.3 Combined Returns of Acquirers and Targets

The calculated combined returns of acquirers and targets using all three methodologies

are shown in Tables 10, 11, and 12. The calculated combined returns of acquirers and targets

are market-cap-weighted returns using different windows and all three methodologies.

Table 10: Combined Returns of Acquirers and Targets Using Market Model

Mean Median

Period

CAR

Value

(%) Z-value

Null

Hypothesis

CAR

Value

(%) Z-value

Null

Hypothesis

(-1, +1) 0.54 0.80 Fail to reject 0.58 1.09 Fail to reject

(-2, +2) 1.04 1.30 Fail to reject 0.77 0.82 Fail to reject

(-5, +5) 1.16 0.98 Fail to reject 0.51 0.54 Fail to reject

(-10, +10) 0.96 0.49 Fail to reject -1.58 -1.09 Fail to reject

(-1, 0) 0.43 0.72 Fail to reject 0.16 0.27 Fail to reject

(-10, 0) -0.23 -0.18 Fail to reject -0.11 0.00 Fail to reject

(-10, +1) -0.12 -0.10 Fail to reject -0.18 -0.27 Fail to reject

(0, +1) 0.37 0.74 Fail to reject 0.42 1.36 Fail to reject

(0, +10) 1.45 0.98 Fail to reject -1.45 -1.36 Fail to reject

(-1, +10) 1.62 1.01 Fail to reject -0.91 -0.82 Fail to reject

20

Table 11: Combined Returns of Acquirers and Targets Using Market-Adjusted Method

Mean Median

Period

CAR

Value

(%)

Z-

value

Null

Hypothesis

CAR

Value

(%)

Z-

value Null Hypothesis

(-1, +1) -1.49 -1.29 Fail to reject -2.05 -1.63 Fail to reject

(-2, +2) -0.35 -0.26 Fail to reject 0.31 0.27 Fail to reject

(-5, +5) 1.83 0.96 Fail to reject 1.32 0.54 Fail to reject

(-10, +10) 1.19 0.46 Fail to reject 1.24 0.27 Fail to reject

(-1, 0) -0.71 -0.75 Fail to reject -0.78 -1.36 Fail to reject

(-10, 0) -0.66 -0.32 Fail to reject 2.79 1.09 Fail to reject

(-10, +1) -1.44 -0.69 Fail to reject 1.09 0.27 Fail to reject

(0, +1) -0.67 -0.75 Fail to reject -0.20 -0.54 Fail to reject

(0, +10) 1.96 1.02 Fail to reject 2.28 1.91 Fail to reject

(-1, +10) 1.13 0.56 Fail to reject 2.15 1.09 Fail to reject

Table 12: Combined Returns of Acquirers and Targets Using Mean-Adjusted Method

Mean Median

Period

CAR

Value

(%) Z-value Null Hypothesis

CAR

Value

(%) Z-value Null Hypothesis

(-1, +1) -0.43 -0.56 Fail to reject -1.15 -1.63 Fail to reject

(-2, +2) 0.30 0.32 Fail to reject 0.28 0.00 Fail to reject

(-5, +5) 1.18 0.79 Fail to reject 0.75 1.63 Fail to reject

(-10, +10) 0.68 0.32 Fail to reject -0.75 0.00 Fail to reject

(-1, 0) -0.09 -0.13 Fail to reject -0.47 -0.82 Fail to reject

(-10, 0) -0.41 -0.28 Fail to reject -0.35 -0.27 Fail to reject

(-10, +1) -0.75 -0.53 Fail to reject -1.60 -0.54 Fail to reject

(0, +1) -0.15 -0.26 Fail to reject -0.06 -0.54 Fail to reject

(0, +10) 1.28 0.81 Fail to reject 0.24 0.27 Fail to reject

(-1, +10) 1.00 0.58 Fail to reject -0.60 -0.82 Fail to reject

As expected, the mean of the combined returns of acquirers and targets is very less in

all the three methodologies. Neither the mean nor the median CAR is statistically significant

at the 5% significance level.

5.4 Control Premium Paid by Acquirers

Since, there are no significant returns to acquirers, targets, and both combined

(acquirers and targets), we want to examine the control premium paid to the acquirers by

targets in these deals. The SAST does not provide data related to the control premium paid in

the deals. We calculated the total control premium and control premium in percentage paid in

21

the deals by collecting data from the websites of business newspapers. However, all the data

were not available. Therefore, these values correspond to only 18 deals. The control premium

data are presented in Table 13. As shown in Table 13, the mean control premium is

insignificant. However, the median control premium is significant.

6. Conclusions

This paper examines the gain to the shareholders of Indian acquirers and targets during

the period 2007–2013 using 54 acquisitions where change of control happened in the target

firm. To get robust results, we use three alternate methods of abnormal returns estimation,

i.e., the market model, the market-adjusted method, and the mean-adjusted method. The

results show that acquirers neither create nor destroy shareholder value. We find similar

results for target firms. One of the important contributions of our analysis is to show that the

results are robust across several methodologies and event windows. These results are based

on a recent acquisition sample; most of the extant studies examining the shareholder value of

Indian acquirers do not use recent acquisitions data. The results regarding the shareholder

value of targets are in complete contrast with the existing evidence from developed markets;

therefore, this study open a new avenue for future research in this area. Additionally, our

sample consists of targets where change in control happened; thus, we are able to determine

the shareholder value of targets when there is a change in control. However, this restriction

limits the number of acquisitions used in the sample to a relatively small number.

Table 13: Control Premium Paid in the Deals

Control

Premium

(INR Million)

Z-Value Null

Hypothesis

Control

Premium

(%)

Z-Value Null

Hypothesis

Min -2040.05 NA NA -0.85 NA NA

Max 6542.55 NA NA 13.78 NA NA

Mean 711.38 1.81 Fail to reject 1.21 1.57 Fail to reject

Median 120.04 3.30 Reject 0.30 3.30 Reject

Standard

Deviation 1668.35

NA

NA 3.26

NA

NA

22

References

Agarwal, M., and A. Bhattacharjea. 2006. Mergers in India. A Response to Regulatory

Shocks. Emerging Markets Finance and Trade 42 (3):46-65.

Agarwal, M., and A. Bhattacharjea. 2008. Are Merger Regulations Diluting Parliamentary

Intent? Economic and Political Weekly:10-13.

Ahern, K. R. (2009).Sample selection and event study estimation. Journal of Empirical

Finance, 16(3), 466-482

Anderson, D. R., D. J. Sweeney, and T. A. Williams. 2011. Statistics for Business and

economics 11e; Cengage Learning, Delhi, India, pp. 817-818.

Andrade, G., Mitchell, M., Stafford, E., 2001.New Evidence and Perspectives on Mergers.

Journal of Economic Perspectives 15, 103-120.

Aktas, N., E. de Bodt, and R. Roll. 2011. Serial acquirer bidding: An empirical test of the

learning hypothesis. Journal of Corporate Finance 17 (1):18-32.

Alexandridis, G., D. Petmezas, and N. G. Travlos. 2010. Gains from Mergers and

Acquisitions Around the World: New Evidence. Financial Management 39 (4):1671-

1695.

Banerjee, P., P. Banerjee, S. De, J. Jindra, and J. Mukhopadhyay. 2014. Acquisition pricing

in India during 1995-2011: Have Indian acquirers really beaten the odds? Journal of

Banking & Finance 38:14-30

Bae, K. H., J. K. Kang, and J. M. Kim. 2002. Evidence from Mergers by Korean Business

Groups: Tunneling or Value Added? Journal of Finance 57 (6):2695-2740.

Beena, P. 2008. Trends and Perspectives on Corporate Mergers in Contemporary India.

Economic and Political Weekly:48-56.

Bhagat, S., S. Malhotra, and P. Zhu. 2011. Emerging country cross-border acquisitions:

Characteristics, acquirer returns and cross-sectional determinants. Emerging Markets

Review 12 (3):250-271.

Bhaumik, S. K., and E. Selarka. 2012. Does ownership concentration improve M&A

outcomes in emerging markets?: Evidence from India. Journal of Corporate Finance 18

(4):717-726.

Bradley, M., A. Desai, and E. H. Kim. 1988. Synergistic gains from corporate acquisitions

and their division between the stockholders of target and acquiring firms. Journal of

Financial Economics 21 (1):3-40.

23

Brown, S. J., and J. B. Warner. 1985. Using daily stock returns: The case of event

studies. Journal of Financial Economics 14 (1):3-31.

Chakrabarti, R. 2008. Do Indian Acquisitions Add Value? Money & Finance:61-73.

Chari, A., P. P. Ouimet, and L. L. Tesar. 2010. The value of control in emerging markets.

Review of Financial Studies 23 (4):1741-1770.

Draper, P., and K. Paudyal. 2006. Acquisitions: private versus public. European Financial

Management 12 (1):57-80.

Gubbi, S. R., P. S. Aulakh, S. Ray, M. B. Sarkar, and R. Chittoor. 2010. Do international

acquisitions by emerging-economy firms create shareholder value? The case of Indian

firms. Journal of International Business Studies 41 (3):397-418.

Huang, Y. S., and R. A. Walkling. 1987. Target abnormal returns associated with acquisition

announcements: Payment, acquisition form, and managerial resistance. Journal of

Financial Economics 19 (2):329-349.

Jensen, M. C. 1986. Agency Costs of Free Cash Flow, Corporate Finance, and Takeovers.

American Economic Review 76 (2):323.

Jensen, M. C., and R. S. Ruback. 1983. The market for corporate control. Journal of Financial

Economics 11 (1-4):5-50.

Kumar, B. R., and P. Rajib. 2007b. Characteristics of Merging Firms in India: An Empirical

Examination. Vikalpa: The Journal for Decision Makers 32 (1):27-44.

Malmendier, U., and G. Tate. 2008. Who makes acquisitions? CEO overconfidence and the

market's reaction. Journal of Financial Economics 89 (1):20-43.

Mathew, S. J. 2007. Hostile Takeovers in India: New Prospects, Challenges, and Regulatory

Opportunities. Columbia Business Law Review 2007 (3):800-843.

Moeller, S. B., F. P. Schlingemann, and R. M. Stulz. 2005. Wealth Destruction on a Massive

Scale? A Study of Acquiring-Firm Returns in the Recent Merger Wave. Journal of

Finance 60 (2):757-782.

Morck, R., A. Shleifer, and R. W. Vishny. 1989. Do managerial objectives drive bad

acquisitions?: National Bureau of Economic Research.

Pawaskar, V. 2001. Effect of mergers on corporate performance in India. Vikalpa 26 (1):19-

32.

Roll, R. 1986. The hubris hypothesis of corporate takeovers. Journal of Business:197-216.

Varaiya, N. P. 1988. The „winner's curse‟ hypothesis and corporate takeovers. Managerial

and Decision Economics 9 (3):209-219.

24

Zhu, P., and S. Malhotra. 2008. Announcement Effect and Price Pressure: An Empirical

Study of Cross-Border Acquisitions by Indian Firms. International Research Journal of

Finance & Economics (13):24-41.

25

Appendix 1

Glossary of Technical Terms

Event date: The date on which an event occurs, i.e., announcement date.

Announcement date: The date on which there is a public announcement of a merger or

acquisition.

Event Period: The time period over which someone observes the market reaction. It is

usually several days before and after the event (merger or acquisition).

Normal Return: The expected return of the stock had there not been any event (merger or

acquisition).

Estimation Period: The time period over which someone observes the behaviour of stock

price movement in order to calculate normal return.

Excess Return or Abnormal Return: The difference between actual stock return and expected

normal return.

26

Appendix 2: List of Acquirers and Targets in Sample

Acquirer Name Acquirer Industry Target Name Target Industry

Holding Before

Acquisition

(%)

Holding After

Acquisition

(%)

Same

Promoter

Group

Announcement

Date

Bajaj Hindusthan Ltd. Sugar

Bajaj Hindusthan Sugar

& Inds. Ltd. [Merged] Sugar 38.45 54.52

No 13-Feb-07

Rane Holdings Ltd.

Other financial

services Rane (Madras) Ltd.

Other automobile

ancillaries 41.77 51.24

No 14-Mar-07

Mahindra & Mahindra

Ltd. Diversified

Punjab Tractors Ltd.

[Merged] Tractors 19.84 63.17

No 12-Jul-07

Bajaj Hindusthan Ltd. Sugar

Bajaj Hindusthan Sugar

& Inds. Ltd. [Merged] Sugar 25.87 74.18

No 28-Dec-07

Amtek Auto Ltd.

Other automobile

ancillaries

Ahmednagar Forgings

Ltd.

Castings &

forgings 47.73 52.6

No 21-Jan-08

Mahindra & Mahindra

Ltd. Diversified

Mahindra C I E

Automotive Ltd.

Castings &

forgings 19.25 60.56

No 31-Jan-08

Tata Steel Ltd. Steel Tata Metaliks Ltd. Pig iron 47.66 50.05 No 08-Feb-08

Industrial Investment

Trust Ltd.

Other financial

services I I T L Projects Ltd.

Commercial

complexes 0 50.17

No 08-May-08

Idea Cellular Ltd.

Telecommunication

services

Spice Communications

Ltd. [Merged]

Telecommunication

services 39.49 80.29

No 09-Jul-08

Mindtree Ltd. Computer software Aztecsoft Ltd. [Merged] Computer software 47.77 79.9 No 28-Jul-08

Transwarranty Finance

Ltd.

Other fund based

financial services Vertex Securities Ltd. Securities broking 0 55.05

No 30-Jul-08

Apar Industries Ltd. Diversified

Uniflex Cables Ltd.

[Merged] Wires & cables 49.13 63.1

No 11-Aug-08

Mahindra & Mahindra

Ltd. Diversified

Mahindra Ugine Steel

Co. Ltd. Steel 0 50.69

No 20-Aug-08

Emami Ltd.

Drugs &

pharmaceuticals Zandu Realty Ltd.

Commercial

complexes 27.51 50.33

No

24-Oct-08

Tata Steel Ltd. Steel Tayo Rolls Ltd. Steel 19.49 54.45 No 04-Dec-08

Cadila Healthcare Ltd.

Drugs &

pharmaceuticals Zydus Wellness Ltd.

Vegetable oils &

products 8.79 70.21

No 03-Mar-09

Aditya Birla Nuvo Ltd. Other textiles Aditya Birla Money Ltd. Securities broking 20 76 No 12-Mar-09

Dabur India Ltd.

Cosmetics,

toiletries, soaps &

detergents

Fem Care Pharma Ltd.

[Merged]

Cosmetics,

toiletries, soaps &

detergents 20 92.15

No 27-Jun-09

Rane Holdings Ltd.

Other financial

services Rane Engine Valve Ltd.

Other automobile

ancillaries 44.56 51.98

No 12-Oct-09

27

Appendix 2 continued

Acquirer Name Acquirer Industry Target Name Target Industry

Holding Before

Acquisition

(%)

Holding After

Acquisition

(%)

Same

Promoter

Group

Announcement

Date

Tata Chemicals Ltd. Other chemicals Rallis India Ltd. Pesticides 45.97 50.06 No 11-Nov-09

Amtek Auto Ltd.

Other automobile

ancillaries

Ahmednagar Forgings

Ltd. Castings & forgings 49.97 54.95

No 17-Nov-09

West Coast Paper

Mills Ltd. Paper & newsprint

Shree Rama Newsprint

Ltd. Paper & newsprint 37.23 53.16

No 18-Jan-10

Jaiprakash Associates

Ltd. Diversified

Jaiprakash Power

Ventures Ltd.

Electricity

generation 14.84 76.25

No 19-Jan-10

Inox Leisure Ltd. Exhibition of films

Fame India Ltd.

[Merged] Exhibition of films 43.27 50.48

No 09-Feb-10

Mahindra & Mahindra

Ltd. Diversified

Mahindra C I E

Automotive Ltd. Castings & forgings 47.29 50.71

No 05-Mar-10

I C I C I Bank Ltd. Banking services

Western India Shipyard

Ltd. Metal products 3.88 64.14

No 29-Mar-10

Tube Investments Of

India Ltd. Metal products

Cholamandalam

Investment & Finance

Co. Ltd.

Auto finance

services 50 100

No 04-May-10

Bajaj Finserv Ltd.

Other financial

services Bajaj Finance Ltd.

Other asset

financing services 44.64 50.42

No 07-Jul-10

E I D-Parry (India)

Ltd. Sugar Parrys Sugar Inds. Ltd. Sugar 12.18 65

No 30-Aug-10

A B G Shipyard Ltd.

Other transport

equipment

Western India Shipyard

Ltd. Metal products 19.69 60.26

No 15-Oct-10

Bombay Rayon

Fashions Ltd. Cloth S T I India Ltd.

Cotton & blended

yarn 0 70.56

No 01-Nov-10

Capital First Ltd.

Other asset

financing services

Cable Corpn. Of India

Ltd. Wires & cables 32.99 51.83

No 28-Jan-11

Godawari Power &

Ispat Ltd. Metal products Hira Ferro Alloys Ltd. Trading 1.32 51.25

No 04-Apr-11

United Breweries

(Holdings) Ltd. Trading Kingfisher Airlines Ltd.

Air transport

services 35.4 58.61

No 07-Apr-11

Kirloskar Brothers

Invst. Ltd.

Other fund based

financial services

Kirloskar Pneumatic Co.

Ltd.

General purpose

machinery 35.4 50.58

No 25-May-11

United Spirits Ltd. Beer & alcohol Pioneer Distilleries Ltd. Organic chemicals 27.3 81.99 No 27-May-11

Network18 Media &

Invst. Ltd.

Business

consultancy Tv18 Broadcast Ltd. Media-broadcasting 38.07 58.43

No 06-Jul-11

Appendix 2 continued

28

Acquirer Name Acquirer Industry Target Name Target Industry

Holding Before

Acquisition

(%)

Holding After

Acquisition

(%)

Same

Promoter

Group

Announcement

Date

Mahindra & Mahindra

Ltd. Diversified

Mahindra C I E

Automotive Ltd. Castings & forgings 48.31 52.97 No

05-Sep-11

Comfort Intech Ltd.

Other asset

financing services

Ravikumar Distilleries

Ltd. Beer & alcohol 9.87 61.63

No 07-Dec-11

Coromandel

International Ltd. Fertilisers

Sabero Organics Gujarat

Ltd. Pesticides 36.75 67.75 No

19-Dec-11

Comfort Intech Ltd.

Other asset

financing services

8K Miles Software

Services Ltd. Computer software 4.32 68.44

No 24-Jan-12

Network18 Media &

Invst. Ltd.

Business

consultancy Tv18 Broadcast Ltd. Media-broadcasting 49.99 51.24

Yes 21-Feb-12

Bajaj Finserv Ltd.

Other financial

services Bajaj Finance Ltd.

Other asset

financing services 49.63 60.98

Yes 02-Apr-12

Sterlite Industries

(India) Ltd.

Copper & copper

products Hindustan Zinc Ltd.

Other non-ferrous

metals 0 64.92

Yes 20-Apr-12

Tata Global Beverages

Ltd. Tea

Mount Everest Mineral

Water Ltd. Processed foods 45.09 50.07

Yes 03-May-12

Mahindra & Mahindra

Ltd. Diversified E P C Industries Ltd.

Plastic tubes, pipes,

fittings & sheets 23.82 54.83

Yes 11-Jun-12

Tata Steel Ltd. Steel

Tinplate Co. Of India

Ltd.

Other non-ferrous

metals 42.88 59.45

No 11-Jul-12

Tata Steel Ltd. Steel Tata Sponge Iron Ltd. Sponge iron 39.74 51 Yes 28-Aug-12

Network18 Media &

Invst. Ltd.

Business

consultancy Tv18 Broadcast Ltd. Media-broadcasting 10.84 51.24

Yes 31-Oct-12

Tube Investments Of

India Ltd. Metal products Shanthi Gears Ltd.

General purpose

machinery 44.12 70.12

Yes 20-Nov-12

Axis Bank Ltd. Banking services

Cinemax India Ltd.

[Merged] Exhibition of films 0 65.8 No

04-Dec-12

Coromandel

International Ltd. Fertilisers

Liberty Phosphate Ltd.

[Merged] Fertilisers 48.62 53.63 Yes

22-Mar-13

Kirloskar Industries

Ltd.

Other fund based

financial services

Kirloskar Ferrous Inds.

Ltd. Pig iron 48.66 51.43

Yes 31-May-13

Era Infra Engg. Ltd.

Industrial

construction Apex Buildsys Ltd. Metal products 8.75 56.61 Yes

23-Dec-13


Recommended