82
WHO guidance for measuring maternal mortality from a census
WHO guidance for measuring maternal mortality from a census

WHO guidance for measuring maternal mortality from
a census
ii
WHO Library Cataloguing-in-Publication Data
WHO guidance for measuring maternal mortality from a census.
1.Censuses. 2.Maternal mortality. 3.Population surveillance. 4.Data collection. I.World Health Organization.
ISBN 978 92 4 150611 3 (NLM classification: WA 900)
© World Health Organization 2013
All rights reserved. Publications of the World Health Organization are available on the WHO web site (www.who.int) or can
be purchased from WHO Press, World Health Organization, 20 Avenue Appia, 1211 Geneva 27, Switzerland (tel.: +41 22 791
3264; fax: +41 22 791 4857; e-mail: [email protected]).
Requests for permission to reproduce or translate WHO publications –whether for sale or for non-commercial distribution–
should be addressed to WHO Press through the WHO web site (www.who.int/about/licensing/copyright_form/en/index.
html).
The designations employed and the presentation of the material in this publication do not imply the expression of any
opinion whatsoever on the part of the World Health Organization concerning the legal status of any country, territory, city
or area or of its authorities, or concerning the delimitation of its frontiers or boundaries. Dotted lines on maps represent
approximate border lines for which there may not yet be full agreement.
The mention of specific companies or of certain manufacturers’ products does not imply that they are endorsed or
recommended by the World Health Organization in preference to others of a similar nature that are not mentioned. Errors
and omissions excepted, the names of proprietary products are distinguished by initial capital letters.
All reasonable precautions have been taken by the World Health Organization to verify the information contained in this
publication. However, the published material is being distributed without warranty of any kind, either expressed or implied.
The responsibility for the interpretation and use of the material lies with the reader. In no event shall the World Health
Organization be liable for damages arising from its use.
The named authors alone are responsible for the views expressed in this publication.
iii
WHO guidance for measuring maternal mortality from a census
Contents
Acknowledgements v
Abbreviations and acronyms v
Preface vi
1. Introduction 1 1.1 Indicators of maternal and pregnancy-related mortality 2
1.1.1 Definitions 2
1.1.2 Data collection 3
1.1.3 Maternal mortality indicators 3
1.1.4 Pregnancy-related mortality indicators 4
1.2 Conclusion 5
2. Issues to consider regarding the measurement of maternal mortality in a census 7 2.1 Are there other, recent, empirical, national-level estimates of maternal mortality for this country? 7
2.2 Is the census already too long to justify incorporating additional questions on maternal mortality? 7
2.3 How important is it for planning purposes to have subnational estimates of maternal mortality? 8
2.4 How precise are the maternal mortality data collected via a census? 9
2.5 How much would it cost to add maternal mortality questions to the census? 10
2.6 Is it feasible to establish collaboration between the statistics office and the ministry of health for the purposes of collecting maternal mortality data via the census? 10
2.7 How and where should the maternal mortality results be disseminated? 11
3. Census questionnaire design, training and tabulation procedures 13 3.1 Census questionnaire design 13
3.1.1 Collection of mortality information in the census 13
3.1.2 Collection of fertility information in the census 16
3.2 Selection and training of field staff 17
3.3 Data entry: keying versus scanning 18
3.4 Computer editing 19
3.4.1 Fertility 19
3.4.2 Mortality 20
3.5 Tabulation layouts 20
iv
WHO guidance for measuring maternal mortality from a census
4. Methods for data evaluation and adjustment 23 4.1 Evaluating the quality of age and sex distributions 25
4.2 Evaluating the completeness of death recording 26
4.2.1 Evaluating the completeness of death recording: single census 27
4.2.2 Evaluating the completeness of death recording: two recent censuses 32
4.3 Evaluating the completeness of birth recording or estimating the numbers of births 47
4.3.1 Evaluating the completeness of birth recording using Brass P/F ratios: single census 47
4.3.2 Evaluating completeness of birth recording using synthetic cohort P/F ratios: two censuses (or comparable sources) 50
4.4 Evaluating the classification of deaths as maternal 53
4.5 Putting it all together 55
4.6 Examples of evaluations from other settings 56
4.6.1 Honduras 1988 to 2001; female deaths 57
4.6.2 Benin 1992 to 2002; female deaths 58
4.6.3 Lao People’s Democratic Republic 1995 to 2005; female deaths 59
5. Results dissemination and use 63 5.1 Suggested outline for a report on maternal mortality 63
References 71
Appendix: Model values of expectation of life e(x) for ratios of 30d10 / 20d40 73
v
WHO guidance for measuring maternal mortality from a census
Abbreviations and acronyms AAD average annual death rate
AAPYL average annual person-years lived by age group
ASAI age–sex accuracy index
ASDR age-specific death rate
ASFR age-specific fertility rate
DHS demographic and health survey
GFR general fertility rate
GGB general growth balance
ICD International Classification of Diseases
Immpact The Initiative for Maternal Mortality Programme Assessment
LTR lifetime risk of maternal death
MMRate maternal mortality rate
MMRatio maternal mortality ratio
MDG Millennium Development Goals
MOH ministry of health
OLS ordinary least squares
P/F parity/fertility (ratio)
PMDF proportion of maternal deaths among all deaths of females of reproductive age
SEG synthetic extinct generations
TFR total fertility rate
UN United Nations
UNICEF United Nations Children’s Fund
WHO World Health Organization
AcknowledgementsThis guidance was written by Kenneth Hill and Michael Levin of Harvard University; Cynthia Stanton from the Initiative for Maternal Mortality Programme Assessment (Immpact); Bernardo Lanza Queiroz of CEDEPLAR, Univesidade de Minas, Brazil; Yoonjoung Choi of the Johns Hopkins Bloomberg School of Public Health, United States of America; Annet WR Mahanani of the World Health Organization and Carla Abou Zahr formerly of the World Health Organization. The guideline was finalized for publication by Lale Say and Doris Chou of the World Health Organization.
This work was undertaken with funding from multiple partners, including: Health Metrics Network; Harvard University Center for Population and Development Studies; the Initiative for Maternal Mortality Programme Assessment (Immpact); a research programme funded from 2002 to 2008 by the Bill and Melinda Gates Foundation; the Department for International Development; the European Commission; and the United States Agency for International Development.
This document advances the concepts first described by Hill K. et al in Measuring Maternal Mortality from a census: guidelines for potential users. MEASURE Evaluation Manual Series, No 4. July 2001.

vi
WHO guidance for measuring maternal mortality from a census
Preface
“What you count is what you do.”
This simple phrase captures the synergistic relationship between measurement and action. There are many examples in the field of global health where this applies – where low priority to reducing a burden reflects, in part, a lack of robust data on its magnitude, determinants and consequences. Maternal mortality has long been cited as one such example. From the launch of the Safe Motherhood Initiative in 1987, to the Global Strategy for Women’s and Children’s Health launched in September 2010 by the United Nations Secretary-General, the need for better data has been, and will continue to be, a common call. This need has been felt particularly acutely at national and global levels, since the Millennium Declaration in 2000 when maternal mortality was propelled into the limelight as the target indicator for one of the eight goals. As 2015 looms closer, the call for better data is even louder. These revised guidelines on measuring maternal mortality using the census are thus most timely.
But this guidance is also significant because of three important messages it conveys. Firstly, the census represents one of several potential options for measuring maternal mortality in low-income countries. These options have expanded considerably over the last 25 years. New tools and approaches have been developed, new ways for capturing maternal deaths have been incorporated into existing sources, and new analytic techniques have been developed for creating model estimates for countries lacking empirical data. In other words, we know how to generate estimates of the level of maternal mortality: the bottlenecks lie more in terms of inadequate investment, both in existing routine systems or special studies and in technical capacity in-country to guide the capture, analysis and interpretation of data. Given these bottlenecks, it is crucial to seek not only opportunities to gather data on maternal deaths efficiently, such as through the census, but also to strengthen capacity. These guidelines support both these imperatives. Secondly, and to return to the opening phrase – data availability is essential to stimulate and inform action. But there is also ample evidence to indicate the importance of local origin and ownership – of decision-makers needing empirical data that are relevant and specific to their decision-making setting. In the absence of complete vital registration, the census remains the only viable option for creating small-area or local-level statistics from complete enumeration of deaths. These guidelines indicate the potential for providing such disaggregated data for decision-making, as well as the limitations – which brings me to the third and final message from these guidelines. There are indeed multiple options today for generating estimates of maternal mortality – fit for different purposes and settings. However, all these options have room for further improvement, as new analytical techniques or instrument adaptation emerge from research and development and – importantly – as experience from application in-country grows and is synthesized. These guidelines reflect that process of continuous improvement, and highlight the essential evaluative step on the pathway to generating useful and usable information for action.
“What you do must be informed by what you count – robustly.” Professor Wendy J Graham, Immpact, University of Aberdeen, Scotland
1
WHO guidance for measuring maternal mortality from a census
Maternal mortality as a global health issue has gained increased recognition over the past two decades, due to its inclusion as a key target indicator in a number of international conferences, such as the 1990 World Summit for Children, the 1994 International Conference on Population and Development and the 1995 World Conference for Women. However, the inclusion of improved maternal health as the fifth United Nations (UN) Millennium Development Goal (MDG) in 2000, and specifying a reduction of three quarters in the maternal mortality ratio between 1990 and 2015 as the primary target of MDG 5 (1), has placed even greater pressure on governments to have systems in place to measure maternal mortality. Although the availability of maternal mortality data has increased over the past decade, as of 2012, there were still 27 countries with no national data on maternal mortality for the previous 10 years (2). Even fewer low- and middle-income countries have multiple and comparable estimates of maternal mortality to provide indications of trends.
Multiple approaches to measuring maternal mortality exist and are in practice around the world. Examples of these approaches are: civil registration systems, sample registration systems, national population censuses, several methods relying on large retrospective household surveys (sibling-based and sisterhood surveys, reproductive-aged mortality studies and verbal autopsies focusing on maternal death), and prospective surveillance of deaths of reproductive-aged women using community-based informants. All of these methods, as well as their advantages, disadvantages and appropriate contexts have been described in detail elsewhere (2, 3). The web site: www.maternal-mortality-measurement.org.uk is a comprehensive source of information on measuring maternal mortality.
A small number of countries experimented in the 1980s and 1990s with using the national census to measure maternal mortality. It had been quite common in countries lacking accurate records of births and deaths to include questions on recent household deaths by age and sex in census questionnaires; the addition of one or more questions to identify deaths of women of reproductive age who were pregnant or within 6 weeks of delivery at the time of death provided information about maternal mortality. In response to the increased need for maternal mortality data after the Millennium Summit in 2000, the second revision of the UN Principles and recommendations for population and housing censuses (4) included questions on household deaths in the 12 months before the census (or other clearly defined recent reference period) as a core topic, and went on to note (paragraph 2.196) that countries “may wish” to add two additional questions about cause of death, as to whether the death was due to accident, violence, homicide or suicide, and, if the deceased was a woman aged 15 to 49 years, whether the woman was pregnant, in childbirth, or within 6 weeks of the end of pregnancy when she died (4). As a result of this addition to the second revision, numerous countries are planning to include the necessary questions in their 2010 round census.
The revised Principles and recommendations for population and housing censuses add (paragraph 2.197) that the information must be “interpreted with caution after careful evaluation and often adjustment” (4). The purpose of this revised manual is to provide users with the latest tools to assist in this evaluation and adjustment.
1. Introduction
2
WHO guidance for measuring maternal mortality from a census
Since publication of the original edition of this manual in 2001 (5), at least 27 countries have used the national population census to measure maternal mortality. The results from three sub-Saharan African countries (Benin, Madagascar and Zimbabwe), one South-East Asian country (the Lao People’s Democratic Republic), three Latin American countries (Honduras, Nicaragua and Paraguay) and one West Asian country (Islamic Republic of Iran) have been published in two journal articles (6, 7). This revised edition of the manual has incorporated their experience by providing a broader range of country examples as compared to the original manual, and by providing annotated spreadsheets developed during data-analysis workshops with some of these countries, to assist users with the evaluation and adjustment of census data on maternal mortality.1
In this chapter, we discuss the maternal mortality indicators measured by the census; Chapter 2 covers issues that government agencies should consider when deciding to add maternal mortality questions to the census; Chapter 3 provides recommendations regarding census questionnaire design, training and data editing and tabulation; Chapter 4 describes in detail the methods for evaluating and adjusting census-based results on maternal mortality; and Chapter 5 lists suggestions regarding the dissemination and use of the results following data evaluation and adjustment.
1.1 Indicators of maternal and pregnancy-related mortality
1.1.1 Definitions
The International Classification of Diseases (ICD), Revision 10, provides three different definitions related to maternal mortality (8), which are listed next.
• Maternal death: a maternal death is the death of a woman while pregnant or within 42 days of the termination of pregnancy, irrespective of the duration and the site of the pregnancy, from any cause related to or aggravated by the pregnancy or its man-agement but not from accidental causes.
• Pregnancy-related death: a pregnancy-related death is the death of a woman while pregnant or within 42 days of termination of pregnancy, irrespective of cause.
• Late pregnancy-related death: a late pregnancy-related death is the death of a woman while pregnant or within 12 months of termination of pregnancy, irrespective of cause.
A true maternal death therefore requires specific cause-of-death information. This is distinguished from pregnancy-related and late pregnancy-related deaths, which are determined solely by the timing of death relative to pregnancy, childbirth and the postpartum period. Thus, whereas true maternal deaths exclude deaths from accidents or violence, pregnancy-related deaths include such deaths if they occur within the specified time range.
1 The Maternal Mortality package contains all spreadsheets discussed in this manual. The package is available and freely downloadable at www.who.int/reproductivehealth/publications/maternal_perinatal_health/monitoring/en/.
3
WHO guidance for measuring maternal mortality from a census
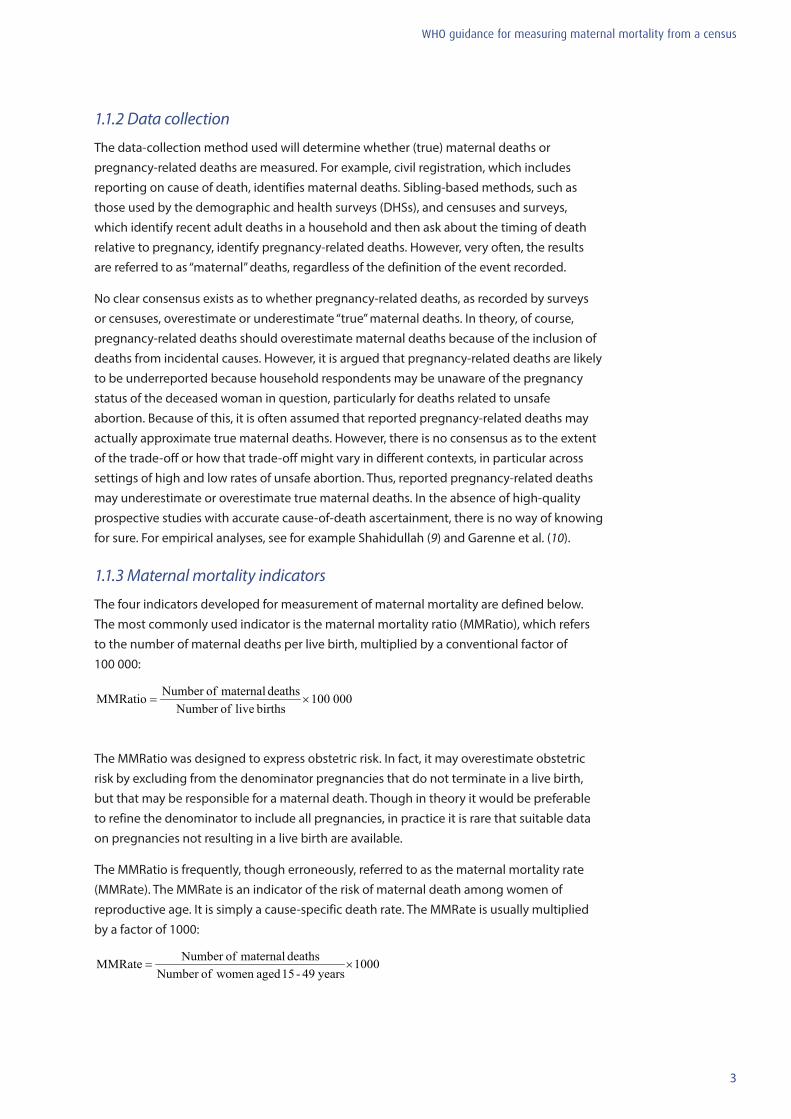
1.1.2 Data collection
The data-collection method used will determine whether (true) maternal deaths or pregnancy-related deaths are measured. For example, civil registration, which includes reporting on cause of death, identifies maternal deaths. Sibling-based methods, such as those used by the demographic and health surveys (DHSs), and censuses and surveys, which identify recent adult deaths in a household and then ask about the timing of death relative to pregnancy, identify pregnancy-related deaths. However, very often, the results are referred to as “maternal” deaths, regardless of the definition of the event recorded.
No clear consensus exists as to whether pregnancy-related deaths, as recorded by surveys or censuses, overestimate or underestimate “true” maternal deaths. In theory, of course, pregnancy-related deaths should overestimate maternal deaths because of the inclusion of deaths from incidental causes. However, it is argued that pregnancy-related deaths are likely to be underreported because household respondents may be unaware of the pregnancy status of the deceased woman in question, particularly for deaths related to unsafe abortion. Because of this, it is often assumed that reported pregnancy-related deaths may actually approximate true maternal deaths. However, there is no consensus as to the extent of the trade-off or how that trade-off might vary in different contexts, in particular across settings of high and low rates of unsafe abortion. Thus, reported pregnancy-related deaths may underestimate or overestimate true maternal deaths. In the absence of high-quality prospective studies with accurate cause-of-death ascertainment, there is no way of knowing for sure. For empirical analyses, see for example Shahidullah (9) and Garenne et al. (10).
1.1.3 Maternal mortality indicators
The four indicators developed for measurement of maternal mortality are defined below. The most commonly used indicator is the maternal mortality ratio (MMRatio), which refers to the number of maternal deaths per live birth, multiplied by a conventional factor of 100 000:
000100births live ofNumber
deaths maternal ofNumber MMRatio ×=
The MMRatio was designed to express obstetric risk. In fact, it may overestimate obstetric risk by excluding from the denominator pregnancies that do not terminate in a live birth, but that may be responsible for a maternal death. Though in theory it would be preferable to refine the denominator to include all pregnancies, in practice it is rare that suitable data on pregnancies not resulting in a live birth are available.
The MMRatio is frequently, though erroneously, referred to as the maternal mortality rate (MMRate). The MMRate is an indicator of the risk of maternal death among women of reproductive age. It is simply a cause-specific death rate. The MMRate is usually multiplied by a factor of 1000:
1000years 49-15 aged women ofNumber
deaths maternal ofNumber MMRate ×=
4
WHO guidance for measuring maternal mortality from a census
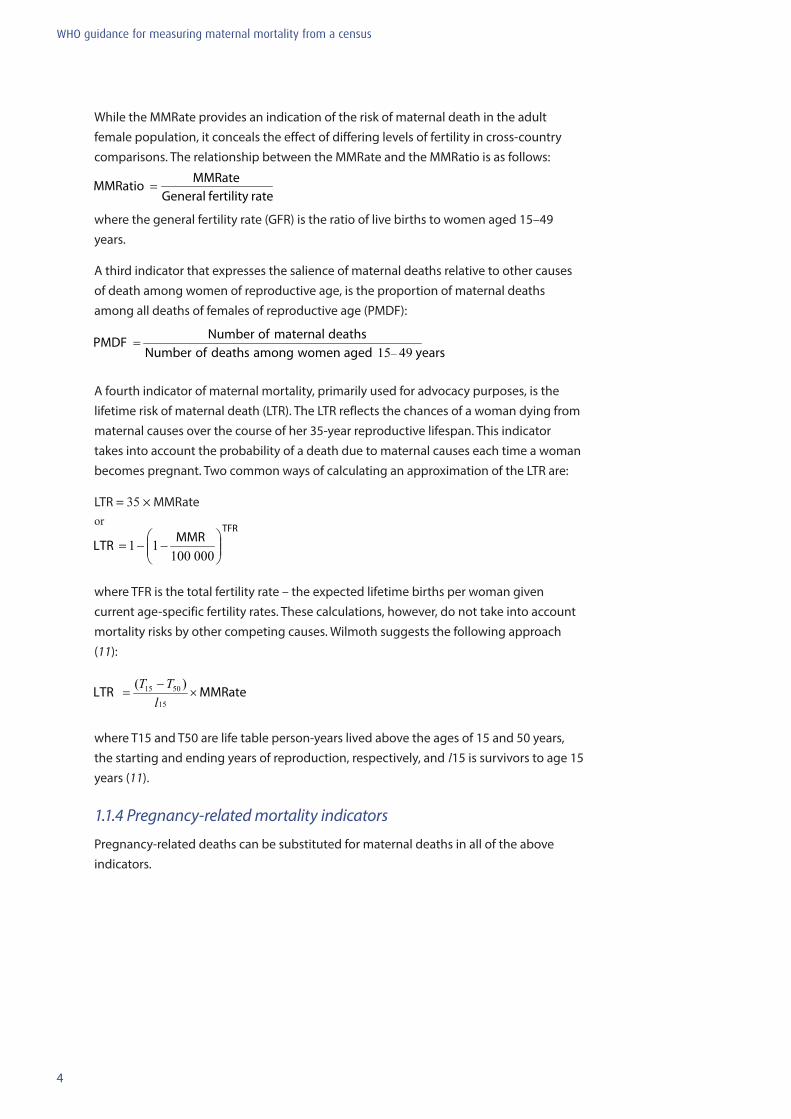
While the MMRate provides an indication of the risk of maternal death in the adult female population, it conceals the effect of differing levels of fertility in cross-country comparisons. The relationship between the MMRate and the MMRatio is as follows:
where the general fertility rate (GFR) is the ratio of live births to women aged 15–49 years.
A third indicator that expresses the salience of maternal deaths relative to other causes of death among women of reproductive age, is the proportion of maternal deaths among all deaths of females of reproductive age (PMDF):
A fourth indicator of maternal mortality, primarily used for advocacy purposes, is the lifetime risk of maternal death (LTR). The LTR reflects the chances of a woman dying from maternal causes over the course of her 35-year reproductive lifespan. This indicator takes into account the probability of a death due to maternal causes each time a woman becomes pregnant. Two common ways of calculating an approximation of the LTR are:
LTR = 35 × MMRate
or
where TFR is the total fertility rate – the expected lifetime births per woman given current age-specific fertility rates. These calculations, however, do not take into account mortality risks by other competing causes. Wilmoth suggests the following approach (11):
where T15 and T50 are life table person-years lived above the ages of 15 and 50 years, the starting and ending years of reproduction, respectively, and l15 is survivors to age 15 years (11).
1.1.4 Pregnancy-related mortality indicators
Pregnancy-related deaths can be substituted for maternal deaths in all of the above indicators.
5
WHO guidance for measuring maternal mortality from a census
1.2 Conclusion
Different aspects of the level of maternal (or pregnancy-related) mortality are reflected in each of the indicators described above. Among them, the MMRatio has received the most attention from policy-makers, programme managers and the donor community. But even with highly precise data, a variety of indicators is needed to understand the level and pattern of maternal mortality. For instance, the interplay between changes in maternal mortality and fertility may produce unexpected results. A decrease in the MMRate may simply be reflecting a decline in fertility, even under circumstances where the risk of maternal death per birth has remained constant. Fewer births result in fewer maternal deaths, even if no new maternal-health interventions are in place. Likewise, the PMDF may change substantially if the cause-of-death structure is altered (for example, due to AIDS mortality). Thus, trends in maternal mortality should be interpreted in light of the risk per woman and per birth, and with consideration of changes in fertility and the distribution of deaths by cause. Ideally, measures of maternal mortality should refer to a clearly specified time period, and clearly reflect each of the following factors:
• the risk of maternal death per woman• the risk of maternal death per birth• the overall level of fertility• the overall level of mortality and distribution by cause.
As mentioned above, by adding questions to a census to identify all household deaths in a recent period, plus additional questions to determine whether deaths to women of reproductive age occurred during pregnancy, childbirth or the postpartum period, the census measures pregnancy-related deaths and not maternal deaths. However, in this manual, census-based pregnancy-related deaths will be referred to as maternal deaths, as is commonly done in the DHSs (12) and in the World Health Organization (WHO) global estimates (2, 13). It should be noted in passing that the census can be combined with the use of a verbal autopsy instrument to try to identify true maternal deaths: the census questions on household deaths can be used to identify deaths of women of reproductive age that can then be followed up with a verbal autopsy after the census has been completed.

6
WHO guidance for measuring maternal mortality from a census
7
WHO guidance for measuring maternal mortality from a census
This chapter outlines issues that government agencies should take into account when making the decision to include additional questions on maternal mortality in the national population census. The issues presented here are based on the experience of countries that have done so over the past decade.
2.1 Are there other, recent, empirical, national-level estimates of maternal mortality for this country?
As mentioned in Chapter 1, the second revision of the UN Principles and recommendations for population and housing censuses recommends inclusion in the census of questions to identify recent household deaths for countries lacking other sources of mortality data, and notes the possibility of identifying maternal deaths (4). In countries lacking a national estimate of maternal mortality, the census offers a method for collecting such data with lower marginal cost (since the census will be held anyway) than an ad hoc large-scale survey, for example.
Countries with an existing estimate of maternal mortality may also be interested in taking advantage of the census in order to have a second estimate for comparative purposes, particularly if the reference period for the existing estimate is long (and thus the reference point is several years prior to the date of data collection). Further, unlike sample surveys, the census will provide enough observations to permit the analysis of differentials in maternal mortality, for example by region or by socioeconomic condition; these differentials may be of considerable value in planning interventions to reduce maternal mortality and achieve the target of MDG5. An additional advantage of using the census to estimate maternal mortality is the existence of well-established methods for evaluating the data, and adjusting for errors if necessary.
2.2 Is the census already too long to justify incorporating additional questions on maternal mortality?
It has to be recognized that adding questions to a census is an entirely different proposition than adding questions to a household survey, given the magnitude of effort required to interview every household in the country. Thus, it is recommended that the maternal mortality questions be added to the census only if there is a clear commitment on the part of the ministry of health (MOH) and other related government agencies to actively use the results once available.
In making this decision, it should be noted that for the case of maternal mortality, two sets of questions need to be added to the questionnaire. First, the age and sex of all recent household deaths must be recorded; these data will allow estimation of infant, child and adult mortality rates (greater detail is provided in Chapter 4 on data evaluation; it should be noted that the information on infant and child deaths may suffer from greater errors than the information on adult deaths, and should not be seen as an alternative to the estimation
2. Issues to consider regarding the measurement of maternal mortality in a census
8
WHO guidance for measuring maternal mortality from a census
of child mortality from census information on children ever born and surviving). These questions, which are household, not individual, questions, are already in fairly common use in censuses in countries lacking complete civil registration, and are recommended for use by all such countries. In addition to these questions, one to three questions are needed to identify the timing of adult female deaths relative to pregnancy, to permit the calculation of maternal (technically speaking, pregnancy-related) mortality indicators. Hence, the additional questions required specifically for maternal mortality are only asked in households reporting the death of a woman aged 15 to 49 years; typically, these will represent less than 1% of households except in settings of high HIV prevalence.
Consequently, the issue to consider is not so much the additional time required to ask the maternal mortality questions, but the space required for these questions on the census questionnaire.
2.3 How important is it for planning purposes to have subnational estimates of maternal mortality?
Subnational estimates of maternal mortality are often required for effective and efficient programme planning, particularly if there are major geographical or cultural differences within a country that affect access to and/or utilization of health care. An important advantage of using the census to measure maternal mortality is that it is possible to obtain subnational estimates, whereas commonly used survey-based methods, such as the sisterhood or sibling-based method, generate only a national estimate.
However, two issues must be considered when making the decision to publish subnational-level MMRatio estimates. These are:
• based on any existing estimate of the MMRatio, approximately how many maternal deaths occur each year? If the number is below about 300, this will limit the number of regions for which one can produce a stable estimate
• one must plan in advance to produce subnational level estimates of the MMRatio and decide how the subnational regions will be defined. Often, the geopolitical regions used by the statistics office for the purposes of the census differ from “health regions” used by the MOH. Ideally, the regions should be defined according to the preferences of the MOH for planning purposes. Where the definitions of regions used by the statistics office differ from those used by the MOH, it is necessary to compile in advance a list of codes for each village, town and city that would allow one to categorize census results by MOH regions. This list of villages, towns and cities must exist somewhere in order for the MOH “health regions” to have been defined. However, experience has shown that locating the list, passing the list from the MOH to the statistics office, and developing a coding scheme for the MOH list can be complicated. Thus, it is recommended that one begins early on this task. If one waits until analysis of the census data is under way, most likely, one will not succeed.
9
WHO guidance for measuring maternal mortality from a census
Table 2.1
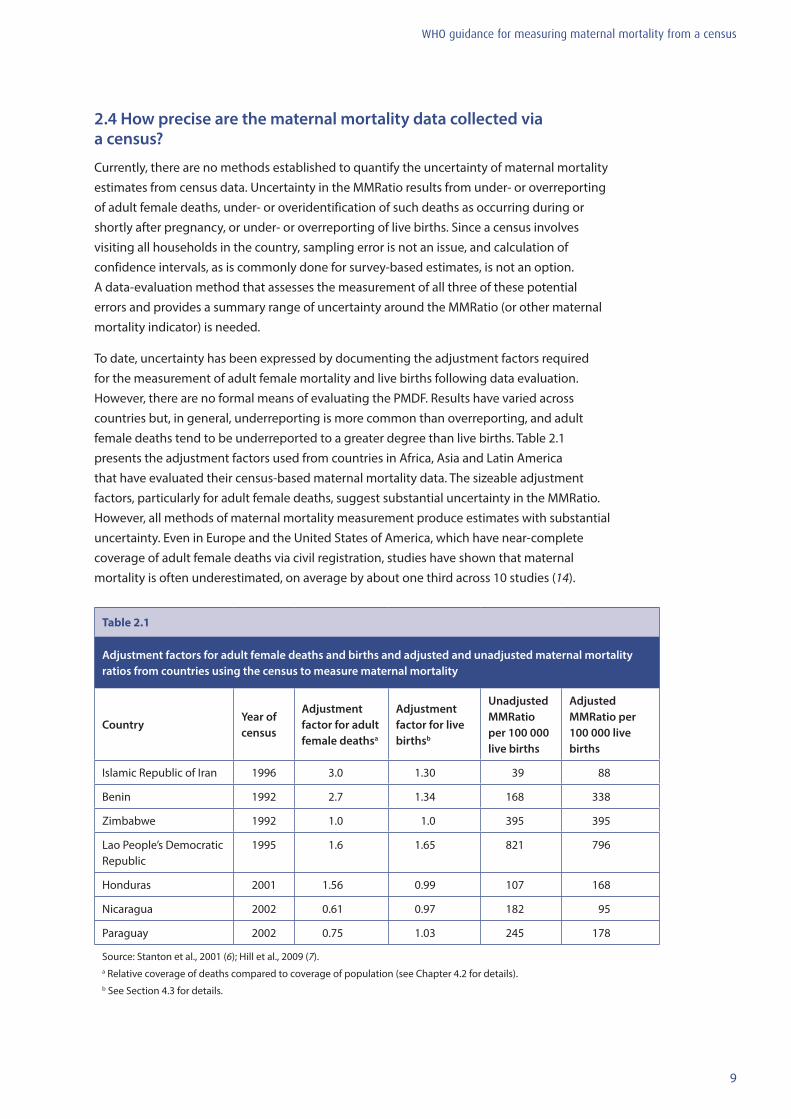
Adjustment factors for adult female deaths and births and adjusted and unadjusted maternal mortality ratios from countries using the census to measure maternal mortality
CountryYear of census
Adjustment factor for adult female deathsa
Adjustment factor for live birthsb
Unadjusted MMRatio per 100 000 live births
Adjusted MMRatio per 100 000 live births
Islamic Republic of Iran 1996 3.0 1.30 39 88
Benin 1992 2.7 1.34 168 338
Zimbabwe 1992 1.0 1.0 395 395
Lao People’s Democratic Republic
1995 1.6 1.65 821 796
Honduras 2001 1.56 0.99 107 168
Nicaragua 2002 0.61 0.97 182 95
Paraguay 2002 0.75 1.03 245 178
Source: Stanton et al., 2001 (6); Hill et al., 2009 (7).a Relative coverage of deaths compared to coverage of population (see Chapter 4.2 for details).b See Section 4.3 for details.
2.4 How precise are the maternal mortality data collected via a census?
Currently, there are no methods established to quantify the uncertainty of maternal mortality estimates from census data. Uncertainty in the MMRatio results from under- or overreporting of adult female deaths, under- or overidentification of such deaths as occurring during or shortly after pregnancy, or under- or overreporting of live births. Since a census involves visiting all households in the country, sampling error is not an issue, and calculation of confidence intervals, as is commonly done for survey-based estimates, is not an option. A data-evaluation method that assesses the measurement of all three of these potential errors and provides a summary range of uncertainty around the MMRatio (or other maternal mortality indicator) is needed.
To date, uncertainty has been expressed by documenting the adjustment factors required for the measurement of adult female mortality and live births following data evaluation. However, there are no formal means of evaluating the PMDF. Results have varied across countries but, in general, underreporting is more common than overreporting, and adult female deaths tend to be underreported to a greater degree than live births. Table 2.1 presents the adjustment factors used from countries in Africa, Asia and Latin America that have evaluated their census-based maternal mortality data. The sizeable adjustment factors, particularly for adult female deaths, suggest substantial uncertainty in the MMRatio. However, all methods of maternal mortality measurement produce estimates with substantial uncertainty. Even in Europe and the United States of America, which have near-complete coverage of adult female deaths via civil registration, studies have shown that maternal mortality is often underestimated, on average by about one third across 10 studies (14).

10
WHO guidance for measuring maternal mortality from a census
2.5 How much would it cost to add maternal mortality questions to the census?
The costs of adding maternal mortality questions to the census are difficult to estimate. It is safe to assume that the addition of these questions would add negligibly to the overall average duration of a census interview because the questions are asked in less than 1% of households. This is an extremely important consideration.
However, there are other hidden costs. The questions on household deaths are household questions, and it is very important that the box for recording the information be in a prominent position, ideally on the front cover of the questionnaire packet for each household. The addition of the extra maternal mortality questions could potentially increase the amount of paper needed per questionnaire. There would also be some costs associated with the data entry, processing and cleaning of the additional data (though as with the interviews requiring these questions, the quantity of data would be very small relative to the overall census database). Likewise, some time would be spent discussing these questions during interviewer training, and during field editing and supervision. There may also be opportunity costs, for example, if the addition of the maternal mortality questions precludes the addition of questions on other topics.
In addition to the costs mentioned above, it is essential that these data be evaluated and, if necessary, adjusted. No country should add these questions to their census without a clear commitment to evaluating the data. Many of the countries to date that have measured maternal mortality via the census have participated in a data-analysis workshop specifically for this purpose. In fact, this revised manual and its associated spreadsheets are a product of these workshops, which have been organized and funded via various international agencies.
2.6 Is it feasible to establish collaboration between the statistics office and the ministry of health for the purposes of collecting maternal mortality data via the census?
Countries that have measured maternal mortality in the census have found it beneficial to collaborate closely with their MOH counterparts before, during and after data collection. Establishing collaboration with the MOH during the planning stages of a census permits health-care policy-makers to initiate plans for putting the results to use, and can expand the means by which the results will be used, as these plans may be shared with nongovernmental and donor agencies. By doing so, one builds up interest and anticipation in the results, and creates a sense of “ownership” in the MOH.
MOH personnel have also been involved in writing or reviewing interviewer training materials for the maternal mortality component of the census questionnaire and, in some cases, have been involved in the training of trainers for the census. After the census, it is highly recommended that both statistics office and MOH personnel participate in the exercise to evaluate and, if necessary, adjust the results related to maternal mortality. Lastly, working collaboratively with MOH personnel is key to the development of reports that effectively convey the maternal mortality results and to the identification of appropriate audiences for the report(s).

11
WHO guidance for measuring maternal mortality from a census
2.7 How and where should the maternal mortality results be disseminated?
It is recommended that countries planning to add maternal mortality questions to their census also plan, in advance, to disseminate the results in a separate publication. A separate publication is advised because, realistically, the number of tables that can feasibly be added to other census volumes will be quite limited and will not allow full exploitation of the data. Chapter 5 of this manual provides specific suggestions regarding tabulation, graphics and dissemination of the census-based maternal mortality data.

12
WHO guidance for measuring maternal mortality from a census

13
WHO guidance for measuring maternal mortality from a census
This chapter includes recommendations regarding the design of census questionnaires for the measurement of maternal mortality, and important issues to consider in preparing for the training of census enumerators, data editing and tabulation.
3.1 Census questionnaire design
Measures of maternal mortality require information on: the population by age and sex, all deaths by age and sex over a given reference period, the number of maternal deaths (i.e. adult female deaths defined based on timing relative to pregnancy, childbirth or the postpartum period) over the given reference period, and the number of live births over the same period. Collection of information on the age and sex distribution of the population is a necessary element of any census, for which detailed specifications are presented elsewhere (4). This chapter concentrates on the collection of (all-cause) mortality, maternal mortality and fertility data. As a general point relating to any census operation, census instruments must be extensively field-tested (in all relevant languages) before being finalized, to ensure that questions are properly expressed and understood by interviewers and respondents.
3.1.1 Collection of mortality information in the census
Information on household deaths collected in the census should identify:
• all deaths in the household within a specified time period (e.g. in the last 12 months)• the name, sex and age at death of each deceased person• the timing of deaths of women aged 15 to 49 years, relative to pregnancy, childbirth and
the postpartum period (6 weeks following the termination of the pregnancy).
The collection of information on household deaths involves identification of all household members who have died within a specified time period. The sex and age of each deceased person is also recorded. Age at death can be obtained either by asking a direct question regarding the person’s age at death in completed years, or by asking both the month and year of the person’s birth and the month and year of the person’s death. In order to distinguish maternal from non-maternal deaths, additional questions must be asked to determine the timing of adult female deaths relative to pregnancy, childbirth or the postpartum period (defined as the 6 weeks after the end of pregnancy).
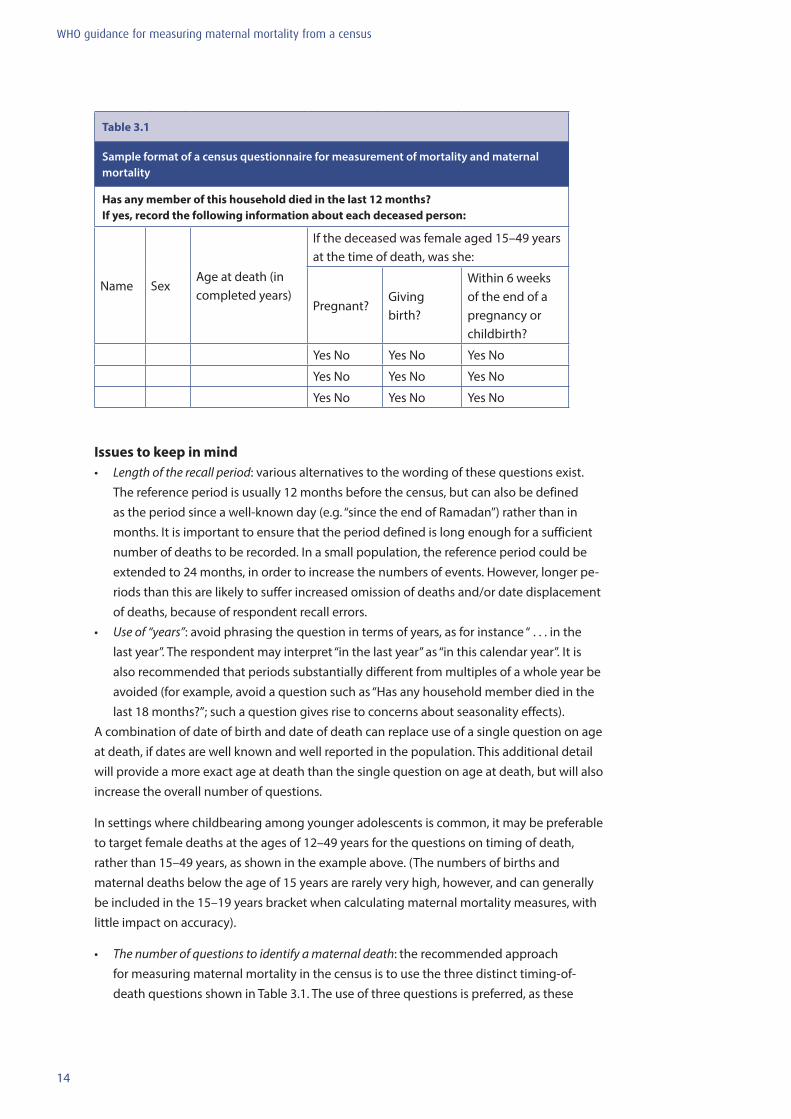
It is recommended that the information on household deaths be recorded in a self-contained box in a prominent position (such as the front cover) of the census questionnaire. This is preferable to the use of a separate sheet, which might reduce the response rate. The basic questions are noted in Table 3.1.
3. Census questionnaire design, training and tabulation procedures
14
WHO guidance for measuring maternal mortality from a census
Issues to keep in mind• Length of the recall period: various alternatives to the wording of these questions exist.
The reference period is usually 12 months before the census, but can also be defined as the period since a well-known day (e.g. “since the end of Ramadan”) rather than in months. It is important to ensure that the period defined is long enough for a sufficient number of deaths to be recorded. In a small population, the reference period could be extended to 24 months, in order to increase the numbers of events. However, longer pe-riods than this are likely to suffer increased omission of deaths and/or date displacement of deaths, because of respondent recall errors.
• Use of “years”: avoid phrasing the question in terms of years, as for instance “ . . . in the last year”. The respondent may interpret “in the last year” as “in this calendar year”. It is also recommended that periods substantially different from multiples of a whole year be avoided (for example, avoid a question such as “Has any household member died in the last 18 months?”; such a question gives rise to concerns about seasonality effects).
A combination of date of birth and date of death can replace use of a single question on age at death, if dates are well known and well reported in the population. This additional detail will provide a more exact age at death than the single question on age at death, but will also increase the overall number of questions.
In settings where childbearing among younger adolescents is common, it may be preferable to target female deaths at the ages of 12–49 years for the questions on timing of death, rather than 15–49 years, as shown in the example above. (The numbers of births and maternal deaths below the age of 15 years are rarely very high, however, and can generally be included in the 15–19 years bracket when calculating maternal mortality measures, with little impact on accuracy).
• The number of questions to identify a maternal death: the recommended approach for measuring maternal mortality in the census is to use the three distinct timing-of-death questions shown in Table 3.1. The use of three questions is preferred, as these
Table 3.1
Sample format of a census questionnaire for measurement of mortality and maternal mortality
Has any member of this household died in the last 12 months?If yes, record the following information about each deceased person:
Name SexAge at death (in completed years)
If the deceased was female aged 15–49 years at the time of death, was she:
Pregnant?Giving birth?
Within 6 weeks of the end of a pregnancy or childbirth?
Yes No Yes No Yes No
Yes No Yes No Yes No
Yes No Yes No Yes No
15
WHO guidance for measuring maternal mortality from a census
specific questions may improve recall (although no formal validation exercises have been conducted). Where space in the census questionnaire is a severe constraint, these three questions may be replaced by one omnibus question, such as: “Was the woman pregnant, giving birth, or within 6 weeks of the end of a pregnancy at the time of her death?”. In censuses in which the cause of death is being measured for all household deaths, it is not recommended that “maternal death” simply be listed as a cause of death among these other causes. The definition of maternal death used in a census depends on the timing of death and not specific medical causes. Therefore, maternal deaths will overlap with other medical causes of death, and will not be adequately recorded using the cause category “maternal”. Indeed, any attempt to use the census to record cause of death – beyond injuries and maternal deaths – is to be discouraged; respondents will rarely know the medically valid underlying cause of death. A better alternative if addi-tional detail about cause of death is required, is to follow up the census with a separate exercise to conduct a verbal autopsy: households identified as having a death (if the focus is maternal mortality, a death of a woman of reproductive age) are revisited after the census to complete the verbal autopsy instrument. At least two censuses (Iran 1996 and Mozambique 2007) and three large-sample surveys (Bangladesh 2001and 2010, and Ghana 2007) have used this approach. A full discussion of using verbal autopsies after a census is beyond the scope of this manual, but it should be noted that it is not an activity to be undertaken lightly.
• The postpartum period: note that the postpartum period is defined in this manual as 6 weeks following the end of a pregnancy, as opposed to the 42 days defined by the ICD-10. The use of 6 weeks versus 42 days is simply a means to simplify data collection. Some surveys, such as the DHSs, use 2 months as the definition of the postpartum period. Either duration is considered acceptable, as any differences in the recorded number of maternal deaths will probably be very small and have a negligible effect on the results.
• Inclusion of names: although the information is not used for data tabulation and analysis, asking for the name of the deceased is likely to improve recall. It may likewise be worth collecting information on the relationship of the deceased person to the head of the household. If the same organization collecting and processing the census is also respon-sible for vital registration, the names can be used to check for completeness against the vital reports. In other situations, keeping the names electronically is ill-advised, due to concerns regarding confidentiality.
• The entity for which deaths are reported: deaths should be reported for the same social entity that other data are collected for. Censuses typically collect information about households, often defined as a group that eats together; in this case, care must be taken that deaths are recorded only for usual members of the household, and not for some broader entity such as family.
It is important to verify that a sufficient number of lines be provided in the box on household deaths to cover any number of deaths likely to be reported: three lines should generally be sufficient. Settings with high HIV prevalence may require more lines, so the number of lines is a country-specific decision.

16
WHO guidance for measuring maternal mortality from a census
3.1.2 Collection of fertility information in the census
To allow the calculation of the MMRatio, the census questionnaire must include some basis for estimating fertility. Censuses usually include fertility questions asked of all women of reproductive age. In some settings, the questions are restricted to all ever-married women. Ideally, the census questionnaire should include questions on both lifetime fertility and recent fertility. However, it is essential that at least the questions on lifetime fertility be asked. Reverse projection and own-children methods can be used to derive recent fertility estimates from data on age distributions of children and mothers, in the absence of appropriate data from the census (14). These methods are not discussed here, as most countries have information available on recent fertility.
Children ever born and children surviving Censuses in developing countries typically ask women the number of their liveborn children, how many are still alive and how many have died, as well as for information on their last child born alive. These questions provide estimates of women’s lifetime fertility and also of child mortality (from the proportions of children deceased).The formulation of the question for children ever born can be broad:
• “How many liveborn children have you given birth to in your whole life? How many are still alive? How many have died?”
Or they can be more detailed (which may improve recall):
• “How many liveborn sons have you given birth to who (a) are still alive and live with you? (b) are still alive but live elsewhere? (c) have died?” and
• “How many liveborn daughters have you given birth to who (a) are still alive and live with you? (b) are still alive but live elsewhere? (c) have died?”
It may be noted in passing that asking questions about lifetime fertility by sex of child has the advantage of providing a basis for deriving sex-specific estimates of child mortality (15).
Last-born children The estimates of recent fertility are typically based on a question about births in a specific time period. The question can ask whether the woman has had a birth in a recent period, with a possible “yes/no” response, for example:
• “Have you given birth in the last 12 months?” or “since the end of Ramadan?” Or the question can be posed about the date of the most recent birth, for example:
• “In what month and year did you have your most recent live birth?”
From this second question, the number of children born in the 12 months immediately preceding the census date can later be derived during data processing. It has been suggested, though not conclusively proven, that the latter form is less subject to omission than the first.
17
WHO guidance for measuring maternal mortality from a census
3.2 Selection and training of field staff
Careful selection and training of field staff is a necessary (though unfortunately not sufficient) condition for collecting good data. Additional training time to cover the questions related to maternal mortality must be provided in the census timetable. Training for census fieldwork typically follows a tree pattern: the statistical office staff centrally trains a small cadre of regional trainers, who in turn train district trainers, who next provide training to field supervisors, who then train the interviewers. Regardless of the actual chain of training, it is essential that adequate time be set aside at each level for the maternal mortality items. The amount of time required for training is likely to be greater in settings where the questionnaire has to be translated into multiple languages.
The training should include both classroom instruction and trial fieldwork in the community. Training materials must be developed to include the basic instructions for completing this section of the questionnaire, as well as common scenarios encountered during data collection. Allowing time for the interviewers to role-play asking these questions and record the answers is a particularly effective and efficient approach to training. Purposive field practice, whereby households with recent deaths in the target group are identified in advance so that interviewers will gain practice asking all of the questions, is desirable, though logistically more complicated.
Common data-collection errors for the maternal mortality questions are listed below. All of these issues should be explicitly addressed during training and in the training materials developed for use during fieldwork.
• Omission of deaths: questions about recent deaths are very sensitive, and interviewers may prefer to avoid any potential embarrassment by simply not asking the question. Training needs to stress the sensitivity of the issue, and put emphasis on how to broach the topic in a culturally sensitive way, while at the same time emphasizing the impor-tance of making sure that the questions are asked in each and every household inter-viewed.
• Missing data on maternal deaths: an adult female death is identified but the questions concerning timing of death relative to pregnancy, childbirth or the postpartum period are left blank; neither “yes” nor “no” is circled. Even if the questions were never asked, the likely result is that the death is automatically classified as non-maternal, subsequently underestimating maternal mortality measures. It is essential that interviewer training address this issue.
The three maternal mortality questions are only asked in households where there has been a recent adult female death, typically less than 1% of households except in high-HIV-prevalence settings. As a result, interviewers may skip asking them altogether. Again, attention to the issue of missing data on timing of death relative to a pregnancy during interviewer training and field supervision can address this problem in advance.
• Maternal deaths outside the specified age range, in particular, maternal deaths at age 0 (zero): these cases most likely reflect newborn deaths and not maternal deaths. This type of error suggests that the interviewer did not understand the skip pattern of the
18
questionnaire, and that the interviewer or possibly the respondent did not understand the meaning of the questions. The questions on timing of death relative to pregnancy, childbirth and the postpartum period are to be asked only for deaths of women of repro-ductive age.
• Misclassification of adult female deaths as non-maternal: experience from several coun-tries suggests that respondents may voluntarily offer information on cause of death in response to the initial question aimed at identifying deaths in the household. For example: “[Name] died from diabetes, or a bad episode of malaria, or a heart problem, or a car accident”, etc. It is essential that the interviewer follows the skip pattern in the questionnaire by proceeding to the questions on timing of death relative to pregnancy, childbirth or the postpartum period, regardless of other information provided by the respondent. Otherwise, maternal mortality may be underreported.
• Definition of the postpartum period: in this manual, the postpartum period is defined as 6 weeks after the end of the pregnancy. It is essential that interviewers understand that the “end of the pregnancy” does not refer strictly to pregnancies that are carried to term or near-term. For example, if a woman has a miscarriage after only 8 weeks of pregnancy, the postpartum period continues for 6 weeks following the miscarriage. Regardless of the duration of the pregnancy or the outcome of the pregnancy, the postpartum period lasts 6 weeks following the end of that pregnancy.
• Anger or grief expressed towards the interviewer: maternal deaths are particularly tragic deaths and may evoke strong reactions from respondents. Training materials and class-room practice should prepare interviewers for these eventualities, in order to maintain good rapport with the respondent and to complete the interview. During the pretest, if it is clear that respondents become upset when these items are asked near the beginning of the interview, then they should be moved to the end, even with potential loss of data. However, proper training of enumerators should alleviate many of the problems.
3.3 Data entry: keying versus scanning
Data on fertility and mortality, like all other data collected in a census or survey, have to be captured in electronic form. Censuses are generally carried out using paper questionnaires, though direct capture using personal digital assistants (such as smart phones) may become common in the future. With paper questionnaires, data are now commonly captured by scanning the forms. Even a few years ago, keying was the accepted practice, but now, even small countries scan their data. One reason for the shift to scanning, other than speed, is that keying has inherent problems, for example, miskeying, keying on the wrong line, inconsistent entries and no entries. Keying, nevertheless, also has some advantages, for example, when the data-entry person enters the sex of the deceased, most keying programs will allow only 1 (for male) or 2 (for female) to be keyed, whereas scanning will allow any number, an alpha character, or some other character, and these must be “corrected” during computer editing, as discussed below. Newer scanning programs do edit and “correct” during the actual scanning. However, the dangers associated with doing this are obvious. Someone has to correctly program the edit to make sure that spurious entries are treated logically.
19
WHO guidance for measuring maternal mortality from a census
3.4 Computer editing
Here, we discuss special considerations for editing data on last (i.e. most recent) births and household deaths (including maternal deaths). For basic advice on editing data on children ever born and children surviving in the household, see the UN Handbook on population and housing census editing, revision 1 (16).
3.4.1 Fertility
Date of last live birth or live births in the 12 months before the census.
Information on last live births, collected for women aged 15 years (in settings with very early childbearing, this lower limit should be age 12) to 49 years, assists in providing estimates of current fertility just prior to a census or survey. As noted above, one approach is to collect the date of birth (for most purposes, the month and year are sufficient, but the day is sometimes asked as well) of the last child born alive (some censuses also record the child’s sex and survival status). A second approach is to record for each woman the number of live births in the 12 months before the census. This second approach is easier for enumerators and respondents because only a single number is needed to respond rather than a date, but may be more prone to underreporting: any woman who reported at least one child born alive has to provide a date, but patterns of underreporting young children may result in failure to report births in the last 12 months (see (4), para. 2.188 to 2.191). If information is collected on the date of last birth, recent fertility is estimated on the basis of the births reported as occurring in the last 12 months.
It should be noted that information on the date of birth of the last child born alive does not produce data on the total number of children born alive during the 12-month period. Even if there are no errors in reporting the data on the last liveborn child, this item only ascertains the number of women who had at least one liveborn child during the 12-month period, not the number of births, since a small proportion of women will have had more than one child in a year (see (4), para. 2.189).
The following edits should be included in the editing program: the date of birth of the last child born alive should be entered for all females in a country-specific age range defined for the reproductive age. The program should check for inconsistencies. For example, no information should appear for males, or for females not in the selected age range. Also, females in the selected age group with parity greater than zero should have a valid month and year (and day if asked) of the last live birth (or an indication of whether a birth occurred in the last 12 months if that question is used).
The editing team needs to decide whether the day and month must be recorded and valid. When these values are missing, some editing teams use dynamic imputation (sometimes called hotdecking) to impute the day and month. Dynamic imputation is an approach to fill in missing or unacceptable values on the basis of recorded data from a recently processed observation. Suppose, for example, that a woman aged 23 years with two children ever born is missing information on the date of the most recent birth; the imputation would
20
WHO guidance for measuring maternal mortality from a census
fill in this value with the date of birth recorded for the most recent woman in the data set aged 23 years with two children ever born and a valid date of most recent birth. Additional characteristics such as urban/rural residence or educational attainment can be added to improve the imputation process. Those not using dynamic imputation assign “unknown” for the day and month. If the analysts need the actual age of mothers at birth of their children as a variable for fertility analysis, then at least the month of the last birth should be imputed, if it is missing.
3.4.2 Mortality
Information on the dates of deaths in the household within the 12 months before the census is used to estimate the level and pattern of mortality by age and sex. In order for estimates derived from these data to be valid, it is important that the deaths by age and sex be reported as completely and as accurately as possible.
Age and sex of the deceased The UN Principles and recommendations for population and housing censuses (4) suggest collecting the name, age, sex and day, month and year of death for persons who died in the 12 months before the census, though the somewhat simpler process of not asking the date of death is also possible. Countries not using dynamic imputation can assign “unknown” for each of these variables for invalid responses; these deaths can be distributed proportionately at the analysis stage if so desired. However, dynamic imputation may result in a more accurate redistribution, though it is essential that imputed values be flagged as such so the analyst can be aware of the extent of the imputation. The imputation matrices to be used for the dynamic imputation will be country specific, and the editing team will have to work together with analysts to develop them. The population structure of the country, or subnational geographic levels, can aid in developing the most appropriate edit.
Maternal mortality The information used to identify maternal deaths among all deaths of women of reproductive age may take the form of a response to a single question (“Did she die while pregnant, during delivery, or within 6 weeks of the termination of the pregnancy?”) or responses to three separate questions (“Was she pregnant?”; “Was she giving birth?”; “Did she die within 6 weeks of the termination of the pregnancy?”). The editing program should simply eliminate positive answers for deaths of males or of females outside the defined reproductive age range. If the information is missing for the death of a woman of reproductive age, dynamic imputation can be used, based on the result for the most recent death of a woman of the same age group. If more than one positive answer is provided to the three-question version, dynamic imputation can be based on the last valid response.
3.5 Tabulation layouts
The data-evaluation methods described in Chapter 4 require information on the population and number of deaths by age group and sex, as well as on the number of births by maternal age group. It will be convenient to keep unadjusted data on population, deaths, and maternal deaths by age, as well as births by maternal age in a machine-readable form following data entry or data capture to facilitate application of the evaluation and adjustment techniques described in Chapter 4.
21
WHO guidance for measuring maternal mortality from a census
In preparation for data evaluation, the recommended layout of data required for the analysis is presented in Chapter 4, Table 4.1, drawing on results from the 1992 and 2002 national population censuses of Zimbabwe (17) for illustrative purposes. Since an important advantage of using the census to measure maternal mortality is the ability to produce differentials (for example, by urban/rural residence, and socioeconomic status), it is also essential that the mortality and fertility data be tabulated accordingly in countries where the numbers of deaths and births are sufficient for this analysis.
Countries using this methodology to measure overall mortality and maternal mortality are urged to publish the results, even if at first glance the data do not seem to be plausible. Recent experience with collecting retrospective information on household deaths has been mixed. In some cases, the information appears to be good, but in others there has been clear evidence of omission. Occasionally, the data have not been published because they seemed to have been affected by omission. However, given the existing techniques for evaluating and adjusting such data, these data might have been of value, but are now lost forever. Also, if only countries that apply this approach successfully publish their results, it will be impossible to arrive at an unbiased assessment of the value of the method.
It is recommended, therefore, that the basic data from these questions always be published in the census volumes of raw data (see Box 1). It is also important that analyses of the data be published, including adjustments if necessary. Census organizations generally publish an analytical volume, presenting an analysis of the census results, such as estimates of fertility, mortality or population projections. It is strongly encouraged to devote a chapter of this analytical report for describing the analysis of the maternal mortality data and to publish estimates of maternal mortality indicators. A less technical report, designed for a broader audience is also recommended, and Chapter 5 provides a suggested outline for such a report.
Box 1
Recommended content of census-based publications on maternal mortality
Census publications of maternal mortality data should include:
in the basic volume of census results:
• raw data on the population by age and sex• raw data on the number of deaths over the reference period by age and sex• raw data on the number of deaths among women aged 15–49 years, dying during pregnancy, delivery
or in the 6 weeks after the end of a pregnancy• raw data on the number of births over the same reference period by age of the mother• raw data on children ever born and children surviving (or dead) by age of mother
in the analytical volume following publication of basic results:
• maternal mortality indicators including adjustments, if necessary, such as disaggregated estimates by age, region and household socioeconomic status.

22
WHO guidance for measuring maternal mortality from a census
23
WHO guidance for measuring maternal mortality from a census
4. Methods for data evaluation and adjustment
Population censuses aim to collect information about every eligible person in the national population in a very short period of time. The size of the task is at odds with the objective of collecting perfect data: training of interviewers will of necessity be brief, and supervision may be less than thorough. As a result, errors will arise. Some of these errors have been addressed in Chapter 3, in the discussion of computer editing. Inconsistencies (such as a woman with no reported children ever born reporting the date of a most recent live birth) or impossibilities (such as a woman aged 17 years reporting 10 children ever born) can be identified, and editing rules established to ensure that data are internally consistent and within the bounds of the possible. However, some sorts of errors do not give rise to inconsistencies or impossibilities. Of particular importance to the measurement of maternal mortality is failure to report the death of a household member that occurred in the 12 months before the census, or failure to report a recent birth. Such errors are by no means uncommon, and may directly affect the numerator or the denominator of the MMRatio.
It is therefore absolutely essential in any analysis of census data regarding maternal mortality to evaluate the data quality carefully. Some of the evaluation methods may also, with additional assumptions, provide for adjustment. In this chapter, we present and illustrate the key methods of data evaluation that have been developed. The integrated Excel spreadsheets that accompany this manual1 allow numerical application of these methods, simply assuming that data have been tabulated in the way recommended in Chapter 3. Interpretation of the analyses, however, is rarely routine. We attempt to provide guidance regarding some common problems, but the variety of possible errors is too large to cover all possibilities. The analyst is therefore cautioned to examine results carefully and consider what might account for unexpected patterns or results.
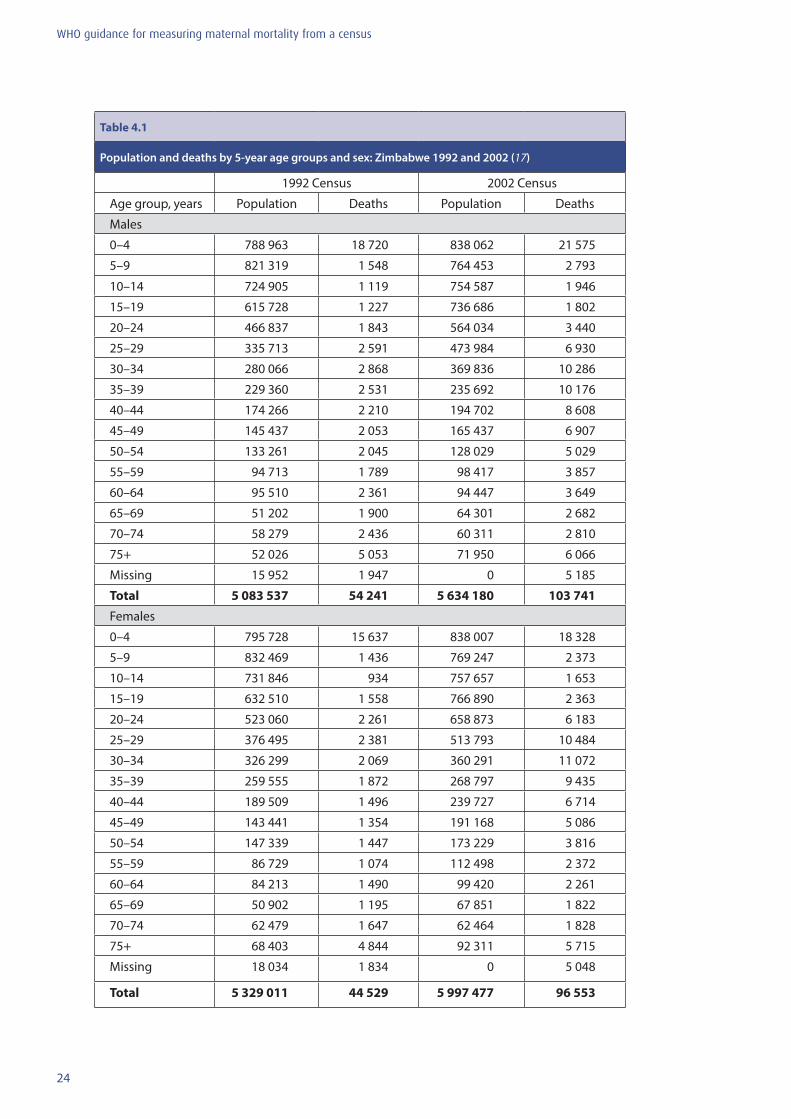
This chapter will be illustrated with applications to data from Zimbabwe, which included the necessary questions in both the 1992 and 2002 censuses. Table 4.1 shows the basic data on population and deaths by 5-year age group and sex for each census. Note that the age distributions of both population and deaths include a category for “Missing” for the 1992 census, but the 2002 census has no persons of missing age. In many censuses, the “Missing” category will have been eliminated by dynamic imputation (see Chapter 3) at the data-editing stage. If, as in the Zimbabwe example for 1992 and for the deaths from both censuses, this is not the case, we recommend simply working with the recorded numbers and not redistributing the “Missing” category. Any redistribution will have to be carried out proportionately, and will have no effect on the end result of the evaluation, though it will be necessary to bear in mind when interpreting results that some proportion of the population and deaths are not included.
1 The Maternal Mortality package contains all spreadsheets discussed in this manual. The package is available and freely downloadable at www.who.int/reproductivehealth/publications/maternal_perinatal_health/monitoring/en/.
24
WHO guidance for measuring maternal mortality from a census
Table 4.1
Population and deaths by 5-year age groups and sex: Zimbabwe 1992 and 2002 (17)
1992 Census 2002 Census
Age group, years Population Deaths Population Deaths
Males
0–4 788 963 18 720 838 062 21 575
5–9 821 319 1 548 764 453 2 793
10–14 724 905 1 119 754 587 1 946
15–19 615 728 1 227 736 686 1 802
20–24 466 837 1 843 564 034 3 440
25–29 335 713 2 591 473 984 6 930
30–34 280 066 2 868 369 836 10 286
35–39 229 360 2 531 235 692 10 176
40–44 174 266 2 210 194 702 8 608
45–49 145 437 2 053 165 437 6 907
50–54 133 261 2 045 128 029 5 029
55–59 94 713 1 789 98 417 3 857
60–64 95 510 2 361 94 447 3 649
65–69 51 202 1 900 64 301 2 682
70–74 58 279 2 436 60 311 2 810
75+ 52 026 5 053 71 950 6 066
Missing 15 952 1 947 0 5 185
Total 5 083 537 54 241 5 634 180 103 741
Females
0–4 795 728 15 637 838 007 18 328
5–9 832 469 1 436 769 247 2 373
10–14 731 846 934 757 657 1 653
15–19 632 510 1 558 766 890 2 363
20–24 523 060 2 261 658 873 6 183
25–29 376 495 2 381 513 793 10 484
30–34 326 299 2 069 360 291 11 072
35–39 259 555 1 872 268 797 9 435
40–44 189 509 1 496 239 727 6 714
45–49 143 441 1 354 191 168 5 086
50–54 147 339 1 447 173 229 3 816
55–59 86 729 1 074 112 498 2 372
60–64 84 213 1 490 99 420 2 261
65–69 50 902 1 195 67 851 1 822
70–74 62 479 1 647 62 464 1 828
75+ 68 403 4 844 92 311 5 715
Missing 18 034 1 834 0 5 048
Total 5 329 011 44 529 5 997 477 96 553
25
WHO guidance for measuring maternal mortality from a census
4.1 Evaluating the quality of age and sex distributions
The quality of the data on the age and sex distribution of the population is not key to the estimation of maternal mortality, but provides a good indicator of the overall quality of the data from the census. Issues of non-response (i.e. “Missing”) will typically have been resolved at the data-processing and editing stage if dynamic imputation is used, but the extent of non-response is an important indicator of data quality, so records should be kept of the proportion of cases for which a missing value had to be imputed.
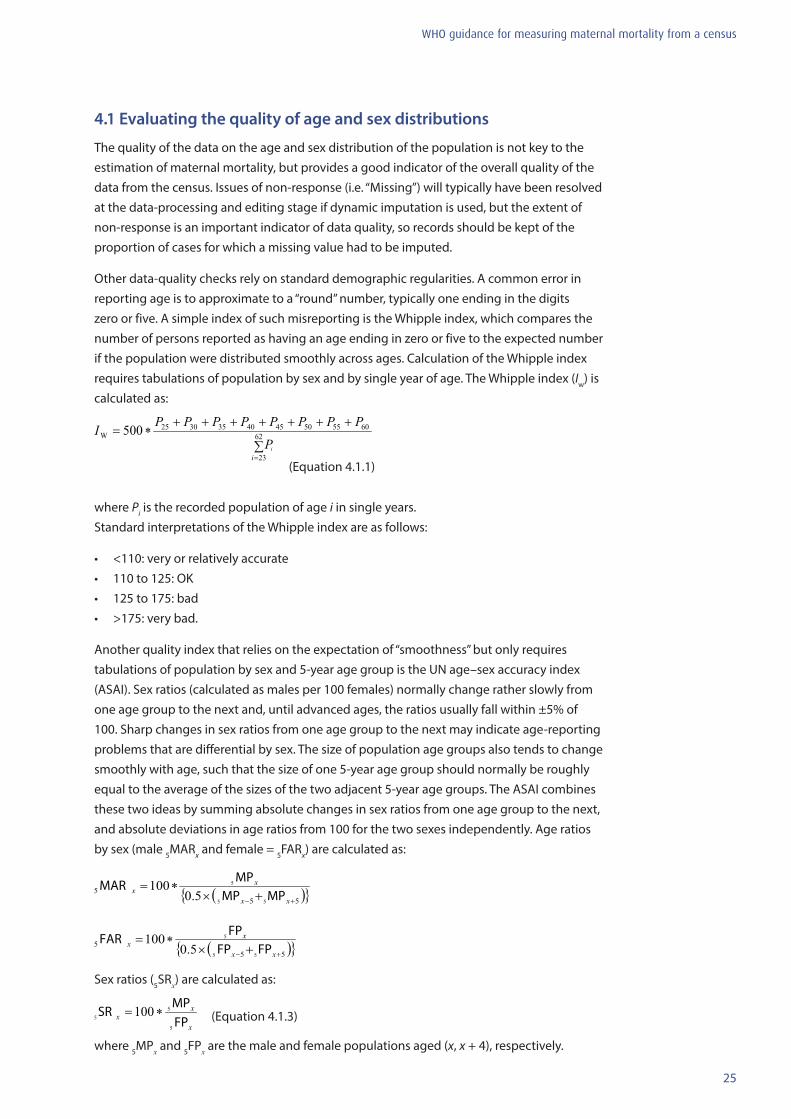
Other data-quality checks rely on standard demographic regularities. A common error in reporting age is to approximate to a “round” number, typically one ending in the digits zero or five. A simple index of such misreporting is the Whipple index, which compares the number of persons reported as having an age ending in zero or five to the expected number if the population were distributed smoothly across ages. Calculation of the Whipple index requires tabulations of population by sex and by single year of age. The Whipple index (Iw) is calculated as:
(Equation 4.1.1)
where Pi is the recorded population of age i in single years. Standard interpretations of the Whipple index are as follows:
• <110: very or relatively accurate• 110 to 125: OK• 125 to 175: bad • >175: very bad.
Another quality index that relies on the expectation of “smoothness” but only requires tabulations of population by sex and 5-year age group is the UN age–sex accuracy index (ASAI). Sex ratios (calculated as males per 100 females) normally change rather slowly from one age group to the next and, until advanced ages, the ratios usually fall within ±5% of 100. Sharp changes in sex ratios from one age group to the next may indicate age-reporting problems that are differential by sex. The size of population age groups also tends to change smoothly with age, such that the size of one 5-year age group should normally be roughly equal to the average of the sizes of the two adjacent 5-year age groups. The ASAI combines these two ideas by summing absolute changes in sex ratios from one age group to the next, and absolute deviations in age ratios from 100 for the two sexes independently. Age ratios by sex (male 5MARx and female = 5FARx) are calculated as:
Sex ratios (5SRx) are calculated as:
(Equation 4.1.3)
where 5MPx and 5FPx are the male and female populations aged (x, x + 4), respectively.
26
WHO guidance for measuring maternal mortality from a census
The ASAI for the age range 0–4 to 70–74 is then calculated by summing three times the mean of absolute differences in sex ratios between age groups and the mean of absolute differences of age ratios from 100 by sex, as in Equation 4.1.4:
(Equation 4.1.4)
Note that changes in the sex ratio from one age group to another are given a weight of 3 in the final index, whereas the sex-specific deviations of a given age group from the average of the neighbouring age groups are given weights of 1.
The ASAI calculated for Zimbabwe 2002 is 42.4. The suggested interpretation of the ASAI is as follows:
• <20: accurate• 20 to 40: inaccurate• >40: highly inaccurate. So the Zimbabwe age data from the 2002 census would be interpreted as “highly inaccurate”. However, it should be noted that the whole concept of population smoothness may be inappropriate in a population that has suffered major short-term population crises, or a population that has been affected by major international migration flows.
4.2 Evaluating the completeness of death recording
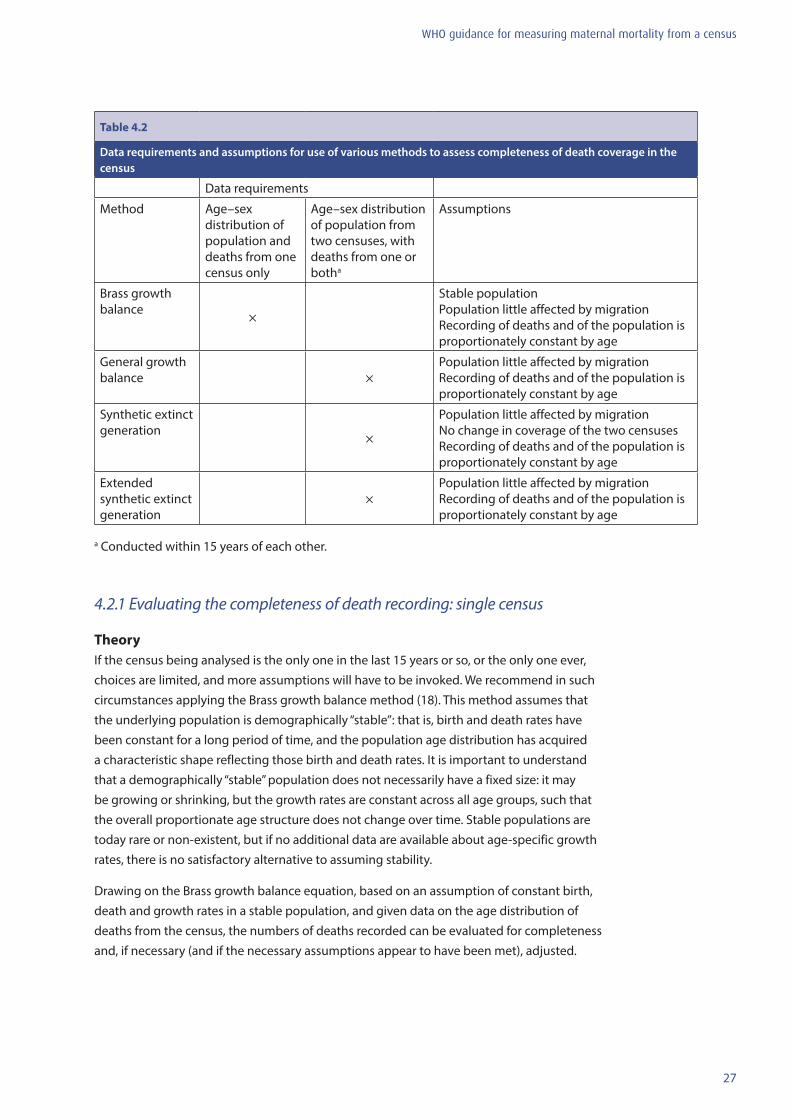
A number of methods exist for evaluating the completeness of census reporting of deaths. All the methods essentially compare the age distribution of deaths to the age distribution of the population alive: identities exist that express the necessary relations between these two distributions. Death rates observed from the reports of deaths in the census or censuses are compared to death rates implied by the population age distributions. The choice of method is driven by data availability: the greater the availability of data, the better the results are likely to be. Table 4.2 summarizes the options for given data availability. The description and illustrative application of these methods is in terms of female deaths. But, since completeness of reporting should not differ very substantially for males and females, every effort should be made to evaluate reporting of both male and female deaths; the comparison of estimates will shed light on how well the evaluation methods are working.
An initial evaluation of the quality of the information on deaths should calculate the Whipple index for digital preference for male and female deaths separately.
27
WHO guidance for measuring maternal mortality from a census
Table 4.2
Data requirements and assumptions for use of various methods to assess completeness of death coverage in the census
Data requirements
Method Age–sex distribution of population and deaths from one census only
Age–sex distribution of population from two censuses, with deaths from one or botha
Assumptions
Brass growth balance ×
Stable population Population little affected by migration Recording of deaths and of the population is proportionately constant by age
General growth balance ×
Population little affected by migration Recording of deaths and of the population is proportionately constant by age
Synthetic extinct generation ×
Population little affected by migration No change in coverage of the two censuses Recording of deaths and of the population is proportionately constant by age
Extended synthetic extinct generation
×Population little affected by migration Recording of deaths and of the population is proportionately constant by age
a Conducted within 15 years of each other.
4.2.1 Evaluating the completeness of death recording: single census
TheoryIf the census being analysed is the only one in the last 15 years or so, or the only one ever, choices are limited, and more assumptions will have to be invoked. We recommend in such circumstances applying the Brass growth balance method (18). This method assumes that the underlying population is demographically “stable”: that is, birth and death rates have been constant for a long period of time, and the population age distribution has acquired a characteristic shape reflecting those birth and death rates. It is important to understand that a demographically “stable” population does not necessarily have a fixed size: it may be growing or shrinking, but the growth rates are constant across all age groups, such that the overall proportionate age structure does not change over time. Stable populations are today rare or non-existent, but if no additional data are available about age-specific growth rates, there is no satisfactory alternative to assuming stability.
Drawing on the Brass growth balance equation, based on an assumption of constant birth, death and growth rates in a stable population, and given data on the age distribution of deaths from the census, the numbers of deaths recorded can be evaluated for completeness and, if necessary (and if the necessary assumptions appear to have been met), adjusted.
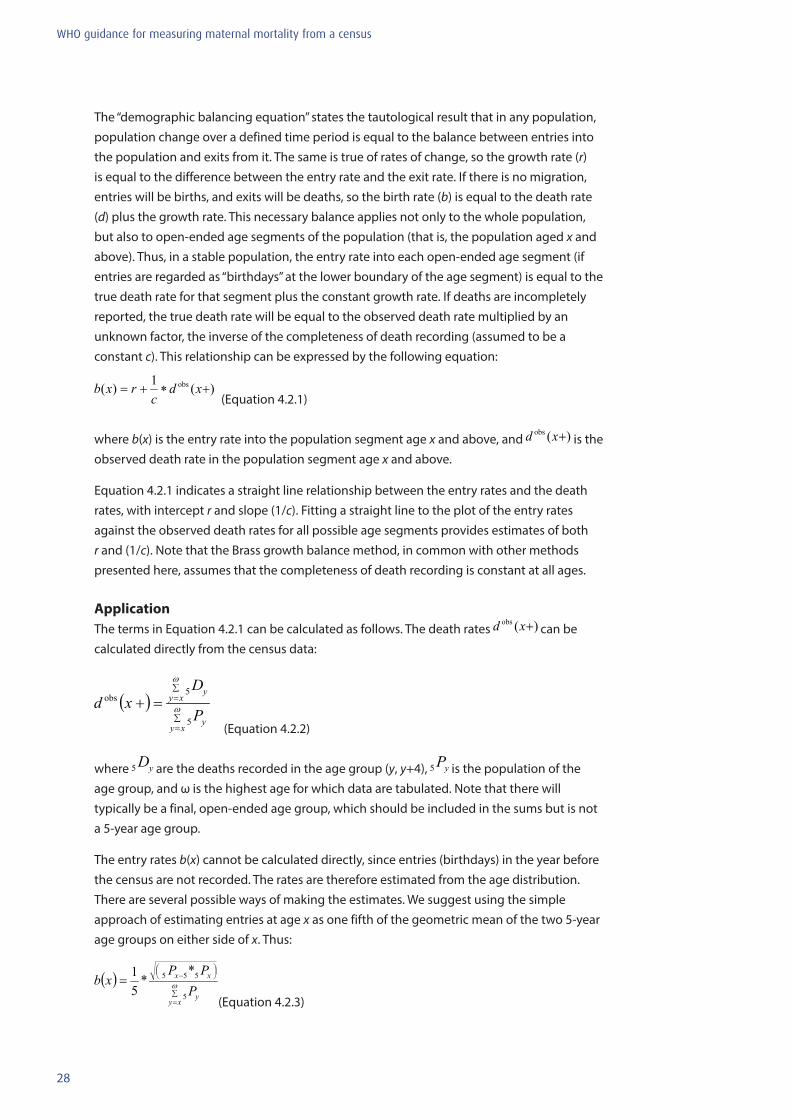
28
WHO guidance for measuring maternal mortality from a census
The “demographic balancing equation” states the tautological result that in any population, population change over a defined time period is equal to the balance between entries into the population and exits from it. The same is true of rates of change, so the growth rate (r) is equal to the difference between the entry rate and the exit rate. If there is no migration, entries will be births, and exits will be deaths, so the birth rate (b) is equal to the death rate (d) plus the growth rate. This necessary balance applies not only to the whole population, but also to open-ended age segments of the population (that is, the population aged x and above). Thus, in a stable population, the entry rate into each open-ended age segment (if entries are regarded as “birthdays” at the lower boundary of the age segment) is equal to the true death rate for that segment plus the constant growth rate. If deaths are incompletely reported, the true death rate will be equal to the observed death rate multiplied by an unknown factor, the inverse of the completeness of death recording (assumed to be a constant c). This relationship can be expressed by the following equation:
(Equation 4.2.1)
where b(x) is the entry rate into the population segment age x and above, and is the observed death rate in the population segment age x and above.
Equation 4.2.1 indicates a straight line relationship between the entry rates and the death rates, with intercept r and slope (1/c). Fitting a straight line to the plot of the entry rates against the observed death rates for all possible age segments provides estimates of both r and (1/c). Note that the Brass growth balance method, in common with other methods presented here, assumes that the completeness of death recording is constant at all ages.
ApplicationThe terms in Equation 4.2.1 can be calculated as follows. The death rates can be calculated directly from the census data:
(Equation 4.2.2)
where are the deaths recorded in the age group (y, y+4), is the population of the age group, and ω is the highest age for which data are tabulated. Note that there will typically be a final, open-ended age group, which should be included in the sums but is not a 5-year age group.
The entry rates b(x) cannot be calculated directly, since entries (birthdays) in the year before the census are not recorded. The rates are therefore estimated from the age distribution. There are several possible ways of making the estimates. We suggest using the simple approach of estimating entries at age x as one fifth of the geometric mean of the two 5-year age groups on either side of x. Thus:
(Equation 4.2.3)
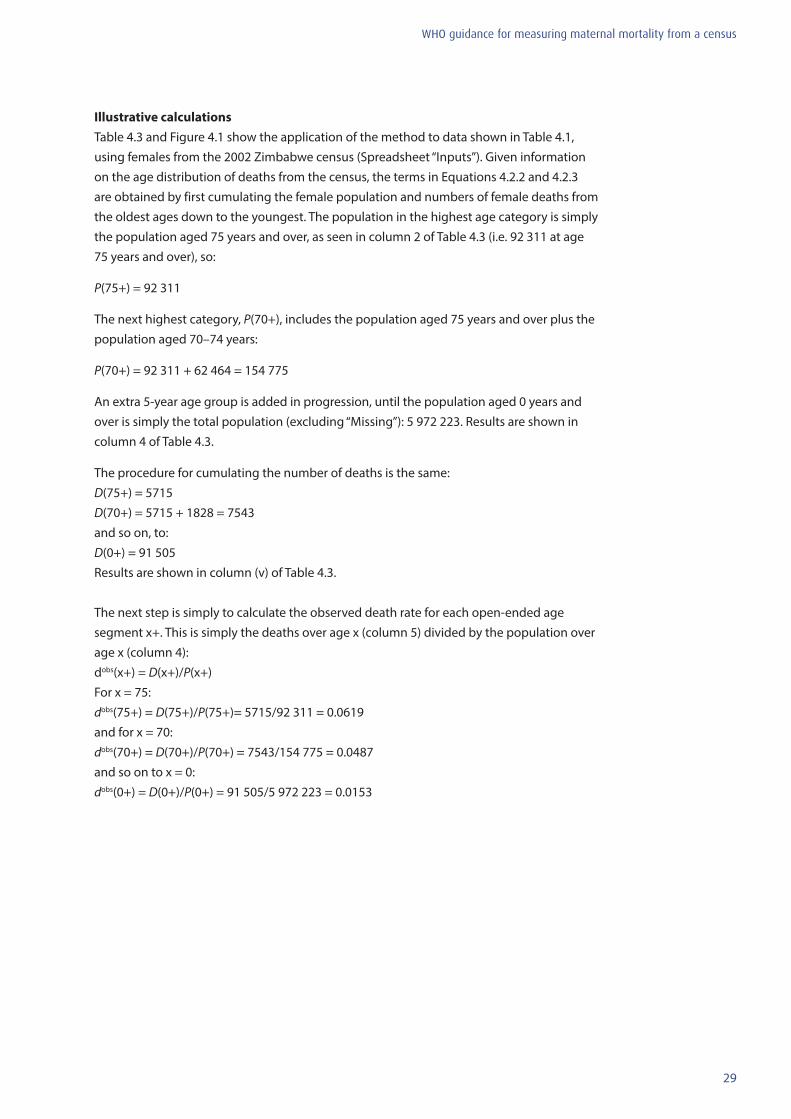
29
WHO guidance for measuring maternal mortality from a census
Illustrative calculations Table 4.3 and Figure 4.1 show the application of the method to data shown in Table 4.1, using females from the 2002 Zimbabwe census (Spreadsheet “Inputs”). Given information on the age distribution of deaths from the census, the terms in Equations 4.2.2 and 4.2.3 are obtained by first cumulating the female population and numbers of female deaths from the oldest ages down to the youngest. The population in the highest age category is simply the population aged 75 years and over, as seen in column 2 of Table 4.3 (i.e. 92 311 at age 75 years and over), so:
P(75+) = 92 311
The next highest category, P(70+), includes the population aged 75 years and over plus the population aged 70–74 years:
P(70+) = 92 311 + 62 464 = 154 775
An extra 5-year age group is added in progression, until the population aged 0 years and over is simply the total population (excluding “Missing”): 5 972 223. Results are shown in column 4 of Table 4.3.
The procedure for cumulating the number of deaths is the same: D(75+) = 5715 D(70+) = 5715 + 1828 = 7543 and so on, to: D(0+) = 91 505 Results are shown in column (v) of Table 4.3. The next step is simply to calculate the observed death rate for each open-ended age segment x+. This is simply the deaths over age x (column 5) divided by the population over age x (column 4): dobs(x+) = D(x+)/P(x+) For x = 75: dobs(75+) = D(75+)/P(75+)= 5715/92 311 = 0.0619 and for x = 70: dobs(70+) = D(70+)/P(70+) = 7543/154 775 = 0.0487 and so on to x = 0: dobs(0+) = D(0+)/P(0+) = 91 505/5 972 223 = 0.0153
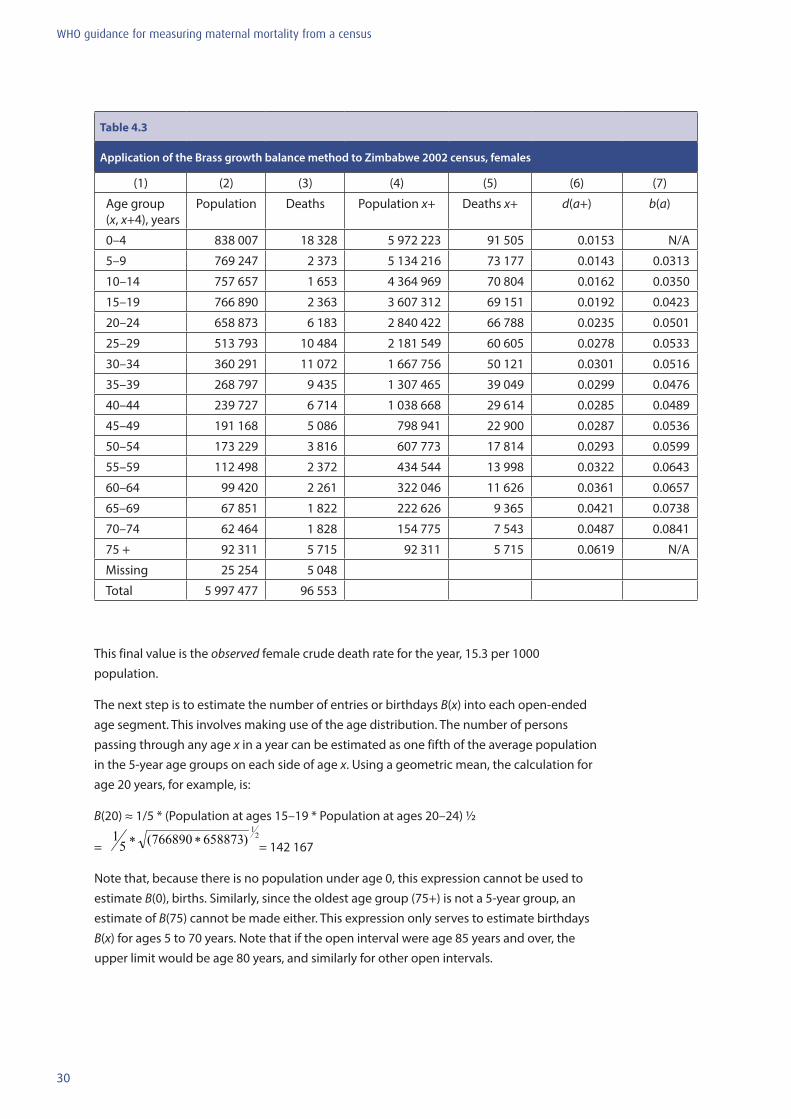
30
WHO guidance for measuring maternal mortality from a census
Table 4.3
Application of the Brass growth balance method to Zimbabwe 2002 census, females
(1) (2) (3) (4) (5) (6) (7)
Age group (x, x+4), years
Population Deaths Population x+ Deaths x+ d(a+) b(a)
0–4 838 007 18 328 5 972 223 91 505 0.0153 N/A
5–9 769 247 2 373 5 134 216 73 177 0.0143 0.0313
10–14 757 657 1 653 4 364 969 70 804 0.0162 0.0350
15–19 766 890 2 363 3 607 312 69 151 0.0192 0.0423
20–24 658 873 6 183 2 840 422 66 788 0.0235 0.0501
25–29 513 793 10 484 2 181 549 60 605 0.0278 0.0533
30–34 360 291 11 072 1 667 756 50 121 0.0301 0.0516
35–39 268 797 9 435 1 307 465 39 049 0.0299 0.0476
40–44 239 727 6 714 1 038 668 29 614 0.0285 0.0489
45–49 191 168 5 086 798 941 22 900 0.0287 0.0536
50–54 173 229 3 816 607 773 17 814 0.0293 0.0599
55–59 112 498 2 372 434 544 13 998 0.0322 0.0643
60–64 99 420 2 261 322 046 11 626 0.0361 0.0657
65–69 67 851 1 822 222 626 9 365 0.0421 0.0738
70–74 62 464 1 828 154 775 7 543 0.0487 0.0841
75 + 92 311 5 715 92 311 5 715 0.0619 N/A
Missing 25 254 5 048
Total 5 997 477 96 553
This final value is the observed female crude death rate for the year, 15.3 per 1000 population.
The next step is to estimate the number of entries or birthdays B(x) into each open-ended age segment. This involves making use of the age distribution. The number of persons passing through any age x in a year can be estimated as one fifth of the average population in the 5-year age groups on each side of age x. Using a geometric mean, the calculation for age 20 years, for example, is:
B(20) ≈ 1/5 * (Population at ages 15–19 * Population at ages 20–24) ½
= = 142 167
Note that, because there is no population under age 0, this expression cannot be used to estimate B(0), births. Similarly, since the oldest age group (75+) is not a 5-year group, an estimate of B(75) cannot be made either. This expression only serves to estimate birthdays B(x) for ages 5 to 70 years. Note that if the open interval were age 85 years and over, the upper limit would be age 80 years, and similarly for other open intervals.
31
WHO guidance for measuring maternal mortality from a census
The entry rate b(x) can now be estimated by dividing the estimated entries at each age x, B(x), by the population over age x, P(x+). Thus, for x = 20:
b(20) = B(20)/P(20+) = 142 167/2 840 422 = 0.0501
Column 7 of Table 4.3 shows results for all ages 5 to 70 years.
Equation 4.2.1 shows that there should be a straight line relationship between b(x) and dobs(x+), that the slope of the line should be equal to the inverse of the completeness of death recording, (1/c), and that the intercept of the line should estimate the stable population growth rate, r. Figure 4.1 shows the scatter plot of b(x) and dobs(x+). It can be seen that there is a general linear relationship between the two variables, but with a major disturbance at central values. There are many ways of fitting a straight line to such data, the most common perhaps being ordinary least squares (OLS). However, OLS assumes one variable to be dependent and one to be independent, whereas in the present situation both are equivalent and both are prone to error. We therefore prefer orthogonal regression, which minimizes squared perpendicular distances from points to the fitted line rather than vertical distances, and thus treats both variables equally. Spreadsheet “SEG female” uses this approach. The slope of the orthogonal regression line is given by the ratio of the standard deviations of the observations; the intercept can then be estimated by combining the estimated slope and the mean values of the two series. Note that the points included for fitting can be chosen to exclude outliers. Using all the points 5+ to 70+ gives the following results: Standard deviation of b(x) = 0.0144 Standard deviation of d(x+) = 0.0093 Slope = standard deviation of b(x)/standard deviation of d(x+) = 0.0144/0093 = 1.54 Estimate of c = 1/slope = 0.65 Average of b(x) = 0.0544 Average of d(x+) = 0.0290 Intercept = average of b(x) – (1/c) * average of d(x+) = 0.0544 – 1.54 * 0.0290 = 0.0097
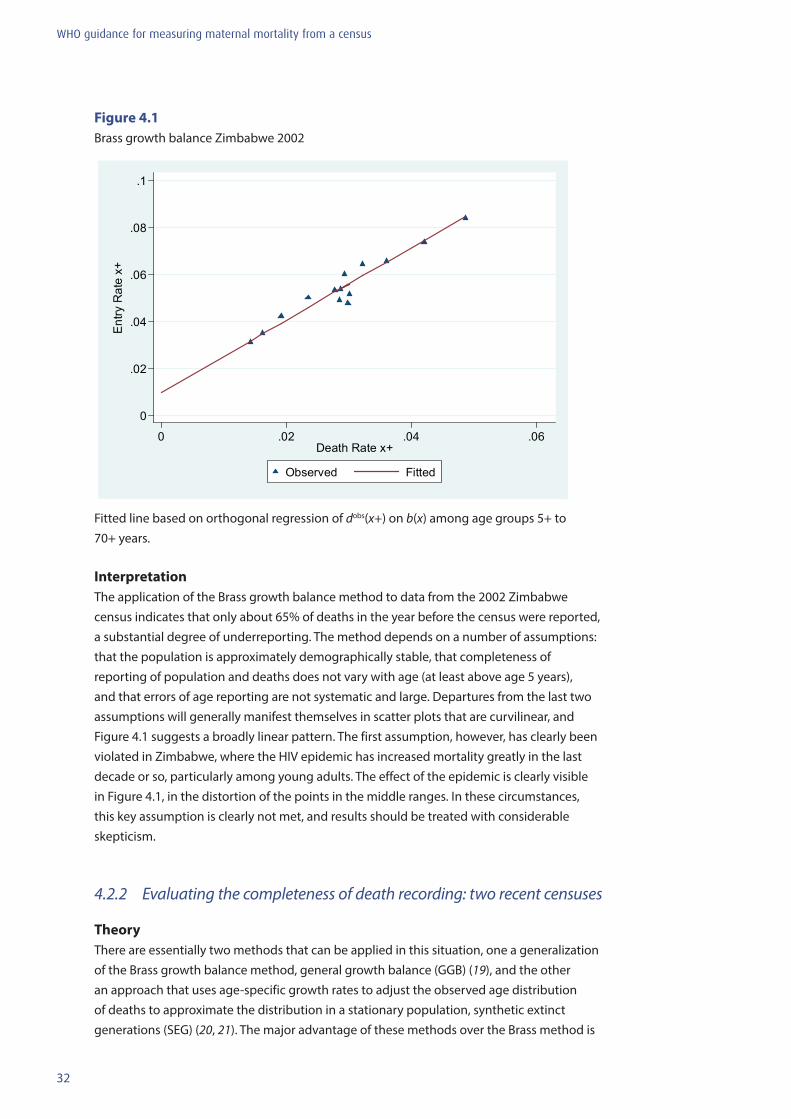
32
WHO guidance for measuring maternal mortality from a census
0
.02
.04
.06
.08
.1
Entry
Rat
e x+
0 .02 .04 .06Death Rate x+
Observed Fitted
Figure 4.1Brass growth balance Zimbabwe 2002
0
.02
.04
.06
.08
.1
Entry
Rat
e x+
0 .02 .04 .06Death Rate x+
Observed Fitted
Fitted line based on orthogonal regression of dobs(x+) on b(x) among age groups 5+ to 70+ years.
InterpretationThe application of the Brass growth balance method to data from the 2002 Zimbabwe census indicates that only about 65% of deaths in the year before the census were reported, a substantial degree of underreporting. The method depends on a number of assumptions: that the population is approximately demographically stable, that completeness of reporting of population and deaths does not vary with age (at least above age 5 years), and that errors of age reporting are not systematic and large. Departures from the last two assumptions will generally manifest themselves in scatter plots that are curvilinear, and Figure 4.1 suggests a broadly linear pattern. The first assumption, however, has clearly been violated in Zimbabwe, where the HIV epidemic has increased mortality greatly in the last decade or so, particularly among young adults. The effect of the epidemic is clearly visible in Figure 4.1, in the distortion of the points in the middle ranges. In these circumstances, this key assumption is clearly not met, and results should be treated with considerable skepticism.
4.2.2 Evaluating the completeness of death recording: two recent censuses
TheoryThere are essentially two methods that can be applied in this situation, one a generalization of the Brass growth balance method, general growth balance (GGB) (19), and the other an approach that uses age-specific growth rates to adjust the observed age distribution of deaths to approximate the distribution in a stationary population, synthetic extinct generations (SEG) (20, 21). The major advantage of these methods over the Brass method is
33
WHO guidance for measuring maternal mortality from a census
that neither requires an assumption that the population being studied is demographically stable; the assumption of stability (and thus constant growth rates at all ages) is replaced by observed growth rates, calculated from the two successive censuses. Both methods, however, make the following assumptions: that the population is little affected by migration; that the recording of deaths and population does not vary with age (at least over age 5 years); and that reporting of ages is reasonably accurate. Both methods also assume that the deaths as recorded have the same age pattern as did deaths during the entire intercensal period; under this assumption, estimated “coverage” is estimated relative to the average death rates during the intercensal period. Only if mortality is not changing will the estimate reflect actual coverage in the census reference period.
Recent sensitivity analyses indicate that the GGB and SEG methods are differently affected by data errors or other deviations from the underlying assumptions (7). SEG seems to be somewhat more robust to age misreporting, whereas GGB explicitly addresses the issue of changing completeness of census coverage. Combining the two methodologies appears to be the most robust approach. In settings where net migration is substantial, using points from the two methods for ages 35 years and over only is recommended.
The general growth balance methodThe GGB method, like the Brass version, derives from the “demographic balancing equation”. In a non-stable population unaffected by net migration, the entry rate into each open-ended age segment x+ (if entries are regarded as “birthdays” at the lower boundary of the age segment) is equal to the true death rate for that segment plus the actual growth rate of the segment; alternatively, the entry rate minus the growth rate will equal the death rate. If deaths are incompletely reported, the true death rate will be equal to the observed death rate multiplied by an unknown factor, the inverse of the completeness of death recording (assumed to be a constant c). This relationship can be expressed by the following equation:
(Equation 4.2.4)
where b(x) is the entry rate into the population segment age x and over, r(x+) is the growth rate of the population segment x and over, and dobs(x+) is the observed death rate in the population segment age x and over.
Equation 4.2.4 indicates a straight-line relationship between the residual estimates of the death rate (given by the entry rate minus the growth rate) and the observed death rates, with slope (1/c). Equation 4.2.4 has no intercept; however, it can easily be shown (19) that a change in census population coverage (by a constant proportion at each age) will create a systematic error in the growth rates, and any observed intercept can be interpreted to estimate the change in census coverage. For example, a positive intercept indicates that the observed growth rates are too small, and that population coverage was lower at the second of the two censuses, and vice versa. Fitting a straight line to the plot of the entry rates against the observed death rates for all possible age segments provides estimates of both coverage change and (1/c).
The synthetic extinct generations methodThe SEG method derives from the notion that the number of persons aged x alive today in a population not subject to migration will be equal to the future deaths at ages x and above
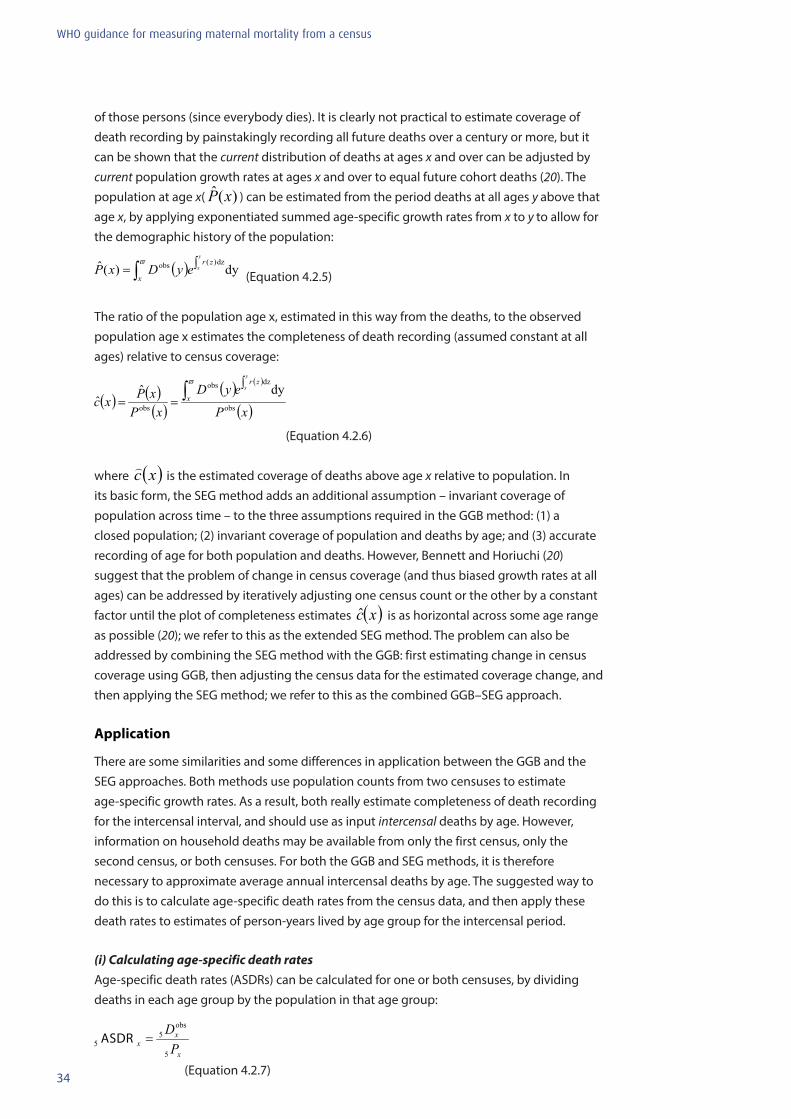
34
WHO guidance for measuring maternal mortality from a census
of those persons (since everybody dies). It is clearly not practical to estimate coverage of death recording by painstakingly recording all future deaths over a century or more, but it can be shown that the current distribution of deaths at ages x and over can be adjusted by current population growth rates at ages x and over to equal future cohort deaths (20). The population at age x( )(ˆ xP ) can be estimated from the period deaths at all ages y above that age x, by applying exponentiated summed age-specific growth rates from x to y to allow for the demographic history of the population:
(Equation 4.2.5)
The ratio of the population age x, estimated in this way from the deaths, to the observed population age x estimates the completeness of death recording (assumed constant at all ages) relative to census coverage:
(Equation 4.2.6) where ( )xc is the estimated coverage of deaths above age x relative to population. In its basic form, the SEG method adds an additional assumption – invariant coverage of population across time – to the three assumptions required in the GGB method: (1) a closed population; (2) invariant coverage of population and deaths by age; and (3) accurate recording of age for both population and deaths. However, Bennett and Horiuchi (20) suggest that the problem of change in census coverage (and thus biased growth rates at all ages) can be addressed by iteratively adjusting one census count or the other by a constant factor until the plot of completeness estimates ( )xc is as horizontal across some age range as possible (20); we refer to this as the extended SEG method. The problem can also be addressed by combining the SEG method with the GGB: first estimating change in census coverage using GGB, then adjusting the census data for the estimated coverage change, and then applying the SEG method; we refer to this as the combined GGB–SEG approach.
Application
There are some similarities and some differences in application between the GGB and the SEG approaches. Both methods use population counts from two censuses to estimate age-specific growth rates. As a result, both really estimate completeness of death recording for the intercensal interval, and should use as input intercensal deaths by age. However, information on household deaths may be available from only the first census, only the second census, or both censuses. For both the GGB and SEG methods, it is therefore necessary to approximate average annual intercensal deaths by age. The suggested way to do this is to calculate age-specific death rates from the census data, and then apply these death rates to estimates of person-years lived by age group for the intercensal period.
(i) Calculating age-specific death ratesAge-specific death rates (ASDRs) can be calculated for one or both censuses, by dividing deaths in each age group by the population in that age group:
(Equation 4.2.7)
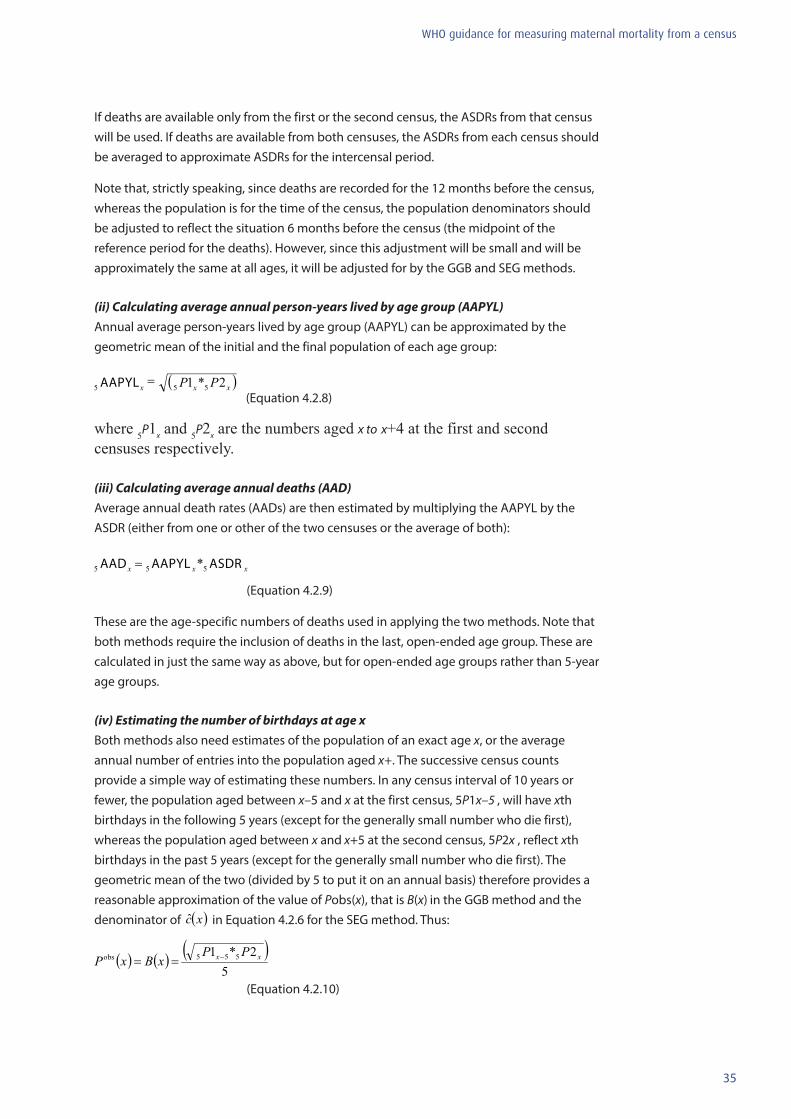
35
WHO guidance for measuring maternal mortality from a census
If deaths are available only from the first or the second census, the ASDRs from that census will be used. If deaths are available from both censuses, the ASDRs from each census should be averaged to approximate ASDRs for the intercensal period.
Note that, strictly speaking, since deaths are recorded for the 12 months before the census, whereas the population is for the time of the census, the population denominators should be adjusted to reflect the situation 6 months before the census (the midpoint of the reference period for the deaths). However, since this adjustment will be small and will be approximately the same at all ages, it will be adjusted for by the GGB and SEG methods.
(ii) Calculating average annual person-years lived by age group (AAPYL)Annual average person-years lived by age group (AAPYL) can be approximated by the geometric mean of the initial and the final population of each age group:
(Equation 4.2.8)
where 5P1x and 5P2x are the numbers aged x to x+4 at the first and second censuses respectively.
(iii) Calculating average annual deaths (AAD)Average annual death rates (AADs) are then estimated by multiplying the AAPYL by the ASDR (either from one or other of the two censuses or the average of both):
(Equation 4.2.9)
These are the age-specific numbers of deaths used in applying the two methods. Note that both methods require the inclusion of deaths in the last, open-ended age group. These are calculated in just the same way as above, but for open-ended age groups rather than 5-year age groups.
(iv) Estimating the number of birthdays at age xBoth methods also need estimates of the population of an exact age x, or the average annual number of entries into the population aged x+. The successive census counts provide a simple way of estimating these numbers. In any census interval of 10 years or fewer, the population aged between x–5 and x at the first census, 5P1x–5 , will have xth birthdays in the following 5 years (except for the generally small number who die first), whereas the population aged between x and x+5 at the second census, 5P2x , reflect xth birthdays in the past 5 years (except for the generally small number who die first). The geometric mean of the two (divided by 5 to put it on an annual basis) therefore provides a reasonable approximation of the value of Pobs(x), that is B(x) in the GGB method and the denominator of ( )xc in Equation 4.2.6 for the SEG method. Thus:
(Equation 4.2.10)
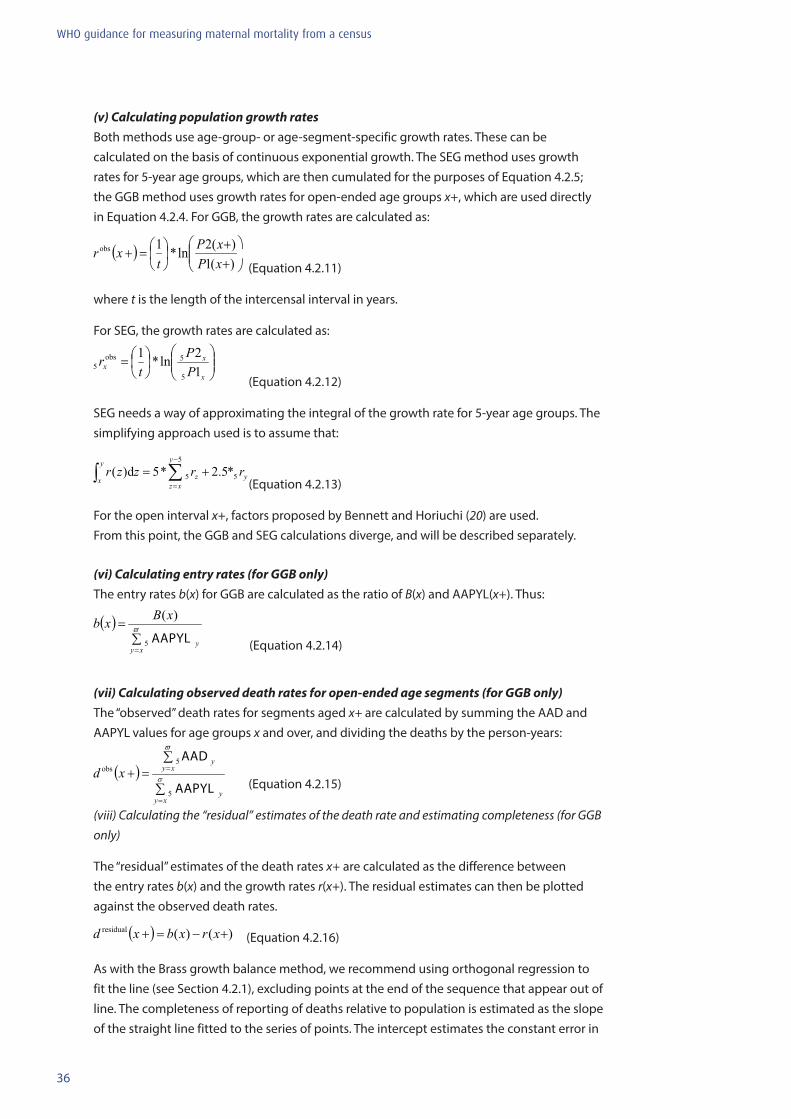
36
WHO guidance for measuring maternal mortality from a census
(v) Calculating population growth ratesBoth methods use age-group- or age-segment-specific growth rates. These can be calculated on the basis of continuous exponential growth. The SEG method uses growth rates for 5-year age groups, which are then cumulated for the purposes of Equation 4.2.5; the GGB method uses growth rates for open-ended age groups x+, which are used directly in Equation 4.2.4. For GGB, the growth rates are calculated as:
(Equation 4.2.11)
where t is the length of the intercensal interval in years.
For SEG, the growth rates are calculated as:
(Equation 4.2.12)
SEG needs a way of approximating the integral of the growth rate for 5-year age groups. The simplifying approach used is to assume that:
(Equation 4.2.13)
For the open interval x+, factors proposed by Bennett and Horiuchi (20) are used. From this point, the GGB and SEG calculations diverge, and will be described separately.
(vi) Calculating entry rates (for GGB only)The entry rates b(x) for GGB are calculated as the ratio of B(x) and AAPYL(x+). Thus:
(Equation 4.2.14)
(vii) Calculating observed death rates for open-ended age segments (for GGB only)The “observed” death rates for segments aged x+ are calculated by summing the AAD and AAPYL values for age groups x and over, and dividing the deaths by the person-years:
(Equation 4.2.15)
(viii) Calculating the “residual” estimates of the death rate and estimating completeness (for GGB only)
The “residual” estimates of the death rates x+ are calculated as the difference between the entry rates b(x) and the growth rates r(x+). The residual estimates can then be plotted against the observed death rates.
(Equation 4.2.16)
As with the Brass growth balance method, we recommend using orthogonal regression to fit the line (see Section 4.2.1), excluding points at the end of the sequence that appear out of line. The completeness of reporting of deaths relative to population is estimated as the slope of the straight line fitted to the series of points. The intercept estimates the constant error in
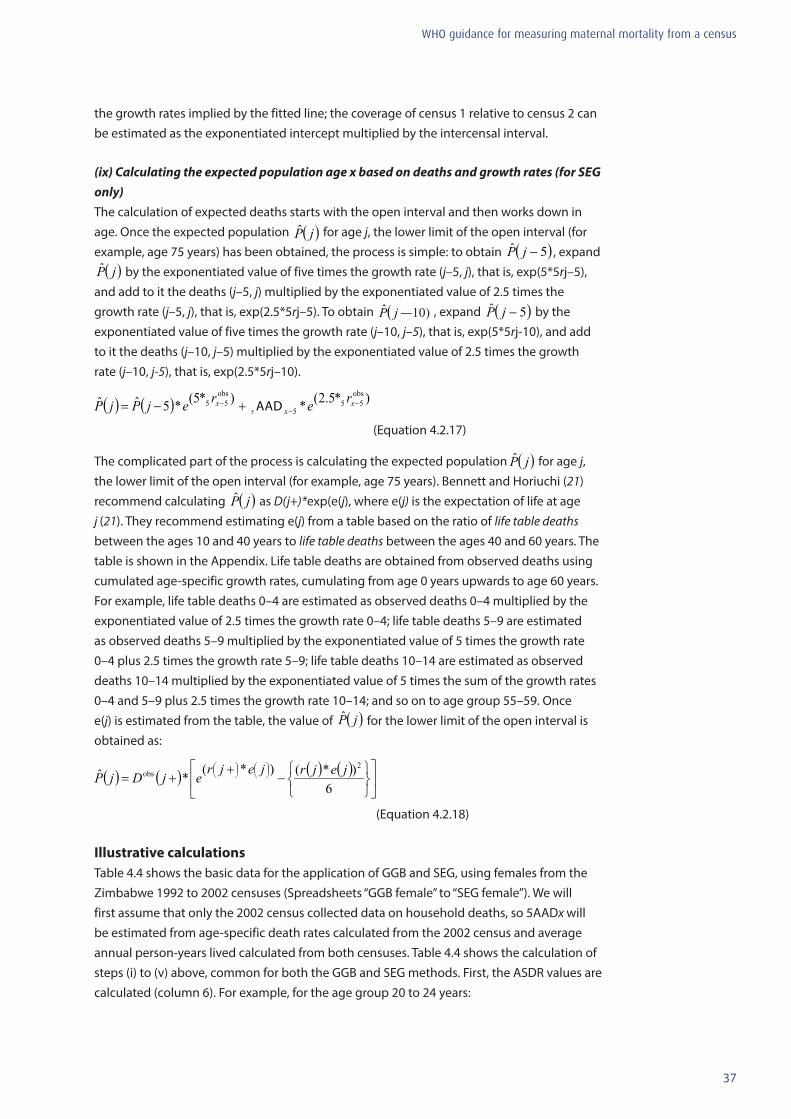
37
WHO guidance for measuring maternal mortality from a census
the growth rates implied by the fitted line; the coverage of census 1 relative to census 2 can be estimated as the exponentiated intercept multiplied by the intercensal interval.
(ix) Calculating the expected population age x based on deaths and growth rates (for SEG only)The calculation of expected deaths starts with the open interval and then works down in age. Once the expected population ( )jP for age j, the lower limit of the open interval (for example, age 75 years) has been obtained, the process is simple: to obtain ( )5ˆ −jP , expand ( )jP by the exponentiated value of five times the growth rate (j–5, j), that is, exp(5*5rj–5),
and add to it the deaths (j–5, j) multiplied by the exponentiated value of 2.5 times the growth rate (j–5, j), that is, exp(2.5*5rj–5). To obtain ( )jP , expand ( )5ˆ −jP by the exponentiated value of five times the growth rate (j–10, j–5), that is, exp(5*5rj-10), and add to it the deaths (j–10, j–5) multiplied by the exponentiated value of 2.5 times the growth rate (j–10, j-5), that is, exp(2.5*5rj–10).
(Equation 4.2.17)
The complicated part of the process is calculating the expected population ( )jP for age j, the lower limit of the open interval (for example, age 75 years). Bennett and Horiuchi (21) recommend calculating ( )jP as D(j+)*exp(e(j), where e(j) is the expectation of life at age j (21). They recommend estimating e(j) from a table based on the ratio of life table deaths between the ages 10 and 40 years to life table deaths between the ages 40 and 60 years. The table is shown in the Appendix. Life table deaths are obtained from observed deaths using cumulated age-specific growth rates, cumulating from age 0 years upwards to age 60 years. For example, life table deaths 0–4 are estimated as observed deaths 0–4 multiplied by the exponentiated value of 2.5 times the growth rate 0–4; life table deaths 5–9 are estimated as observed deaths 5–9 multiplied by the exponentiated value of 5 times the growth rate 0–4 plus 2.5 times the growth rate 5–9; life table deaths 10–14 are estimated as observed deaths 10–14 multiplied by the exponentiated value of 5 times the sum of the growth rates 0–4 and 5–9 plus 2.5 times the growth rate 10–14; and so on to age group 55–59. Once e(j) is estimated from the table, the value of ( )jP for the lower limit of the open interval is obtained as:
(Equation 4.2.18)
Illustrative calculationsTable 4.4 shows the basic data for the application of GGB and SEG, using females from the Zimbabwe 1992 to 2002 censuses (Spreadsheets “GGB female” to “SEG female”). We will first assume that only the 2002 census collected data on household deaths, so 5AADx will be estimated from age-specific death rates calculated from the 2002 census and average annual person-years lived calculated from both censuses. Table 4.4 shows the calculation of steps (i) to (v) above, common for both the GGB and SEG methods. First, the ASDR values are calculated (column 6). For example, for the age group 20 to 24 years:
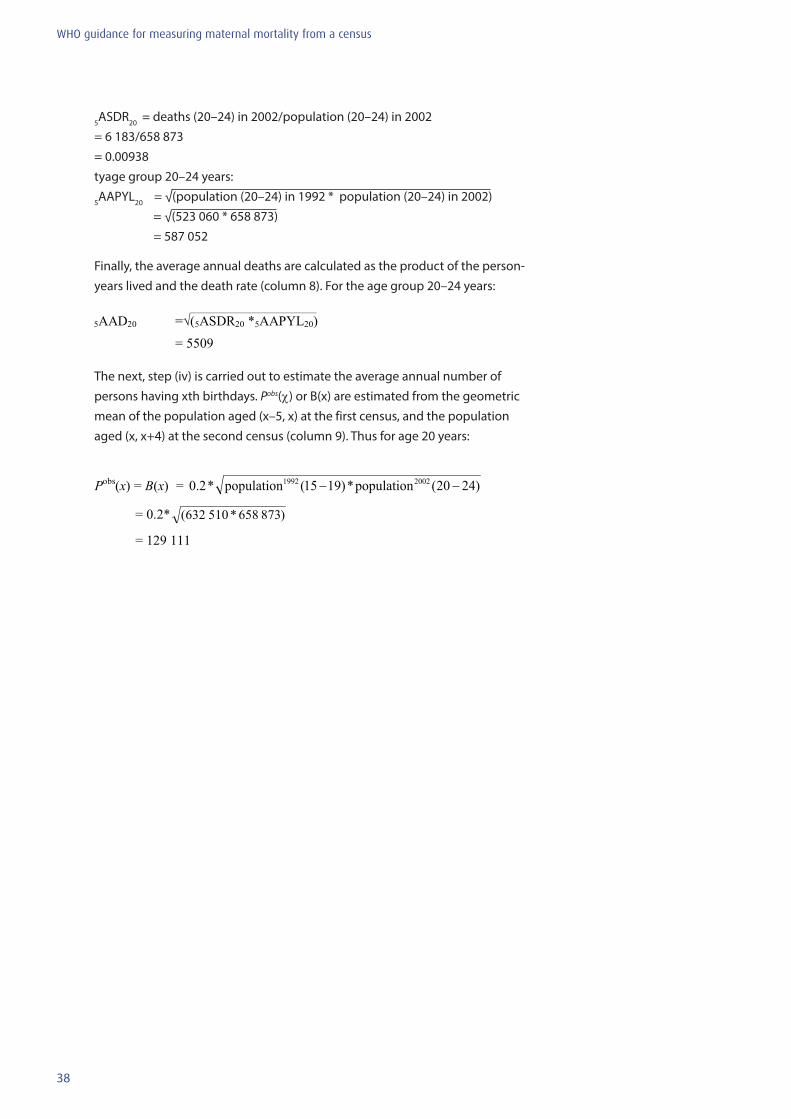
38
WHO guidance for measuring maternal mortality from a census
5ASDR20 = deaths (20–24) in 2002/population (20–24) in 2002 = 6 183/658 873 = 0.00938 tyage group 20–24 years:
5AAPYL20 = √(population (20–24) in 1992 * population (20–24) in 2002) = √(523 060 * 658 873) = 587 052
Finally, the average annual deaths are calculated as the product of the person-years lived and the death rate (column 8). For the age group 20–24 years:
The next, step (iv) is carried out to estimate the average annual number of persons having xth birthdays. Pobs(χ) or B(x) are estimated from the geometric mean of the population aged (x–5, x) at the first census, and the population aged (x, x+4) at the second census (column 9). Thus for age 20 years:
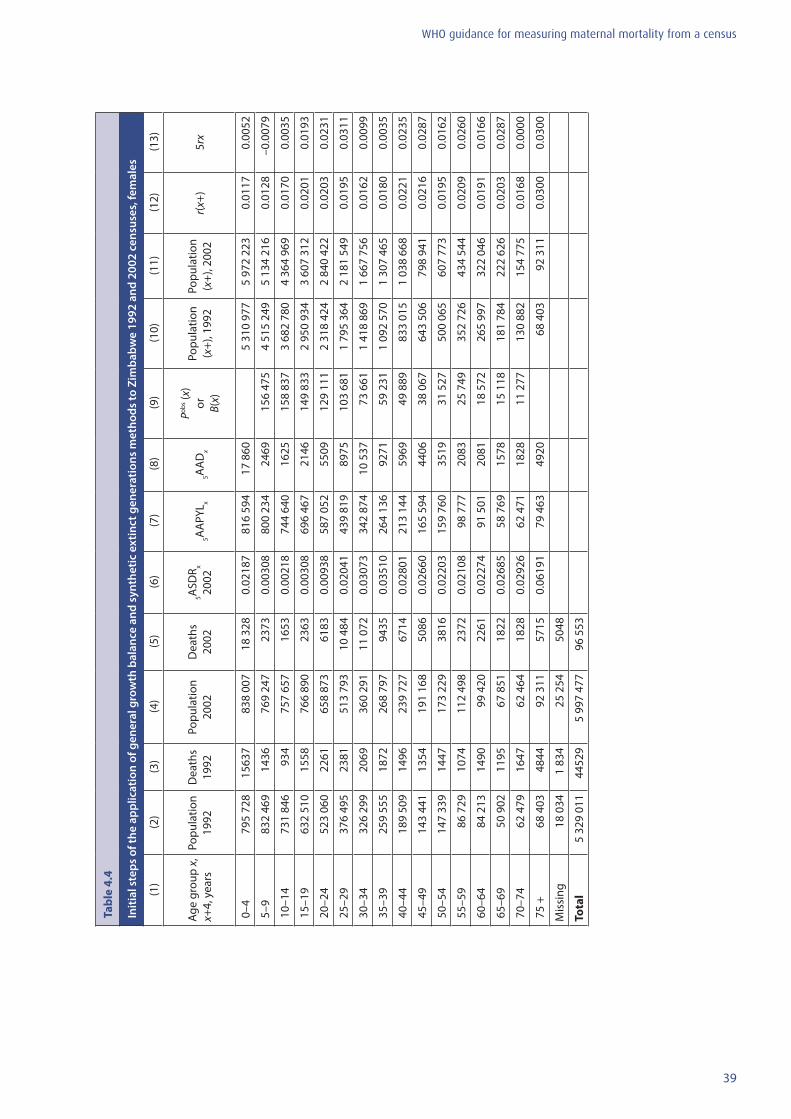
39
WHO guidance for measuring maternal mortality from a census
Tabl
e 4.
4
Initi
al s
teps
of t
he a
pplic
atio
n of
gen
eral
gro
wth
bal
ance
and
syn
thet
ic e
xtin
ct g
ener
atio
ns m
etho
ds to
Zim
babw
e 19
92 a
nd 2
002
cens
uses
, fem
ales
(1)
(2)
(3)
(4)
(5)
(6)
(7)
(8)
(9)
(10)
(11)
(12)
(13)
Age
grou
p x,
x+
4, y
ears
Popu
latio
n 19
92D
eath
s 19
92Po
pula
tion
2002
Dea
ths
2002
5ASD
R x 20
025A
APY
L x5A
AD
x
Pobs (x
) or
B(
x)
Popu
latio
n (x
+), 1
992
Popu
latio
n (x
+), 2
002
r(x+
)5r
x
0–4
795
728
1563
783
8 00
718
328
0.02
187
816
594
17 8
605
310
977
5 97
2 22
30.
0117
0.00
52
5–9
832
469
1436
769
247
2373
0.00
308
800
234
2469
156
475
4 51
5 24
95
134
216
0.01
28–0
.007
9
10–1
473
1 84
693
475
7 65
716
530.
0021
874
4 64
016
2515
8 83
73
682
780
4 36
4 96
90.
0170
0.00
35
15–1
9 63
2 51
015
5876
6 89
023
630.
0030
869
6 46
721
4614
9 83
32
950
934
3 60
7 31
20.
0201
0.01
93
20–2
4 52
3 06
022
6165
8 87
361
830.
0093
858
7 05
255
0912
9 11
12
318
424
2 84
0 42
20.
0203
0.02
31
25–2
9 37
6 49
523
8151
3 79
310
484
0.02
041
439
819
8975
103
681
1 79
5 36
42
181
549
0.01
950.
0311
30–3
4 32
6 29
920
6936
0 29
111
072
0.03
073
342
874
10 5
3773
661
1 41
8 86
91
667
756
0.01
620.
0099
35–3
9 25
9 55
518
7226
8 79
794
350.
0351
026
4 13
692
7159
231
1 09
2 57
01
307
465
0.01
800.
0035
40–4
4 18
9 50
914
9623
9 72
767
140.
0280
121
3 14
459
6949
889
833
015
1 03
8 66
80.
0221
0.02
35
45–4
9 14
3 44
113
5419
1 16
850
860.
0266
016
5 59
444
0638
067
643
506
798
941
0.02
160.
0287
50–5
4 14
7 33
914
4717
3 22
938
160.
0220
315
9 76
035
1931
527
500
065
607
773
0.01
950.
0162
55–5
9 86
729
1074
112
498
2372
0.02
108
98 7
7720
8325
749
352
726
434
544
0.02
090.
0260
60–6
4 84
213
1490
99 4
2022
610.
0227
491
501
2081
18 5
7226
5 99
732
2 04
60.
0191
0.01
66
65–6
9 50
902
1195
67 8
5118
220.
0268
558
769
1578
15 1
1818
1 78
422
2 62
60.
0203
0.02
87
70–7
4 62
479
1647
62 4
6418
280.
0292
662
471
1828
11 2
7713
0 88
215
4 77
50.
0168
0.00
00
75 +
68
403
4844
92 3
1157
150.
0619
179
463
4920
68 4
0392
311
0.03
000.
0300
Mis
sing
18 0
341
834
25 2
5450
48
Tota
l 5
329
011
4452
95
997
477
96 5
53
40
WHO guidance for measuring maternal mortality from a census
Step (v), the calculation of population growth rates, requires knowledge of the intercensal interval in years. Both the 1992 and the 2002 censuses of Zimbabwe were held on 18 August, so the intercensal interval is exactly 10 years. When the interval is not an exact number of years, the two dates should be expressed in terms of decimals of a year (days from 1 January to the census date divided by 365.25) and the intercensal interval calculated as the difference between the two.
The two methods require different growth rate calculations. GGB requires the use of populations over age x, whereas SEG uses 5-year age groups. See Section 4.2.1for the details of cumulation. Columns 10 and 11 of Table 4.4 show the cumulated populations for 1992 and 2002, respectively. Column 12 presents growth rates for the open-ended age groups for the GGB method, and column 13 shows growth rates for 5-year age groups for the SEG method. For the GGB method, the growth rate of the population aged 20 years and over is:
For SEG, the growth rate for the population aged 20–24 years is:
Completing the GGB analysisSteps (vi), calculation of entry rates, to (viii) are only required for GGB, and calculations are shown in Table 4.5 and Spreadsheet “GGB female”. In Table 4.5, columns 2 (average annual person-years lived), 3 (average annual number of deaths), 4 (average annual entries to each age segment) and 5 (intercensal growth rates for each open-ended age segment) are copied from Table 4.4. Columns 6 and 7 cumulate person-years lived AAPYL(x+) and deaths AAD(x+) for open-ended age segments respectively. Thus:
and
Column 8 shows entry rates calculated as the average annual number of entries into the age range x+, B(x+), divided by the average annual person-years lived x+, AAPYL(x+). Thus, for the age segment 20 years and over: b(20) = B(20)/AAPYL(20+) = 129 111/2 563 360 = 0.0504
41
WHO guidance for measuring maternal mortality from a census
Column 9 shows observed death rates for open age segments x+, dobs(x+), calculated as the average annual number of deaths x+ divided by the average annual person-years lived x+. Thus, for the age segment 20 years and over: dobs(20+) = AAD(20+)/AAPYL(20+) = 60 676/2 563 360 = 0.0237
Column 10 shows the residual estimates of death rates for open age segments x+, dresid(x+), calculated as the difference between the entry rates and the growth rates. Thus, for the age segment 20 years and over: dresid(20+) = b(20) – r(20+) = 0.0504 – 0.0203 = 0.0301
Figure 4.2 shows the scatter plot of dresid(x+) and dobs(x+). As in the case of the Brass growth balance method in Figure 4.1, there is a general linear relationship between the two variables, but still with a major disturbance at central values.
As before, we use orthogonal regression to estimate the slope and intercept of the relationship. Using all the points 5+ to 70+ gives the following results:
Standard deviation of dresid (x+) = 0.0121 Standard deviation of dobs(x+) = 0.0091 Slope = standard deviation of dresid (x+)/standard deviation of dobs(x+) = 0.0121/0.0091 = 1.33 Estimate of c = 1/slope = 0.75 Average of dresid(x+) = 0.0359 Average of dobs(x+) = 0.0288 Intercept = average of
= 0.0359 – 1.33 * 0.0288 = –0.0024 Estimate of relative coverage of first to second census = exp(t * intercept) = exp(10.0 * – 0.0024) = 0.976
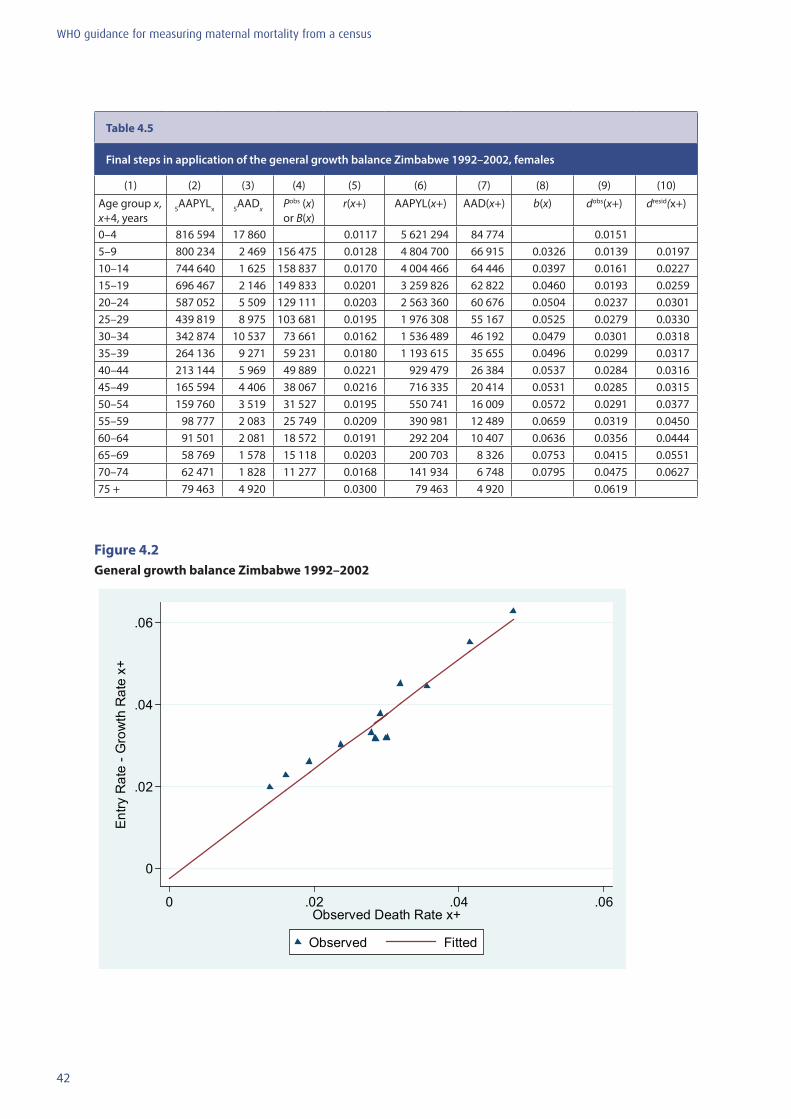
42
WHO guidance for measuring maternal mortality from a census
Table 4.5
Final steps in application of the general growth balance Zimbabwe 1992–2002, females
(1) (2) (3) (4) (5) (6) (7) (8) (9) (10)
Age group x, x+4, years
5AAPYLx 5AADx Pobs (x) or B(x)
r(x+) AAPYL(x+) AAD(x+) b(x) dobs(x+) dresid(x+)
0–4 816 594 17 860 0.0117 5 621 294 84 774 0.01515–9 800 234 2 469 156 475 0.0128 4 804 700 66 915 0.0326 0.0139 0.019710–14 744 640 1 625 158 837 0.0170 4 004 466 64 446 0.0397 0.0161 0.022715–19 696 467 2 146 149 833 0.0201 3 259 826 62 822 0.0460 0.0193 0.025920–24 587 052 5 509 129 111 0.0203 2 563 360 60 676 0.0504 0.0237 0.030125–29 439 819 8 975 103 681 0.0195 1 976 308 55 167 0.0525 0.0279 0.033030–34 342 874 10 537 73 661 0.0162 1 536 489 46 192 0.0479 0.0301 0.031835–39 264 136 9 271 59 231 0.0180 1 193 615 35 655 0.0496 0.0299 0.031740–44 213 144 5 969 49 889 0.0221 929 479 26 384 0.0537 0.0284 0.031645–49 165 594 4 406 38 067 0.0216 716 335 20 414 0.0531 0.0285 0.031550–54 159 760 3 519 31 527 0.0195 550 741 16 009 0.0572 0.0291 0.037755–59 98 777 2 083 25 749 0.0209 390 981 12 489 0.0659 0.0319 0.045060–64 91 501 2 081 18 572 0.0191 292 204 10 407 0.0636 0.0356 0.044465–69 58 769 1 578 15 118 0.0203 200 703 8 326 0.0753 0.0415 0.055170–74 62 471 1 828 11 277 0.0168 141 934 6 748 0.0795 0.0475 0.062775 + 79 463 4 920 0.0300 79 463 4 920 0.0619
Figure 4.2 General growth balance Zimbabwe 1992–2002
0
.02
.04
.06
Ent
ry R
ate
- Gro
wth
Rat
e x+
0 .02 .04 .06Observed Death Rate x+
Observed Fitted
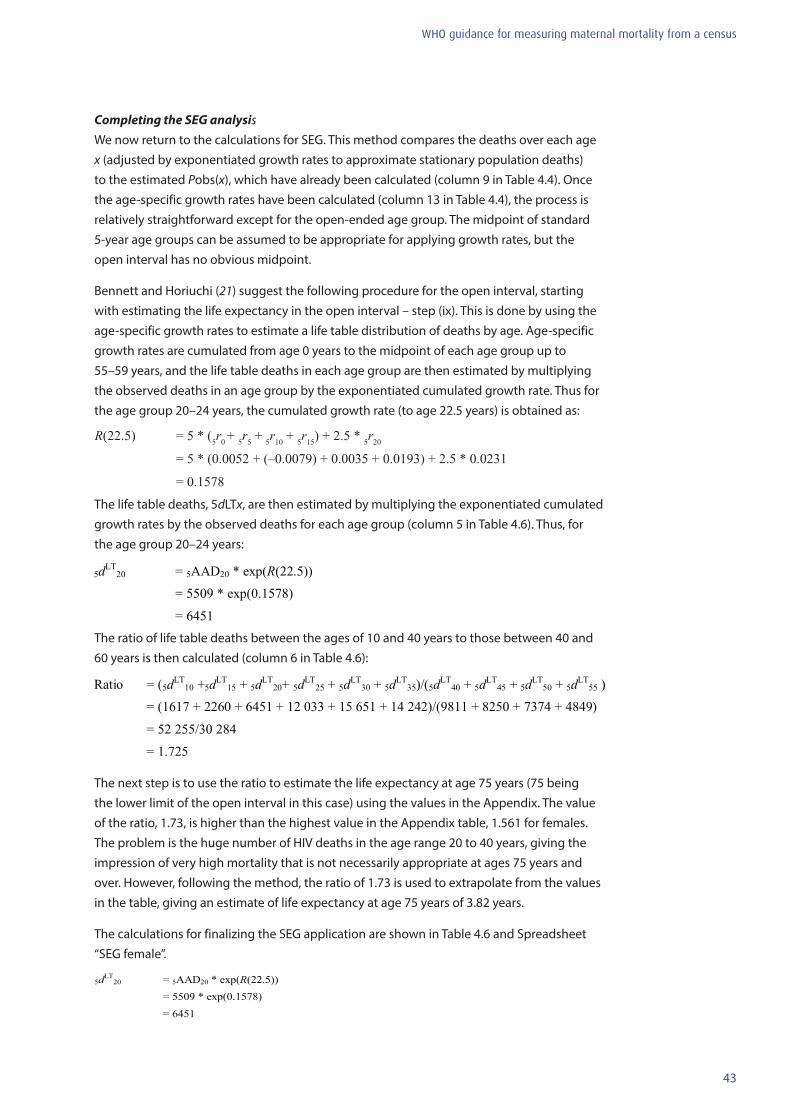
43
WHO guidance for measuring maternal mortality from a census
Completing the SEG analysisWe now return to the calculations for SEG. This method compares the deaths over each age x (adjusted by exponentiated growth rates to approximate stationary population deaths) to the estimated Pobs(x), which have already been calculated (column 9 in Table 4.4). Once the age-specific growth rates have been calculated (column 13 in Table 4.4), the process is relatively straightforward except for the open-ended age group. The midpoint of standard 5-year age groups can be assumed to be appropriate for applying growth rates, but the open interval has no obvious midpoint.
Bennett and Horiuchi (21) suggest the following procedure for the open interval, starting with estimating the life expectancy in the open interval – step (ix). This is done by using the age-specific growth rates to estimate a life table distribution of deaths by age. Age-specific growth rates are cumulated from age 0 years to the midpoint of each age group up to 55–59 years, and the life table deaths in each age group are then estimated by multiplying the observed deaths in an age group by the exponentiated cumulated growth rate. Thus for the age group 20–24 years, the cumulated growth rate (to age 22.5 years) is obtained as:
The life table deaths, 5dLTx, are then estimated by multiplying the exponentiated cumulated growth rates by the observed deaths for each age group (column 5 in Table 4.6). Thus, for the age group 20–24 years:
The ratio of life table deaths between the ages of 10 and 40 years to those between 40 and 60 years is then calculated (column 6 in Table 4.6):
The next step is to use the ratio to estimate the life expectancy at age 75 years (75 being the lower limit of the open interval in this case) using the values in the Appendix. The value of the ratio, 1.73, is higher than the highest value in the Appendix table, 1.561 for females. The problem is the huge number of HIV deaths in the age range 20 to 40 years, giving the impression of very high mortality that is not necessarily appropriate at ages 75 years and over. However, following the method, the ratio of 1.73 is used to extrapolate from the values in the table, giving an estimate of life expectancy at age 75 years of 3.82 years.
The calculations for finalizing the SEG application are shown in Table 4.6 and Spreadsheet “SEG female”.
5dLT20 = 5AAD20 * exp(R(22.5))
= 5509 * exp(0.1578)
= 6451
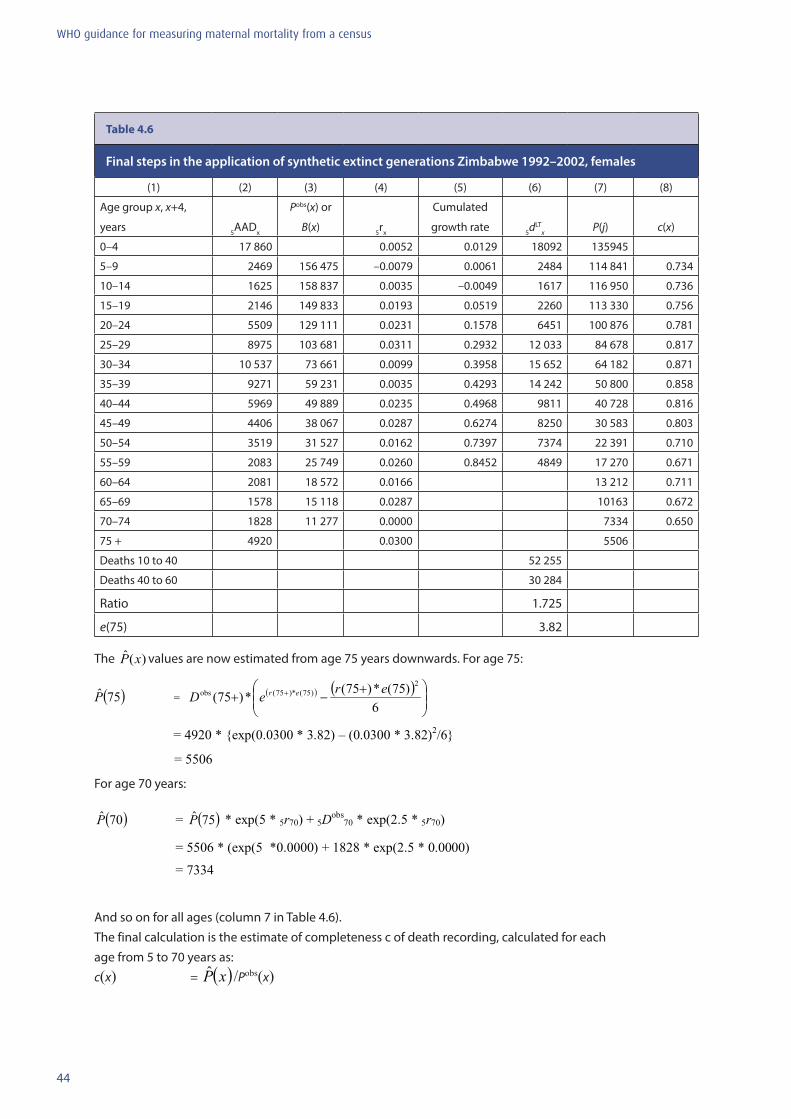
44
WHO guidance for measuring maternal mortality from a census
Table 4.6
Final steps in the application of synthetic extinct generations Zimbabwe 1992–2002, females
(1) (2) (3) (4) (5) (6) (7) (8)
Age group x, x+4,
years 5AADx
Pobs(x) or
B(x) 5rx
Cumulated
growth rate 5dLTx P(j) c(x)
0–4 17 860 0.0052 0.0129 18092 135945
5–9 2469 156 475 –0.0079 0.0061 2484 114 841 0.734
10–14 1625 158 837 0.0035 –0.0049 1617 116 950 0.736
15–19 2146 149 833 0.0193 0.0519 2260 113 330 0.756
20–24 5509 129 111 0.0231 0.1578 6451 100 876 0.781
25–29 8975 103 681 0.0311 0.2932 12 033 84 678 0.817
30–34 10 537 73 661 0.0099 0.3958 15 652 64 182 0.871
35–39 9271 59 231 0.0035 0.4293 14 242 50 800 0.858
40–44 5969 49 889 0.0235 0.4968 9811 40 728 0.816
45–49 4406 38 067 0.0287 0.6274 8250 30 583 0.803
50–54 3519 31 527 0.0162 0.7397 7374 22 391 0.710
55–59 2083 25 749 0.0260 0.8452 4849 17 270 0.671
60–64 2081 18 572 0.0166 13 212 0.711
65–69 1578 15 118 0.0287 10163 0.672
70–74 1828 11 277 0.0000 7334 0.650
75 + 4920 0.0300 5506
Deaths 10 to 40 52 255
Deaths 40 to 60 30 284
Ratio 1.725
e(75) 3.82
The )(ˆ xP values are now estimated from age 75 years downwards. For age 75:
For age 70 years:
And so on for all ages (column 7 in Table 4.6). The final calculation is the estimate of completeness c of death recording, calculated for each age from 5 to 70 years as: c(x) = ( )xP /Pobs(x)
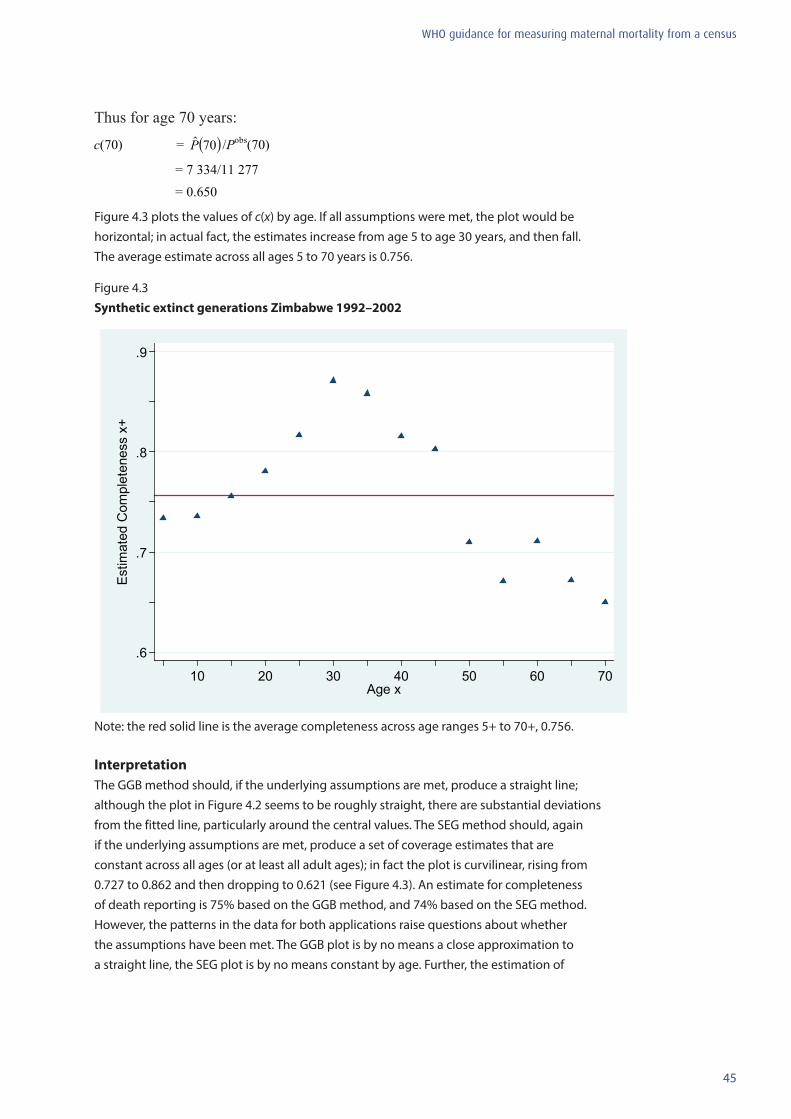
45
WHO guidance for measuring maternal mortality from a census
Thus for age 70 years:
Figure 4.3 plots the values of c(x) by age. If all assumptions were met, the plot would be horizontal; in actual fact, the estimates increase from age 5 to age 30 years, and then fall. The average estimate across all ages 5 to 70 years is 0.756.
Figure 4.3 Synthetic extinct generations Zimbabwe 1992–2002
.6
.7
.8
.9
Est
imat
ed C
ompl
eten
ess
x+
10 20 30 40 50 60 70Age x
Note: the red solid line is the average completeness across age ranges 5+ to 70+, 0.756.
InterpretationThe GGB method should, if the underlying assumptions are met, produce a straight line; although the plot in Figure 4.2 seems to be roughly straight, there are substantial deviations from the fitted line, particularly around the central values. The SEG method should, again if the underlying assumptions are met, produce a set of coverage estimates that are constant across all ages (or at least all adult ages); in fact the plot is curvilinear, rising from 0.727 to 0.862 and then dropping to 0.621 (see Figure 4.3). An estimate for completeness of death reporting is 75% based on the GGB method, and 74% based on the SEG method. However, the patterns in the data for both applications raise questions about whether the assumptions have been met. The GGB plot is by no means a close approximation to a straight line, the SEG plot is by no means constant by age. Further, the estimation of
46
WHO guidance for measuring maternal mortality from a census
life expectancy at age 75 years used in the SEG application is clearly distorted by the HIV epidemic in Zimbabwe. The results should therefore be interpreted with considerable caution, despite the close apparent agreement between the two methods. A clear indication of the problem is the variability in slope depending on the lower and upper limits of the range of points to which the orthogonal regression is fitted.
The SEG method as described here assumes that completeness of the two censuses is similar. If this is not the case (e.g. a GGB intercept that is not close to zero is a good indication of differential completeness between two censuses), the SEG results should be treated with caution. In such cases, the basic data on population can be adjusted using the GGB estimate of differential completeness, and the SEG methodology reapplied. This is described as the combined GGB–SEG method. In general it gives estimates similar to those of the original GGB method.
It should also be noted that in this SEG application to Zimbabwe, the ratio of life table deaths between the ages of 10 and 40 years to those between 40 and 60 years is 1.725, well above the highest value in the Appendix of 1.376. The problem is that because of the HIV epidemic in Zimbabwe, the number of deaths of women aged 20 to 39 years is abnormally high, increasing the ratio. In all probability, life expectancy at age 75 years would have been closer to 6 years than the estimated 3.8 years.
Note for users of the spreadsheet (1)
In this section, we have reviewed methods for evaluation of completeness of death recording. Spreadsheet “Inputs” is for application of Brass growth balance method when only one census is available. Spreadsheets “GGB female”, “SEG female” and “SEG adjusted female” are for applications of GGB, SEG, and the combined GGB–SEG methods (i.e. the SEG methodology adjusting population numbers for the GGB estimate of completeness change), when data are available from two censuses. However, there are three situations in terms of availability of death data from censuses, in which (1) both censuses collected information on deaths by age; (2) only the first census collected information on deaths by age; and (3) only the second census collected information on deaths by age (as shown in illustrative calculations above). The current Spreadsheets GGB female, SEG female and SEG adjusted female are set up to accommodate all three situations, calculating the average annual deaths, depending on entry of deaths data by users.
In any situation, before using the Excel spreadsheets, all information must be prepared in comparable age groups with the same open interval. Please read the “instruction” and “built in functions” files for the Maternal Mortality Package prior to using the spreadsheets. All the calculations described above are automatically carried out by the spreadsheets, once the basic data. Summary measures appear in the box on the bottom of each spreadsheet. When using the spreadsheets, it is recommended to rename the file before entering any data, to avoid corrupting the file or inadvertently changing any of the cell definitions.
47
WHO guidance for measuring maternal mortality from a census
4.3 Evaluating the completeness of birth recording or estimating the numbers of births
Census questionnaires that collect information on deaths by age and sex typically also include questions on each woman’s lifetime fertility and on their recent fertility (such as the number of births in a defined time period before enumeration, or the date of the most recent live birth). The approach used to estimate and evaluate numbers of births (the denominator of the MMRatio) depends on data availability, specifically on whether data are available from only one census or from two censuses.
If there is only one recent census (say one conducted within the last 15 years), and that census included questions both on recent births and on the total number of children ever born, the Brass parity/fertility (P/F) ratio technique can be used to evaluate and, if necessary, adjust the completeness of birth recording. This method is described in Section 4.3.1. If data are available from two censuses, a more flexible approach that does not assume constant fertility can be used, such as a synthetic cohort version of the P/F ratio technique. The method is described in Section 4.3.2.
In Zimbabwe, both the 1992 and 2002 censuses collected information on women’s lifetime fertility and on the date of the last live birth. We will use the 2002 data alone to illustrate the Brass P/F ratio method in Section 4.3.1, and then use the data from both censuses to illustrate the synthetic cohort version in Section 4.3.2. Questions to be addressed when evaluating the number of births recorded in a census are:
• what is the coverage of birth recording?• can the recorded numbers of births be adjusted for data deficiencies while reflecting the
population’s true fertility conditions?
4.3.1 Evaluating the completeness of birth recording using Brass P/F ratios: single census
TheoryThe Brass P/F ratio method is used to evaluate the completeness of birth recording for a given reference period preceding the census (15). These ratios reflect the consistency between information on lifetime fertility and current fertility across women’s age groups.
The three basic assumptions of the Brass P/F ratio methods are (1) that fertility is not changing over time; (2) that reporting of lifetime fertility, or average parity (P), is essentially accurate among younger women, for whom there are typically fewer recall errors and omissions compared to older women; and (3) that the number of births in a given reference period can be distorted by omission or by date displacement, but that the age pattern of births would not be greatly distorted (i.e. errors would be proportionately similar at all ages). If fertility has not changed in the recent past, fertility rates computed from numbers of recent births can be cumulated to obtain measures equivalent to average parities. However, if the recent births are not completely recorded, these parity equivalents (F) will be smaller than reported average parities. The overall degree of completeness of recent birth recording can be evaluated by analysing the P/F ratios by women’s age group. In a context of constant
48
WHO guidance for measuring maternal mortality from a census
fertility, an average of the ratios for the 20–24 years and 25–29 years age groups is a robust indicator for assessing the consistency of birth information. (The ratio for women aged 15–19 years is generally not considered because fertility among adolescents often does not follow standard models.)
ApplicationData and application of the P/F ratio method for Zimbabwe 2002 are shown in Table 4.7. The total numbers of children ever born by age group of mother as recorded in the census are presented in column 3, while numbers of births in the 12-month period before the census are in column 4. From this information, the P/F ratios can be calculated for each 5-year age group over the women’s reproductive life span (15–19, 20–24, …, 45–49 years).
Average parity, PAR(x, x+4), is calculated simply by dividing the number of children ever born alive to women of a given age group, CEB(x, x+4 ), by the total number of women in the same age category, P(x, x+4 ) (column 5 in Table 4.7). Thus, for the age group 25–29 years, for example:
This measure reflects the cumulated number of children born during the women’s reproductive lives. Information on current fertility can also be cumulated to arrive at an indicator comparable to average parity, or a lifetime-fertility equivalent, F(x, x+4). This is calculated by summing current age-specific fertility rates from the beginning of the childbearing years. Specifically, age-specific fertility rates, ASFR(x, x+4), are calculated by dividing the number of births in the past 12-month period to women of the given age group, B(x, x+4), by the number of women in the same age category, P(x, x+4) (column 6 in Table 4.7). Thus, for the age group 25–29 years:
Age-specific fertility rate for the age group 25–29 years
Note that in this example, the births recorded are those over the last year, but women’s age is classified by age at the time of the census. On average, the births had actually occurred to women aged a half-year younger at maternity than the observed age. An adjustment is made to account for this discrepancy when calculating lifetime fertility equivalents.
From the age-specific fertility rates, lifetime fertility equivalents, F(x, x+4), are calculated by interpolation using a quadratic formula that involves, for each age group, summing the rates for all younger age groups (column 7 in Table 4.7), and then adding an appropriate adjustment for fertility within the age group itself. This latter adjustment is based on the pattern of fertility in the given age group and the next group. The factors used below, 3.392 and –0.392, are constant across age groups, assuming that the pattern of change of average
49
WHO guidance for measuring maternal mortality from a census
parity by age can be described over a 10-year age range by a quadratic curve. They also take into account the fact that the age groups for the ASFRs are actually half a year younger than they appear to be. For example, for the age group 25–29:
Results from the calculation of the lifetime fertility equivalents across age groups are presented in column 8 of Table 4.7. No value is given for the age group 45–49 years because the interpolation procedure applied here would need an age-specific fertility rate for the age group 50–54 years. (Given the small number of births observed among women aged 45–49, interest in calculating a corresponding P/F ratio for the purposes of evaluating completeness of data on recent fertility is minimal anyway).
The P/F ratio can now be calculated for each age group. For example: P/F ratio for the age group 25–29 years
Ratios for each applicable age group are shown in column 9 in Table 4.7. The average for the age groups 20–24 years and 25–29 years is 1.144. This would suggest that the recorded number of births in the last 12 months before the 2002 Zimbabwe census was less than complete, and should be adjusted upward by a factor of some 14%.
It is important to recall however that the P/F ratio technique simply evaluates consistency between information on lifetime fertility and current fertility. Although the simple average P/F ratio for the combined age group 20–29 years is 1.14, the use of this adjustment factor to compensate for the completeness of recent birth recording is only appropriate in a context of constant fertility over an extended period of time.
On the other hand, a trend of rapidly increasing P/F ratios with age, as seen in Table 4.7, probably reflects strong effects of declining fertility. In a situation where fertility is falling over time, average parity, which is based on women’s lifetime experiences, will exceed cumulated current fertility, assuming complete recording of recent births. Consequently, the P/F ratios will be greater than one. They will also tend to increase with age, since lifetime fertility among younger women has occurred more recently and will differ little from cumulated current fertility.
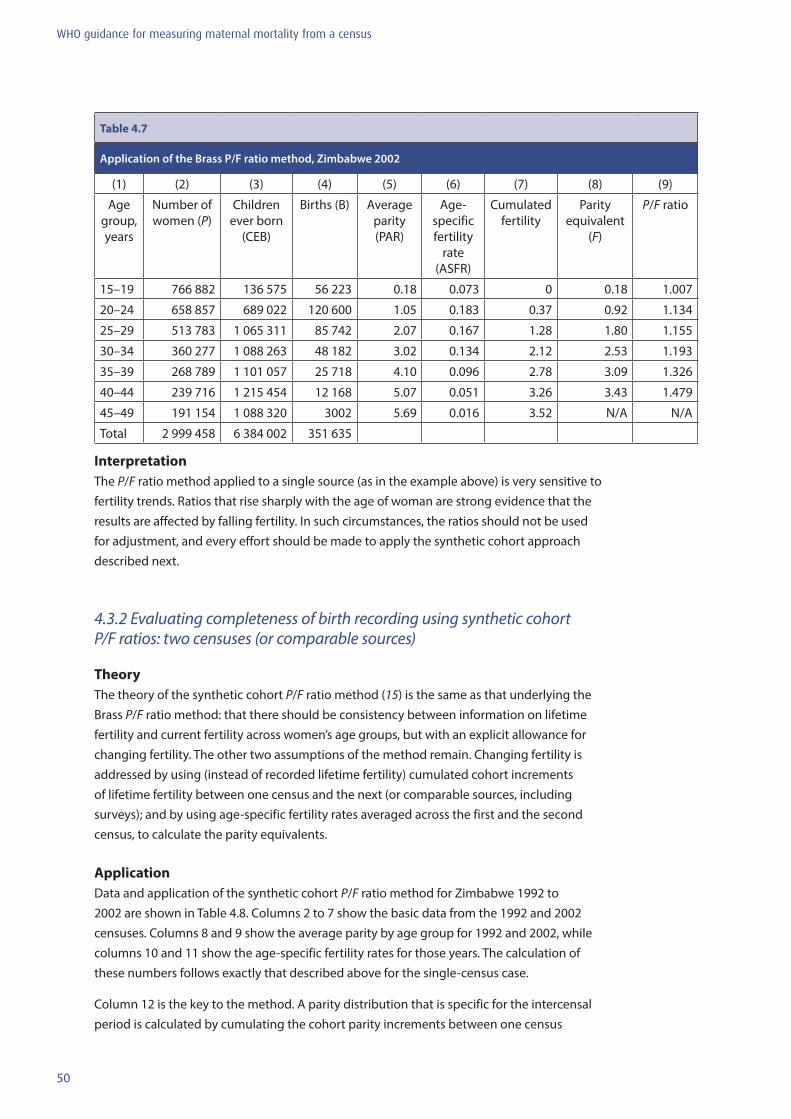
50
WHO guidance for measuring maternal mortality from a census
Table 4.7
Application of the Brass P/F ratio method, Zimbabwe 2002
(1) (2) (3) (4) (5) (6) (7) (8) (9)
Age group, years
Number of women (P)
Children ever born
(CEB)
Births (B) Average parity (PAR)
Age-specific fertility
rate (ASFR)
Cumulated fertility
Parity equivalent
(F)
P/F ratio
15–19 766 882 136 575 56 223 0.18 0.073 0 0.18 1.007
20–24 658 857 689 022 120 600 1.05 0.183 0.37 0.92 1.134
25–29 513 783 1 065 311 85 742 2.07 0.167 1.28 1.80 1.155
30–34 360 277 1 088 263 48 182 3.02 0.134 2.12 2.53 1.193
35–39 268 789 1 101 057 25 718 4.10 0.096 2.78 3.09 1.326
40–44 239 716 1 215 454 12 168 5.07 0.051 3.26 3.43 1.479
45–49 191 154 1 088 320 3002 5.69 0.016 3.52 N/A N/A
Total 2 999 458 6 384 002 351 635
InterpretationThe P/F ratio method applied to a single source (as in the example above) is very sensitive to fertility trends. Ratios that rise sharply with the age of woman are strong evidence that the results are affected by falling fertility. In such circumstances, the ratios should not be used for adjustment, and every effort should be made to apply the synthetic cohort approach described next.
4.3.2 Evaluating completeness of birth recording using synthetic cohort P/F ratios: two censuses (or comparable sources)
TheoryThe theory of the synthetic cohort P/F ratio method (15) is the same as that underlying the Brass P/F ratio method: that there should be consistency between information on lifetime fertility and current fertility across women’s age groups, but with an explicit allowance for changing fertility. The other two assumptions of the method remain. Changing fertility is addressed by using (instead of recorded lifetime fertility) cumulated cohort increments of lifetime fertility between one census and the next (or comparable sources, including surveys); and by using age-specific fertility rates averaged across the first and the second census, to calculate the parity equivalents.
ApplicationData and application of the synthetic cohort P/F ratio method for Zimbabwe 1992 to 2002 are shown in Table 4.8. Columns 2 to 7 show the basic data from the 1992 and 2002 censuses. Columns 8 and 9 show the average parity by age group for 1992 and 2002, while columns 10 and 11 show the age-specific fertility rates for those years. The calculation of these numbers follows exactly that described above for the single-census case.
Column 12 is the key to the method. A parity distribution that is specific for the intercensal period is calculated by cumulating the cohort parity increments between one census
51
WHO guidance for measuring maternal mortality from a census
and the next. For example, the age group of women aged 30–34 years in 2002 was aged 20–24 years in 1992; data errors and differential fertility by survival apart, the difference in parity of this cohort between 1992 and 2002 reflects fertility between 1992 and 2002. If these differences are cumulated across all age groups, the result is a parity distribution reflecting only fertility in the decade, but derived from the information on lifetime fertility.
For the age groups 15–19 years and 20–24 years in 2002, there is no information about their parity in 1992 (it is assumed to have been zero), so the change in cohort parity is equal to the reported parity in 2002.
For the age group 25–29 years, the change in cohort parity is equal to PAR(25–29) in 2002 minus PAR(15–19) in 1992; the synthetic cohort parity is equal to this change plus the already-calculated synthetic cohort parity (PARSYN) of the 15–19 years age group in 2002. For the age group 30–34 years, the change in cohort parity is equal to PAR(30–34) in 2002 minus PAR(20–24) in 1992; the synthetic cohort parity is equal to this change plus the already-calculated parity of the 20–24 years age group in 2002. The full synthetic cohort distribution is completed by continuing to chain together cohort parity changes from 1992 to 2002.
For example, for the age group 30–34 years:
PARSYN(30–34) = PARSYN(20–24) + change in cohort parity
= PARSYN(20–24) + (PAR2002(30–34) – PAR1992(20–24))
= 1.046 + (3.021 – 1.119)
= 2.947
Note that if the two sources being used are separated by only 5 years (and the time intervals need only be approximate), the synthetic cohort parity distribution is calculated by summing cohort changes between adjacent 5-year age groups, 15–19 to 20–24, 20–24 to 25–29, etc. Column 13 averages the age-specific fertility rates for the beginning and end of the period, in this case for 1992 and 2002. Columns 14, 15 and 16 are exactly the same as columns 7 to 9 in Table 4.7.
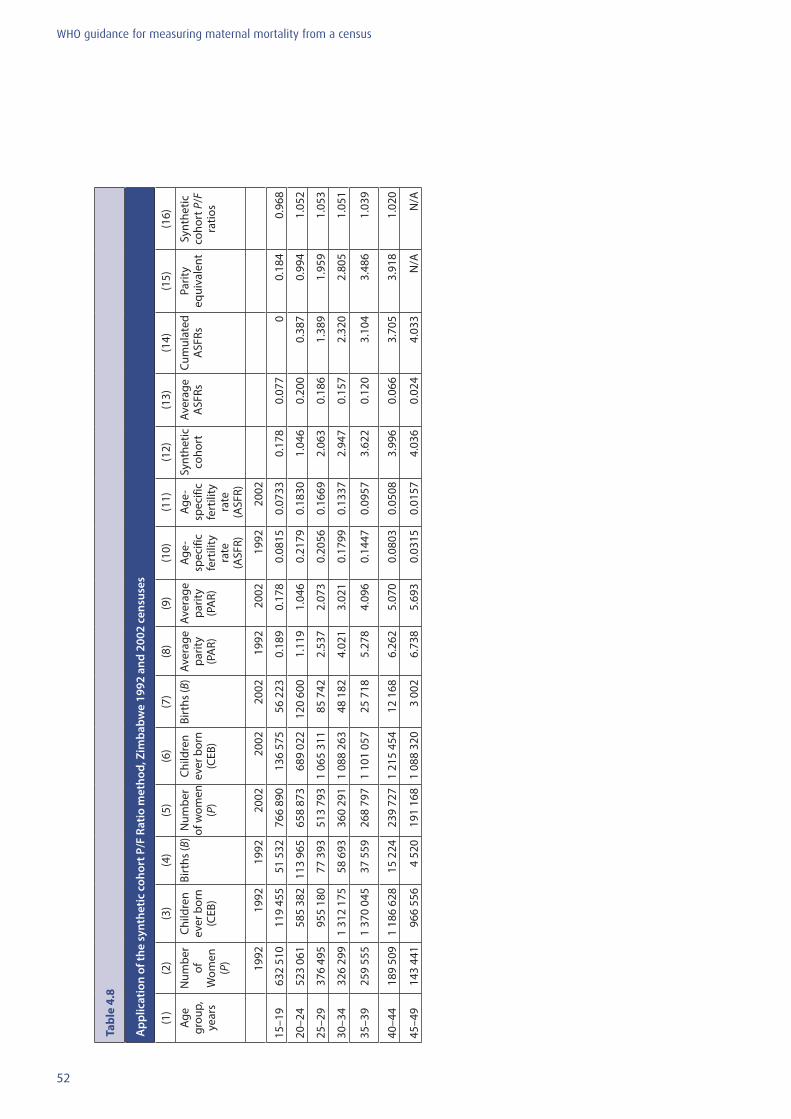
52
WHO guidance for measuring maternal mortality from a census
Tabl
e 4.
8
App
licat
ion
of th
e sy
nthe
tic c
ohor
t P/F
Rat
io m
etho
d, Z
imba
bwe
1992
and
200
2 ce
nsus
es
(1)
(2)
(3)
(4)
(5)
(6)
(7)
(8)
(9)
(10)
(11)
(12)
(13)
(14)
(15)
(16)
Age
grou
p,
year
s
Num
ber
of
Wom
en
(P)
Child
ren
ever
bor
n (C
EB)
Birt
hs (B
)N
umbe
r of
wom
en
(P)
Child
ren
ever
bor
n (C
EB)
Birt
hs (B
)Av
erag
e pa
rity
(PA
R)
Aver
age
parit
y (P
AR)
Age-
spec
ific
fert
ility
ra
te
(ASF
R)
Age-
spec
ific
fert
ility
ra
te
(ASF
R)
Synt
hetic
co
hort
Aver
age
ASF
RsCu
mul
ated
A
SFRs
Parit
y eq
uiva
lent
Synt
hetic
co
hort
P/F
ra
tios
1992
1992
1992
2002
2002
2002
1992
2002
1992
2002
15–1
9 63
2 51
011
9 45
551
532
766
890
136
575
56 2
230.
189
0.17
80.
0815
0.07
330.
178
0.07
70
0.18
40.
968
20–2
4 52
3 06
158
5 38
211
3 96
565
8 87
368
9 02
212
0 60
01.
119
1.04
60.
2179
0.18
301.
046
0.20
00.
387
0.99
41.
052
25–2
9 37
6 49
595
5 18
077
393
513
793
1 06
5 31
185
742
2.53
72.
073
0.20
560.
1669
2.06
30.
186
1.38
91.
959
1.05
3
30–3
4 32
6 29
91
312
175
58 6
9336
0 29
11
088
263
48 1
824.
021
3.02
10.
1799
0.13
372.
947
0.15
72.
320
2.80
51.
051
35–3
9 25
9 55
51
370
045
37 5
5926
8 79
71
101
057
25 7
185.
278
4.09
60.
1447
0.09
573.
622
0.12
03.
104
3.48
61.
039
40–4
4 18
9 50
91
186
628
15 2
2423
9 72
71
215
454
12 1
686.
262
5.07
00.
0803
0.05
083.
996
0.06
63.
705
3.91
81.
020
45–4
9 14
3 44
196
6 55
64
520
191
168
1 08
8 32
03
002
6.73
85.
693
0.03
150.
0157
4.03
60.
024
4.03
3N
/AN
/A
53
WHO guidance for measuring maternal mortality from a census
InterpretationThe synthetic cohort P/F ratios in column 16 are essentially constant for the age range 20 to 34 years, and only fall very slightly to age 40–44 years (note that the ratio for the age group 15–19 years is rather different from the others: this reflects the fact that the simple quadratic used to interpolate between the cumulated age-specific fertility rates is probably a poor approximation to the true pattern of change with age). The average ratio for the age groups 20 to 29 years is 1.010, indicating almost perfect consistency. The high consistency of the ratios across ages, and the lack of evident trend make this a highly credible estimate, and suggest that an adjustment should be made to arrive at an estimate of intercensal births.
Note for users of the spreadsheet (2)
In this section, we have reviewed methods for evaluation of the completeness of birth recording. Spreadsheet “P/F ratios single survey” is for application of the Brass P/F ratios method when data are available from only one census. Spreadsheet “P/F ratios two surveys 10 years” is for application of the synthetic cohort P/F ratio method when two censuses are available with a 10-year intercensal period. Spreadsheet “P/F ratios two surveys 5 years” is for application of the synthetic cohort P/F ratio method when the intercensal period is 5 years.
Users must prepare all information in comparable age groups before using the Excel spreadsheets. Please read the “instruction” and “built in functions” files for the Maternal Mortality Package prior to using the spreadsheets. Summary measures appear in the box on the bottom of each spreadsheet. Again, it is strongly recommended to rename the file before entering any data, to avoid corrupting the file or inadvertently changing any of the cell definitions.
4.4 Evaluating the classification of deaths as maternalThe fourth census data component for measuring maternal mortality that requires evaluation is the classification of adult female deaths as maternal (that is, deaths occurring during pregnancy, delivery or the postpartum period). However, there are no established methods for this evaluation, and there is little knowledge of empirical regularities against which observations can be compared. The best approach is simply to look at patterns by age group and assess their plausibility. Given that the risk for a maternal death is a pregnancy, the proportion of deaths that are maternal should vary across age groups, following approximately the distribution of births by maternal age, but perhaps with rather higher proportions at the youngest and oldest ages reflecting the higher risk of a maternal death. Similarly, maternal mortality ratios may be expected to show a “J”-shaped distribution by age, reflecting the higher risks at younger and older ages.
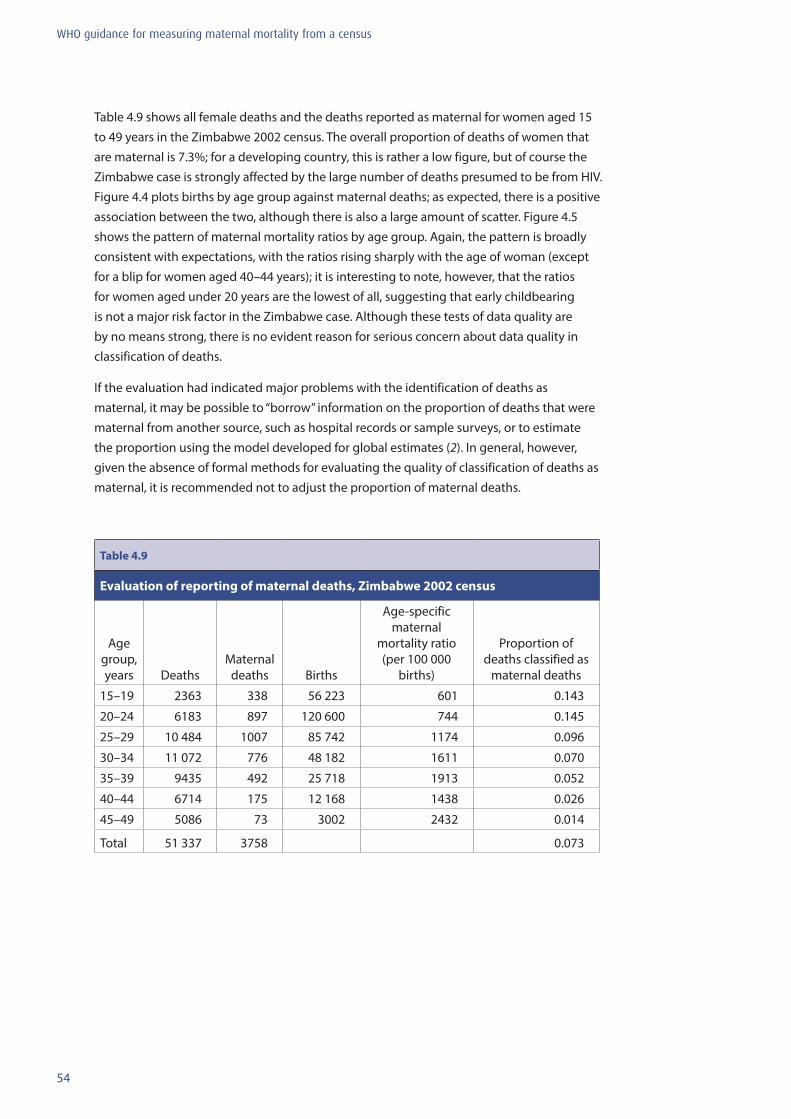
54
WHO guidance for measuring maternal mortality from a census
Table 4.9 shows all female deaths and the deaths reported as maternal for women aged 15 to 49 years in the Zimbabwe 2002 census. The overall proportion of deaths of women that are maternal is 7.3%; for a developing country, this is rather a low figure, but of course the Zimbabwe case is strongly affected by the large number of deaths presumed to be from HIV. Figure 4.4 plots births by age group against maternal deaths; as expected, there is a positive association between the two, although there is also a large amount of scatter. Figure 4.5 shows the pattern of maternal mortality ratios by age group. Again, the pattern is broadly consistent with expectations, with the ratios rising sharply with the age of woman (except for a blip for women aged 40–44 years); it is interesting to note, however, that the ratios for women aged under 20 years are the lowest of all, suggesting that early childbearing is not a major risk factor in the Zimbabwe case. Although these tests of data quality are by no means strong, there is no evident reason for serious concern about data quality in classification of deaths.
If the evaluation had indicated major problems with the identification of deaths as maternal, it may be possible to “borrow” information on the proportion of deaths that were maternal from another source, such as hospital records or sample surveys, or to estimate the proportion using the model developed for global estimates (2). In general, however, given the absence of formal methods for evaluating the quality of classification of deaths as maternal, it is recommended not to adjust the proportion of maternal deaths.
Table 4.9
Evaluation of reporting of maternal deaths, Zimbabwe 2002 census
Age group, years Deaths
Maternal deaths Births
Age-specific maternal
mortality ratio (per 100 000
births)
Proportion of deaths classified as
maternal deaths
15–19 2363 338 56 223 601 0.143
20–24 6183 897 120 600 744 0.145
25–29 10 484 1007 85 742 1174 0.096
30–34 11 072 776 48 182 1611 0.070
35–39 9435 492 25 718 1913 0.052
40–44 6714 175 12 168 1438 0.026
45–49 5086 73 3002 2432 0.014
Total 51 337 3758 0.073
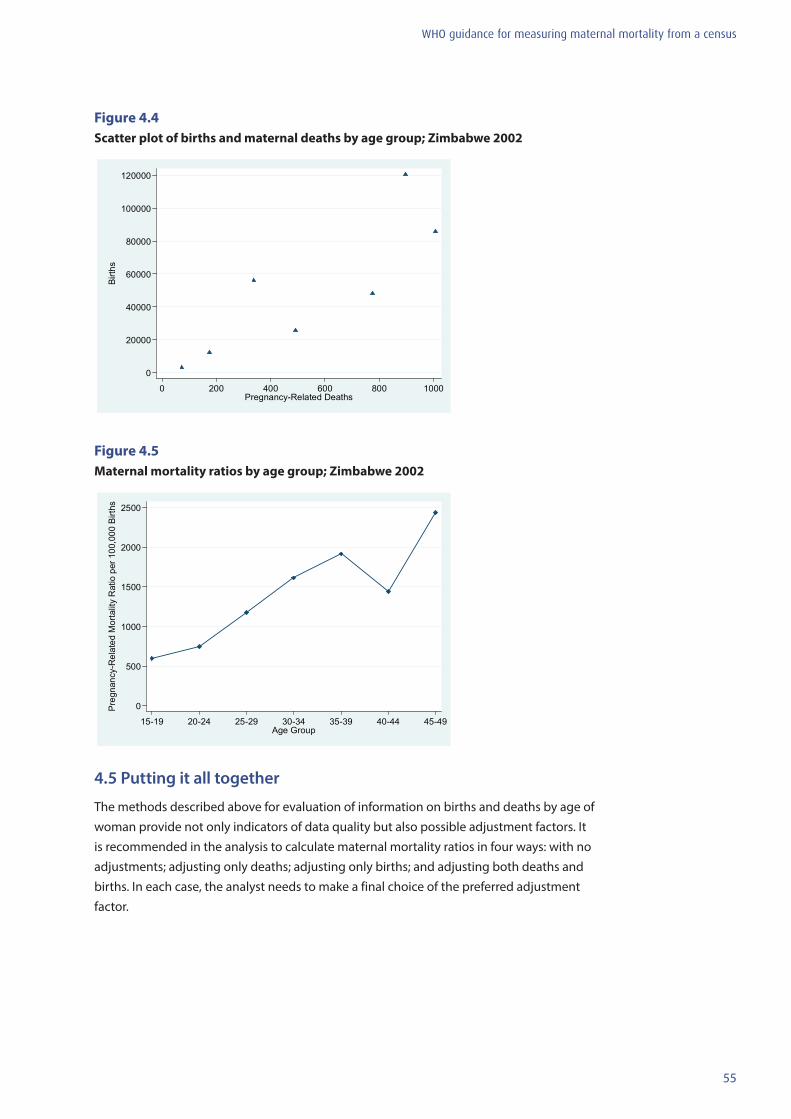
55
WHO guidance for measuring maternal mortality from a census
Figure 4.4 Scatter plot of births and maternal deaths by age group; Zimbabwe 2002
0
20000
40000
60000
80000
100000
120000
Birth
s
0 200 400 600 800 1000Pregnancy-Related Deaths
Figure 4.5 Maternal mortality ratios by age group; Zimbabwe 2002
0
500
1000
1500
2000
2500
Preg
nanc
y-R
elat
ed M
orta
lity
Rat
io p
er 1
00,0
00 B
irths
15-19 20-24 25-29 30-34 35-39 40-44 45-49Age Group
4.5 Putting it all together
The methods described above for evaluation of information on births and deaths by age of woman provide not only indicators of data quality but also possible adjustment factors. It is recommended in the analysis to calculate maternal mortality ratios in four ways: with no adjustments; adjusting only deaths; adjusting only births; and adjusting both deaths and births. In each case, the analyst needs to make a final choice of the preferred adjustment factor.
56
WHO guidance for measuring maternal mortality from a census
Note for users of the Spreadsheet (3)
Using examples from Zimbabwe, four summary spreadsheets are included. The spreadsheet “Preg-related deaths vs births” summarizes estimates of coverage of deaths and births. The spreadsheet, “Age-Spec Morality rates”, further presents age-specific death rates, adjusted for estimated completeness of death recording. The final spreadsheet, Summary MMRatio, summarizes MMRatio in 2002, with and without adjustment. Each spreadsheet shows adjustment factors and summary measures by adjustment approach, based on data availability on population age distributions (i.e. mortality adjustment based on the Brass growth balance method versus the GGB, SEG, and/or combined GGB–SEG methods) and parity (i.e. birth adjustment based on the P/F ratio versus the synthetic cohort P/F ratio method).
Please read the “instruction” and “built in functions” files for the Maternal Mortality Package prior to using the spreadsheet. Again, it is strongly recommended to rename the file before entering any data, to avoid corrupting the file or inadvertently changing any of the cell definitions.
4.6 Examples of evaluations from other settings
Experience in many settings indicates that the evaluation and adjustment of births using P/F ratios is non-problematic as long as the synthetic cohort approach to evaluation can be used. Almost all countries have multiple sources of data on lifetime fertility (from censuses and household surveys such as DHSs), so it is almost always possible to use the preferred approach. Thus we do not provide examples of evaluations of fertility data from other settings (though it is worth noting that adjustments may sometimes be quite large, involving inflation factors as large as 50%).
The evaluation of death reporting, on the other hand, is less satisfactory. It is often the case that the GGB and SEG approaches indicate different adjustment factors, and the points for different age groups may not align themselves neatly on a straight line (GGB) or be consistent across different age groups (SEG). There are probably many reasons for these problems, including net migration, change in census coverage (SEG), age misreporting, and coverage that is not constant with age. There is no simple solution as to how to proceed, or which estimate to prefer. In this section, we show examples of GGB, SEG and combined GGB–SEG plots for female deaths recorded by censuses from Latin America (Honduras), Africa (Benin) and Asia (Lao People’s Democratic Republic), with commentary on interpretation.
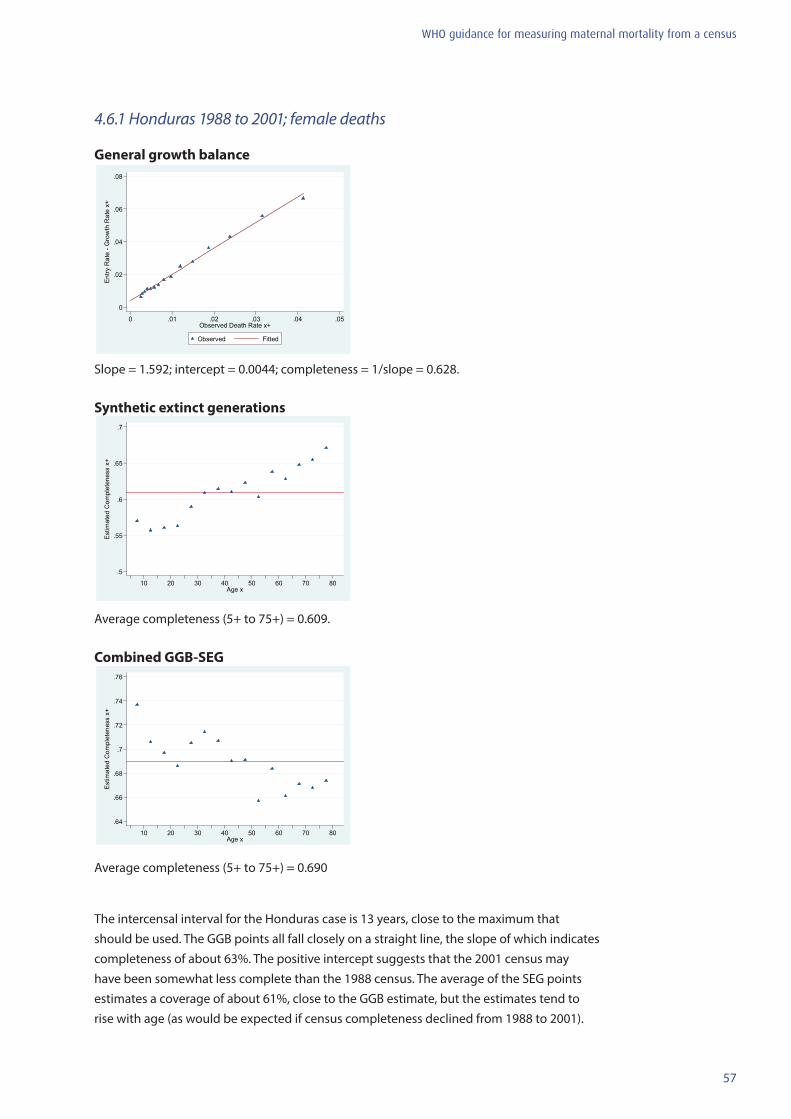
57
WHO guidance for measuring maternal mortality from a census
4.6.1 Honduras 1988 to 2001; female deaths
General growth balance
0
.02
.04
.06
.08
Ent
ry R
ate
- Gro
wth
Rat
e x+
0 .01 .02 .03 .04 .05Observed Death Rate x+
Observed Fitted
Slope = 1.592; intercept = 0.0044; completeness = 1/slope = 0.628.
Synthetic extinct generations
.5
.55
.6
.65
.7
Est
imat
ed C
ompl
eten
ess
x+
10 20 30 40 50 60 70 80Age x
Average completeness (5+ to 75+) = 0.609.
Combined GGB-SEG
.64
.66
.68
.7
.72
.74
.76
Est
imat
ed C
ompl
eten
ess
x+
10 20 30 40 50 60 70 80Age x
Average completeness (5+ to 75+) = 0.690
The intercensal interval for the Honduras case is 13 years, close to the maximum that should be used. The GGB points all fall closely on a straight line, the slope of which indicates completeness of about 63%. The positive intercept suggests that the 2001 census may have been somewhat less complete than the 1988 census. The average of the SEG points estimates a coverage of about 61%, close to the GGB estimate, but the estimates tend to rise with age (as would be expected if census completeness declined from 1988 to 2001).
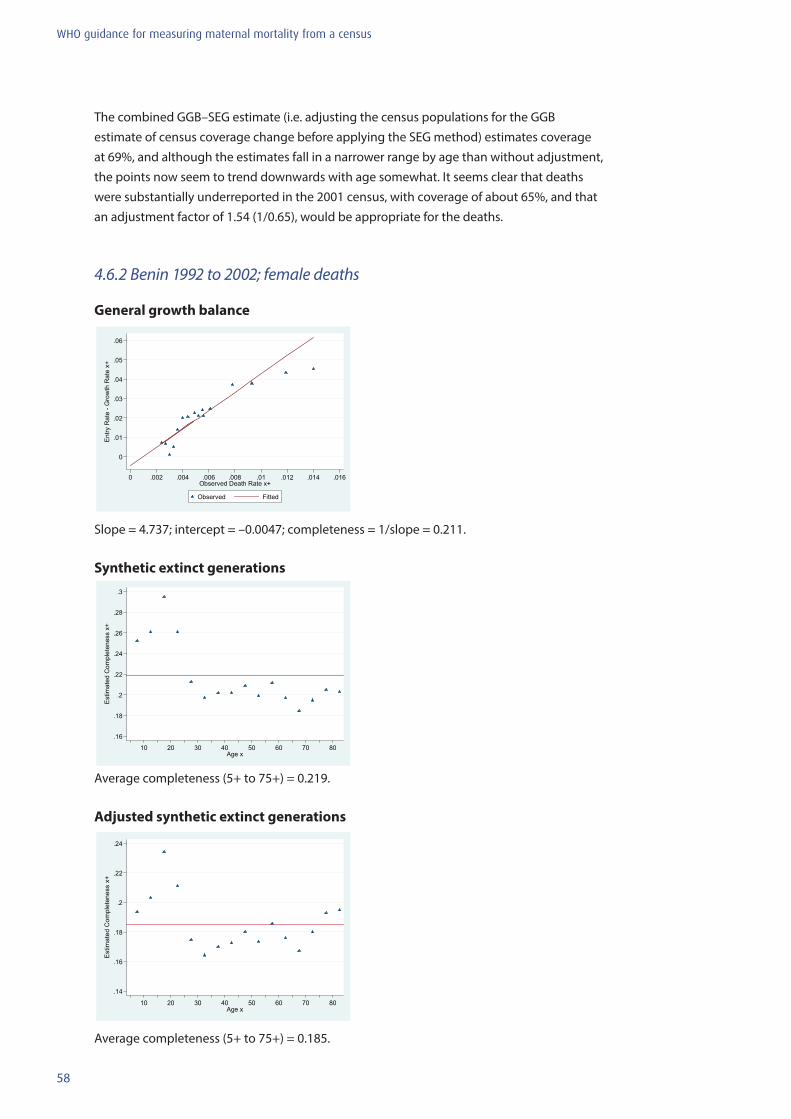
58
WHO guidance for measuring maternal mortality from a census
The combined GGB–SEG estimate (i.e. adjusting the census populations for the GGB estimate of census coverage change before applying the SEG method) estimates coverage at 69%, and although the estimates fall in a narrower range by age than without adjustment, the points now seem to trend downwards with age somewhat. It seems clear that deaths were substantially underreported in the 2001 census, with coverage of about 65%, and that an adjustment factor of 1.54 (1/0.65), would be appropriate for the deaths.
4.6.2 Benin 1992 to 2002; female deaths
General growth balance
0
.01
.02
.03
.04
.05
.06
Ent
ry R
ate
- Gro
wth
Rat
e x+
0 .002 .004 .006 .008 .01 .012 .014 .016Observed Death Rate x+
Observed Fitted
Slope = 4.737; intercept = –0.0047; completeness = 1/slope = 0.211.
Synthetic extinct generations
.16
.18
.2
.22
.24
.26
.28
.3
Est
imat
ed C
ompl
eten
ess
x+
10 20 30 40 50 60 70 80Age x
Average completeness (5+ to 75+) = 0.219.
Adjusted synthetic extinct generations
.14
.16
.18
.2
.22
.24
Est
imat
ed C
ompl
eten
ess
x+
10 20 30 40 50 60 70 80Age x
Average completeness (5+ to 75+) = 0.185.
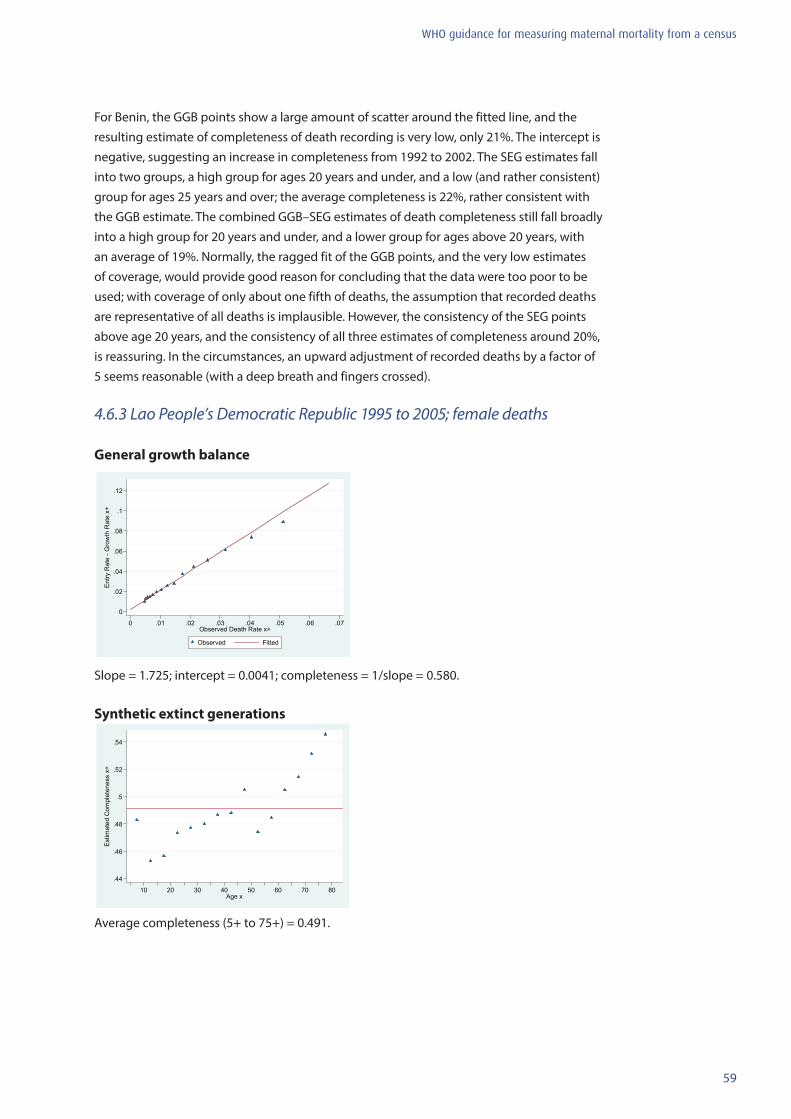
59
WHO guidance for measuring maternal mortality from a census
For Benin, the GGB points show a large amount of scatter around the fitted line, and the resulting estimate of completeness of death recording is very low, only 21%. The intercept is negative, suggesting an increase in completeness from 1992 to 2002. The SEG estimates fall into two groups, a high group for ages 20 years and under, and a low (and rather consistent) group for ages 25 years and over; the average completeness is 22%, rather consistent with the GGB estimate. The combined GGB–SEG estimates of death completeness still fall broadly into a high group for 20 years and under, and a lower group for ages above 20 years, with an average of 19%. Normally, the ragged fit of the GGB points, and the very low estimates of coverage, would provide good reason for concluding that the data were too poor to be used; with coverage of only about one fifth of deaths, the assumption that recorded deaths are representative of all deaths is implausible. However, the consistency of the SEG points above age 20 years, and the consistency of all three estimates of completeness around 20%, is reassuring. In the circumstances, an upward adjustment of recorded deaths by a factor of 5 seems reasonable (with a deep breath and fingers crossed).
4.6.3 Lao People’s Democratic Republic 1995 to 2005; female deaths General growth balance
0
.02
.04
.06
.08
.1
.12
Ent
ry R
ate
- Gro
wth
Rat
e x+
0 .01 .02 .03 .04 .05 .06 .07Observed Death Rate x+
Observed Fitted
Slope = 1.725; intercept = 0.0041; completeness = 1/slope = 0.580.
Synthetic extinct generations
.44
.46
.48
.5
.52
.54
Est
imat
ed C
ompl
eten
ess
x+
10 20 30 40 50 60 70 80Age x
Average completeness (5+ to 75+) = 0.491.
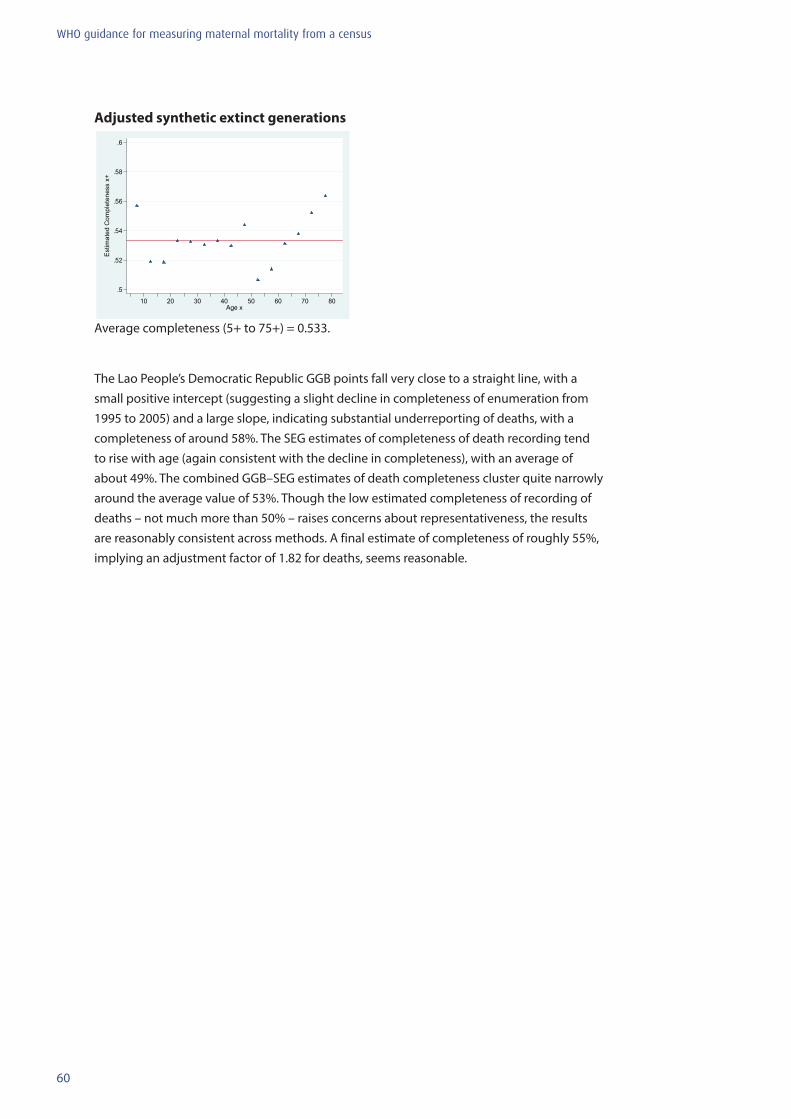
60
WHO guidance for measuring maternal mortality from a census
Adjusted synthetic extinct generations
.5
.52
.54
.56
.58
.6
Est
imat
ed C
ompl
eten
ess
x+
10 20 30 40 50 60 70 80Age x
Average completeness (5+ to 75+) = 0.533.
The Lao People’s Democratic Republic GGB points fall very close to a straight line, with a small positive intercept (suggesting a slight decline in completeness of enumeration from 1995 to 2005) and a large slope, indicating substantial underreporting of deaths, with a completeness of around 58%. The SEG estimates of completeness of death recording tend to rise with age (again consistent with the decline in completeness), with an average of about 49%. The combined GGB–SEG estimates of death completeness cluster quite narrowly around the average value of 53%. Though the low estimated completeness of recording of deaths – not much more than 50% – raises concerns about representativeness, the results are reasonably consistent across methods. A final estimate of completeness of roughly 55%, implying an adjustment factor of 1.82 for deaths, seems reasonable.

61
WHO guidance for measuring maternal mortality from a census

62
WHO guidance for measuring maternal mortality from a census
63
WHO guidance for measuring maternal mortality from a census
5. Results dissemination and use
A basic premise of this manual is that maternal mortality should be measured via the census only if the government is committed to putting the results to use. It is recommended that even as the census is being planned, a task force be convened to begin planning for dissemination of the results. This dissemination should target all stakeholders, including staff from relevant ministries, professional associations (obstetrics, gynaecology, midwifery and nursing), nongovernmental and donor agencies and local journalists.
This chapter provides suggestions regarding the content of a report highlighting maternal mortality data collected via a census. It is proposed as a template for statistics office and MOH personnel to use and adapt as they design a report that will most effectively convey the data in a policy- and programme-relevant manner. Necessary funding for the printing and distribution of this report should be resolved in advance.
5.1 Suggested outline for a report on maternal mortality
Executive summary – 1 page
Chapter 1: Introduction• Description of maternal health policies and priorities over the past 5 to 10 years in the
country.• Discussion of existing data on maternal mortality in the country (from official statistics,
hospital statistics, whatever else is available).• A statement regarding the rationale for including the maternal mortality questions in the
20xx census of this country.• Purpose of this report: to summarize results regarding maternal mortality in the country
using data from the census, as well as other existing data on process indicators from health facilities and surveys (if available).
Chapter 2: Brief description of the method for measuring maternal mortality in the 20xx census• Identification of all household deaths in the 12 or 24 months prior to the date specified in
the census.• Among deaths to reproductive-aged women, three questions were asked to determine the
timing of the death relative to pregnancy, childbirth and the postpartum period (include exact formulation of the questions used in the census questionnaire).
• Recording of all live births to women in the household in the last 12 months, as well as questions regarding the total number of live births to each woman in the household (i.e. children ever born).
• Given that data-quality problems such as underreporting, and at times overreporting, of deaths and births are well documented in census data, evaluation and adjustment of the data were carried out using established demographic techniques, described in more detail in this manual.
64
WHO guidance for measuring maternal mortality from a census
Chapter 3: Levels and differentials of maternal mortality• Table of national-level MMRatio, MMRate and the PMDF (see dummy table below).• Brief discussion on the agreement or lack thereof among existing maternal mortality
estimates for the country.• Brief discussion of the adjustments (if any) to the census-based data on births, adult
female deaths and consequently on the MMRatio, MMRate and PMDF following the data-evaluation/adjustment exercise.
Dummy table Comparison of maternal mortality estimates
National MMRatio per 100 000 live births from the census, 20xx
Other existing estimates of the MMRatio per 100 000 live births
WHO estimate of the MMRatio per 100 000 live births, 2012
MMRate per 1000 women of reproductive age
Proportion of deaths classified as maternal deaths
Other exising estimates of the proportion of deaths classified as maternal deaths
• MMRatio by subnational region: tables, graphs and/or maps of the country can be used to present these results. In particular, mapping is recommended as a very effective way of communicating these maternal mortality data to a broad audience. A number of dif-ferent software programs now exist to allow the production of colour-coded maps to illustrate subnational-level statistics. Again, choosing the software, training personnel in its use and resolving any geocoding issues, in advance, is highly recommended.
• MMRatio by age group: tables and/or graphs can be used to show age-patterns of ma-ternal morality (see dummy table below).
Dummy table MMRatio by 5-year age groups (per 100 000 live births)
Woman’s age, years
15–49 20–24 25–29 30–34 35–39 40–44 45–49
MMRatio
• MMRatio by other category: just as census-based data can be used to produce subna-tional and age-specific estimates of maternal mortality, these data can also produce MMRatios by other factors, such as socioeconomic status (which could be defined in a variety of ways, including occupation of the head of household or wealth quintiles (22). However, the use of these variables as differentials will require additional analysis before the beginning of the data-evaluation/adjustment exercise.
65
WHO guidance for measuring maternal mortality from a census
Chapter 4: Process indicators of the availability and use of maternal health-care servicesThe content of this chapter will depend on the availability of recent data from national surveys such as the DHSs, the United Nations Children’s Fund (UNICEF) Multiple Indicators Cluster Survey, or other nationally representative surveys, or from the MOH routine health-information system. It is recommended that data from a local study or demographic surveillance site should not be included in this chapter, as these data sources are rarely representative of the entire country.
Web-based data sources, such as the DHS STATcompiler (23) allow for fast and easy access to process-indicator data for countries with a recent DHS survey. Tables 5.1 and 5.2 and Figures 5.1 and 5.2 are examples from a recent survey in India. These present data on the percentage of recent live births by the type of attendant assisting the birth and the place of delivery. The data can be presented in tabular format or can easily be graphed using Excel or other spreadsheet software. Examples of both are provided in the Tables 5.1 and 5.2 and Figures 5.1 and 5.2. Other relevant indicators for this chapter include the percentage of recent births delivered via caesarean section (which is often interpreted as an indicator of access to emergency obstetric care) and the percentage of recent births for which the mother received antenatal care.
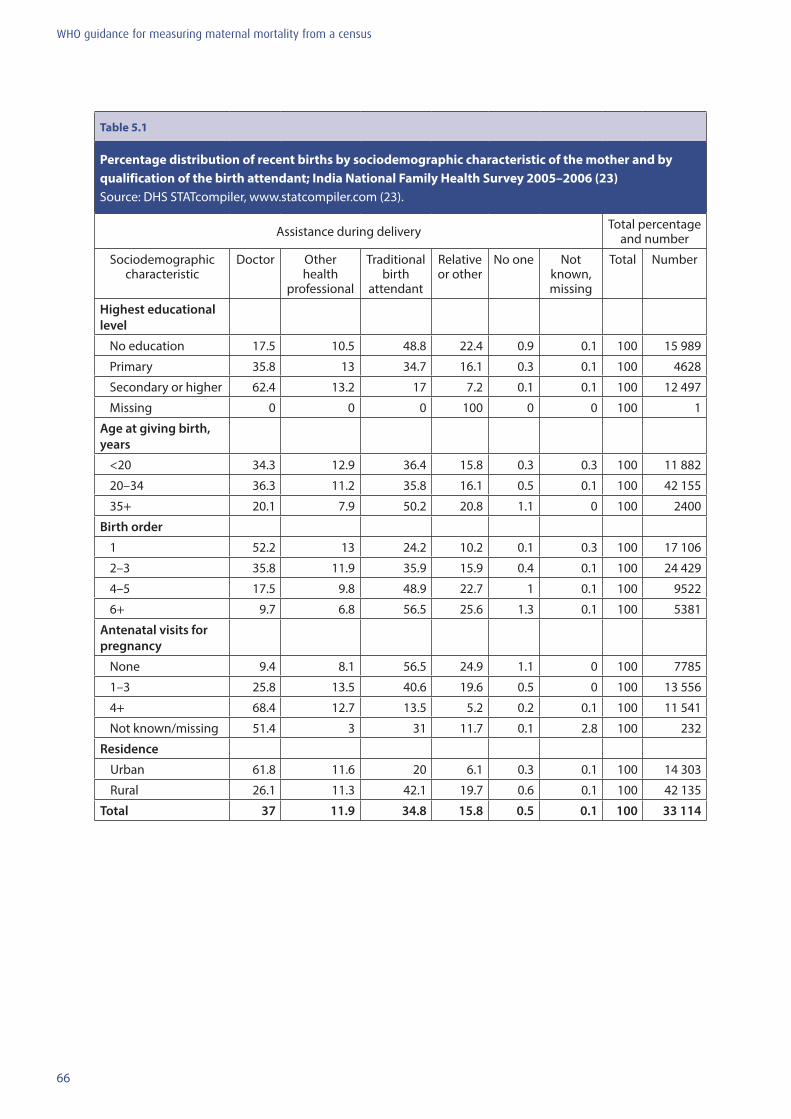
66
WHO guidance for measuring maternal mortality from a census
Table 5.1
Percentage distribution of recent births by sociodemographic characteristic of the mother and by qualification of the birth attendant; India National Family Health Survey 2005–2006 (23) Source: DHS STATcompiler, www.statcompiler.com (23).
Assistance during delivery Total percentage and number
Sociodemographic characteristic
Doctor Other health
professional
Traditional birth
attendant
Relative or other
No one Not known, missing
Total Number
Highest educational level
No education 17.5 10.5 48.8 22.4 0.9 0.1 100 15 989
Primary 35.8 13 34.7 16.1 0.3 0.1 100 4628
Secondary or higher 62.4 13.2 17 7.2 0.1 0.1 100 12 497
Missing 0 0 0 100 0 0 100 1
Age at giving birth, years
<20 34.3 12.9 36.4 15.8 0.3 0.3 100 11 882
20–34 36.3 11.2 35.8 16.1 0.5 0.1 100 42 155
35+ 20.1 7.9 50.2 20.8 1.1 0 100 2400
Birth order
1 52.2 13 24.2 10.2 0.1 0.3 100 17 106
2–3 35.8 11.9 35.9 15.9 0.4 0.1 100 24 429
4–5 17.5 9.8 48.9 22.7 1 0.1 100 9522
6+ 9.7 6.8 56.5 25.6 1.3 0.1 100 5381
Antenatal visits for pregnancy
None 9.4 8.1 56.5 24.9 1.1 0 100 7785
1–3 25.8 13.5 40.6 19.6 0.5 0 100 13 556
4+ 68.4 12.7 13.5 5.2 0.2 0.1 100 11 541
Not known/missing 51.4 3 31 11.7 0.1 2.8 100 232
Residence
Urban 61.8 11.6 20 6.1 0.3 0.1 100 14 303
Rural 26.1 11.3 42.1 19.7 0.6 0.1 100 42 135
Total 37 11.9 34.8 15.8 0.5 0.1 100 33 114
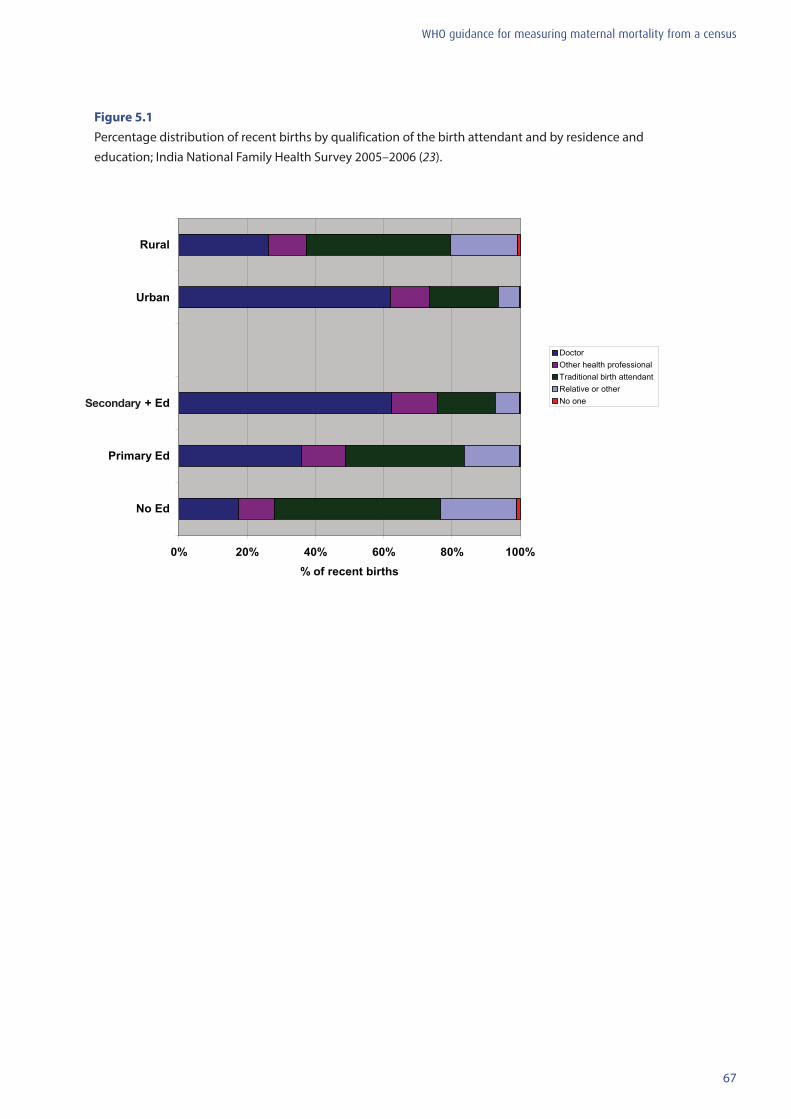
67
WHO guidance for measuring maternal mortality from a census
Figure 5.1 Percentage distribution of recent births by qualification of the birth attendant and by residence and education; India National Family Health Survey 2005–2006 (23).
0% 20% 40% 60% 80% 100%
No Ed
Primary Ed
2ndary+ Ed
Urban
Rural
% of recent births
Doctor Other health professional Traditional birth attendant Relative or other No one Secondary
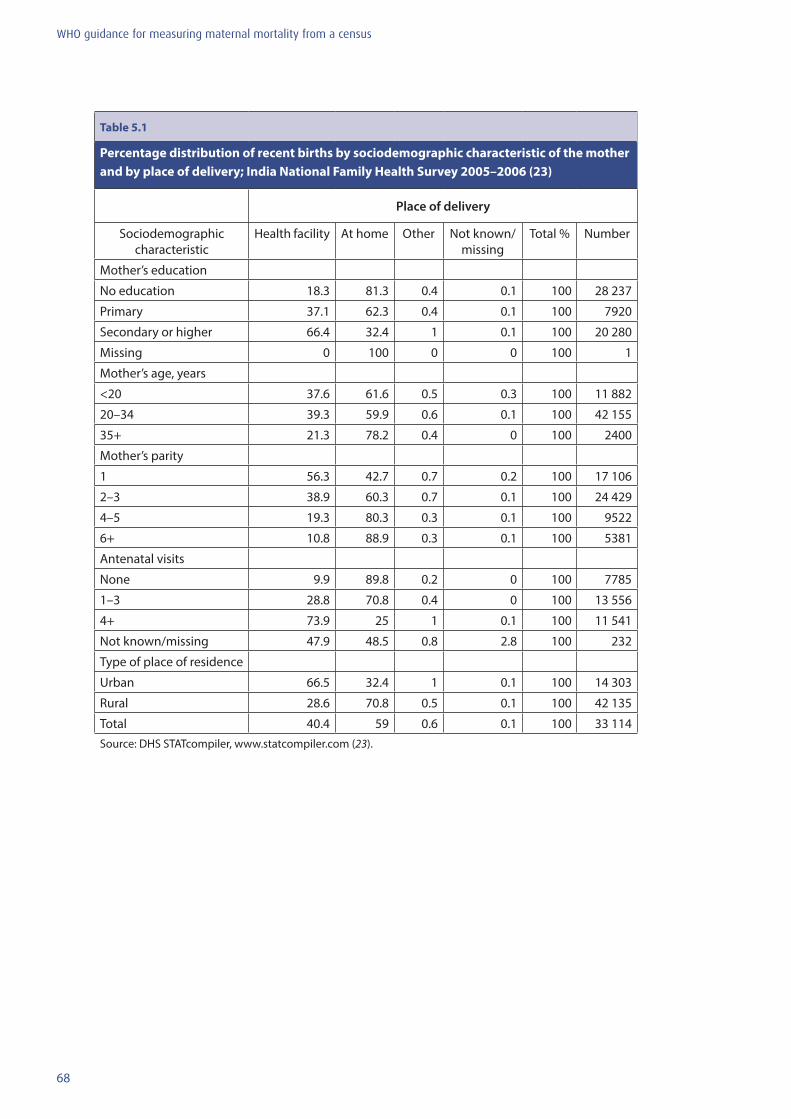
68
WHO guidance for measuring maternal mortality from a census
Table 5.1
Percentage distribution of recent births by sociodemographic characteristic of the mother and by place of delivery; India National Family Health Survey 2005–2006 (23)
Place of delivery
Sociodemographic characteristic
Health facility At home Other Not known/missing
Total % Number
Mother’s education
No education 18.3 81.3 0.4 0.1 100 28 237
Primary 37.1 62.3 0.4 0.1 100 7920
Secondary or higher 66.4 32.4 1 0.1 100 20 280
Missing 0 100 0 0 100 1
Mother’s age, years
<20 37.6 61.6 0.5 0.3 100 11 882
20–34 39.3 59.9 0.6 0.1 100 42 155
35+ 21.3 78.2 0.4 0 100 2400
Mother’s parity
1 56.3 42.7 0.7 0.2 100 17 106
2–3 38.9 60.3 0.7 0.1 100 24 429
4–5 19.3 80.3 0.3 0.1 100 9522
6+ 10.8 88.9 0.3 0.1 100 5381
Antenatal visits
None 9.9 89.8 0.2 0 100 7785
1–3 28.8 70.8 0.4 0 100 13 556
4+ 73.9 25 1 0.1 100 11 541
Not known/missing 47.9 48.5 0.8 2.8 100 232
Type of place of residence
Urban 66.5 32.4 1 0.1 100 14 303
Rural 28.6 70.8 0.5 0.1 100 42 135
Total 40.4 59 0.6 0.1 100 33 114Source: DHS STATcompiler, www.statcompiler.com (23).
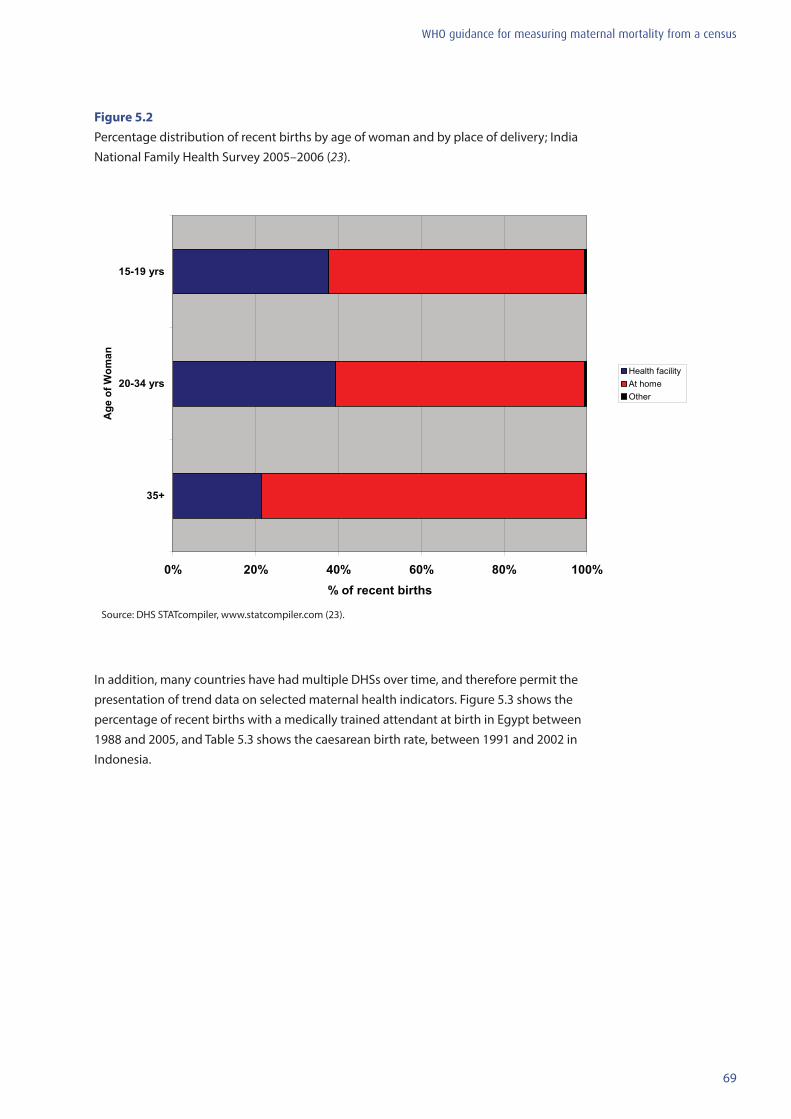
69
WHO guidance for measuring maternal mortality from a census
Figure 5.2 Percentage distribution of recent births by age of woman and by place of delivery; India National Family Health Survey 2005–2006 (23).
In addition, many countries have had multiple DHSs over time, and therefore permit the presentation of trend data on selected maternal health indicators. Figure 5.3 shows the percentage of recent births with a medically trained attendant at birth in Egypt between 1988 and 2005, and Table 5.3 shows the caesarean birth rate, between 1991 and 2002 in Indonesia.
Source: DHS STATcompiler, www.statcompiler.com (23).
0% 20% 40% 60% 80% 100%
35+
20-34 yrs
15-19 yrs
Age
of W
oman
% of recent births
Health facility At home Other
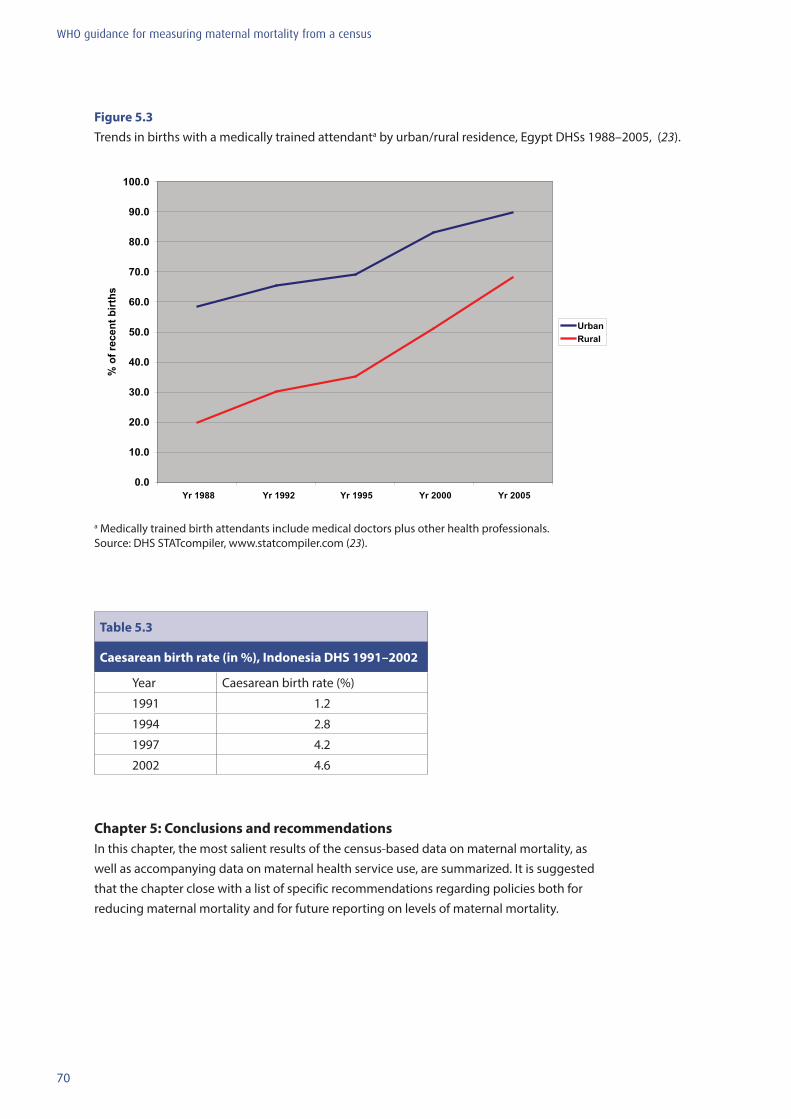
70
WHO guidance for measuring maternal mortality from a census
Figure 5.3 Trends in births with a medically trained attendanta by urban/rural residence, Egypt DHSs 1988–2005, (23).
0.0
10.0
20.0
30.0
40.0
50.0
60.0
70.0
80.0
90.0
100.0
Yr 1988 Yr 1992 Yr 1995 Yr 2000 Yr 2005
% o
f rec
ent b
irths
UrbanRural
a Medically trained birth attendants include medical doctors plus other health professionals.Source: DHS STATcompiler, www.statcompiler.com (23).
Table 5.3
Caesarean birth rate (in %), Indonesia DHS 1991–2002
Year Caesarean birth rate (%)
1991 1.2
1994 2.8
1997 4.2
2002 4.6
Chapter 5: Conclusions and recommendationsIn this chapter, the most salient results of the census-based data on maternal mortality, as well as accompanying data on maternal health service use, are summarized. It is suggested that the chapter close with a list of specific recommendations regarding policies both for reducing maternal mortality and for future reporting on levels of maternal mortality.
71
WHO guidance for measuring maternal mortality from a census
References
1. United Nations. Millennium Development Goals (http://www.un.org/millenniumgoals/, accessed 4 November 2011).
2. World Health Organization, UNICEF, UNFPA, and The World Bank. Trends in maternal mortality: 1990 to 2010. WHO, UNICEF, UNFPA, and The World Bank estimates. Geneva, World Health Organization, 2012.
3. Graham W et al. Measuring maternal mortality: an overview of opportunities and options for developing countries. BMC Medicine, 2008, 6:12.
4. United Nations Statistics Division, Department of Economic and Social Affairs. Principles and recommendations for population and housing censuses. New York, NY, United Nations, 2007 (ST/ESA/STAT/SER.M/67/Rev.2)
5. Hill K, Stanton C, Gupta N. Measuring maternal mortality from a census: guidelines for potential users. Measure Evaluation Manual Series. Chapel Hill, NC, Carolina Population Center, University of North Carolina at Chapel Hill, 2001.
6. Stanton C et al. Every death counts: measurement of maternal mortality via a census. Bulletin of the World Health Organization 2001, 79(7):657–664.
7. Hill K, You D, Choi Y. Death distribution methods for estimating adult mortality: Sensitivity analysis with simulated data error. Demographic Research, 2009, 21(9):235–254.
8. World Health Organization. International Statistical Classification of Diseases and Related Health Problems, 10th Revision, Instructions Manual, Volume 2. Geneva, World Health Organization, 1993.
9. Shahidullah M. The sisterhood method of estimating maternal mortality: The Matlab experience. Studies in Family Planning, 1995, 26:101–106.
10. Garenne M, McCaa R, Nacro K. Maternal mortality in South Africa in 2001: from demographic census to epidemiological investigation. Population Health Metrics, 2008, 6(4):1–13.
11. Wilmoth J. The lifetime risk of maternal mortality: concept and measurement. Bulletin of the World Health Organization, 2009, 87(4):256–262.
12. Rutenberg N, Sullivan J. Direct and indirect estimates of maternal mortality from the sisterhood method. Proceedings of the Demographic and Health Surveys World Conference Volume 3. Colombia, MD, Macro International Inc., 1991:1669–1696.
13. Hill K et al. Estimates of maternal mortality worldwide between 1990 and 2005: an assessment of available data. Lancet, 2007, 370(9595):1311–1319.
14. Retherford RD, Cho L. Age-parity-specific birth rates and birth probabilities from census or survey data on own children. Population Studies, 1978, 32 : 567–581.
15. United Nations Department of International Economic and Social Affairs. Manual X: indirect techniques for demographic estimation. New York, NY, United Nations, 1983 (ST/ESA/SER.A/81).
16. United Nations Department of International Economic and Social Affairs. Handbook on population and housing census editing, revision 1. New York, United Nations, 2010 (ST/ESA/STAT/SER.F/82/Rev.1).
17. Placeholder for Zimbabwe censuses 1992 and 2002. Harare, Zimbabwe Central Statistics Office, 2004.
72
WHO guidance for measuring maternal mortality from a census
18. Brass W. Methods for estimating fertility and mortality from limited and defective data. Chapel Hill, NC, International Program of Laboratories for Population Statistics, 1975.
19. Hill K. Estimating census and death registration completeness. Asian and Pacific Census Forum, 1987, 1(3):8–13.
20. Bennett NG, Horiuchi S. Estimating the completeness of death registration in a closed population. Population Index, 1981, 47(2):202–221.
21. Bennett NG, Horiuchi S. Mortality estimation from registered deaths in less developed countries. Demography, 1984, 21(2):217–233.
22. Filmer D, Pritchett LH. Estimating wealth effects without expenditure data – or tears: an application to educational enrollments in states of India. Demography, 2001, 38(1):115–132.
23. Measure DHS. STATcompiler (www.statcompiler.com, accessed 17 September 2012).
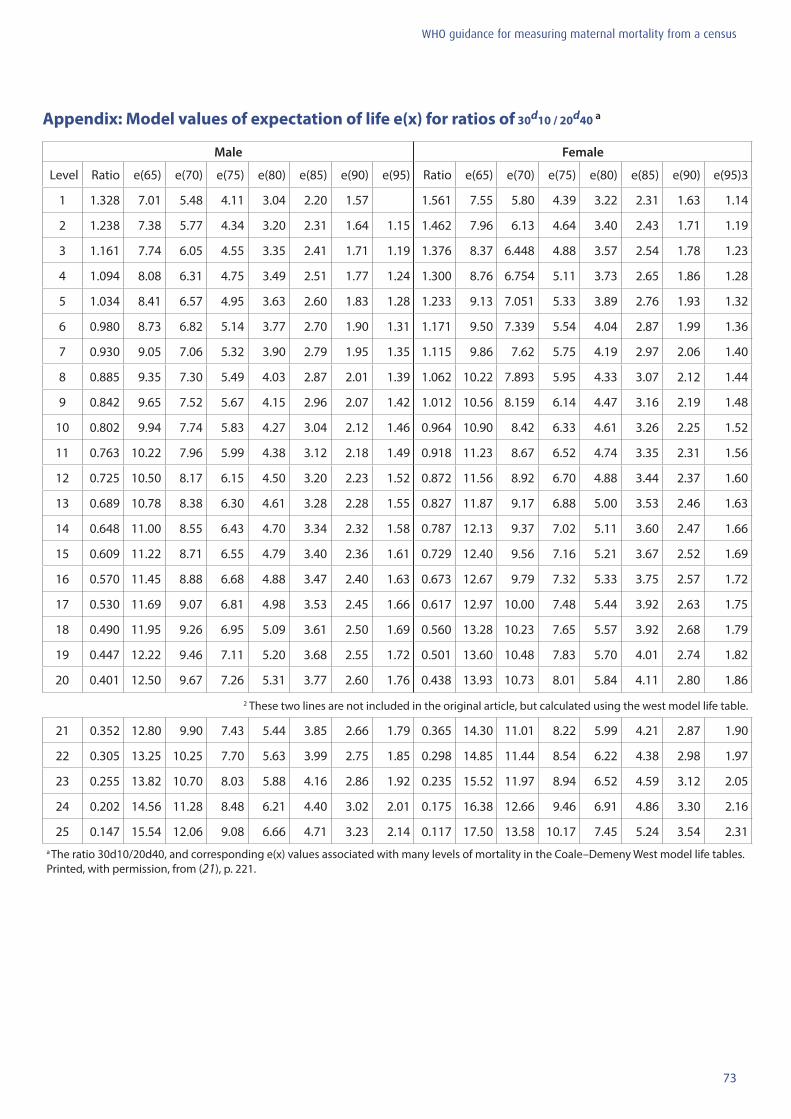
73
WHO guidance for measuring maternal mortality from a census
Appendix: Model values of expectation of life e(x) for ratios of 30d10 / 20d40 a
Male Female
Level Ratio e(65) e(70) e(75) e(80) e(85) e(90) e(95) Ratio e(65) e(70) e(75) e(80) e(85) e(90) e(95)3
1 1.328 7.01 5.48 4.11 3.04 2.20 1.57 1.561 7.55 5.80 4.39 3.22 2.31 1.63 1.14
2 1.238 7.38 5.77 4.34 3.20 2.31 1.64 1.15 1.462 7.96 6.13 4.64 3.40 2.43 1.71 1.19
3 1.161 7.74 6.05 4.55 3.35 2.41 1.71 1.19 1.376 8.37 6.448 4.88 3.57 2.54 1.78 1.23
4 1.094 8.08 6.31 4.75 3.49 2.51 1.77 1.24 1.300 8.76 6.754 5.11 3.73 2.65 1.86 1.28
5 1.034 8.41 6.57 4.95 3.63 2.60 1.83 1.28 1.233 9.13 7.051 5.33 3.89 2.76 1.93 1.32
6 0.980 8.73 6.82 5.14 3.77 2.70 1.90 1.31 1.171 9.50 7.339 5.54 4.04 2.87 1.99 1.36
7 0.930 9.05 7.06 5.32 3.90 2.79 1.95 1.35 1.115 9.86 7.62 5.75 4.19 2.97 2.06 1.40
8 0.885 9.35 7.30 5.49 4.03 2.87 2.01 1.39 1.062 10.22 7.893 5.95 4.33 3.07 2.12 1.44
9 0.842 9.65 7.52 5.67 4.15 2.96 2.07 1.42 1.012 10.56 8.159 6.14 4.47 3.16 2.19 1.48
10 0.802 9.94 7.74 5.83 4.27 3.04 2.12 1.46 0.964 10.90 8.42 6.33 4.61 3.26 2.25 1.52
11 0.763 10.22 7.96 5.99 4.38 3.12 2.18 1.49 0.918 11.23 8.67 6.52 4.74 3.35 2.31 1.56
12 0.725 10.50 8.17 6.15 4.50 3.20 2.23 1.52 0.872 11.56 8.92 6.70 4.88 3.44 2.37 1.60
13 0.689 10.78 8.38 6.30 4.61 3.28 2.28 1.55 0.827 11.87 9.17 6.88 5.00 3.53 2.46 1.63
14 0.648 11.00 8.55 6.43 4.70 3.34 2.32 1.58 0.787 12.13 9.37 7.02 5.11 3.60 2.47 1.66
15 0.609 11.22 8.71 6.55 4.79 3.40 2.36 1.61 0.729 12.40 9.56 7.16 5.21 3.67 2.52 1.69
16 0.570 11.45 8.88 6.68 4.88 3.47 2.40 1.63 0.673 12.67 9.79 7.32 5.33 3.75 2.57 1.72
17 0.530 11.69 9.07 6.81 4.98 3.53 2.45 1.66 0.617 12.97 10.00 7.48 5.44 3.92 2.63 1.75
18 0.490 11.95 9.26 6.95 5.09 3.61 2.50 1.69 0.560 13.28 10.23 7.65 5.57 3.92 2.68 1.79
19 0.447 12.22 9.46 7.11 5.20 3.68 2.55 1.72 0.501 13.60 10.48 7.83 5.70 4.01 2.74 1.82
20 0.401 12.50 9.67 7.26 5.31 3.77 2.60 1.76 0.438 13.93 10.73 8.01 5.84 4.11 2.80 1.86
2 These two lines are not included in the original article, but calculated using the west model life table.
21 0.352 12.80 9.90 7.43 5.44 3.85 2.66 1.79 0.365 14.30 11.01 8.22 5.99 4.21 2.87 1.90
22 0.305 13.25 10.25 7.70 5.63 3.99 2.75 1.85 0.298 14.85 11.44 8.54 6.22 4.38 2.98 1.97
23 0.255 13.82 10.70 8.03 5.88 4.16 2.86 1.92 0.235 15.52 11.97 8.94 6.52 4.59 3.12 2.05
24 0.202 14.56 11.28 8.48 6.21 4.40 3.02 2.01 0.175 16.38 12.66 9.46 6.91 4.86 3.30 2.16
25 0.147 15.54 12.06 9.08 6.66 4.71 3.23 2.14 0.117 17.50 13.58 10.17 7.45 5.24 3.54 2.31a The ratio 30d10/20d40, and corresponding e(x) values associated with many levels of mortality in the Coale–Demeny West model life tables. Printed, with permission, from (21), p. 221.

For more information, please contact:Department of Reproductive Health and ResearchWorld Health OrganizationAvenue Appia 20, CH-1211 Geneva 27, SwitzerlandFax: +41 22 791 4171E-mail: [email protected] www.who.int/reproductivehealth
ISBN 978 92 4 150611 3


