WHO methods and data sources for country-level causes of death 2000-2016 Depart ment of Information , Evidence and Research W HO, Ge n e v a March 2018 Global Health Estimates Technical Paper WHO/HIS/IER/GHE/2018.3
Transcript
WHO methods and data sources for country-level causes of death
2000-2016
Department of Information, Evidence and Research
W HO, G e n e v a
March 2018
Global Health Estimates Technical Paper WHO/HIS/IER/GHE/2018.3
Acknowledgments
This Technical Report was written by Colin Mathers, Gretchen A. Stevens, Wahyu Retno Mahanani, Doris Ma Fat and Dan Hogan of the Mortality and Health Analysis Unit in the WHO Department of Information, Evidence and Research, in the Health Metrics & Measurement cluster of the World Health Organization (WHO), Geneva. Estimates of country-level deaths by cause for years 2000-2016 were led by Colin Mathers. Gretchen A . Stevens and Doris Ma Fat were responsible for analysis of death registration data. Dan Hogan was responsible for causes of death in children under age 5. These estimates benefitted from advice and inputs from other WHO Departments, collaborating United Nations (UN) Agencies, and WHO expert advisory groups and academic collaborators.
Many of the inputs to these estimates result from collaborations with Interagency Groups, expert advisory groups and academic groups. These include the Interagency Group on Child Mortality Estimation (UN-IGME), the UN Population Division, the Maternal and Child Epidemiology Estimation Group (MCEE), the Maternal Mortality Expert and Interagency Group (MMEIG), the International Agency for Research on Cancer, WHO QUIVER, the Institute of Health Metrics and Evaluation (IHME) at the University of Washington, and various experts collaborating in the IHME Global Burden of Disease Study. While it is not possible to name all those who provided advice, assistance or data, both inside and outside WHO, we would particularly like to note the assistance and inputs provided by Bob Black, Freddie Bray, Zoe Brillantes, Doris Chou, Richard Cibulskis, Simon Cousens, Louisa Degenhardt, Jacques Ferlay, Marta Gacic-Dobo, Patrick Gerland, Stephane Helleringer, Yvan Hutin, Philippe Glaziou, Kacem Iaych, Robert Jakob, Prabhat Jha, Li Liu, Mary Mahy, Bruno Masquelier, Shefali Oza, Francois Pelletier, Juergen Rehm, Florence Rusciano, Lale Say, Charalampos Sismanidis, and Danzhen You. The World Health Organization funded this work.
Estimates and analysis are available at: http://www.who.int/gho/mortality_burden_disease/en/index.html
For further information about the estimates and methods, or to obtain computer codes, please contact [email protected]
Recent papers in this series
1. CHERG-WHO methods and data sources for child causes of death 2000-2015 (Global Health Estimates Technical Paper WHO/HIS/HSI/GHE/2016.1)
2. WHO methods and data sources for life tables 1990-2015 (Global Health Estimates Technical Paper WHO/HIS/IER/GHE/2016.2)
3. WHO methods and data sources for country-level causes of death 2000-2015 (Global Health Estimates Technical Paper WHO/HIS/HSI/GHE/2016.3)
4. WHO methods and data sources for global burden of disease estimates 2000-2015 (Global Health Estimates Technical Paper WHO/HIS/IER/GHE/2017.1)
5. WHO-MCEE methods and data sources for child causes of death 2000-2016 (Global Health Estimates Technical Paper WHO/HIS/IER/GHE/2018.1)
6. WHO methods and data sources for life tables 1990-2016 (Global Health Estimates Technical Paper WHO/HIS/IER/GHE/2018.2)
3.1 Countries ............................................................................................................................................. 7
3.2 Age groups ........................................................................................................................................... 7
3.3 Cause of death categories ................................................................................................................... 7
4 Countries with useable death registration data ..................................................................................... 7
4.1 Data and estimates.............................................................................................................................. 7
4.2 Inclusion criteria for countries with high quality death registration data ........................................... 8
4.3 Mapping to the GHE cause lists and redistribution of unknown age/sex or ill-defined cause of death 13
4.4 Interpolation and extrapolation for missing country-years .......................................................... 17
4.5 Adjustment of specific causes ........................................................................................................... 18
5 Causes of death for children under age 5 years ................................................................................... 21
9 Other causes of death for countries without useable data .................................................................. 36
9.1 Other adjustments for specific causes in certain countries ............................................................... 37
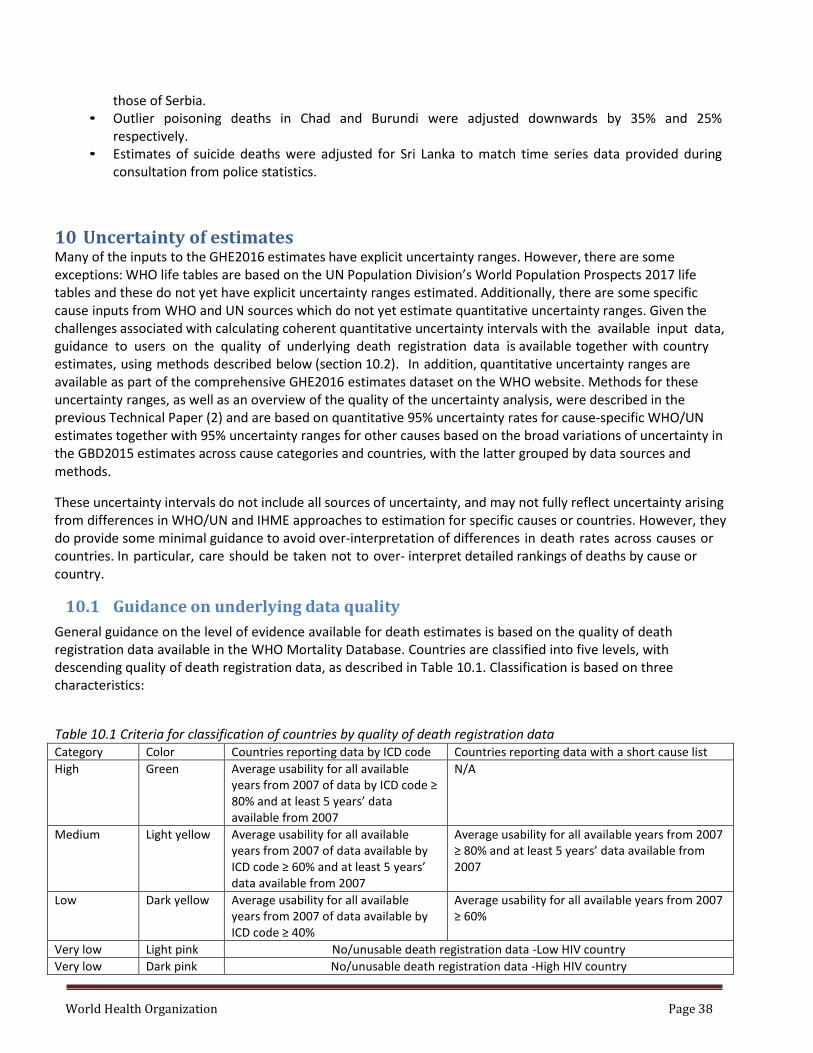
10 Uncertainty of estimates ....................................................................................................................... 38
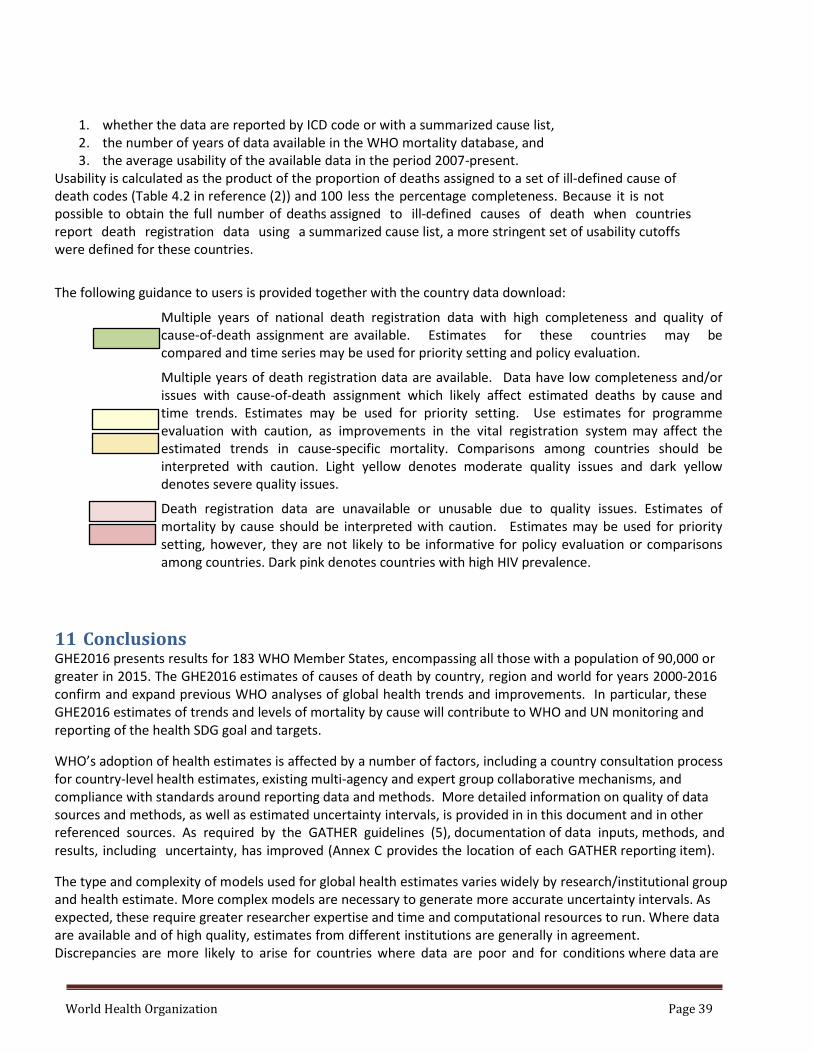
10.1 Guidance on underlying data quality ............................................................................................ 38
11 Conclusions 39
11.1 Reasons for changes in GHE estimates in this revision ................................................................. 40
11.2 Limitations of GHE estimates ........................................................................................................ 40
References 60
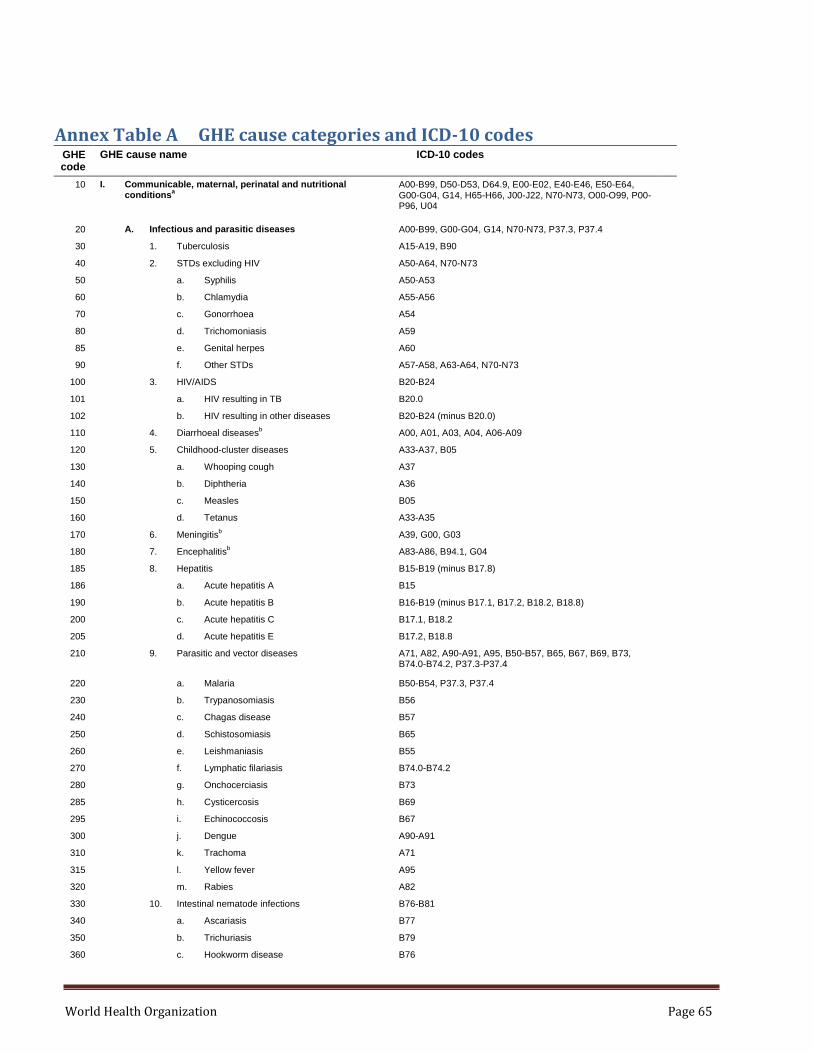
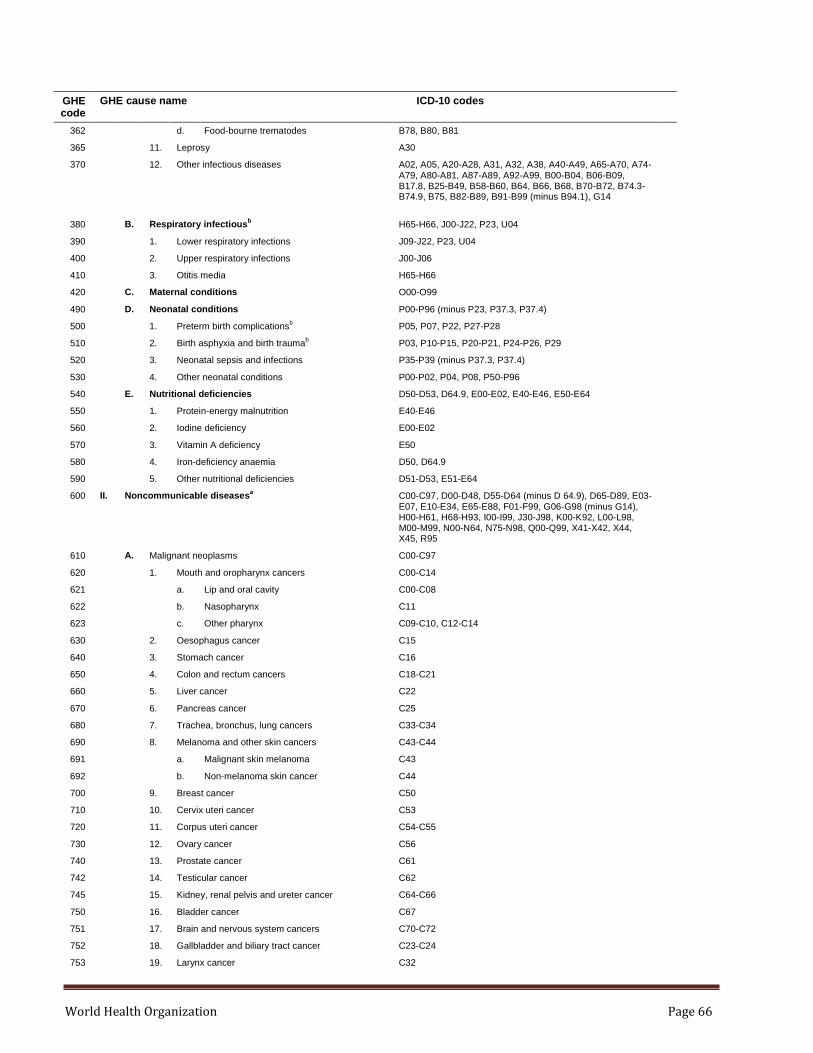
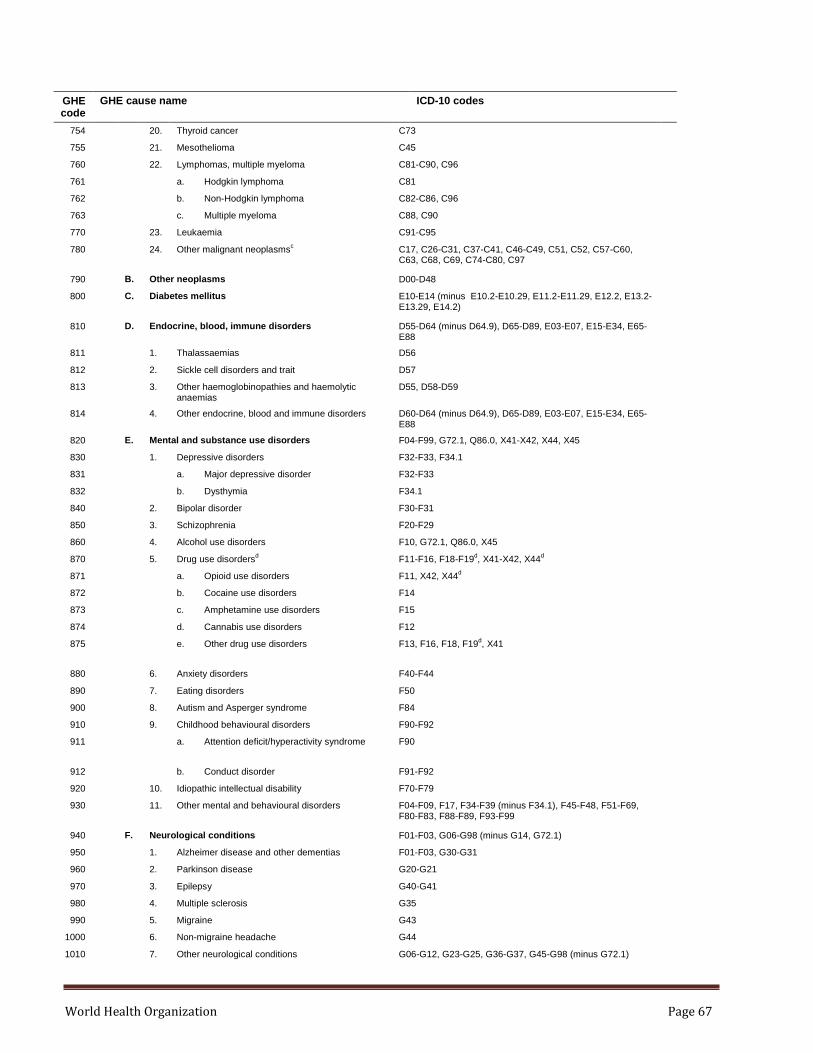
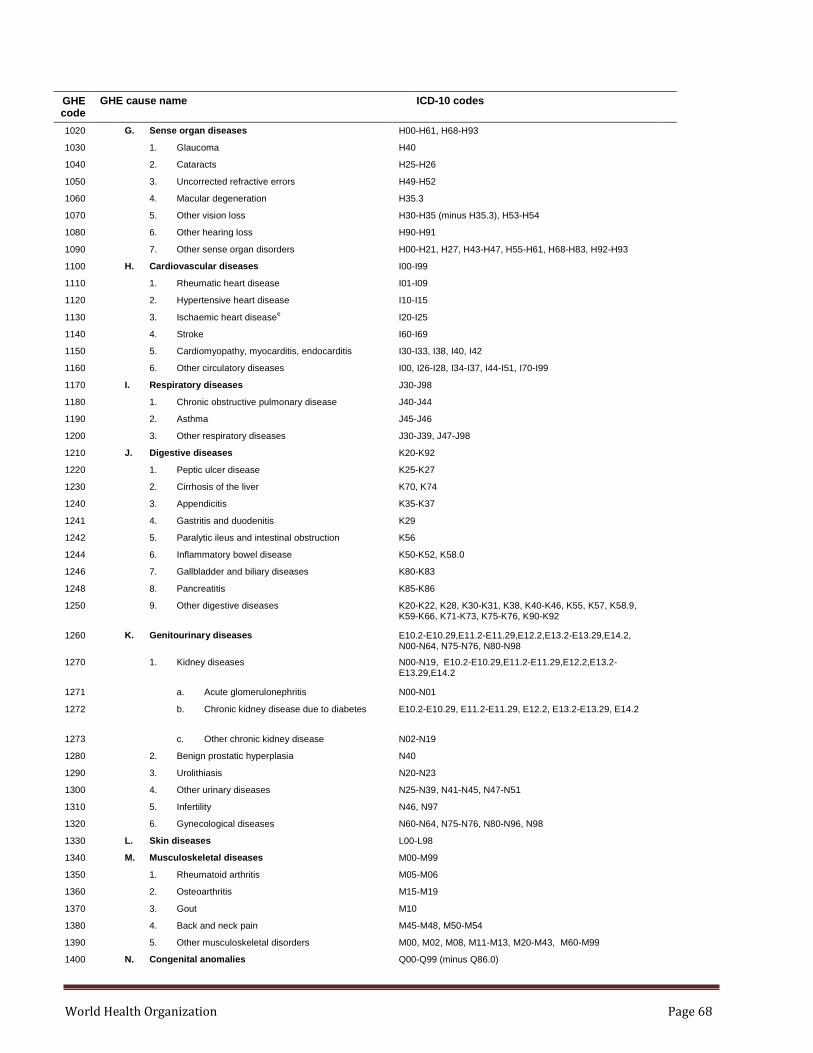
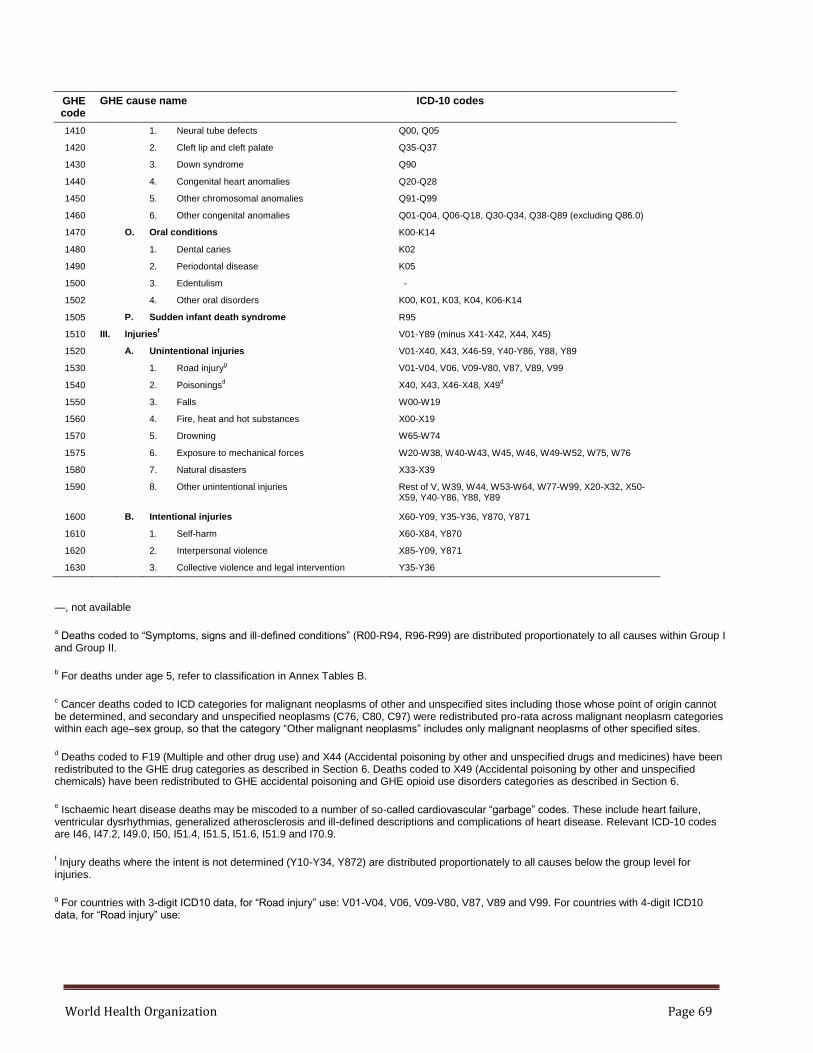
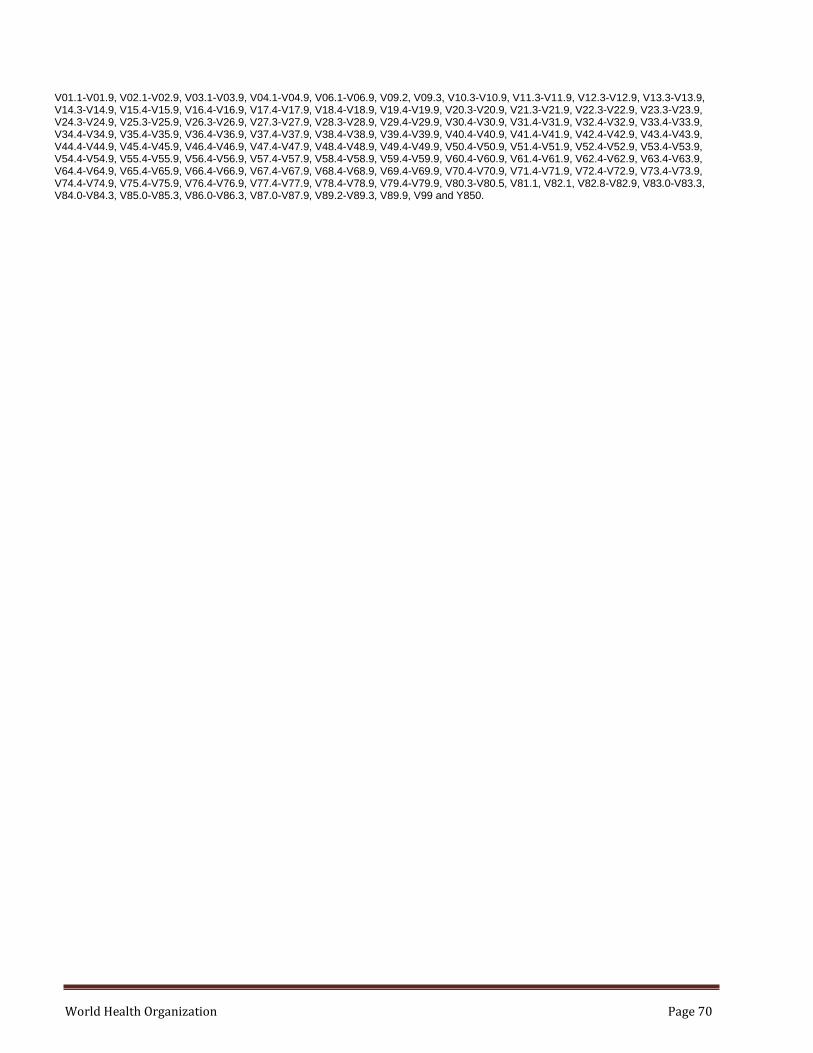
Annex Table A GHE cause categories and ICD-10 codes ........................................................................... 65
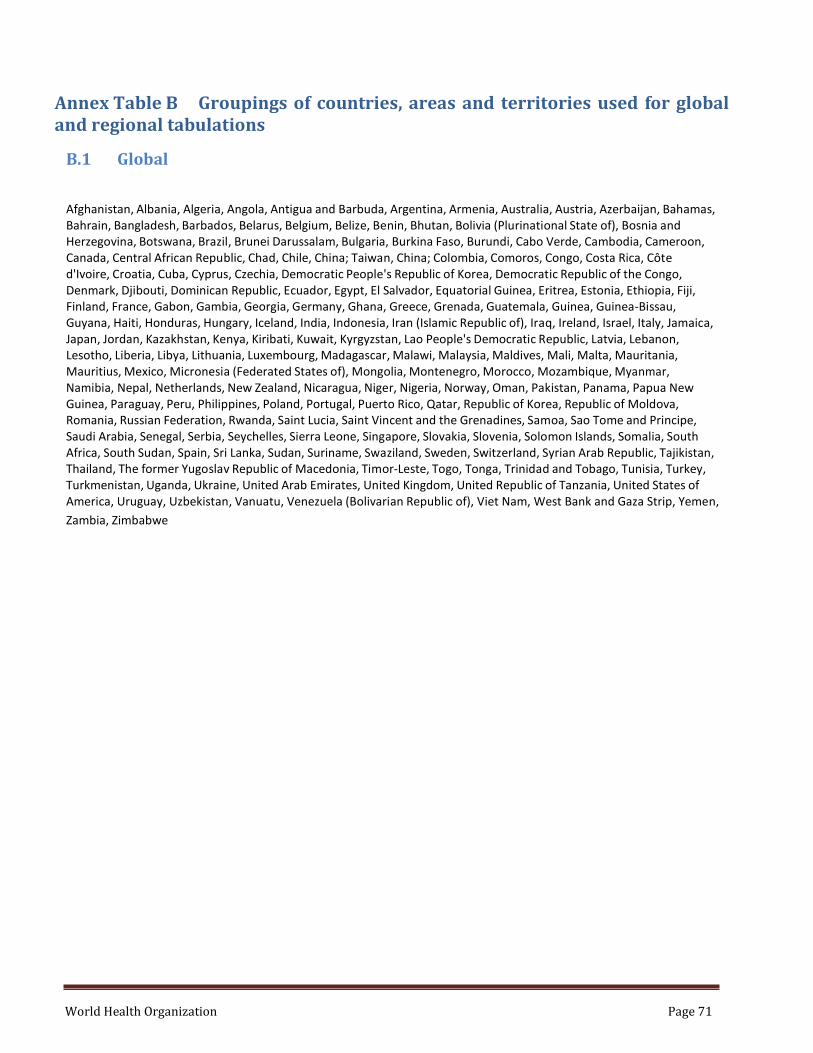
Annex Table B Groupings of countries, areas and territories used for global and regional tabulations .. 71
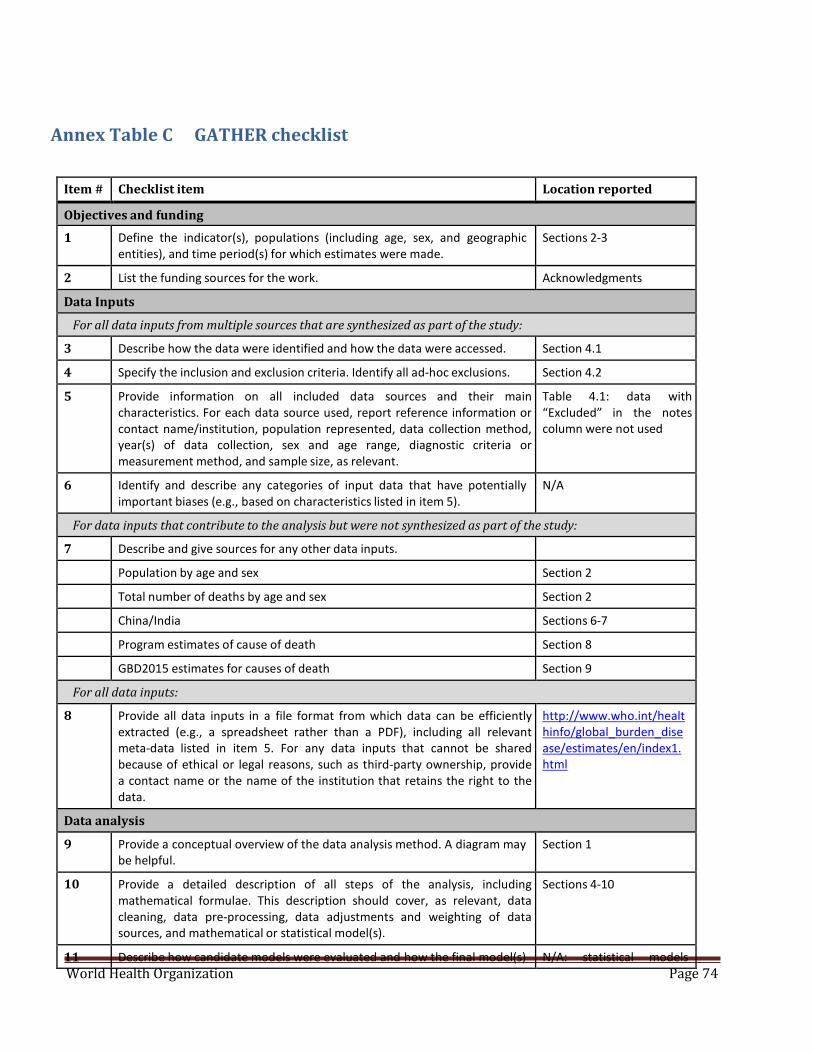
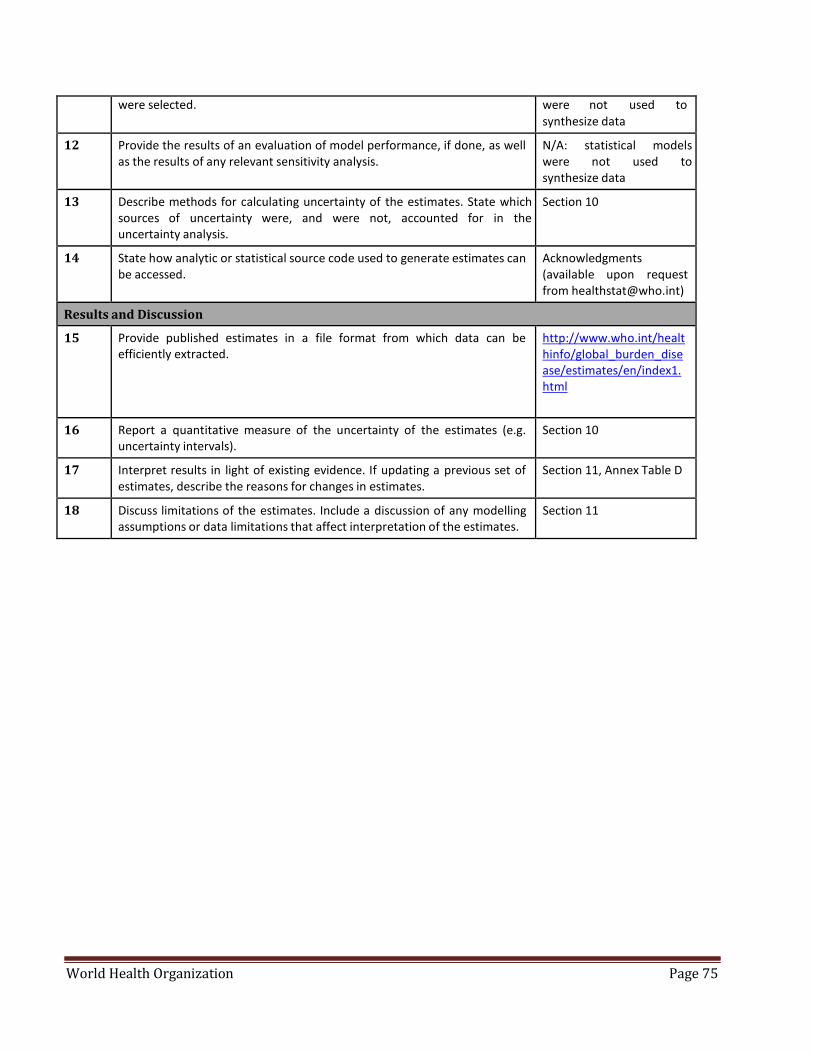
Annex Table C GATHER checklist .............................................................................................................. 74
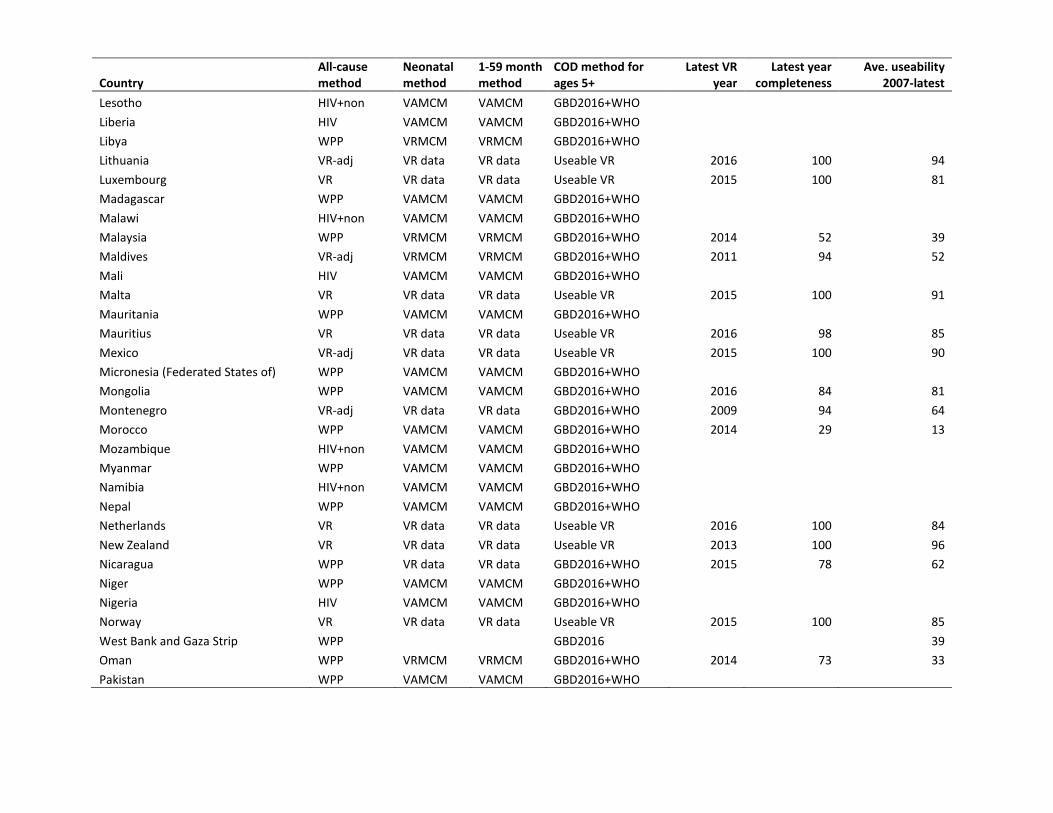
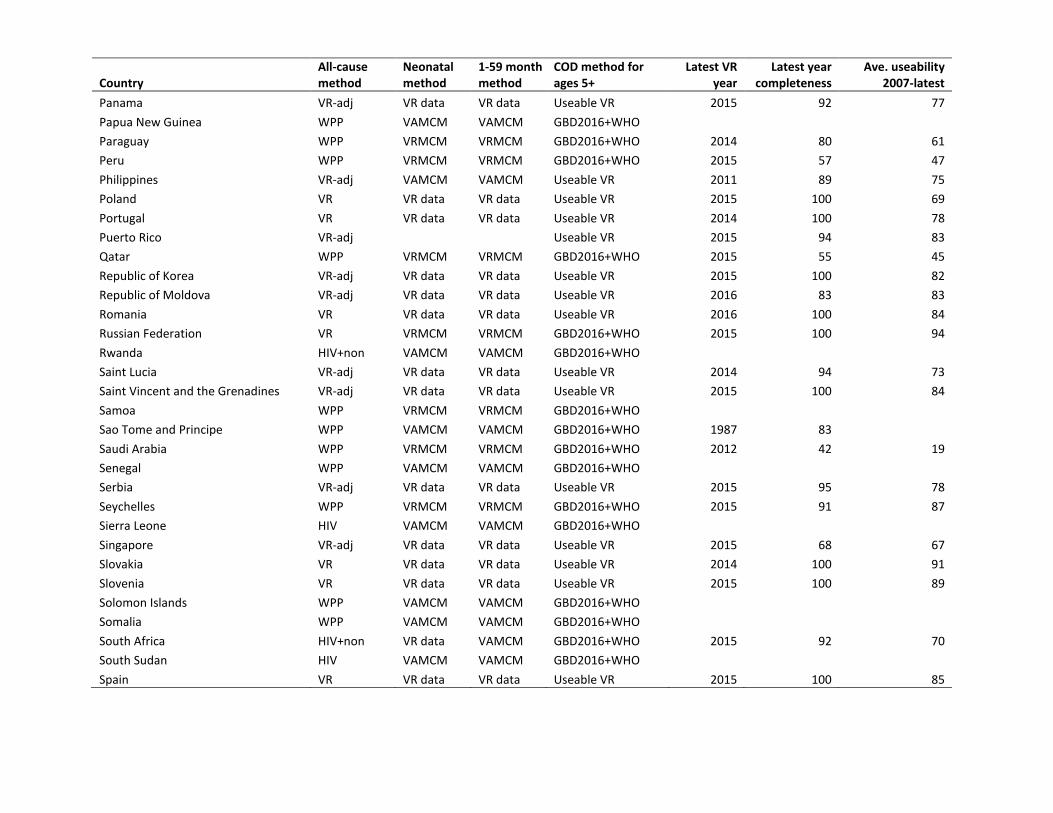
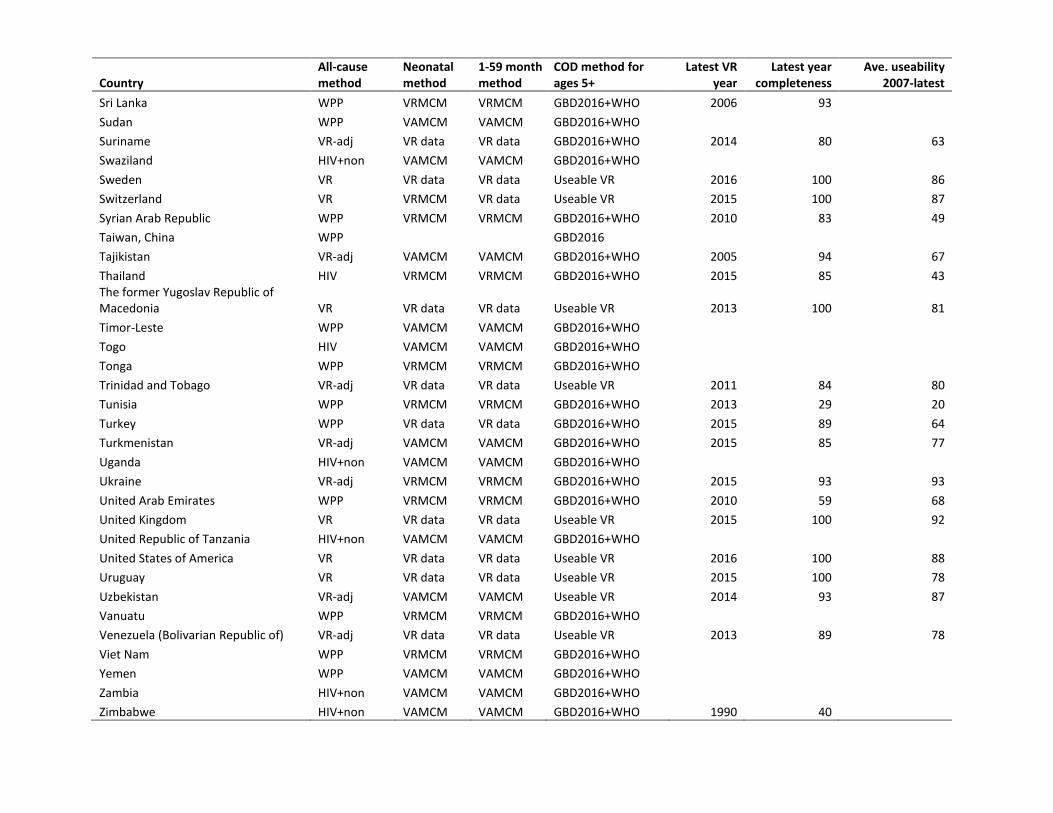
Annex Table D Methods used for estimation of mortality levels and causes of death, by country, 2000-2016 .................................................................................................................................. 76
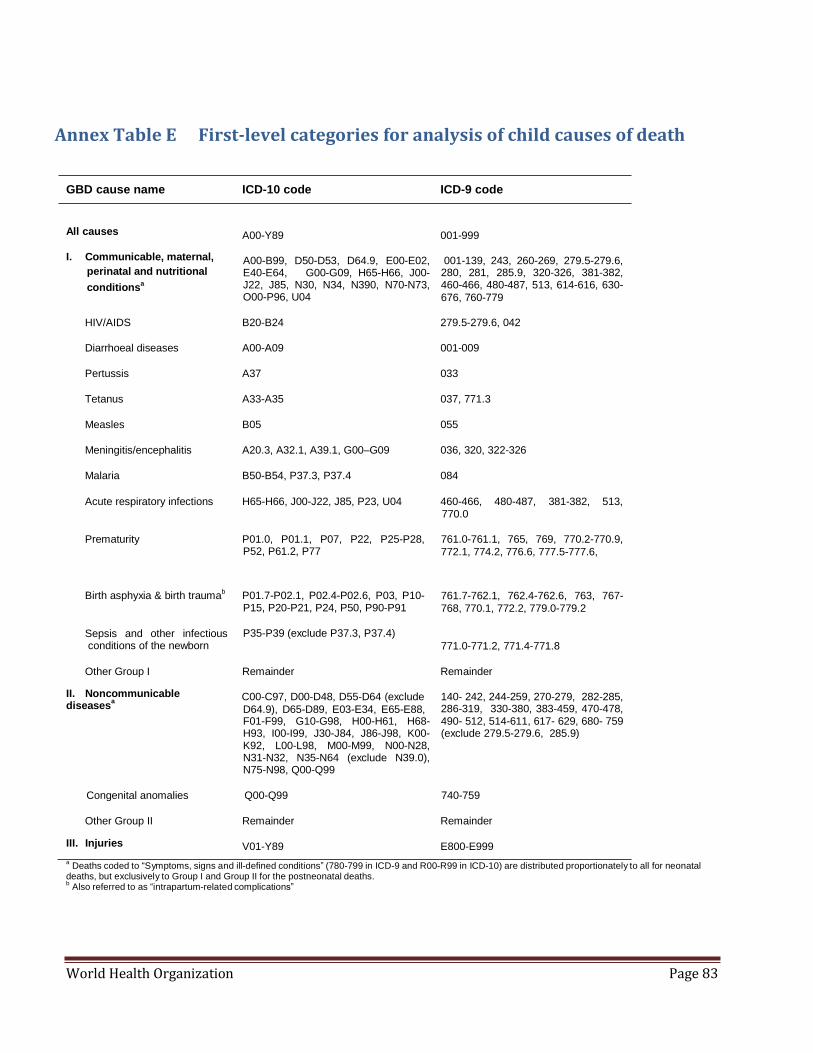
Annex Table E First-level categories for analysis of child causes of death ............................................... 83
World Health Organization Page 5
1 Introduction Global, regional, and country statistics on population and health indicators are used for assessing development and health progress and for guiding resource allocation. The estimates are also used to monitor progress towards the health-related targets within the Sustainable Development Goals (SDGs), which will require regular reporting on child mortality, maternal mortality and mortality due to non-communicable diseases, suicide, pollution, road traffic injuries, homicide, natural disasters and conflict.
Previous WHO time series estimates of deaths by cause, age and sex for its Member States (1, 2) have now been updated for years 2000-2016 drawing on more recent data as summarized below. This technical paper documents the data sources and methods used for preparation of these country-level Global Health Estimates (GHE2016) for years 2000-2016. Annex Table A lists the cause of death categories and their definitions in terms of the International Classification of Diseases, Tenth Revision (ICD-10) (3). These estimates are available for years 2000, 2005, 2010, 2015 and 2016 for Member States and for selected regional groupings of countries, areas and territories, defined in Annex Table B, at http://www.who.int/healthinfo/global_health_estimates/en/.
One of the six core functions of WHO is monitoring of the health situation, trends and determinants in the world. Over the years it has cooperated closely with other UN partner agencies like UNICEF, UNAIDS, UNFPA and the UN Population Division to collect and compile global health statistics. There are a number of established UN multi-agency expert group mechanisms for cross cutting topics such as child mortality (the UN-IGME including UNICEF/WHO/UN Population Division/World Bank), and specific diseases such as HIV/AIDS (UNAIDS Reference Group), maternal mortality (MMEIG including WHO/UNICEF/UNFPA/World Bank), tuberculosis (WHO STAG), malaria (Malaria Reference Group and Roll Back Malaria- Malaria Monitoring and Evaluation Reference Group). Additionally, WHO collaborates with a network of academics (MCEE) to estimate child causes of death. This collaboration succeeds the former Child Health Epidemiology Reference Group (CHERG) of WHO and UNICEF.
Estimates of mortality and causes of death were released in 2017 (4) by the Institute of Health Metrics and Evaluation (IHME) as part of the Global Burden of Disease 2016 study (GBD2016). WHO has drawn on the GBD2016 analyses for selected causes for Member States without comprehensive death registration data as described in Section 9 below.
These WHO Global Health Estimates provide a comprehensive and comparable set of cause of death estimates from year 2000 onwards, consistent with and incorporating UN agency, interagency and WHO estimates for population, births, all-cause deaths and specific causes of death, including:
o most recent vital registration (VR) data for all countries submitting VR data to the WHO Mortality Database (WHO MDB), where the VR data meets certain criteria for completeness and quality;
o updated and additional information on levels and trends for child and adult mortality in many countries without good death registration data;
o improvements in methods used for the estimation of causes of child deaths in countries without good death registration data;
o updated assessments of levels and trends for specific causes of death by WHO programs and interagency groups; and
o Global Burden of Disease 2016 (GBD2016) study estimates for other causes in countries without useable VR data or other nationally representative sources of information on causes of death.
Because these estimates draw on new data and on the result of the GBD2016 study, and there have been substantial revisions to methods for many causes, these estimates for the years 2000-2016 are not directly comparable with previous WHO estimates for 2000-2015 or earlier versions. These Global Health Estimates represent the best estimates of WHO, based on the evidence available to it up until February 2018, rather than the official estimates of Member States, and have not necessarily been endorsed by Member States. They have been computed using standard categories, definitions and methods to ensure cross-national comparability and may not be the same as official national estimates produced using alternate, potentially equally rigorous methods. The following sections of this document provide explanatory notes on data sources and methods for preparing mortality estimates by cause.
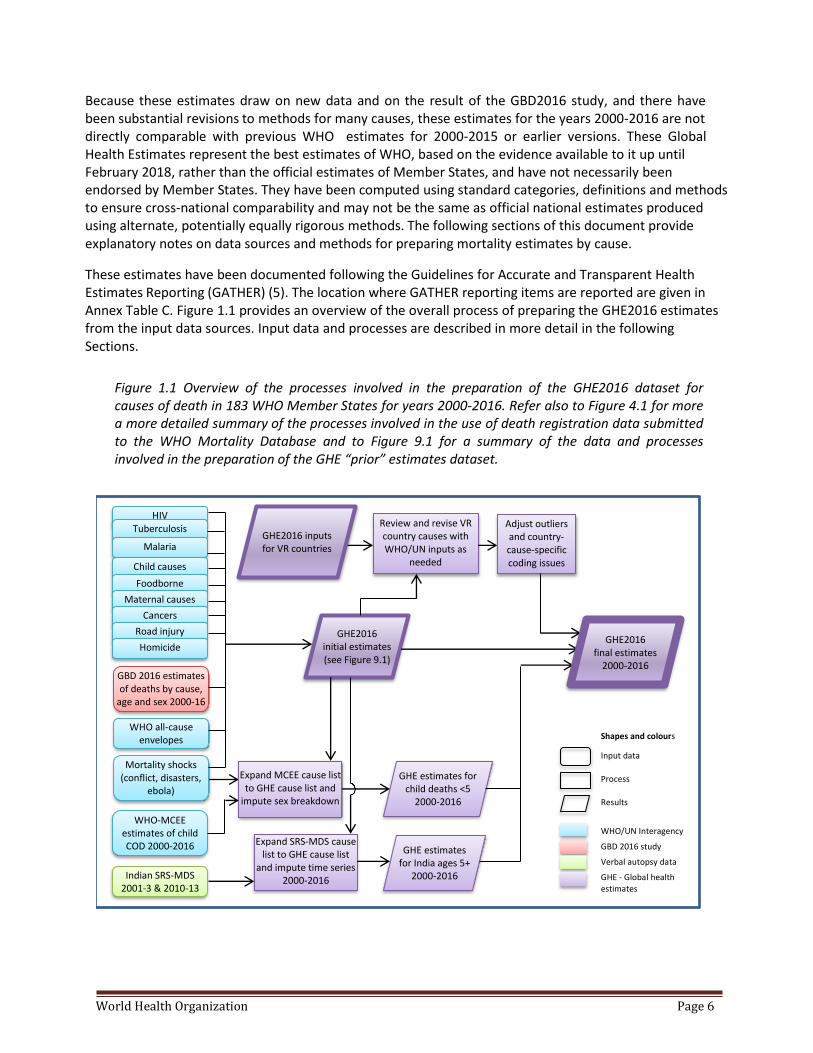
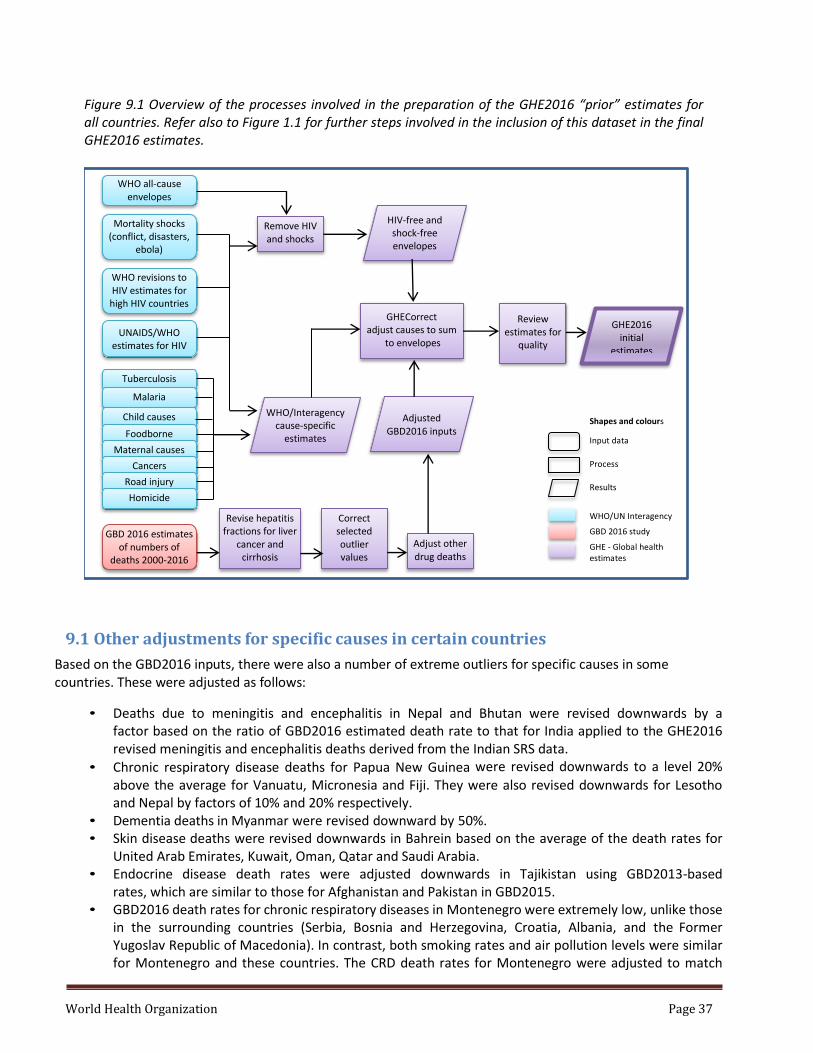
These estimates have been documented following the Guidelines for Accurate and Transparent Health Estimates Reporting (GATHER) (5). The location where GATHER reporting items are reported are given in Annex Table C. Figure 1.1 provides an overview of the overall process of preparing the GHE2016 estimates from the input data sources. Input data and processes are described in more detail in the following Sections.
Figure 1.1 Overview of the processes involved in the preparation of the GHE2016 dataset for causes of death in 183 WHO Member States for years 2000-2016. Refer also to Figure 4.1 for more a more detailed summary of the processes involved in the use of death registration data submitted to the WHO Mortality Database and to Figure 9.1 for a summary of the data and processes involved in the preparation of the GHE “prior” estimates dataset.
HIV
WHO all-cause envelopes
Adjust outliers and country-cause-specific coding issues
Expand SRS-MDS cause list to GHE cause list
and impute time series 2000-2016
GHE estimates for India ages 5+
2000-2016
GHE estimates for child deaths <5
2000-2016
GHE2016 initial estimates (see Figure 9.1)
Tuberculosis
Malaria
Child causes
Foodborne
Maternal causes
Cancers
Road injury
Homicide
Review and revise VR country causes with WHO/UN inputs as
needed
GBD 2016 estimates of deaths by cause,
age and sex 2000-16 countries
Mortality shocks (conflict, disasters,
ebola)
Indian SRS-MDS 2001-3 & 2010-13
WHO-MCEE estimates of child COD 2000-2016
GHE2016 inputs for VR countries
Expand MCEE cause list to GHE cause list and
impute sex breakdown
GHE2016 final estimates
2000-2016
Shapes and colours
Input data
Process
Results
WHO/UN Interagency
GBD 2016 study
Verbal autopsy data
GHE - Global health estimates
World Health Organization Page 7
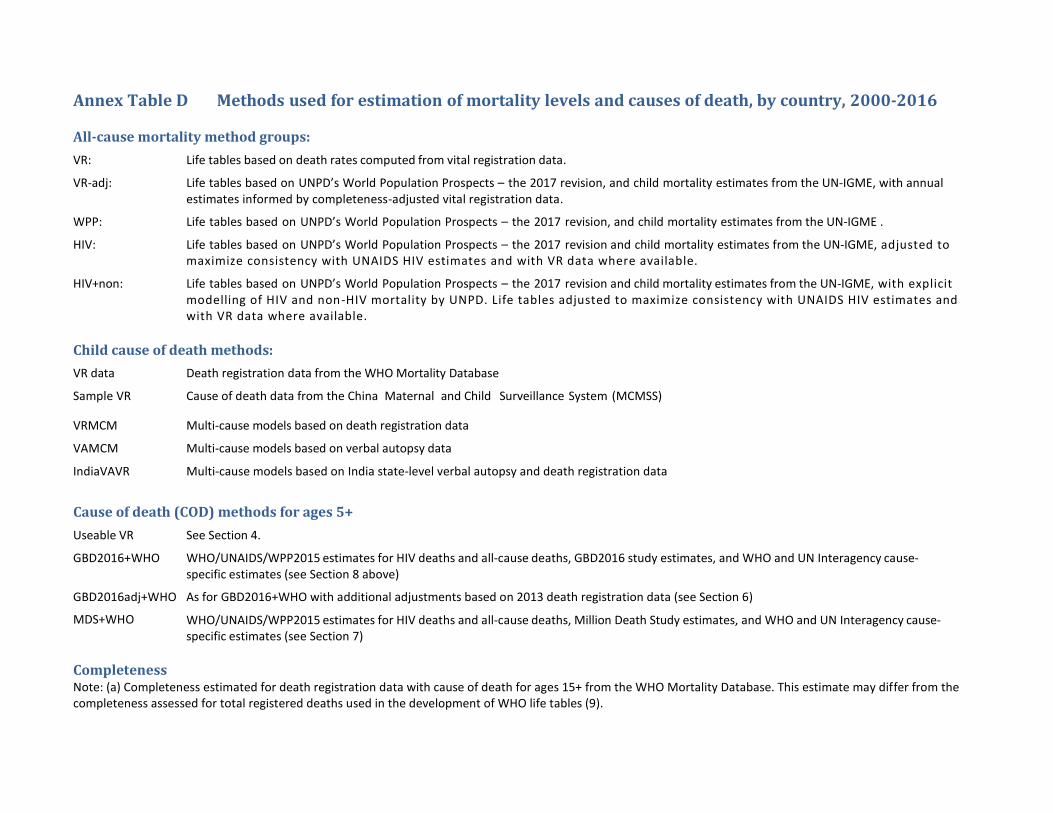
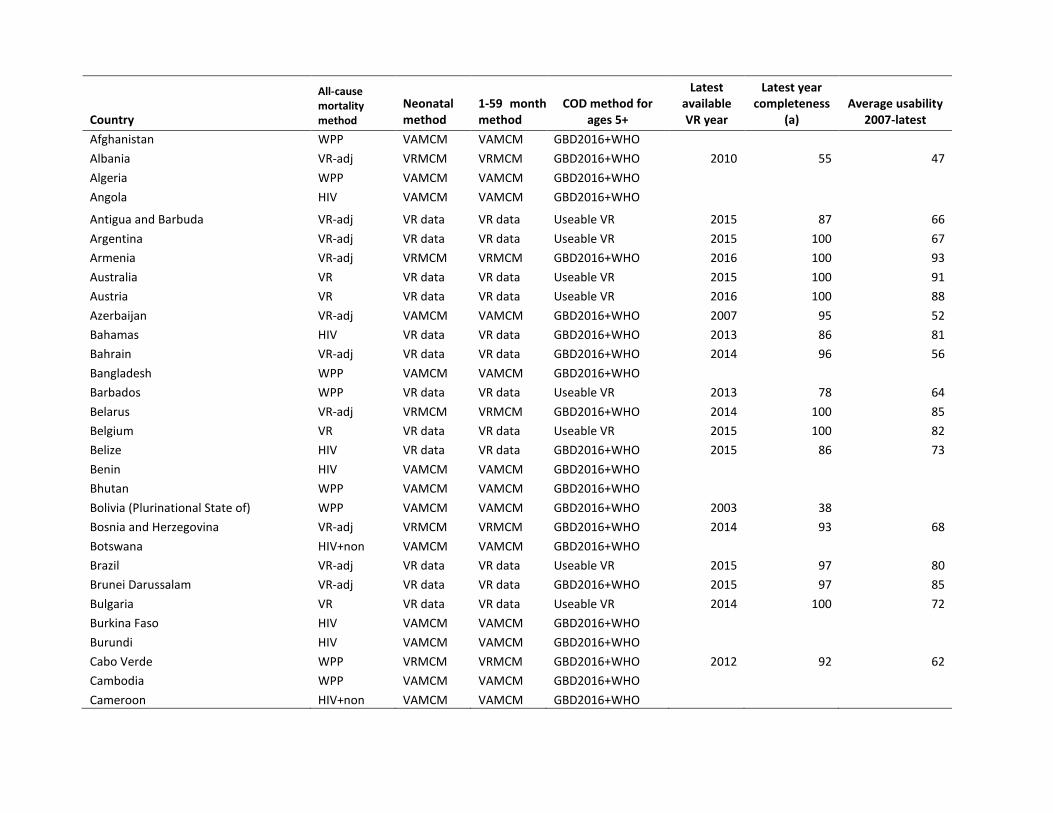
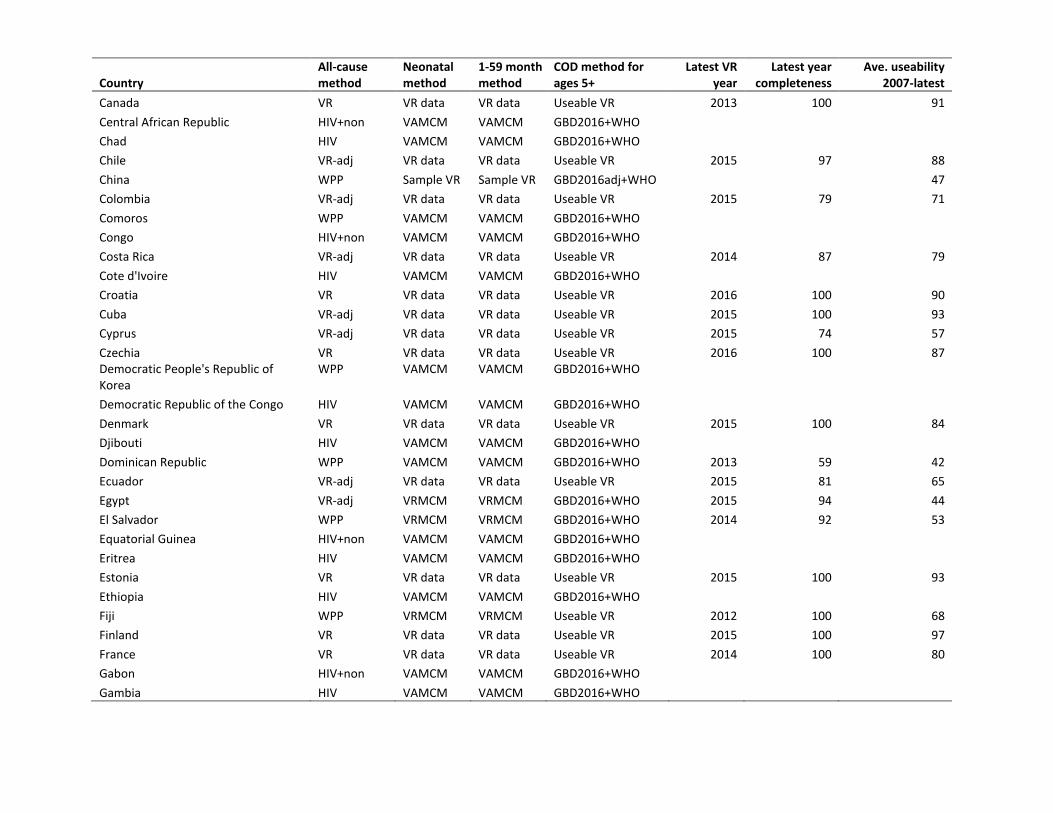
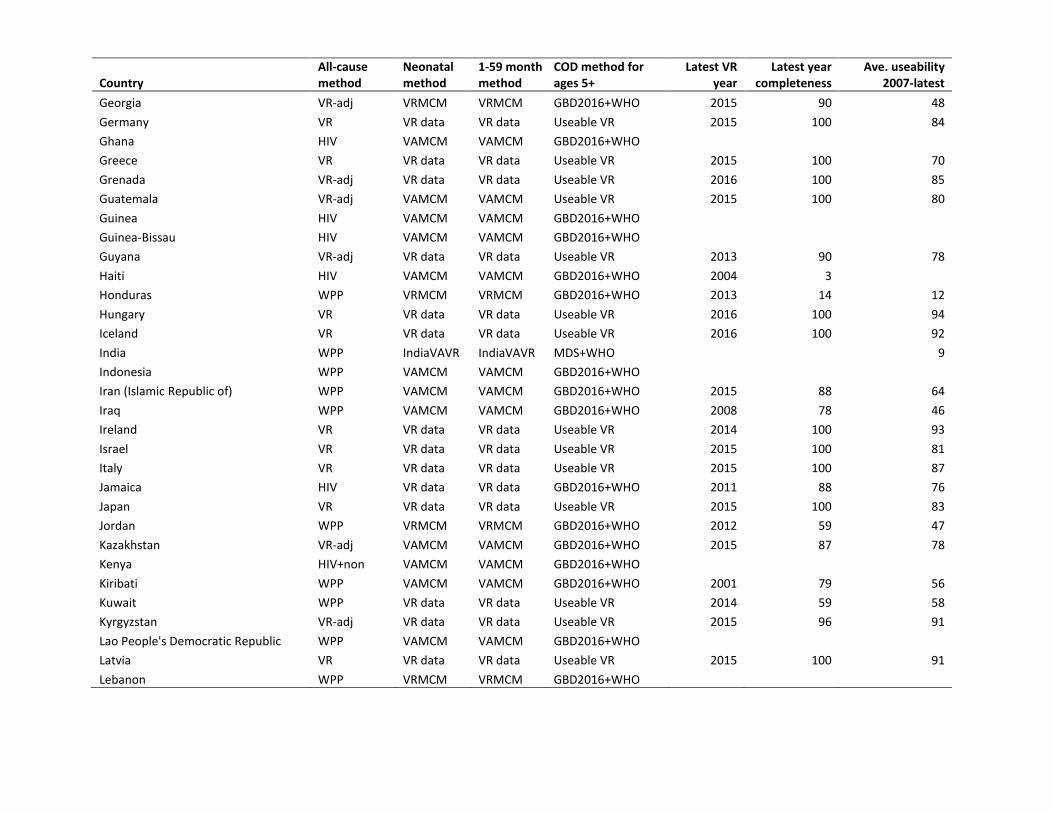
2 Population and all-cause mortality estimates for years 2000-2016 In recent years, WHO has liaised more closely with the United Nations Population Division (UNPD) on life tables for countries, in order to maximize the consistency of UN and WHO life tables, and to minimize differences in the use and interpretation of available data on mortality levels. WHO life tables have been revised and updated for all Member States for years 1990-2016, drawing on the recently released UN World Population Prospects 2017 revision (6), recent and unpublished analyses of all-cause and HIV mortality for countries with high HIV prevalence, vital registration data (7), and UN- IGME estimates of levels and trends for under-5 mortality (8). Annex Table D summarizes the methods used for preparing life tables. Data sources are documented in more detail in GHE Technical Paper 2018.2 (9). The WHO life tables are available in the Global Health Observatory at http://apps.who.int/gho/data/node.main.LIFECOUNTRY?lang=en
Total deaths by age and sex were estimated for each country by applying the WHO life table death rates to the estimated de facto resident populations prepared by the UN Population Division in its 2017 revision (6). They may thus differ slightly from official national estimates for corresponding years.
3 Analysis categories
3.1 Countries
Estimates are made for 183 WHO Member States with populations greater than 90,000 in 2016. The 11 Member States excluded are: Andorra, Cook Islands, Dominica, Marshall Islands, Monaco, Nauru, Niue, Palau, Saint Kitts and Nevis, San Marino, and Tuvalu. Additionally, estimates are made for the following territories: Puerto Rico; Taiwan, China; West Bank and Gaza Strip. These are not released at country level, but are included in the relevant regional and global totals.
3.2 Age groups
The analysis of deaths by cause is carried out for 5-year age groups from 5-9, though to the final open- ended age group 85+. Deaths under age 5 are estimated for the following age groups: neonatal (0-29 days), post-neonatal (1-11 months), and 1-4 years. Cause of death estimates are released in tabular form for age groups 0-28 days, 1-59 months, 5-14 years, 15-29, 30-49, 50-59, 60-69, 70+ years.
3.3 Cause of death categories
The cause of death categories remain the same as those used in the previous WHO cause of death estimates. The cause list is given in Annex Table A, together with corresponding ICD-10 codes.
4 Countries with useable death registration data
4.1 Data and estimates
Cause-of-death statistics are reported to WHO on an annual basis by country, year, cause, age and sex. These statistics can be accessed in the WHO Mortality Database (7). For these estimates, a total of 68
countries had data that met our inclusion criteria, of which 59 countries had data for years 2014 or later. Thirteen countries had reported data from 2016.
For countries with a high-quality vital registration system including information on cause of death, we used the vital registration data recorded in the WHO Mortality Database to estimate cause-specific deaths. We analyzed the data using the following steps:
1) application of inclusion criteria to select countries with high-quality vital registration data;
2) extraction of deaths by cause group, with a short cause list and, if possible, a detailed cause list (depending on the cause tabulation used in each country-year);
3) redistribution of deaths of unknown sex/age and deaths assigned to ill-defined (garbage)
codes;
4) interpolation/extrapolation of number of deaths for missing country-years;
5) adjustments to take into account additional information for specific causes of death; and
6) scaling of total deaths by age and sex to previously estimated WHO all-cause envelopes for
years 2000-2016.
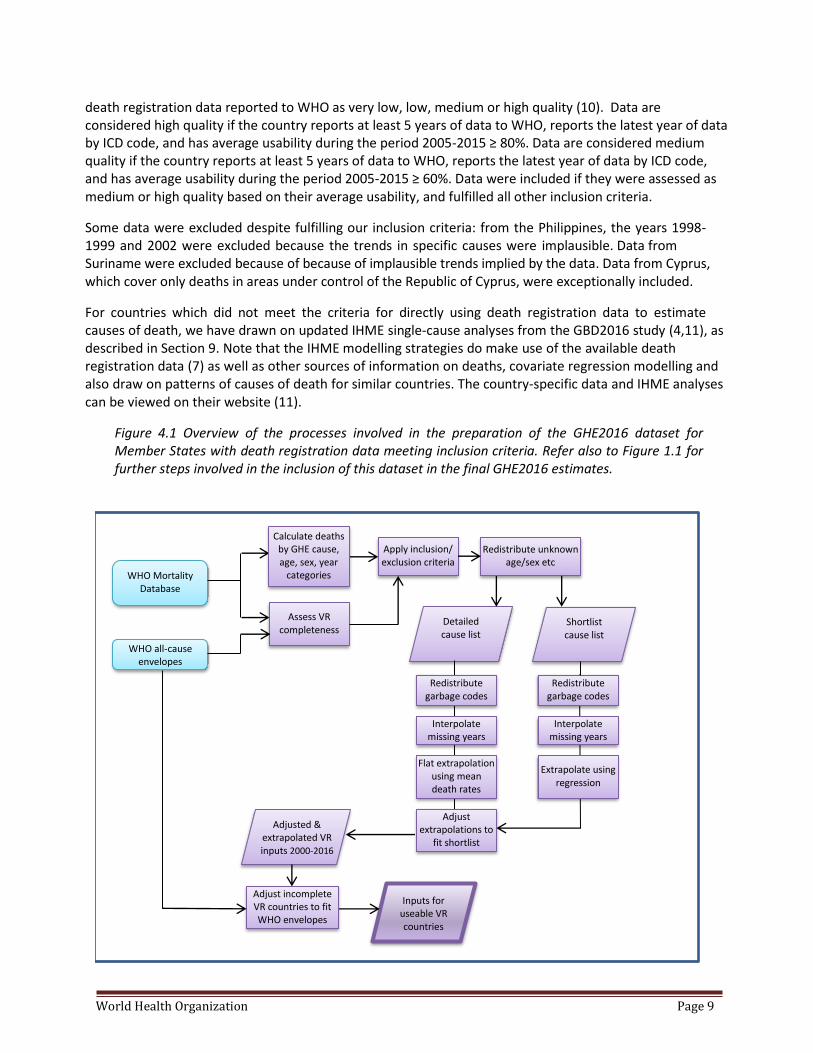
Figure 4.1 provides an overview of the involved in preparing the complete dataset for GHE causes and categories for years 2000 to 2016 for the countries with death registration data reported to the WHO Mortality Database and which meet inclusion criteria. Details are provided below.
4.2 Inclusion criteria for countries with high quality death registration data
We applied the following inclusion criteria to data in the WHO mortality database received as of
endOctober 2017:
• The data are for a country/territory included in this analysis (see Section 3.1);
• The data are for a country/territory whose population in 2016 was greater than 90,000;
• The data are available for 5-year age groups to ages 85 and over;
• Data were reported to WHO were coded using ICD-9 or ICD-10 (vs. a prior version of ICD);
• At least eight years of data were provided by ICD code (vs. a condensed list);
• The country is not classified as “high HIV” for life table estimation; and
• The country/territory’s vital registration data were assessed as medium or high quality (10), as described below.
The concept of “usability” has been developed by WHO in order to assess the overall quality of death registration data. Usability is defined as the percentage of all deaths which are registered with meaningful cause-of-death information. Usability is calculated as completeness (i.e. the percentage of all deaths in a geographic area that are registered) multiplied by the proportion of registered deaths that are assigned a meaningful cause of death:
Usability (%) = Completeness (%) x (1-Deaths assigned to a garbage code (%))
Note that the completeness used to calculate useability is based on the deaths registered with cause of death and reported to the WHO Mortality Database. This may differ from estimated completeness of all registered deaths (with or without cause) used in the development of WHO life tables (9). Annex Table D lists estimated completeness for the latest year of data reported to the WHO Mortality Database.
Together with information on reporting status, WHO has used data on usability to categorize national
World Health Organization Page 9
death registration data reported to WHO as very low, low, medium or high quality (10). Data are considered high quality if the country reports at least 5 years of data to WHO, reports the latest year of data by ICD code, and has average usability during the period 2005-2015 ≥ 80%. Data are considered medium quality if the country reports at least 5 years of data to WHO, reports the latest year of data by ICD code, and has average usability during the period 2005-2015 ≥ 60%. Data were included if they were assessed as medium or high quality based on their average usability, and fulfilled all other inclusion criteria.
Some data were excluded despite fulfilling our inclusion criteria: from the Philippines, the years 1998-1999 and 2002 were excluded because the trends in specific causes were implausible. Data from Suriname were excluded because of because of implausible trends implied by the data. Data from Cyprus, which cover only deaths in areas under control of the Republic of Cyprus, were exceptionally included.
For countries which did not meet the criteria for directly using death registration data to estimate causes of death, we have drawn on updated IHME single-cause analyses from the GBD2016 study (4,11), as described in Section 9. Note that the IHME modelling strategies do make use of the available death registration data (7) as well as other sources of information on deaths, covariate regression modelling and also draw on patterns of causes of death for similar countries. The country-specific data and IHME analyses can be viewed on their website (11).
Figure 4.1 Overview of the processes involved in the preparation of the GHE2016 dataset for Member States with death registration data meeting inclusion criteria. Refer also to Figure 1.1 for further steps involved in the inclusion of this dataset in the final GHE2016 estimates.
WHO all-cause envelopes
WHO Mortality Database
Assess VR completeness
Detailed cause list
Extrapolate using regression
Adjusted & extrapolated VR inputs 2000-2016
Inputs for useable VR countries
Calculate deaths by GHE cause, age, sex, year
categories
Redistribute unknown age/sex etc
Apply inclusion/ exclusion criteria
Shortlist cause list
Redistribute garbage codes
Redistribute garbage codes
Interpolate missing years
Interpolate missing years
Flat extrapolation using mean death rates
Adjust extrapolations to
fit shortlist
Adjust incomplete VR countries to fit WHO envelopes
death rates
World Health Organization Page 10
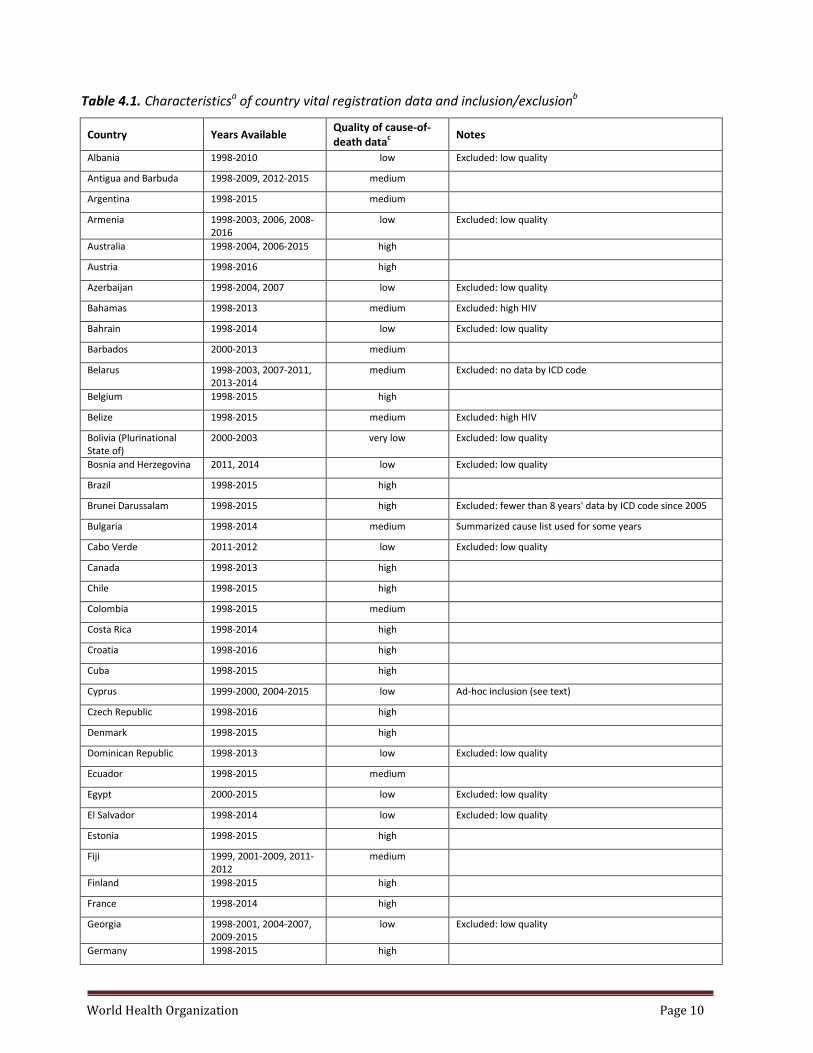
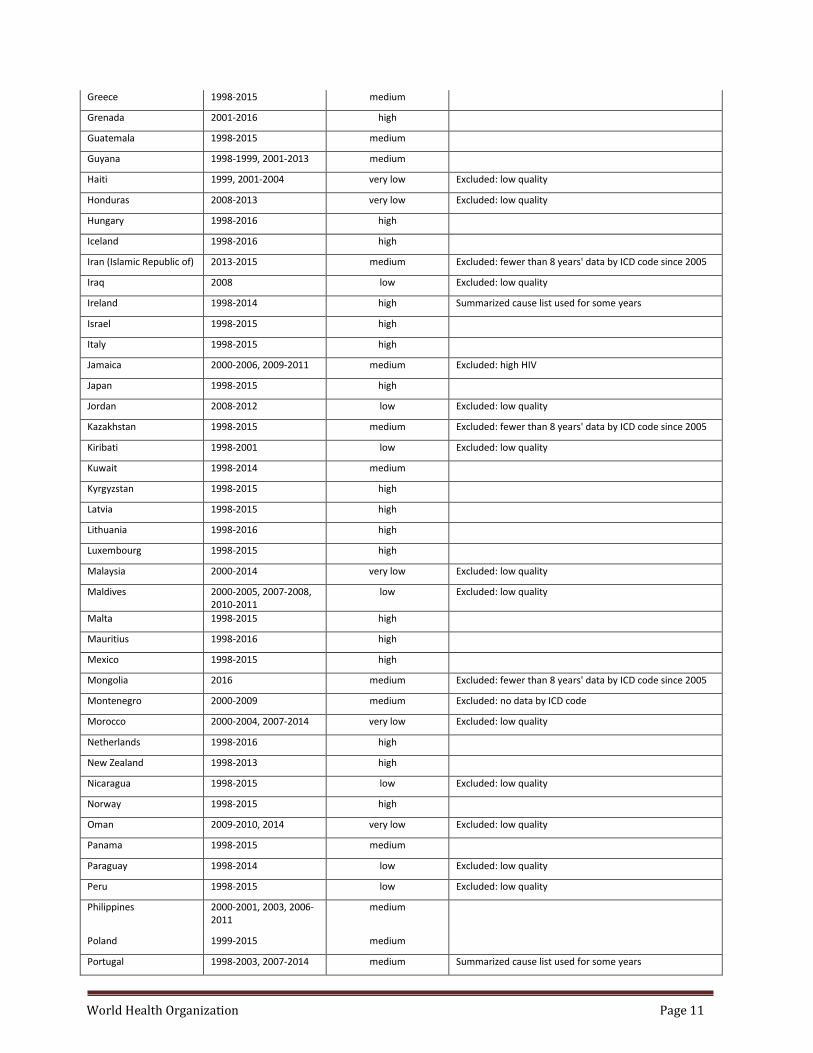
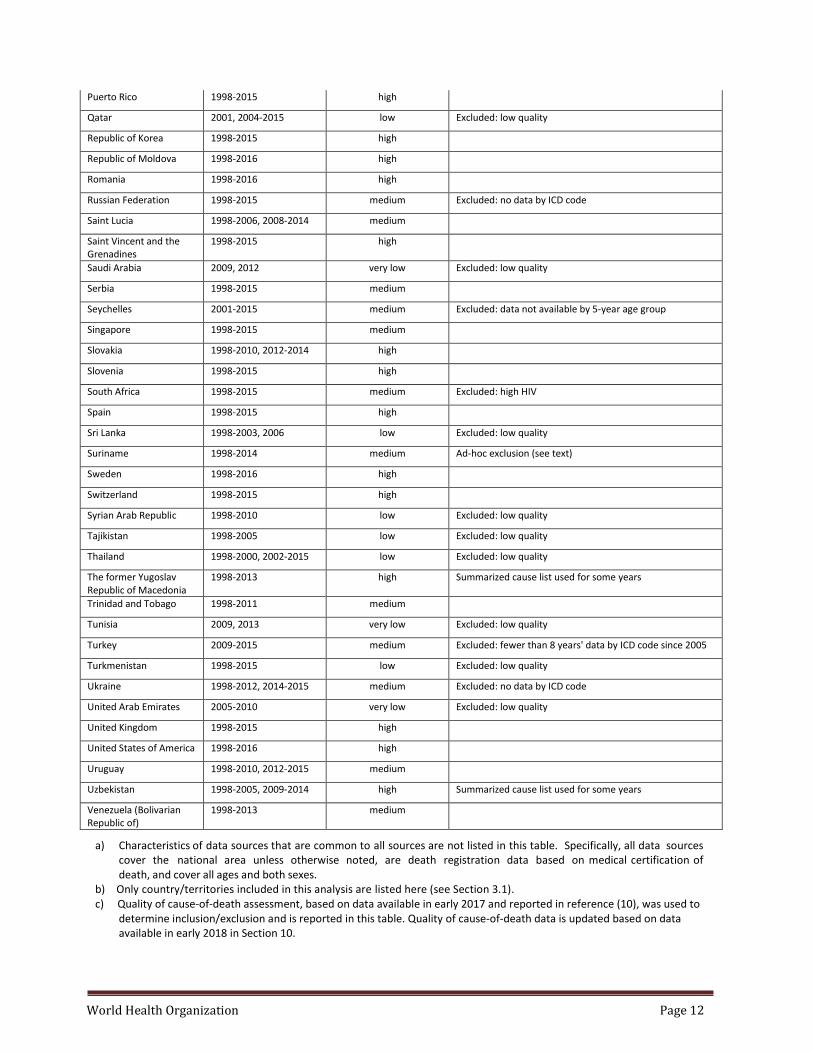
Table 4.1. Characteristicsa of country vital registration data and inclusion/exclusionb
Country Years Available Quality of cause-of-death data
1998-2013 high Summarized cause list used for some years
Trinidad and Tobago 1998-2011 medium
Tunisia 2009, 2013 very low Excluded: low quality
Turkey 2009-2015 medium Excluded: fewer than 8 years' data by ICD code since 2005
Turkmenistan 1998-2015 low Excluded: low quality
Ukraine 1998-2012, 2014-2015 medium Excluded: no data by ICD code
United Arab Emirates 2005-2010 very low Excluded: low quality
United Kingdom 1998-2015 high
United States of America 1998-2016 high
Uruguay 1998-2010, 2012-2015 medium
Uzbekistan 1998-2005, 2009-2014 high Summarized cause list used for some years
Venezuela (Bolivarian Republic of)
1998-2013 medium
a) Characteristics of data sources that are common to all sources are not listed in this table. Specifically, all data sources cover the national area unless otherwise noted, are death registration data based on medical certification of death, and cover all ages and both sexes.
b) Only country/territories included in this analysis are listed here (see Section 3.1). c) Quality of cause-of-death assessment, based on data available in early 2017 and reported in reference (10), was used to
determine inclusion/exclusion and is reported in this table. Quality of cause-of-death data is updated based on data available in early 2018 in Section 10.
World Health Organization Page 13
4.3 Mapping to the GHE cause lists and redistribution of unknown age/sex or ill-defined cause of death
Included vital registration data were coded according to ICD9, ICD10, or one of several abbreviated cause lists derived from ICD9 or ICD10. Total deaths by cause, age and sex were mapped to the GHE cause list (Annex Table A). We used the complete cause list in Annex Table A if the data were coded using 3- or 4-digit ICD-10 codes or 4-digit ICD-9 codes. For all included data, we extracted the number of deaths by cause, age and sex, using the broad cause categories listed in Table 4.5 (hereafter “shortlist”). In some cases, counts of deaths were not available for specific causes of death. Specifically, chlamydia deaths were not available in the 4-digit ICD-9 codes. The mean fraction of other sexually transmitted disease deaths caused by chlamydia was calculated for each country-sex group and applied to all years of data for that country. If there were no deaths coded to other sexually transmitted diseases in a given country, the mean fraction for all other countries was used. Several causes of death are not available in death registration data coded using ICD10 at the 3-digit level: hepatitis C (acute infections), lymphatic filariasis, Japanese encephalitis, panic disorder, age-related vision disorders, congenital abdominal wall defect, and congenital oesophageal atresia. Deaths for all of these causes were assumed to be zero in the countries with data coded to ICD10 at the 3-digit level.
Deaths of unknown sex were redistributed pro-rata within cause-age groups of known sexes, and then deaths of unknown age were redistributed pro-rata within cause-sex groups of known ages. We redistributed deaths coded to symptoms, signs and ill-defined conditions (ICD10 codes R00-R94,R96- R99) pro-rata to all non-injury causes of death, and injuries with undetermined intent (ICD10 codes Y10- Y34) pro-rata to all injury causes of death, following previously published methods (12). Cancers with unspecified site (ICD10 codes C76, C80, C97) were redistributed pro-rata to all sites excluding liver, pancreas, ovary, and lung. Additionally, we redistributed cancer of uterus, part unspecified (C55) pro- rata to cervix uteri (C53) and corpus uteri (C54).
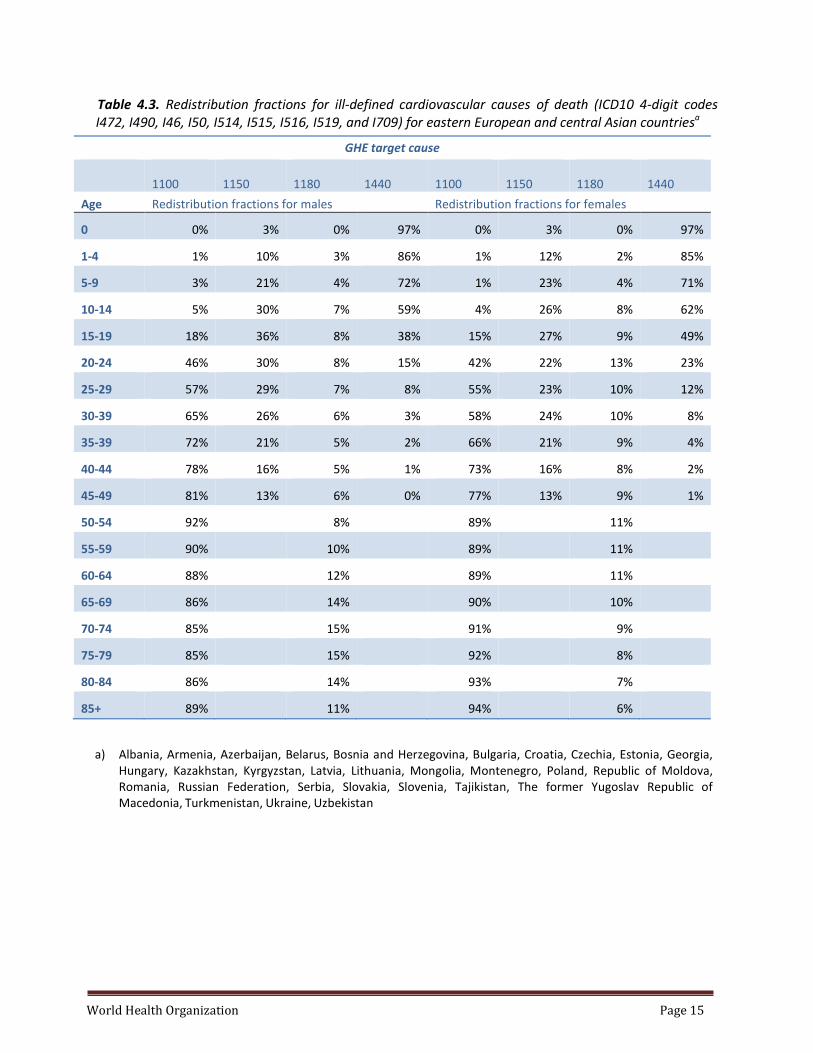
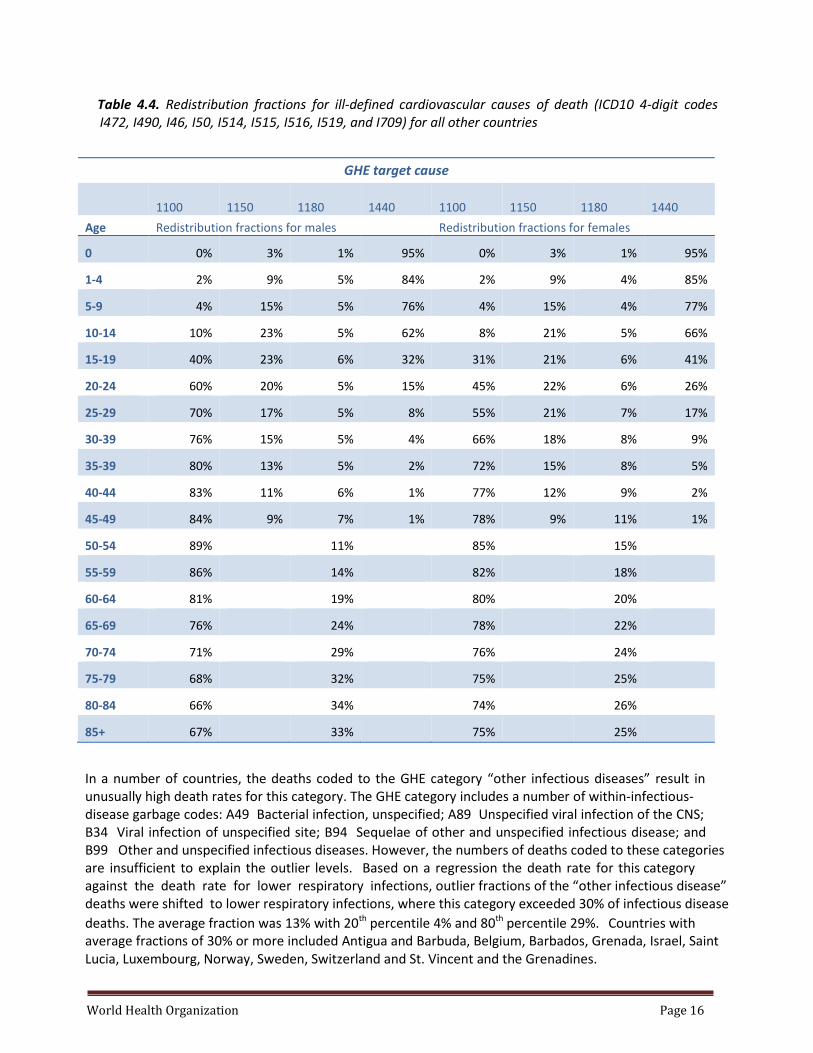
Previously published analyses of heart failure (13, 14) have proposed that these deaths be reassigned mainly to to ischemic heart disease (IHD; cause 1100), chronic obstructive pulmonary disease (COPD; cause 1180) in older adults, and to IHD, COPD, cardiomyopathy, myocarditis, and endocarditis (cause 1150) and congenital heart anomalies (cause 1440) in children, adolescents and young adults (destination causes for ill-defined deaths may be called target causes). Following these analyses, we redistributed heart failure and other ill-defined cardiovascular causes of death to IHD and COPD in adults over age 50 and to the four target causes—IHD, COPD, cardiomyopathy, myocarditis, endocarditis, and congenital heart anomalies in people under age 50. As these conditions have strong age and sex patterns, redistribution fractions were calculated by age and sex. We combined available data from three epidemiologically relevant regions, the traditional high-income countries, Eastern Europe and Central Asia, and other countries with usable death registration data, and calculated fractions for each target disease based on their relative frequency in the data. The redistribution fractions are shown in Tables 4.2-4.5.
The ICD-10 code ranges mapped to hypertensive heart disease (HHD) include codes for essential hypertension (I10), secondary hypertension (I15) and hypertensive renal disease (I12). Most deaths coded to essential hypertension are likely to be due to ischaemic heart disease, and additionally it is likely that a proportion of deaths coded to HHD are actually due to ischaemic heart disease in people who also had essential hypertension.
Based on a regression analysis of the logit of the proportion of deaths in the HHD category that were coded to essential hypertension against the crude HHD death rate, the predicted fraction of HHD deaths to be redistributed to IHD was estimated. It was set to 30% for country-years with HHD death rate less than 20
World Health Organization Page 14
per 100,000. For certain outlier countries, it was set to country-specific values derived directly from the VR data: 50% (Brazil), 40% (France) and 37% (Argentina). Based on a similar analysis, 10% of HHD deaths were redistributed to “other chronic kidney disease”, with specific higher values for Japan (18%), Mexico (30%) and the USA (15%).
Table 4.2. Redistribution fractions for ill-defined cardiovascular causes of death (ICD10 4-digit codes
I472, I490, I46, I50, I514, I515, I516, I519, and I709) for the traditionally high-income countriesa
GHE target cause
1100 1150 1180 1440 1100 1150 1180 1440
Age Redistribution fractions for males Redistribution fractions for females
0 1% 6% 1% 93% 0% 6% 1% 93%
1-4 2% 18% 5% 76% 2% 21% 3% 73%
5-9 4% 26% 4% 66% 4% 31% 4% 61%
10-14 6% 34% 4% 56% 5% 33% 4% 58%
15-19 15% 41% 4% 41% 11% 37% 5% 47%
20-24 31% 41% 3% 25% 22% 40% 4% 34%
25-29 48% 34% 3% 15% 34% 37% 4% 25%
30-39 63% 26% 3% 8% 49% 31% 5% 15%
35-39 75% 19% 3% 4% 61% 24% 6% 9%
40-44 81% 13% 4% 2% 69% 17% 10% 5%
45-49 83% 10% 5% 1% 70% 13% 14% 3%
50-54 91% 9% 78% 22%
55-59 88% 12% 73% 27%
60-64 84% 16% 71% 29%
65-69 79% 21% 70% 30%
70-74 76% 24% 71% 29%
75-79 74% 26% 75% 25%
80-84 74% 26% 79% 21%
85+ 76% 24% 85% 15%
a) Andorra, Australia, Austria, Belgium, Canada, Cyprus, Denmark, Finland, France, Germany, Greece,
Iceland, Ireland, Israel, Italy, Japan, Luxembourg, Malta, Monaco, Netherlands, New Zealand, Norway, Portugal, Republic of Korea, San Marino, Singapore, Spain, Sweden, Switzerland, United Kingdom, United States of America
World Health Organization Page 15
Table 4.3. Redistribution fractions for ill-defined cardiovascular causes of death (ICD10 4-digit codes I472, I490, I46, I50, I514, I515, I516, I519, and I709) for eastern European and central Asian countriesa
GHE target cause
1100 1150 1180 1440 1100 1150 1180 1440
Age Redistribution fractions for males Redistribution fractions for females
0 0% 3% 0% 97% 0% 3% 0% 97%
1-4 1% 10% 3% 86% 1% 12% 2% 85%
5-9 3% 21% 4% 72% 1% 23% 4% 71%
10-14 5% 30% 7% 59% 4% 26% 8% 62%
15-19 18% 36% 8% 38% 15% 27% 9% 49%
20-24 46% 30% 8% 15% 42% 22% 13% 23%
25-29 57% 29% 7% 8% 55% 23% 10% 12%
30-39 65% 26% 6% 3% 58% 24% 10% 8%
35-39 72% 21% 5% 2% 66% 21% 9% 4%
40-44 78% 16% 5% 1% 73% 16% 8% 2%
45-49 81% 13% 6% 0% 77% 13% 9% 1%
50-54 92% 8% 89% 11%
55-59 90% 10% 89% 11%
60-64 88% 12% 89% 11%
65-69 86% 14% 90% 10%
70-74 85% 15% 91% 9%
75-79 85% 15% 92% 8%
80-84 86% 14% 93% 7%
85+ 89% 11% 94% 6%
a) Albania, Armenia, Azerbaijan, Belarus, Bosnia and Herzegovina, Bulgaria, Croatia, Czechia, Estonia, Georgia, Hungary, Kazakhstan, Kyrgyzstan, Latvia, Lithuania, Mongolia, Montenegro, Poland, Republic of Moldova, Romania, Russian Federation, Serbia, Slovakia, Slovenia, Tajikistan, The former Yugoslav Republic of Macedonia, Turkmenistan, Ukraine, Uzbekistan
World Health Organization Page 16
Table 4.4. Redistribution fractions for ill-defined cardiovascular causes of death (ICD10 4-digit codes I472, I490, I46, I50, I514, I515, I516, I519, and I709) for all other countries
GHE target cause
1100 1150 1180 1440 1100 1150 1180 1440
Age Redistribution fractions for males Redistribution fractions for females
0 0% 3% 1% 95% 0% 3% 1% 95%
1-4 2% 9% 5% 84% 2% 9% 4% 85%
5-9 4% 15% 5% 76% 4% 15% 4% 77%
10-14 10% 23% 5% 62% 8% 21% 5% 66%
15-19 40% 23% 6% 32% 31% 21% 6% 41%
20-24 60% 20% 5% 15% 45% 22% 6% 26%
25-29 70% 17% 5% 8% 55% 21% 7% 17%
30-39 76% 15% 5% 4% 66% 18% 8% 9%
35-39 80% 13% 5% 2% 72% 15% 8% 5%
40-44 83% 11% 6% 1% 77% 12% 9% 2%
45-49 84% 9% 7% 1% 78% 9% 11% 1%
50-54 89% 11% 85% 15%
55-59 86% 14% 82% 18%
60-64 81% 19% 80% 20%
65-69 76% 24% 78% 22%
70-74 71% 29% 76% 24%
75-79 68% 32% 75% 25%
80-84 66% 34% 74% 26%
85+ 67% 33% 75% 25%
In a number of countries, the deaths coded to the GHE category “other infectious diseases” result in unusually high death rates for this category. The GHE category includes a number of within-infectious- disease garbage codes: A49 Bacterial infection, unspecified; A89 Unspecified viral infection of the CNS; B34 Viral infection of unspecified site; B94 Sequelae of other and unspecified infectious disease; and B99 Other and unspecified infectious diseases. However, the numbers of deaths coded to these categories are insufficient to explain the outlier levels. Based on a regression the death rate for this category against the death rate for lower respiratory infections, outlier fractions of the “other infectious disease” deaths were shifted to lower respiratory infections, where this category exceeded 30% of infectious disease
deaths. The average fraction was 13% with 20th percentile 4% and 80th percentile 29%. Countries with average fractions of 30% or more included Antigua and Barbuda, Belgium, Barbados, Grenada, Israel, Saint Lucia, Luxembourg, Norway, Sweden, Switzerland and St. Vincent and the Grenadines.
World Health Organization Page 17
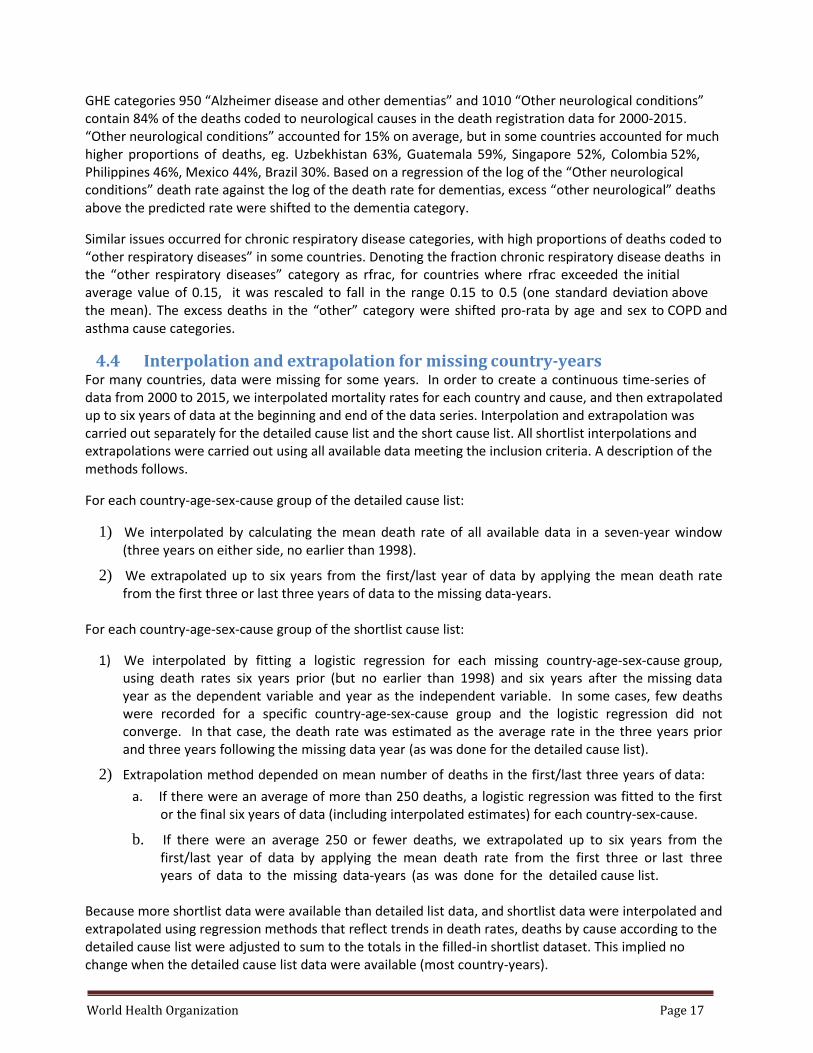
GHE categories 950 “Alzheimer disease and other dementias” and 1010 “Other neurological conditions” contain 84% of the deaths coded to neurological causes in the death registration data for 2000-2015. “Other neurological conditions” accounted for 15% on average, but in some countries accounted for much higher proportions of deaths, eg. Uzbekhistan 63%, Guatemala 59%, Singapore 52%, Colombia 52%, Philippines 46%, Mexico 44%, Brazil 30%. Based on a regression of the log of the “Other neurological conditions” death rate against the log of the death rate for dementias, excess “other neurological” deaths above the predicted rate were shifted to the dementia category.
Similar issues occurred for chronic respiratory disease categories, with high proportions of deaths coded to “other respiratory diseases” in some countries. Denoting the fraction chronic respiratory disease deaths in the “other respiratory diseases” category as rfrac, for countries where rfrac exceeded the initial average value of 0.15, it was rescaled to fall in the range 0.15 to 0.5 (one standard deviation above the mean). The excess deaths in the “other” category were shifted pro-rata by age and sex to COPD and asthma cause categories.
4.4 Interpolation and extrapolation for missing country-years For many countries, data were missing for some years. In order to create a continuous time-series of data from 2000 to 2015, we interpolated mortality rates for each country and cause, and then extrapolated up to six years of data at the beginning and end of the data series. Interpolation and extrapolation was carried out separately for the detailed cause list and the short cause list. All shortlist interpolations and extrapolations were carried out using all available data meeting the inclusion criteria. A description of the methods follows.
For each country-age-sex-cause group of the detailed cause list:
1) We interpolated by calculating the mean death rate of all available data in a seven-year window (three years on either side, no earlier than 1998).
2) We extrapolated up to six years from the first/last year of data by applying the mean death rate from the first three or last three years of data to the missing data-years.
For each country-age-sex-cause group of the shortlist cause list:
1) We interpolated by fitting a logistic regression for each missing country-age-sex-cause group, using death rates six years prior (but no earlier than 1998) and six years after the missing data year as the dependent variable and year as the independent variable. In some cases, few deaths were recorded for a specific country-age-sex-cause group and the logistic regression did not converge. In that case, the death rate was estimated as the average rate in the three years prior and three years following the missing data year (as was done for the detailed cause list).
2) Extrapolation method depended on mean number of deaths in the first/last three years of data:
a. If there were an average of more than 250 deaths, a logistic regression was fitted to the first or the final six years of data (including interpolated estimates) for each country-sex-cause.
b. If there were an average 250 or fewer deaths, we extrapolated up to six years from the first/last year of data by applying the mean death rate from the first three or last three years of data to the missing data-years (as was done for the detailed cause list.
Because more shortlist data were available than detailed list data, and shortlist data were interpolated and extrapolated using regression methods that reflect trends in death rates, deaths by cause according to the detailed cause list were adjusted to sum to the totals in the filled-in shortlist dataset. This implied no change when the detailed cause list data were available (most country-years).
World Health Organization Page 18
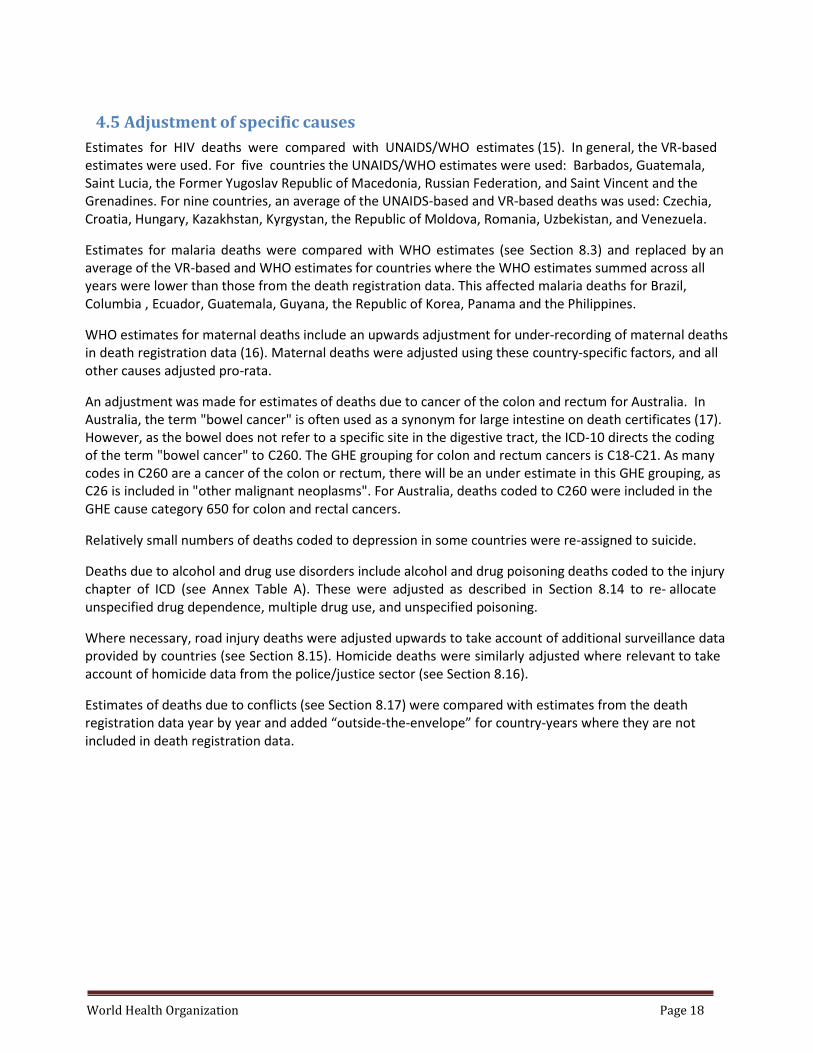
4.5 Adjustment of specific causes
Estimates for HIV deaths were compared with UNAIDS/WHO estimates (15). In general, the VR-based estimates were used. For five countries the UNAIDS/WHO estimates were used: Barbados, Guatemala, Saint Lucia, the Former Yugoslav Republic of Macedonia, Russian Federation, and Saint Vincent and the Grenadines. For nine countries, an average of the UNAIDS-based and VR-based deaths was used: Czechia, Croatia, Hungary, Kazakhstan, Kyrgystan, the Republic of Moldova, Romania, Uzbekistan, and Venezuela.
Estimates for malaria deaths were compared with WHO estimates (see Section 8.3) and replaced by an average of the VR-based and WHO estimates for countries where the WHO estimates summed across all years were lower than those from the death registration data. This affected malaria deaths for Brazil, Columbia , Ecuador, Guatemala, Guyana, the Republic of Korea, Panama and the Philippines.
WHO estimates for maternal deaths include an upwards adjustment for under-recording of maternal deaths in death registration data (16). Maternal deaths were adjusted using these country-specific factors, and all other causes adjusted pro-rata.
An adjustment was made for estimates of deaths due to cancer of the colon and rectum for Australia. In Australia, the term "bowel cancer" is often used as a synonym for large intestine on death certificates (17). However, as the bowel does not refer to a specific site in the digestive tract, the ICD-10 directs the coding of the term "bowel cancer" to C260. The GHE grouping for colon and rectum cancers is C18-C21. As many codes in C260 are a cancer of the colon or rectum, there will be an under estimate in this GHE grouping, as C26 is included in "other malignant neoplasms". For Australia, deaths coded to C260 were included in the GHE cause category 650 for colon and rectal cancers.
Relatively small numbers of deaths coded to depression in some countries were re-assigned to suicide.
Deaths due to alcohol and drug use disorders include alcohol and drug poisoning deaths coded to the injury chapter of ICD (see Annex Table A). These were adjusted as described in Section 8.14 to re- allocate unspecified drug dependence, multiple drug use, and unspecified poisoning.
Where necessary, road injury deaths were adjusted upwards to take account of additional surveillance data provided by countries (see Section 8.15). Homicide deaths were similarly adjusted where relevant to take account of homicide data from the police/justice sector (see Section 8.16).
Estimates of deaths due to conflicts (see Section 8.17) were compared with estimates from the death registration data year by year and added “outside-the-envelope” for country-years where they are not included in death registration data.
World Health Organization Page 19
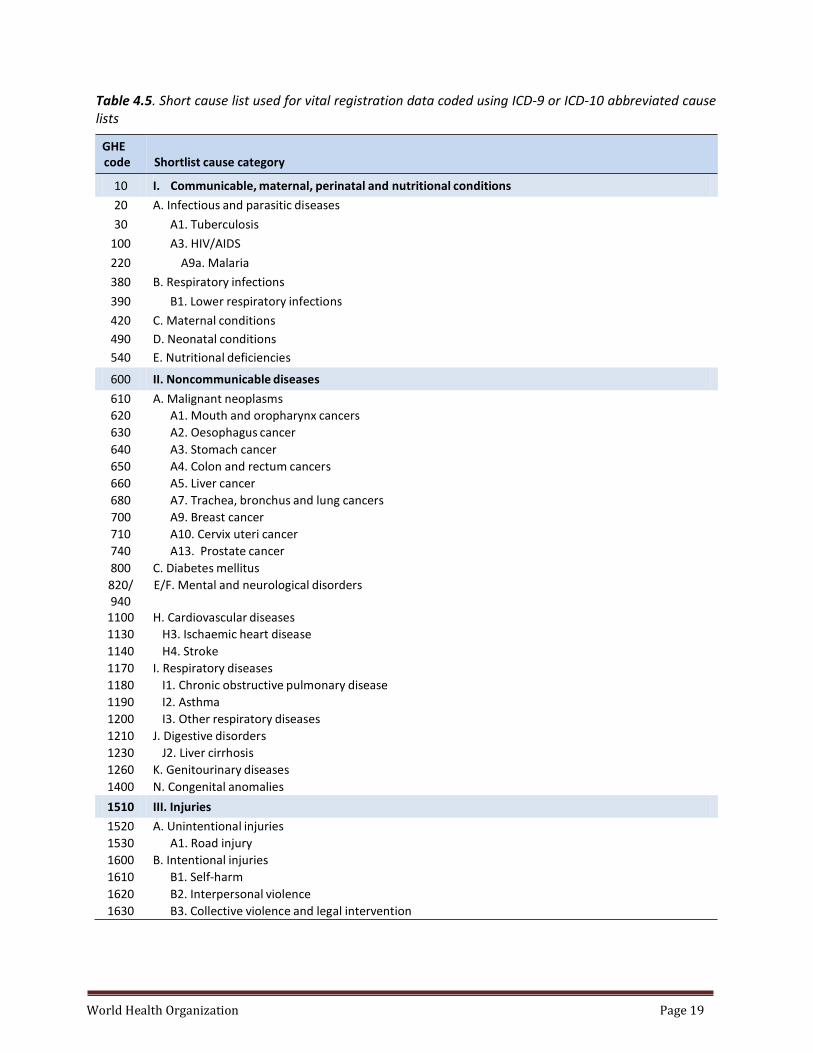
Table 4.5. Short cause list used for vital registration data coded using ICD-9 or ICD-10 abbreviated cause lists
GHE code Shortlist cause category
10 I. Communicable, maternal, perinatal and nutritional conditions
20 A. Infectious and parasitic diseases
30 A1. Tuberculosis
100 A3. HIV/AIDS
220 A9a. Malaria
380 B. Respiratory infections
390 B1. Lower respiratory infections
420 C. Maternal conditions
490 D. Neonatal conditions
540 E. Nutritional deficiencies
600 II. Noncommunicable diseases
610 A. Malignant neoplasms
620 A1. Mouth and oropharynx cancers
630 A2. Oesophagus cancer
640 A3. Stomach cancer
650 A4. Colon and rectum cancers
660 A5. Liver cancer
680 A7. Trachea, bronchus and lung cancers
700 A9. Breast cancer
710 A10. Cervix uteri cancer
740 A13. Prostate cancer
800 C. Diabetes mellitus
820/ 940
E/F. Mental and neurological disorders
1100 H. Cardiovascular diseases
1130 H3. Ischaemic heart disease
1140 H4. Stroke
1170 I. Respiratory diseases
1180 I1. Chronic obstructive pulmonary disease
1190 I2. Asthma
1200 I3. Other respiratory diseases
1210 J. Digestive disorders
1230 J2. Liver cirrhosis
1260 K. Genitourinary diseases
1400 N. Congenital anomalies
1510 III. Injuries
1520 A. Unintentional injuries
1530 A1. Road injury
1600 B. Intentional injuries
1610 B1. Self-harm
1620 B2. Interpersonal violence
1630 B3. Collective violence and legal intervention
World Health Organization Page 20
Death rates for some specific conditions were extreme outliers in a few countries. These outliers were adjusted as follows:
• Death rates for skin disease for Barbados were replaced by the average of rates for Antigua and Barbuda, Trinidad and Tobago, Saint Lucia and Saint Vincent and the Grenadines,
• Death rates for otitis media for Saint Vincent and the Grenadines were replaced by the average of rates for Antigua and Barbuda, Trinidad and Tobago, and Saint Lucia,
• Death rates for eating disorders for Guatemala were adjusted using rates for Mexico • Death rates for upper respiratory tract infections for Kyrgystan were replaced by estimates
based on those in GBD2015, which were somewhat higher than the rates for Tajikistan • Death rates for upper respiratory tract infections for Uzbekistan were replaced by estimates
based on the rates for Kazakhstan • Death rates for neurological disorders in Kazakhstan were reduced by 75% to bring them into line
with other countries in the region. • A change in coding practice for diabetes in Mauritius was corrected by adjusting diabetes deaths
before 2005 upwards by a factor of 3.3.
World Health Organization Page 21
5 Causes of death for children under age 5 years
5.1 Child deaths
The MCEE-WHO collaboration prepares estimates of deaths for children under age 5 for 15 cause categories using methods described elsewhere by Liu et al. (18) and a companion technical paper in this series (19). Previous MCEE-WHO estimates have been updated to years 2000-2016 as described elsewhere (8) and already separately released in the WHO Global Health Observatory. The separate methods used by MCEE-WHO for child causes of death for China and India are summarized below in Sections 5.2 and 5.3. Note that the WHO-MCEE cause estimates and the GBD2016 sub-cause distributions are derived from death registration data for those countries with useable death registration data.
The fifteen cause categories used for the WHO-MCEE estimates of under 5 deaths for years 2000-2016 (see Annex Table E) include all the major causes of neonatal (0-27 days), post-neonatal (1-59 months) and 1-4 year deaths and two residual categories containing all remaining causes of death (“Other Group 1” and “Other Group 2”). Cause groups such as “Congenital malformations” and “Injuries” were expanded to the full GHE cause list (Annex Table A) for neonatal and under 5 deaths using sub-cause distributions derived from the GBD2016 estimates (4).
5.2 Child deaths in China
Estimates of causes of death under age 5 by MCEE-WHO were based on a separate analysis of the China Maternal and Child Surveillance System (MCMSS). Cause-specific estimates of deaths for children under age 5 were estimated for 15 cause categories using data obtained from China Maternal and Child Surveillance System (MCMSS) for years 2000-2016 by age-sex-residency-region strata. The methods used are described in more detail in a technical paper in this series (19).
Total number of deaths were estimated based on subnational live births and MCMSS strata- specific mortality rates smoothed using a three-year moving average, and normalized to fit IGME all-cause number of death estimates. Cause-specific death proportions from MCMSS, smoothed using a 7-year moving average, were applied to the estimated total number of deaths to obtain the estimated number of deaths by cause by strata prior to summing to obtain national estimates.
5.3 Child deaths in India
In order to estimate trends in under 5 causes of death for India, the previously subnational analyses developed by MCEE-WHO were further refined and used to develop national estimates for years 2000-2016. For neonates, a verbal autopsy multi-cause model (VAMCM) based on 37 sub-national Indian community- based VA studies was used to predict the cause distribution of deaths at state level. The resulting cause- specific proportions were applied to the estimated total number of neonatal deaths to obtain the estimated number of deaths by cause at state level prior to summing to obtain national estimates.
For children who died in the ages of 1-59 months in India, an India-specific multi-cause model (18) was rerun for years 2000-2016 after an updated systematic review was conducted to identify 27 new study data points of sub-national community-based VA studies, plus 22 sets of observations for the Indian states derived from the Million Death Study (20). Nine cause categories were specified, including measles plus the eight specified in the post-neonatal VAMCM for other countries. State-level measles deaths were then normalized to fit the national measles estimates produced by the WHO IVB. State- level AIDS and malaria estimates were provided by UNAIDS and WHO malaria program, respectively. All cause fractions were
World Health Organization Page 22
adjusted to sum to one. The state-level estimates were collapsed to obtain national estimates at the end.
6 Causes of death for China 2000-2016
6.1 Data sources for causes of death
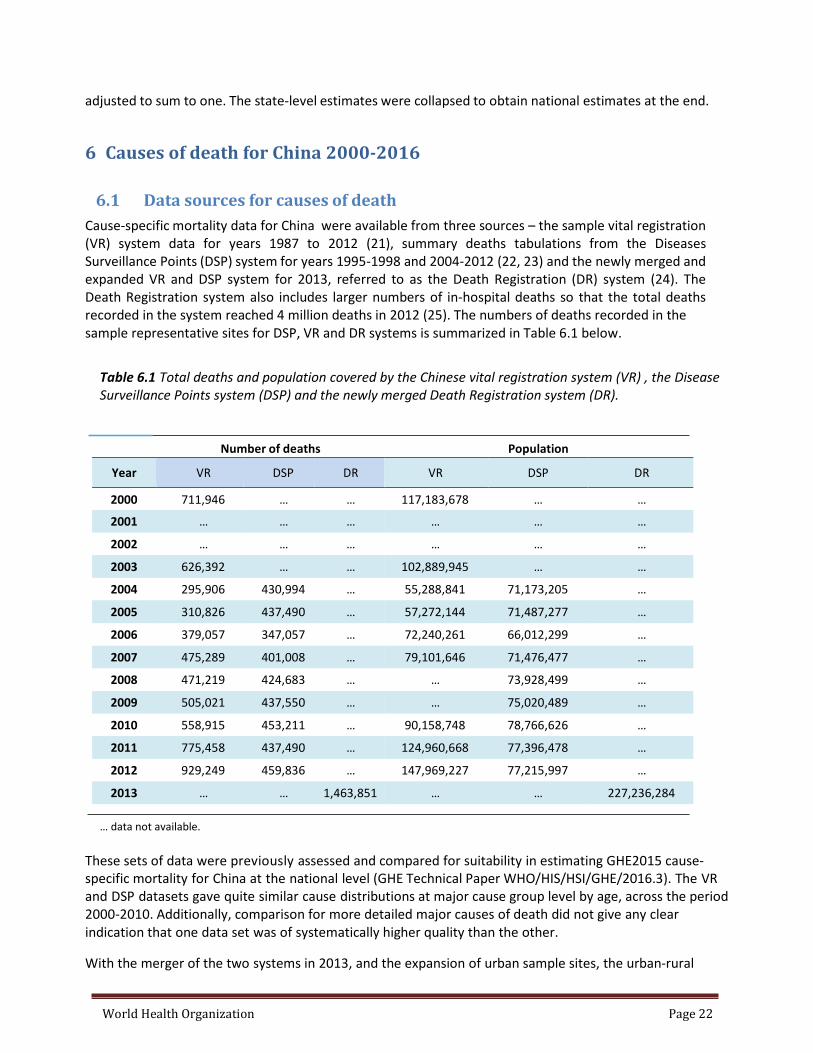
Cause-specific mortality data for China were available from three sources – the sample vital registration (VR) system data for years 1987 to 2012 (21), summary deaths tabulations from the Diseases Surveillance Points (DSP) system for years 1995-1998 and 2004-2012 (22, 23) and the newly merged and expanded VR and DSP system for 2013, referred to as the Death Registration (DR) system (24). The Death Registration system also includes larger numbers of in-hospital deaths so that the total deaths recorded in the system reached 4 million deaths in 2012 (25). The numbers of deaths recorded in the sample representative sites for DSP, VR and DR systems is summarized in Table 6.1 below.
Table 6.1 Total deaths and population covered by the Chinese vital registration system (VR) , the Disease Surveillance Points system (DSP) and the newly merged Death Registration system (DR).
Number of deaths Population
Year VR DSP DR VR DSP DR
2000 711,946 … … 117,183,678 … …
2001 … … … … … …
2002 … … … … … …
2003 626,392 … … 102,889,945 … …
2004 295,906 430,994 … 55,288,841 71,173,205 …
2005 310,826 437,490 … 57,272,144 71,487,277 …
2006 379,057 347,057 … 72,240,261 66,012,299 …
2007 475,289 401,008 … 79,101,646 71,476,477 …
2008 471,219 424,683 … … 73,928,499 …
2009 505,021 437,550 … … 75,020,489 …
2010 558,915 453,211 … 90,158,748 78,766,626 …
2011 775,458 437,490 … 124,960,668 77,396,478 …
2012 929,249 459,836 … 147,969,227 77,215,997 …
2013 … … 1,463,851 … … 227,236,284
… data not available.
These sets of data were previously assessed and compared for suitability in estimating GHE2015 cause-specific mortality for China at the national level (GHE Technical Paper WHO/HIS/HSI/GHE/2016.3). The VR and DSP datasets gave quite similar cause distributions at major cause group level by age, across the period 2000-2010. Additionally, comparison for more detailed major causes of death did not give any clear indication that one data set was of systematically higher quality than the other.
With the merger of the two systems in 2013, and the expansion of urban sample sites, the urban-rural
World Health Organization Page 23
composition of the sampled populations changed to be more nationally representative. For earlier years, WHO analyses had re-weighted urban and rural samples from DSP and VR to give approximate national representativeness. However, the DR dataset for 2013 also uses a different set of cause categories, not entirely consistent with the earlier datasets. We mapped cause categories from the three datasets to GHE cause categories and examined the resulting cause-specific time trends. There were inconsistencies between the DSP+VR based results and the 2013 results which were not resolvable given the available cause-specific information.
6.2 Estimation of deaths by cause for ages 5 and over
We also compared these results with the GBD2015 national cause-specific trends for China (26) and found reasonable consistency for the 2015 results for most but not all causes. For causes for which WHO has specific estimates as described in Section 8 below, these estimates were used. For other causes, cause fractions from the GBD2016 estimates were used, adjusted to the WHO envelope for these causes. The GBD2016 estimates were derived from available Chinese data on causes of death at national and sub-national levels, with major inputs coming from the DSP and VR sample systems for years 2000-2012, with additional data on deaths in Chinese hospitals (25).
Based on the comparison with the DR 2013 data, we made the following adjustments to WHO and GBD2016 inputs:
(1) 2011-2016 estimates for road injury deaths were revised upwards so that total road injury deaths for
China in 2013 were 289,600, which is still somewhat lower than the 328,400 estimated by GBD2016.
(2) Certain GBD2016 cause fractions were adjusted as follows:
a. Diabetes 17% increase
b. Epilepsy 10% increase
c. Other neurological 6% increase
d. COPD decrease linearly from 0% in 2008 to 11.2% in 2016 (based on trend in VR/DSP
data for 2000-2010)
e. Other respiratory: increase in 2000 of 25%, dropping to 0% in 2015 and beyond
(based on trend in VR/DSP data for 2000-2010)
f. Suicide: increase ranging linearly from 25% in 2000 to 15% in 2010 and beyond (based on trend in VR/DSP data for 2000-2010)
World Health Organization Page 24
7 Causes of death for India 2000-2016
7.1 Sample Registration System data
Analysis of causes of death for India was based on data from the Sample Registration system (SRS) for the periods 2001-2003 (27, 28) and 2010-2013 (29, 30). These data were derived from representative samples of deaths in the SRS sampling areas, for which verbal autopsy methods were used to assign cause of death. The Sample Registration System monitors a representative sample population of over 6 million people in over 1 million homes in India. In 2013, a total of 7,597 sample units covered a total population of 7.5 million people, of whom 2.0 million were in urban areas and 5.5 million in rural areas.
In 2001 the Indian Registrar General Surveyor introduced an enhanced form of verbal autopsy for assessing the cause of death. Verbal autopsy is a method of ascertaining the cause of death by interviewing a family member or caretaker of the deceased to obtain information on the clinical signs, symptoms and general circumstances that preceded the death. Details of methods and validation have been reported elsewhere (29, 30). Verbal autopsy reports were independently coded to ICD-10 categories by at least two of a total of 130 physicians trained in ICD-10 coding. In case of disagreement on the ICD-10 codes at the chapter level, reconciliation between reports was conducted, followed by a third senior physician’s adjudication.
A total of 122,848 deaths between January 2001 and December 2003, and a total of 182,827 deaths for 2010-2013 were assigned causes of death by verbal autopsy. Verbal autopsies could not be conducted for around 10% of the deaths for reasons such as family migration or change of residence.
The cause-specific proportion of deaths in each five-year age category from 0 to 79 years and for people aged 80 years and over was weighted by the inverse probability of a household being selected within rural and urban subdivisions of each state to account for the sampling design. National estimates for deaths and mortality rates were based on reweighted urban and rural estimates for India, by age, sex and area.
The GHE analysis is based on the resulting national-level cause-specific mortality proportions derived for GHE cause categories from the SRS data. GBD2016 cause fractions were used to redistribute deaths to detailed sub-cause categories in cases where the SRS cause categories were broader than the GHE cause categories.
For causes for which full time series estimates for years 2000-2016 were not available from WHO technical programs and UNAIDS (see Section 8), the trends for the full period 2000-2016 were estimated as follows. We made use of the trends estimated by IHME in the GBD2016 study (4). The India data sources used by IHME can be inspected on their website (11). The GBD2016 estimates for years 2000-2016 were rescaled for consistency with the total deaths across all such causes estimated from WHO life tables and cause-specific estimates. Age-sex-cause specific ratios of SRS-based deaths to rescaled GBD2016 deaths were calculated from the SRS data for period 2002 (2001-2003) and 2011.5 (2010-2013). The scale factors were linearly interpolated for years 2003-2011 and extrapolated to year 2000 and 2016. They were then applied to the GBD2016 estimates to generate full time series for these causes consistent with the WHO analyses of the SRS data for 2001-2003 and 2010-2013. The remaining cause-specific estimates were based on information from WHO technical programs and UNAIDS on specific causes as described in Section 8.
World Health Organization Page 25
8 Methods for specific causes with additional information
8.1 Tuberculosis
For countries without useable death registration data, total tuberculosis deaths were derived from latest published WHO estimates (31), together with more detailed unpublished age distributions based on the VR data and notifications data. For the countries with useable death registration data, the VR-based estimates were generally somewhat higher than the WHO estimates, as the GHE cause category for tuberculosis includes the ICD code for deaths due to late effects of tuberculosis. For Barbados, an average of the VR-based and WHO estimates was used, as the total VR-based TB deaths across all available years were less than 75% of the total based on the WHO estimates. For countries where the total VR-based deaths were in the range of 75% to <100% of the WHO-based total, the WHO estimates were used with age pattern based on that in the VR data. These countries were Austria, Bulgaria, Switzerland, Cuba, Cyprus, Czechia, Fiji, Guatemala, Guyana, Hungary, Ireland, Italy, Kyrgystan, Saint Lucia, Republic of Moldova, Mexico, Mauritius, Netherlands, PRI, Serbia, Slovakia, Sweden, Trinidad and Tobago, Uzbekistan, Saint Vincent and the Grenadines.
8.2 HIV/AIDS and sexually transmitted diseases
(a) High HIV countries For 43 countries with significant HIV epidemics, explicit efforts were made to ensure consistency of all- cause and HIV mortality estimates across the period 2000-2016 in the 2016 revision of WHO life tables and all-cause mortality “envelopes” (9). These countries are identified in Annex Table D.
For 18 high HIV countries, provisional non-HIV mortality rates were calculated from the model life table assumptions and life expectancy series provided by UN Population Division, as described in the life tables technical paper (9). We added UNAIDS 2017 estimates of HIV death rates (15) to the non-HIV death rates to recomputed total mortality rates. This led to consequential changes in trends and/or levels of all-cause adult mortality for a number of countries. To reduce these differences and to smooth trends for non-HIV mortality, some adjustments were made to the model life tables for non-HIV mortality for some countries. In the case of South Africa, all-cause death registration data (7) adjusted for completeness was also used to assess levels of all-cause mortality, resulting in HIV mortality estimates somewhat lower than UNAIDS and WPP2015 estimates. For more details refer to the previous technical paper (9).
For another 25 countries with significant HIV mortality, we subtracted the revised Spectrum modelled HIV mortality rates from the WPP2017 all-cause mortality rates and examined the consistency and plausibility of the resulting non-HIV mortality time trends, age trends and sex ratios. WHO all-cause mortality rates were calculated by smoothing the implied non-HIV mortality trends and adding back the UNAIDS HIV mortality estimates.
(b) Countries with useable vital registration data For countries with useable death registration data, estimates for HIV deaths were compared with UNAIDS/WHO estimates (15). In general, the VR-based estimates were used. For five countries the UNAIDS/WHO estimates were used: Barbados, Guatemala, Saint Lucia, the Former Yugoslav Republic of Macedonia, Russian Federation, and Saint Vincent and the Grenadines. For nine countries, an average of the UNAIDS-based and VR-based deaths was used: Czechia, Croatia, Hungary, Kazakhstan, Kyrgystan, the Republic of Moldova, Romania, Uzbekistan, and Venezuela.
World Health Organization Page 26
(c) Other countries For other countries, estimates were based on UNAIDS estimated HIV/AIDS mortality (33). UNAIDS does not estimate HIV deaths for the following countries: Comoros, Libya, Micronesia, Samoa, Seychelles, Solomon Islands, Tonga and Vanuatu. HIV estimates for these countries were based on previous WHO GHE2013 estimates with projections. It was assumed based on advice from UNAIDS that 1% of HIV deaths under age 5 occurred in the neonatal period.
8.3 Malaria
WHO publishes updates for malaria deaths (total, and under 5 years) by country for years from 2000 onwards in its annual World Malaria Report (32). The under 5 deaths are prepared in collaboration with the MCEE collaborative group and also reported in the MCEE-WHO child cause of death estimates (18, 19). For Member States without useable death registration data, these WHO malaria mortality estimates are used in GHE2016. The methods remain identical to those used for GHE2015 with updated data inputs, and are summarized in the following sections.
As already noted in Section 4.5, VR-based estimates were used for countries with useable VR data where the WHO estimates summed across all years were lower than those from the death registration data. VR-based deaths were higher than WHO estimates for Brazil, Columbia , Ecuador, Guatemala, Guyana, the Republic of Korea, Panama and the Philippines. For these countries, malaria deaths were based on an average of the VR-based and WHO estimates.
Under 5 deaths in countries with high quality VR data
For countries in which death reporting is estimated to capture > 50% of all deaths and a high proportion of malaria cases are parasitologically confirmed, reported malaria deaths are adjusted for completeness of death reporting. For countries in elimination programme phase, reported malaria deaths are adjusted for completeness of case reporting.
Under 5 deaths in countries outside the WHO African Region and low transmission countries in Africa
For countries (i) outside the African Region in which death reporting is estimated to capture ≤ 50% of all deaths or a high proportion of malaria cases are not parasitologically confirmed, or (ii) in the African Region where estimates of case incidence were derived from routine reporting systems and where malaria
comprises less than 5% of all deaths in children under 5,1 case fatality rates are used to derive number of deaths from case estimates. A case fatality rate of 0·256% is applied to the estimated number of P. falciparum cases, being the average of case fatality rates reported in the literature (33-35) and unpublished data from Indonesia, 2004-2009 (correspondence with Dr. Ric Price, Menzies School of Health Research). A case fatality rate of 0.0375% is applied to the estimated number of P. vivax cases, representing the mid-point of the range of reported case fatality rates (36). The number of cases reported by a Ministry of Health is adjusted to take into account (i) incompleteness in reporting systems (ii) patients seeking treatment in the private sector, self-medicating or not seeking treatment at all, and (iii) potential over-diagnosis through the lack of laboratory confirmation of cases.
Under 5 deaths in South Sudan and high transmission countries in the WHO African Region.
For countries in the African Region where malaria comprises 5% or more of all deaths in children under 5, malaria deaths were estimated using a multinomial logistic regression model fitted to available verbal autopsy data sets. This model is described in more detail elsewhere and draws on geospatial estimates of parasite prevalence rates produced by the Malaria Atlas Project at Oxford University in close collaboration with WHO (18, 19).
World Health Organization Page 27
Malaria deaths at ages 5 and over. The estimated malaria mortality rate in children under 5 years for a country was used to determine malaria transmission intensity and the corresponding malaria-specific mortality rates in older age groups (32, 37).
8.4 Whooping cough Recognizing the limited data to support modelling of pertussis mortality, the World Health Organization’s Department of Immunization Vaccines and Biologicals’ Quantitative Immunization and Vaccines Related Research (QUIVER), recommended in 2009 that a revised pertussis model be developed to specifically address uncertainty in the model inputs and parameter values. Inputs to the current model are country- and year-specific estimates of population by single year of age and estimated pertussis immunization coverage (38). Age-, country-, and immunization history- specific estimates of the probability of initial infection, probability that an infected individual develops typical symptoms of a case of pertussis and the probability that a case of pertussis will die were estimated using structured expert judgment. Annual deaths attributable to pertussis infection during the neonatal period (5% of estimated pertussis deaths 0-11 months of age), from age 1-11 months of age (estimated as 95% of deaths 1-11 months of age) and 12-59 months of age were estimated for each country for the years 2000 – 2012. The pertussis cause fraction was assumed to be constant to extrapolate forwards to 2016. Pertussis deaths at ages 5 and over were estimated from useable death registration data or GBD2016 analyses.
8.5 Measles
Estimates of measles deaths were prepared using a statistical model which firstly estimates measles cases by country and year using surveillance data and then makes explicit projections about dynamic transitions over time as well as overall patterns in incidence. Age-specific case fatality ratios are then applied for each country to estimate deaths (39). Measles deaths have been updated to take into account trends in case notifications and vaccine coverage up to and including the year 2016 (40).
8.6 Hepatitis-attributable deaths For liver cancer and cirrhosis of the liver, the GBD2016 estimated deaths for four aetiological categories: hepatitis B virus (HBV) infection, hepatitis C virus (HCV) infection, alcohol, and “other causes”. DisMod- MR 2.1 was used to model the proportions of liver cancers and liver cirrhosis due to these four sub- causes using data derived from systematic reviews of literature on the aetiology of liver cancers and liver cirrhosis (4). Relevant covariates used in DisMod-MR 2.1 were apparent alcohol consumption (litres per capita), hepatitis B surface antigen (HBsAg) seroprevalence, and hepatitis C (anti-HCV IgG) seroprevalence, and a binary covariate indicating countries with a predominantly Muslim population (associated with low alcohol consumption).
To ensure coherent results between the cirrhosis and the liver cancer etiologies, the results from the liver cancer etiology models were transformed into covariates that were then used in the cirrhosis etiology models. The results from the cirrhosis etiology models were then used in the liver cancer proportion models. The DisMod proportions for the underlying liver cancer and cirrhosis etiologies were then squeezed to 100% and these final proportions were applied to the total liver cancer and liver cirrhosis to derive the estimates for the four etiologies.
1 Algeria, Botswana, Cape Verde, Comoros, Eritrea, Ethiopia, Madagascar, Namibia, Sao Tome and Principe, South
Africa, Swaziland, and Zimbabw
World Health Organization Page 28
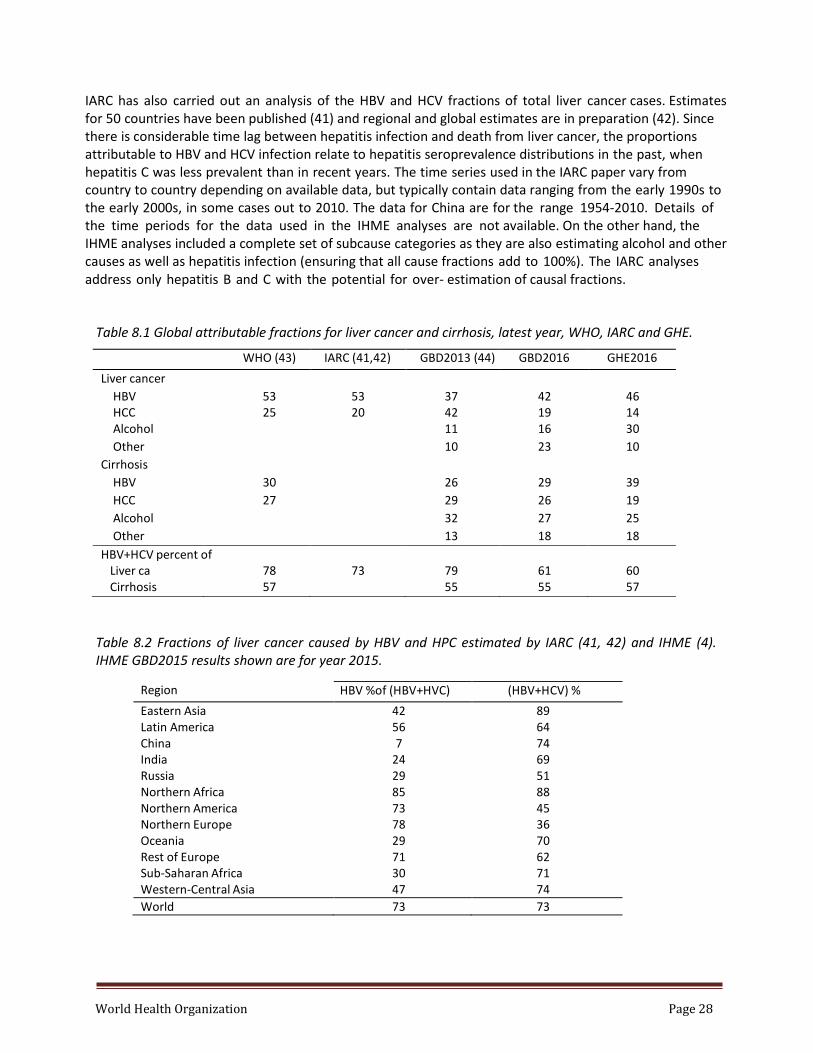
IARC has also carried out an analysis of the HBV and HCV fractions of total liver cancer cases. Estimates for 50 countries have been published (41) and regional and global estimates are in preparation (42). Since there is considerable time lag between hepatitis infection and death from liver cancer, the proportions attributable to HBV and HCV infection relate to hepatitis seroprevalence distributions in the past, when hepatitis C was less prevalent than in recent years. The time series used in the IARC paper vary from country to country depending on available data, but typically contain data ranging from the early 1990s to the early 2000s, in some cases out to 2010. The data for China are for the range 1954-2010. Details of the time periods for the data used in the IHME analyses are not available. On the other hand, the IHME analyses included a complete set of subcause categories as they are also estimating alcohol and other causes as well as hepatitis infection (ensuring that all cause fractions add to 100%). The IARC analyses address only hepatitis B and C with the potential for over- estimation of causal fractions.
Table 8.1 Global attributable fractions for liver cancer and cirrhosis, latest year, WHO, IARC and GHE.
WHO (43) IARC (41,42) GBD2013 (44) GBD2016 GHE2016
HBV+HCV percent of Liver ca 78 73 79 61 60 Cirrhosis 57 55 55 57
Table 8.2 Fractions of liver cancer caused by HBV and HPC estimated by IARC (41, 42) and IHME (4). IHME GBD2015 results shown are for year 2015.
Region HBV %of (HBV+HVC) (HBV+HCV) %
Eastern Asia 42 89 Latin America 56 64 China 7 74 India 24 69 Russia 29 51 Northern Africa 85 88 Northern America 73 45 Northern Europe 78 36 Oceania 29 70 Rest of Europe 71 62 Sub-Saharan Africa 30 71 Western-Central Asia 47 74
World 73 73
World Health Organization Page 29
Table 8.1 summarizes the global attributable fractions for HBV and HCV caused liver cancer and liver cirrhosis from WHO, IARC and IHME, together with the GHE2016 final estimates, derived as described below. In estimating the sub-causes of liver cancer and cirrhosis for GHE2016, we drew on the GBD2016, GBD2013 and IARC analyses as follows. The GBD2016 cause fractions for liver cancer were revised pro- rata to adjust the HBC fraction of HBV+HCV caused liver cancer by country/region group to the IARC estimates shown in Table 8.2. We also revised the “other” category downwards to the proportions estimated in GBD2013, shifting the excess deaths to HBV and HCV. This resulted in an overall estimate of the fraction of liver cancer attributable to hepatitis (HBV or HCV) similar to the IARC estimates. Cirrhosis death attributions were similarly adjusted drawing on the HCV/HBV proportions estimated for liver cancer.
8.7 Schistosomiasis Case fatality rates of 0.0075% for S. mansoni, 0.015% for S. haematobium were applied to the prevalence rates estimated by GBD 2013 (44) to revise the estimates of schistosomiasis deaths for GHE2015. Death rates were projected forwards to 2016. This resulted in an estimate of 21,151 deaths in sub-Saharan Africa and 24,068 deaths globally in 2016.
8.8 Cycsticercosis, echinococcosis and food-borne trematodes
In 2007, the World Health Organization (WHO) established the Foodborne Disease Burden Epidemiology Reference Group (FERG) to estimate global and regional burdens of foodborne disease. Included among the parasitic foodborne diseases analysed were cysticercosis, echinococcis, and food-borne trematodosis. In 2015, the FERG published regional and global estimates of deaths and DALYs for these diseases for the year 2010 (45, 46). The GBD2016 time series estimates of deaths for these three diseases were scaled to match the underlying FERG estimates of deaths by country in 2010.
8.9 Rabies For all countries except China and India, GHE2015 estimates of rabies deaths were projected forward one year to 2016 assuming an average annual rate of decline of 4% based on the global trend for years 2010-2015. Total rabies deaths for years 2000-2014 for China were based on reported human rabies deaths from the Chinese Center for Disease Control and Prevention (47, 48) and projected forward using the recent trend for 2010-2014. Rabies deaths for India were revised based on the reported deaths in the Indian SRS data for years 2001-2003 and 2010-2013 (see Section 7).
8.10 Ebola Deaths directly resulting from Ebola virus infection in 2014 and 2015 in Liberia, Sierra Leone and Guinea were estimated using the “medium” scenario estimates of Helleringer and Noymer (49). They estimated Ebola deaths for three scenarios as follows: a “low” scenario where they consider that no cases went unrecorded, and a high scenario where they consider that there 2.5 times more cases than recorded. The medium scenario considers 70% more cases than recorded. There have been new estimates recently that suggest that there could be up to 3.5 times more cases than recorded, but these were focused on a small locality, so Helleringer and Noymer did not extend the range all the way to 3.5.
The Ebola outbreak overwhelmed the healthcare systems of Guinea, Liberia, and Sierra Leone, reducing access to health services for diagnosis and treatment for the major diseases that are endemic to the region: malaria, HIV/AIDS, and tuberculosis. Parpia et al. (50) modelled the impact of reduced access to health services on the mortality rates for these three diseases. We took their modelled impact of a 50% reduction in treatment coverage to estimate the additional deaths for malaria (under 5), HIV( ages 15 +) and tuberculosis (all ages). Their estimates related to March 2014 to March 2015, and we assumed the coverage collapse would have covered half a year in 2014 and half a year in 2015. For Liberia, there were very few Ebola deaths in 2015 compared to 2014, so we reduced the coverage collapse to 1/3 of 2015.
World Health Organization Page 30
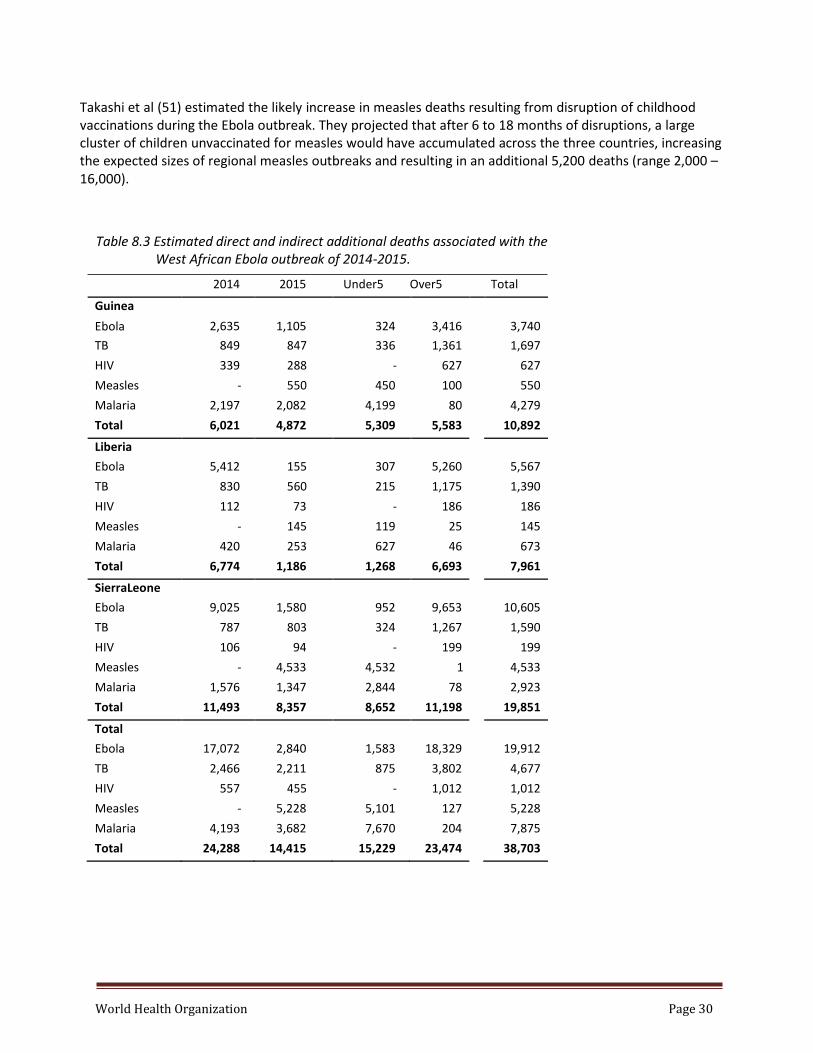
Takashi et al (51) estimated the likely increase in measles deaths resulting from disruption of childhood vaccinations during the Ebola outbreak. They projected that after 6 to 18 months of disruptions, a large cluster of children unvaccinated for measles would have accumulated across the three countries, increasing the expected sizes of regional measles outbreaks and resulting in an additional 5,200 deaths (range 2,000 – 16,000).
Table 8.3 Estimated direct and indirect additional deaths associated with the West African Ebola outbreak of 2014-2015.
2014 2015 Under5 Over5 Total
Guinea
Ebola
2,635
1,105
324
3,416
3,740
TB 849 847 336 1,361 1,697
HIV 339 288 - 627 627
Measles - 550 450 100 550
Malaria 2,197 2,082 4,199 80 4,279
Total 6,021 4,872 5,309 5,583 10,892
Liberia Ebola 5,412 155 307 5,260 5,567
TB 830 560 215 1,175 1,390
HIV 112 73 - 186 186
Measles - 145 119 25 145
Malaria 420 253 627 46 673
Total 6,774 1,186 1,268 6,693 7,961
SierraLeone Ebola 9,025 1,580 952 9,653 10,605
TB 787 803 324 1,267 1,590
HIV 106 94 - 199 199
Measles - 4,533 4,532 1 4,533
Malaria 1,576 1,347 2,844 78 2,923
Total 11,493 8,357 8,652 11,198 19,851
Total Ebola 17,072 2,840 1,583 18,329 19,912
TB 2,466 2,211 875 3,802 4,677
HIV 557 455 - 1,012 1,012
Measles - 5,228 5,101 127 5,228
Malaria 4,193 3,682 7,670 204 7,875
Total 24,288 14,415 15,229 23,474 38,703
World Health Organization Page 31
Data reported to WHO from the case-based measles surveillance systems for all three countries to 31 March 2016 confirmed that there were outbreaks of measles in 2015 in all three countries, although it is likely that reported cases do not accurately reflect the magnitude of the outbreaks. We conservatively adjusted the 2015 measles deaths to include outbreaks of the same magnitude as those estimated for 2014 for deaths under age 5, and to increase the 2015 deaths over age 5 so they were 10% higher than those in 2014.
We explored options for estimating other impacts of health system collapse during the Ebola epidemic, but decided to limit the estimates to those outlined above, for two reasons. First, the impact on HIV, TB, malaria and measles may be higher because of the direct impact on interventions with a big effect on mortality (ART, DOTs, antimalarials, vaccination) and second, it’s not clear that there would have been much pre-Ebola health system impact on other causes (particularly for adults).
The estimated direct and indirect mortality impacts of the Ebola epidemic, included in GHE2016, are summarized in Table 8.3.
8.11 Maternal causes of death Country-specific estimates for maternal mortality were based on the most recent Interagency estimates for years 2000-2015 (52). A multilevel regression model for the proportion of total female deaths in the age range 15-49 that were due to maternal causes (PM) was developed using available national-level data from surveys, censuses, surveillance systems and death registration data.
Because the WHO life tables, and hence the total female deaths in the maternal age range, have been revised, the interagency PM estimates have been applied to the new envelopes to estimate numbers of maternal deaths. This has resulted in changes in the estimates of maternal deaths for a some countries although regional and global totals have changed little.
Note that the maternal mortality estimates include those HIV deaths occurring in pregnant women or within 42 days of end of pregnancy which were considered to be indirect maternal deaths rather than incidental. These HIV maternal deaths were subtracted from total HIV deaths as estimated by UNAIDS.
8.12 Cancers Cause-specific estimates for cancer deaths in 2012 were derived from Globocan 2012 (53). For countries without useable death registration data, site-specific deaths were projected back to year 2000 and forward to 2016 using trend estimates from the GBD2016. For countries with useable death registration data, cancer deaths by site were estimated from the death registration data directly with the various adjustments and redistributions described in Section 4.
Karposi sarcoma was excluded from the Globocan estimates as this is almost entirely a manifestation of HIV/AIDS, already included in the estimates for HIV/AIDS deaths.
8.13 Alcohol use and drug use disorders The injury codes for accidental poisoning by alcohol and by opioids are now used to code acute intoxication deaths from alcohol and acute overdose deaths by opioids. These deaths have been remapped to alcohol use disorders and drug use disorders respectively (see Annex Table A). This mapping is complicated by the need to distribute the accidental poisoning category for “other and unspecified chemicals and noxious substances” (X49) to the specific categories for alcohol and drug use disorders (opioids, cocaine, amphetamines, cannabis and “other drugs”) and to accidental poisoning (non-drug and non-alcohol). Additionally, there is a category F19 in the mental health chapter for “multiple drug use and unspecified drug use disorders” which is used to code deaths in some countries and also must be redistributed appropriately.
World Health Organization Page 32
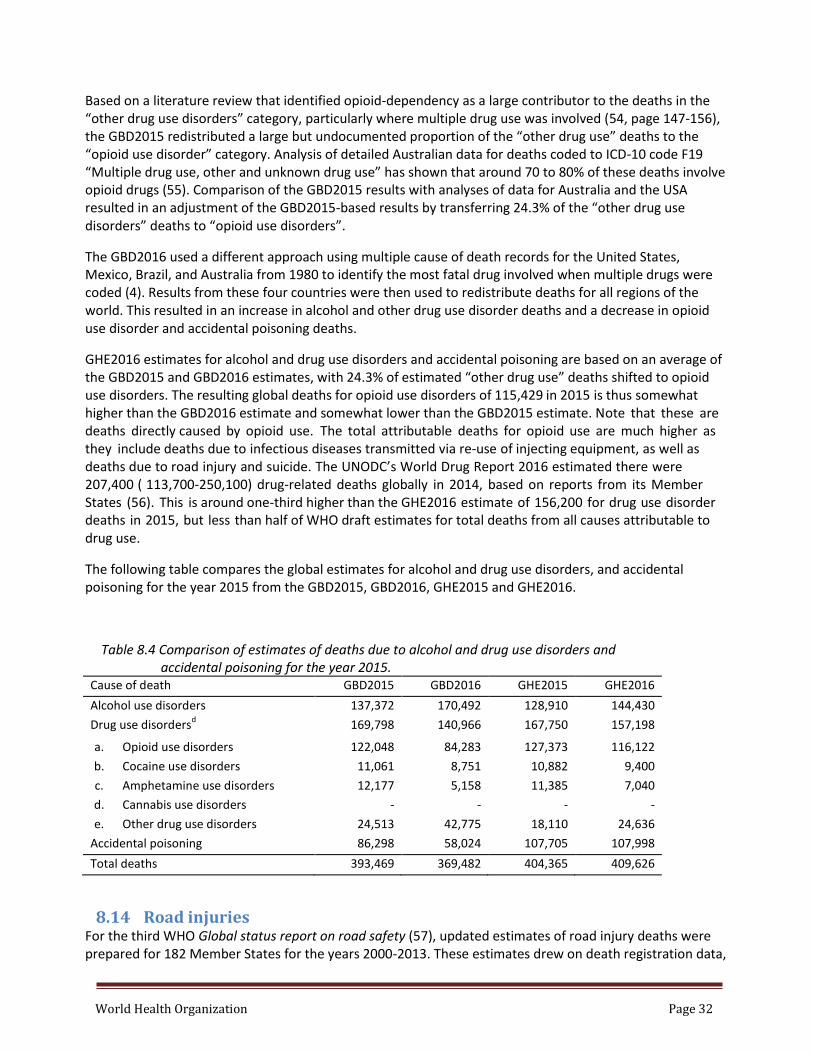
Based on a literature review that identified opioid-dependency as a large contributor to the deaths in the “other drug use disorders” category, particularly where multiple drug use was involved (54, page 147-156), the GBD2015 redistributed a large but undocumented proportion of the “other drug use” deaths to the “opioid use disorder” category. Analysis of detailed Australian data for deaths coded to ICD-10 code F19 “Multiple drug use, other and unknown drug use” has shown that around 70 to 80% of these deaths involve opioid drugs (55). Comparison of the GBD2015 results with analyses of data for Australia and the USA resulted in an adjustment of the GBD2015-based results by transferring 24.3% of the “other drug use disorders” deaths to “opioid use disorders”.
The GBD2016 used a different approach using multiple cause of death records for the United States, Mexico, Brazil, and Australia from 1980 to identify the most fatal drug involved when multiple drugs were coded (4). Results from these four countries were then used to redistribute deaths for all regions of the world. This resulted in an increase in alcohol and other drug use disorder deaths and a decrease in opioid use disorder and accidental poisoning deaths.
GHE2016 estimates for alcohol and drug use disorders and accidental poisoning are based on an average of the GBD2015 and GBD2016 estimates, with 24.3% of estimated “other drug use” deaths shifted to opioid use disorders. The resulting global deaths for opioid use disorders of 115,429 in 2015 is thus somewhat higher than the GBD2016 estimate and somewhat lower than the GBD2015 estimate. Note that these are deaths directly caused by opioid use. The total attributable deaths for opioid use are much higher as they include deaths due to infectious diseases transmitted via re-use of injecting equipment, as well as deaths due to road injury and suicide. The UNODC’s World Drug Report 2016 estimated there were 207,400 ( 113,700-250,100) drug-related deaths globally in 2014, based on reports from its Member States (56). This is around one-third higher than the GHE2016 estimate of 156,200 for drug use disorder deaths in 2015, but less than half of WHO draft estimates for total deaths from all causes attributable to drug use.
The following table compares the global estimates for alcohol and drug use disorders, and accidental poisoning for the year 2015 from the GBD2015, GBD2016, GHE2015 and GHE2016.
Table 8.4 Comparison of estimates of deaths due to alcohol and drug use disorders and accidental poisoning for the year 2015.
Cause of death GBD2015 GBD2016 GHE2015 GHE2016
Alcohol use disorders 137,372 170,492 128,910 144,430
Drug use disordersd
169,798 140,966 167,750 157,198
a. Opioid use disorders 122,048 84,283 127,373 116,122
b. Cocaine use disorders 11,061 8,751 10,882 9,400
c. Amphetamine use disorders 12,177 5,158 11,385 7,040
d. Cannabis use disorders - - - -
e. Other drug use disorders 24,513 42,775 18,110 24,636
8.14 Road injuries For the third WHO Global status report on road safety (57), updated estimates of road injury deaths were prepared for 182 Member States for the years 2000-2013. These estimates drew on death registration data,
World Health Organization Page 33
on reported road traffic deaths from official road traffic surveillance systems (collected in a WHO survey of Member States for the report), and on a revised regression model for countries without useable death registration data.
Road injury deaths were projected forward to 2016 using recent trends in death registration data where available, or the trend for recent years to 2016 from the GBD2016. Road injury deaths for Libya reported in the third WHO Global status report on road safety were considerably higher than for any other country (based on country-reported surveillance data) and were revised downwards using the road injury regression model estimates predicted for Libya from relevant covariates such as vehicle ownership.
8.15 Homicide Updated estimates of homicide deaths for WHO Member States were published by WHO for years 2000-2012 in the Global status report on violence prevention 2014 (58). These were projected forward to 2016 using recent trends in death registration data where available, or the trend for recent years to 2016 from the GBD2016. Most recent reported police data from the UNODC (59) were also used to update the level and trend for homicide deaths in Honduras.
8.16 Natural disasters Estimated deaths for major natural disasters were obtained from the EM-DAT/CRED International Disaster Database (60). These data were used to adjust age-sex specific total as described in an earlier Technical Paper (9).
8.17 Conflict Country-specific estimates of war and conflict deaths were updated for the entire period 1990-2016 using revised methods documented previously which draw on information on conflict intensity, time trends, and mortality obtained from a number of war mortality databases (9). Battle-Related Deaths Dataset (version 17.1), Non-State Conflict Dataset (version 17.1), and One-sided Violence Dataset (version 17.1) from 1989 to 2016 (61). Using these three datasets, instead of focusing solely on battle-related deaths, reduces the likelihood that overall direct conflict deaths are underestimated. However, it is likely that a degree of undercounting still occurs in the count-based datasets, and a revised adjustment factor of 1.91 is applied to the annual battle death main estimates for state-state conflicts (9). No adjustments were applied to estimated conflict deaths (main estimates) for non-state conflict deaths, and one-sided violence. Note that the application of a single adjustment factor for all state-state conflicts may result in deaths for specific conflicts being over- or under-estimated. For the following countries, the multiplier was adjusted downwards for low intensity years: Mexico (drug gangs), DR Congo, Columbia, Eritrea/Ethiopia (1990-2000). For these conflicts, estimated deaths from other sources suggest that UCDP figures provide reasonable estimates without additional adjustment.
For several conflicts where more specific sources of information are available, these have been used to revise estimated deaths:
Afghanistan Deaths for international forces involved in conflict in Afghanistan (62) were attributed to the country of origin of the international forces and subtracted from total UCDP-estimated conflict deaths in Afghanistan.
Iraq The conflict death toll in Iraq following the US-led invasion in March 2003 has been the subject of much discussion with estimates for violent deaths to end June 2006 ranging from 47,668 (63) to 601,027 in a 2006 household survey (64). The Iraq Family Health Survey (IFHS), conducted in 2006-2007 by relevant Iraq Government Ministries in
World Health Organization Page 34
collaboration with WHO, provided new evidence on mortality in Iraq for the three years post-invasion (26). Latest counts of reported deaths in Iraq by the Iraq Body Count (63) were compared with conflict deaths for the period 2003-2006 estimated from the Iraq Family Health Survey 2006 (65). Calendar year adjustment factors for under-reporting in the Iraq Body Count data ranged from 3.3 (2003) and 3.4 (2004) to 2.3 (2006) and 2.2 (2007). An average adjustment factor of 2.2 was applied to Iraq Body Count data for more recent years to derive a time series of estimated total conflict deaths in Iraq from 2003 to 2016.
West Bank and Gaza Strip. Estimates of conflict deaths in Israel and in West Bank and Gaza Strip were derived from statistics published by the Office for the Coordination of Humanitarian Affairs (OCHA) - Occupied Palestinian Territory (OPT) (66) and the Israeli Center for Human Rights in the Occupied Territories (67).
Philippines Large numbers of police and extra-judicial killings have taken place in the Philippines since 1 July 2016 in the so-called “Philippines Drug War”, with Human Rights Watch estimating that more than 7,000 deaths have occurred to end February 2017 (68). According to government in December 2016 said that there had been 3,116 police killings and 2,091 extrajudicial killings, implying a total 5,207 deaths from 1 July 2016 to to 6 June 2017 (69). Based on an average of the government estimates and those of Human Rights Watch, we estimated a total 3,509 deaths in 2016 (uncertainty range 2350 to 5333).
Syria For Syria, previous GHE2015 estimates of conflict mortality from 2011 onwards were based on UN estimates of overall conflict deaths by month and age distribution of deaths (70, 71), as well as estimates by various human rights organizations (72, 73). For this update, data from the Syrian Observatory for Human Rights (74) were used. They estimated annual documented deaths for pro- and anti-government forces, and for civilians by year from 2011 to present, totalling 319,245 deaths to end March 2017. They also estimated another 125,360 undocumented deaths for this period. We estimated annual total deaths assuming the undocumented deaths were distributed across years pro-rata according to documented deaths. There are an estimated 476, 696 total deaths for the 2011-2017 period, assuming that the numbers of deaths in 2017 are four times the total for January to March 2017. This total lies between the UCDP unadjusted total of 277,550 (2017 deaths imputed using the trend from SOHR) and the battle-field adjusted total of 508,318.
Yemen A November 2016 report by the UN Office for the Coordination of Humanitarian Affairs (UHOCHA) estimated that more than 19 months of conflict have killed or injured nearly 44,000 people, including nearly 7,100 deaths, and forced more than 3 million people from their homes (75). These figures almost certainly understate the true extent of civilian casualties due to limited reporting mechanisms. A more recent UNOCHA statement to the UN Security Council estimated that 7,469 Yemenis had been killed by 31 December 2016 and 40,483 injured (76). This was based on reporting by health facilities that were still functioning, estimated at 45% of all health facilities (these have been targeted by parties to the conflict). Inflating upward by a factor of 1/0.45 gives a total of 16,598 deaths for 2015-2016. This is arguably conservative, since facilities are more likely to be functioning outside high conflict zones. The battlefield-adjusted total from UCDP is very similar at 17,616 deaths for 2015-2016 and the UCDP-adjusted annual estimates have been used.
Deaths due to landmines and unexploded ordinance were estimated separately by country (77). Deaths
World Health Organization Page 35
from terrorist events were separately estimated for many countries without ongoing general conflict using data from the Global Terrorism Database (78) for years 1992-2015 supplemented by summarized data based on fatality reports for 2016 and January to May 2017 (79, 80). This database and particularly the supplementary data for 2016 and 2017 include many deaths which would also be included in the UCDP estimates. To avoid double counting, terrorism deaths from these sources were not added to conflict deaths for the following countries: Afghanistan, Iraq (2003+), Israel, Nigeria, Pakistan, West Bank and Gaza Strip. For other country-years, any excess terrorism deaths above 50% of the UCDP-adjusted total deaths were added to the UCDP-adjusted total deaths.
Legal execution deaths are included in this cause category for GHE2016. Estimated execution deaths were added for the main countries using capital punishment regularly (China, Iran, Iraq, DPR Korea, Saudi Arabia, USA and Yemen), from Amnesty International reports (81,82) and UN Human Rights Reports (83).
Age-sex distributions for conflict deaths were revised based on available distributions of conflict deaths by age and sex for specific conflicts and on age-patterns for certain country-periods with high conflict deaths included in the WPP2015 life tables (9).
World Health Organization Page 36
9 Other causes of death for countries without useable data The Institute for Health Metrics and Evaluation (IHME) has developed covariate based estimation models for a large number of single causes as inputs to its overall estimation of numbers of deaths by country, cause, age and sex (84). For this update of WHO Global Health Estimates for 2000-2016, we have similarly drawn on updated IHME single-cause analyses for the GBD2016 study (4), as described below.
To ensure that the results of all the single-cause models summed to the all-cause mortality estimate for each age-sex-country-year group, IHME applied a final step called CoDCorrect to rescale the cause-specific estimates. This was done using repeated random draws from the uncertainty distributions of each single cause and from the all-cause envelope, and proportionately rescaling each single cause estimate so they collectively summed to the envelope estimate. The overall effect is to “squeeze” or “expand” causes with wider uncertainty ranges more than those with narrower uncertainty ranges.
GBD 2016 results, post-CoDCorrect, were used as inputs to estimate cause fractions by country, age, sex and year for causes of death at ages five years and above for which death registration data and/or WHO and UN Interagency analyses (described in Section 5) were not available. For this set of causes, GBD 2016 country-level estimates for death rates at ages 5 and over for years 2000-2016 were used. For each year 2000 to 2015, cause fraction distributions were then computed for the set of causes excluding WHO/Interagency cause-specific estimates. For countries where these cause fractions were used, they were applied to the country-level residual mortality envelopes by age and sex after the WHO/Interagency cause-specific estimates were subtracted from the WHO all-cause envelopes.
GBD2016 results, post-CoDCorrect, were used as inputs to estimate cause fractions by country, age, sex and year for causes of death at ages five years and above for which death registration data and/or WHO and UN Interagency analyses (described in Sections 4 to 8) were not available. IHME results for priority causes such as HIV, TB, malaria, cancers, maternal mortality, child mortality differ to varying degrees from those of WHO and UN agency partners. In part, this reflects differences in modelling strategies, but also the inclusion by IHME of data from verbal autopsy (VA) studies which has been mapped to ICD categories using IHME-developed computer algorithms. As was done for GBD2015, we carried out a “GHECorrect process to ensure that cause fractions across all causes added to 1 by age, sex, country and year, meaning that estimated numbers of deaths added across causes to the estimated total deaths by age, sex, country and year. This is described in more detail in the GHE2015 technical paper (2).
The overall process of preparing the “prior” set of estimates for all countries for years 2000-2016 for the complete GHE cause list ensuring that inputs from WHO/UN sources and GBD2016 were consistent with the WHO all-cause envelopes is summarized in Figure 9.1. These “prior” estimates were used “as is” for causes of death at ages 5 and over for countries without death registration data meeting inclusion criteria, and also provided inputs to the preparation of GHE2016 estimates for India, under 5 deaths and inputs for specific detailed cause breakdowns for certain cause groups for countries with death registration data.
World Health Organization Page 37
Figure 9.1 Overview of the processes involved in the preparation of the GHE2016 “prior” estimates for all countries. Refer also to Figure 1.1 for further steps involved in the inclusion of this dataset in the final GHE2016 estimates.
9.1 Other adjustments for specific causes in certain countries
Based on the GBD2016 inputs, there were also a number of extreme outliers for specific causes in some countries. These were adjusted as follows:
• Deaths due to meningitis and encephalitis in Nepal and Bhutan were revised downwards by a factor based on the ratio of GBD2016 estimated death rate to that for India applied to the GHE2016 revised meningitis and encephalitis deaths derived from the Indian SRS data.
• Chronic respiratory disease deaths for Papua New Guinea were revised downwards to a level 20%
above the average for Vanuatu, Micronesia and Fiji. They were also revised downwards for Lesotho and Nepal by factors of 10% and 20% respectively.
• Dementia deaths in Myanmar were revised downward by 50%. • Skin disease deaths were revised downwards in Bahrein based on the average of the death rates for
United Arab Emirates, Kuwait, Oman, Qatar and Saudi Arabia. • Endocrine disease death rates were adjusted downwards in Tajikistan using GBD2013-based
rates, which are similar to those for Afghanistan and Pakistan in GBD2015. • GBD2016 death rates for chronic respiratory diseases in Montenegro were extremely low, unlike those
in the surrounding countries (Serbia, Bosnia and Herzegovina, Croatia, Albania, and the Former Yugoslav Republic of Macedonia). In contrast, both smoking rates and air pollution levels were similar for Montenegro and these countries. The CRD death rates for Montenegro were adjusted to match
WHO all-cause envelopes
Mortality shocks (conflict, disasters,
ebola)
Remove HIV and shocks
HIV-free and shock-free envelopes
WHO revisions to HIV estimates for high HIV countries
UNAIDS/WHO estimates for HIV
GHECorrect adjust causes to sum
to envelopes
Adjusted GBD2016 inputs
WHO/Interagency cause-specific
estimates
GHE2016 initial
estimates
Tuberculosis
Malaria
Child causes
Foodborne
Maternal causes
Cancers
Road injury
Homicide
Revise hepatitis fractions for liver
cancer and cirrhosis
Adjust other drug deaths
Correct selected outlier values
GBD 2016 estimates of numbers of
deaths 2000-2016
Review estimates for
quality
Shapes and colours
Input data
Process
Results
WHO/UN Interagency
GBD 2016 study
GHE - Global health estimates
World Health Organization Page 38
those of Serbia. • Outlier poisoning deaths in Chad and Burundi were adjusted downwards by 35% and 25%
respectively. • Estimates of suicide deaths were adjusted for Sri Lanka to match time series data provided during
consultation from police statistics.
10 Uncertainty of estimates Many of the inputs to the GHE2016 estimates have explicit uncertainty ranges. However, there are some exceptions: WHO life tables are based on the UN Population Division’s World Population Prospects 2017 life tables and these do not yet have explicit uncertainty ranges estimated. Additionally, there are some specific cause inputs from WHO and UN sources which do not yet estimate quantitative uncertainty ranges. Given the challenges associated with calculating coherent quantitative uncertainty intervals with the available input data, guidance to users on the quality of underlying death registration data is available together with country estimates, using methods described below (section 10.2). In addition, quantitative uncertainty ranges are available as part of the comprehensive GHE2016 estimates dataset on the WHO website. Methods for these uncertainty ranges, as well as an overview of the quality of the uncertainty analysis, were described in the previous Technical Paper (2) and are based on quantitative 95% uncertainty rates for cause-specific WHO/UN estimates together with 95% uncertainty ranges for other causes based on the broad variations of uncertainty in the GBD2015 estimates across cause categories and countries, with the latter grouped by data sources and methods.
These uncertainty intervals do not include all sources of uncertainty, and may not fully reflect uncertainty arising from differences in WHO/UN and IHME approaches to estimation for specific causes or countries. However, they do provide some minimal guidance to avoid over-interpretation of differences in death rates across causes or countries. In particular, care should be taken not to over- interpret detailed rankings of deaths by cause or country.
10.1 Guidance on underlying data quality
General guidance on the level of evidence available for death estimates is based on the quality of death registration data available in the WHO Mortality Database. Countries are classified into five levels, with descending quality of death registration data, as described in Table 10.1. Classification is based on three characteristics:
Table 10.1 Criteria for classification of countries by quality of death registration data Category Color Countries reporting data by ICD code Countries reporting data with a short cause list
High Green Average usability for all available years from 2007 of data by ICD code ≥ 80% and at least 5 years’ data available from 2007
N/A
Medium Light yellow Average usability for all available years from 2007 of data available by ICD code ≥ 60% and at least 5 years’ data available from 2007
Average usability for all available years from 2007 ≥ 80% and at least 5 years’ data available from 2007
Low Dark yellow Average usability for all available years from 2007 of data available by ICD code ≥ 40%
Average usability for all available years from 2007 ≥ 60%
Very low Light pink No/unusable death registration data -Low HIV country
Very low Dark pink No/unusable death registration data -High HIV country
World Health Organization Page 39
1. whether the data are reported by ICD code or with a summarized cause list, 2. the number of years of data available in the WHO mortality database, and 3. the average usability of the available data in the period 2007-present.
Usability is calculated as the product of the proportion of deaths assigned to a set of ill-defined cause of death codes (Table 4.2 in reference (2)) and 100 less the percentage completeness. Because it is not possible to obtain the full number of deaths assigned to ill-defined causes of death when countries report death registration data using a summarized cause list, a more stringent set of usability cutoffs were defined for these countries.
The following guidance to users is provided together with the country data download:
Multiple years of national death registration data with high completeness and quality of cause-of-death assignment are available. Estimates for these countries may be compared and time series may be used for priority setting and policy evaluation.
Multiple years of death registration data are available. Data have low completeness and/or issues with cause-of-death assignment which likely affect estimated deaths by cause and time trends. Estimates may be used for priority setting. Use estimates for programme evaluation with caution, as improvements in the vital registration system may affect the estimated trends in cause-specific mortality. Comparisons among countries should be interpreted with caution. Light yellow denotes moderate quality issues and dark yellow denotes severe quality issues.
Death registration data are unavailable or unusable due to quality issues. Estimates of mortality by cause should be interpreted with caution. Estimates may be used for priority setting, however, they are not likely to be informative for policy evaluation or comparisons among countries. Dark pink denotes countries with high HIV prevalence.
11 Conclusions GHE2016 presents results for 183 WHO Member States, encompassing all those with a population of 90,000 or greater in 2015. The GHE2016 estimates of causes of death by country, region and world for years 2000-2016 confirm and expand previous WHO analyses of global health trends and improvements. In particular, these GHE2016 estimates of trends and levels of mortality by cause will contribute to WHO and UN monitoring and reporting of the health SDG goal and targets.
WHO’s adoption of health estimates is affected by a number of factors, including a country consultation process for country-level health estimates, existing multi-agency and expert group collaborative mechanisms, and compliance with standards around reporting data and methods. More detailed information on quality of data sources and methods, as well as estimated uncertainty intervals, is provided in in this document and in other referenced sources. As required by the GATHER guidelines (5), documentation of data inputs, methods, and results, including uncertainty, has improved (Annex C provides the location of each GATHER reporting item).
The type and complexity of models used for global health estimates varies widely by research/institutional group and health estimate. More complex models are necessary to generate more accurate uncertainty intervals. As expected, these require greater researcher expertise and time and computational resources to run. Where data are available and of high quality, estimates from different institutions are generally in agreement. Discrepancies are more likely to arise for countries where data are poor and for conditions where data are
World Health Organization Page 40
sparse and potentially biased. This is best addressed through improving the primary data.
Country health information systems, including vital registration, need to be strengthened as a matter of priority, in order to provide a more solid empirical basis for monitoring health situation and trends. Such data are also crucial for Member States’ monitoring of national and sub-national trends in order to respond to the changing needs of their populations.
To improve monitoring of mortality, morbidity and risk factors health information systems should focus on strengthening:
• Death registration through civil registration and vital statistics systems (CRVS), local health and demographic studies and other sources;
• Cause of death data collection through vital registration and verbal autopsy in communities; • Regular household health surveys that include biological and clinical data collection; and • Complete facility recording and reporting with regular quality control.
11.1 Reasons for changes in GHE estimates in this revision
As with previous revisions of WHO GHE and specific-cause time series estimates, GHE2016 provides an update for the entire time series from 2000 to 2016 incorporating data sources and specific WHO/interagency and IHME estimates released since GHE2015. This time series supercedes previous GHE time series, and differences between revision series should not be interpreted as time trends.
Major causes of significant changes in estimates or trends for individual countries or for specific causes at country, regional or global level include the following:
• The revision of WHO life table time series for Member States to align with the UN WPP2017 life table time series (6). This resulted in changes for some countries, and also for some high HIV countries due to significant changes in UN WPP and UNAIDS modelling of the HIV epidemics in these countries.
• Revision of maternal mortality estimates to take account of revisions to all-cause mortality envelopes in the reproductive age range 15-49 years.
• Use of the recently published GBD 2016 study for GHE2016. There were substantial changes in GBD 2016 estimates for some causes and countries compared to the previous GBD 2015 estimates used for GHE2015.
• Improvements to the GHECorrect process (Section 9.2) used to ensure that cause-specific estimates summed to WHO all-cause mortality estimates derived from WHO life tables.
• Improvements in the availability of death registration data for many countries. • Use of GBD2016 prior estimates instead of death registration data for four countries which provide
data to WHO only using a shortlist of ICD code groups (Belarus, Kazakhstan, Russia, and Ukraine).
11.2 Limitations of GHE estimates
Here we highlight some broad cross-cutting limitations to the GHE mortality and cause of death analysis. Comparable information about death numbers and rates by age, sex, cause, year, and country provides important information for priority setting discussions and for monitoring and evaluating progress towards global health goals. Major limitations and challenges are summarized below.
• All-cause mortality estimates in countries without well-functioning death registration systems relies heavily on census and survey data sources (particularly sibling survival data) and the use of model life tables. There is not yet consensus on the methods for analyzing sibling survival data or assessing
World Health Organization Page 41
levels of under-reporting of deaths in surveys or censuses.
• Demographic methods for the assessment of completeness of death registration all involve strong assumptions or information about migration and are prone to error resulting from age mis-statement in registration or census data, and to differential completeness of successive censuses.
• Estimation of HIV mortality relies on imputation of deaths from seroprevalence data using limited information on survival curves for HIV-positive persons not receiving or receiving anti-retroviral treatment (ART), and on the coverage of ART in populations. This results in large uncertainty for countries with high prevalence of HIV, as disease progression rates may well vary across countries.
• Although death registration data is generally the best form of information available on causes of death, it has considerable limitations, even in well-functioning systems with medical certification of cause of death. The so-called garbage codes represent a substantial proportion of deaths in some countries, and methods for re-assigning these deaths to valid causes are highly uncertain and generally are not based on empirical data. The assignment of underlying cause of death is limited by the information provided on the death certificate and quite sensitive to the order in which diagnoses are written. For most causes of death, variability (due to differences in physician practice when certifying a death) in assignment of valid causes of underlying death has not been addressed to date. Additionally, some diseases and injuries have specific problems associated with difficulty in making causal judgments of underlying cause (eg. diabetes and heart disease, or Alzheimer’s disease and heart disease, drug or alcohol overdose). Finally, HIV and other stigmatized causes of death, such as suicide, are routinely miscoded; the miscoding rate varies by setting.
• For many countries without functioning death registration systems, particularly in Africa, there is strong reliance on verbal autopsy studies, most of which are not nationally representative samples. Until recently there has been considerable variation in verbal autopsy instruments, and in analysis and cause assignment methods. Validation studies are challenging, and difficult to generalize to other settings. The Indian SRS data included in the Million Death Study use a form of physician-assignment of underlying cause that may be subject to different biases and limitations than the statistical algorithms used in InterVA or Tariff analyses.
• The WHO GHE estimates bring together single cause analyses from a number of WHO departments, interagency collaborations, and other sources, together with estimates drawn from the GBD 2016 study. These estimates are updated on differing time tables, and using different methods and assumptions in some cases, and it is more difficult to ensure consistency across causes, than is the case for large comprehensive estimates such as GBD 2016 prepared by a single study group. In addition, separate preparation of estimates of total mortality and cause-specific mortality can lead to incompatible cause-specific and total mortality estimates. In some cases, WHO/UN estimates are prepared only for all-age deaths, and age patterns imputed from available sometimes limited evidence.
• Estimates of deaths associated with mortality shocks (mainly conflict and disasters, but also some epidemics) are highly uncertain, and age patterns are generally imputed from limited data for other shocks. Additionally, in countries without functioning death registration systems or high quality censuses, it is very difficult to take account of, and to estimate, indirect mortality associated with mortality shocks, with increases in non-injury mortality rates associated with disruption to health and other social systems.
• While the uncertainty estimates discussed in Section 10 provide some guidance on the limitations of interpretation of the results, it should be kept in mind that these estimates reflect a subset of sources of uncertainty, and true uncertainty is higher.
World Health Organization Page 60
References
(1) Global Health Estimates: Deaths by cause, age and sex, by country and by region, 2000-2012. Geneva: World Health Organization; 2014 (http://www.who.int/healthinfo/global_burden_disease/estimates_previous/en/ , accessed 16 December 2016).
(2) Global Health Estimates 2015: Deaths by cause, age and sex, by country and by region, 2000-2015. Geneva: World Health Organization; 2016. (http://www.who.int/healthinfo/global_burden_disease/en/ accessed 16 December 2016)
(3) International Classification of Diseases – 10th Revision. Geneva: World Health Organization; 1990. (4) Naghavi, m et al. Global, regional, and national age-sex specific mortality for 264 causes of death, 1980–
2016: a systematic analysis for the Global Burden of Disease Study 2016. The Lancet 2017; 390(10100): 1151-1210.
(5) The GATHER Working Group. Guidelines for Accurate and Transparent Health Estimates Reporting: the GATHER statement. Lancet 2016;388(10062):e19-e23.
(6) World Population Prospects: The 2017 Revision. DVD Edition. New York (NY): UnitedNations, Department of Economic and Social Affairs, Population Division; 2017 (http://esa.un.org/unpd/wpp/)
(7) WHO Mortality Database. Geneva: World Health Organization (http://www.who.int/healthinfo/mortality_data/en/)
(8) Levels & trends in child mortality: Report 2017. UNICEF, WHO, the World Bank, United Nations Population Division. New York: UNICEF on behalf of the UN Inter-agency Group for Child Mortality Estimation; 2017.
(9) WHO methods and data sources for life tables 1990-2016. Global Health Estimates Technical Paper WHO/HIS/IER/GHE/2018.2. Geneva: World Health Organization; 2018 (http://www.who.int/healthinfo/statistics/LT_method.pdf?ua=1 )
(10) World Health Organization. World Health Statistics 2017: Monitoring Health for the SDGs. Geneva: World Health organization; 2017.
(11) Institute for Health Metrics and Evaluation. Causes of death (COD) visualization. http://vizhub.healthdata.org/cod/
(12) Mathers CD, Lopez AD, Murray CJL, Ezzati M, Jamison DT. The burden of disease and mortality by condition: data, methods and results for 2001. Global burden of disease and risk factors. New York, Oxford University Press, 2006. p. 45–240.
(13) Ahern RM, Lozano R, Naghavi M, Foreman K, Gakidou E, Murray CJ. Improving the public health utility of global cardiovascular mortality data: the rise of ischemic heart disease. Population Health Metrics 2011;9(1):1.
(14) Stevens GA, King G, Shibuya K. Deaths from heart failure: using coarsened exact matching to correct cause-of- death statistics. Population Health Metrics 2010;8(1):1.
(15) UNAIDS (2017). UNAIDS Data 2017. Available at
http://www.unaids.org/sites/default/files/media_asset/20170720_Data_book_2017_en.pdf (accessed 5 December 2017)
(16) Trends in maternal mortality: 1990 to 2015. Geneva: World Health Organization on behalf of WHO, UNICEF, UNFPA, The World Bank and the United Nations Population Division; 2015.
(17) Australian Bureau of Statistics. Causes of Death, Australia, 2015. Complexities in the measurement of
Bowel Cancer in Australia, 2006. Available at: http://www.abs.gov.au/ausstats/[email protected]/Lookup/by%20Subject/3303.0~2015~Main%20Features~Complexities%20in%20the%20measurement%20of%20bowel%20cancer%20in%20Australia~7
(18) Liu L, Oza S, Hogan D, Chu Y, Perin J, Zhu J, Lawn JE, Cousens S, Mathers C, Black RE. Global, regional and national causes of child mortality in 2000-2015 – an updated systematic analysis with implications for
the Sustainable Development Goals. The Lancet, November 2016 doi: http://dx.doi.org/10.1016/S0140-6736(16)31593-8
(19) MCEE-WHO methods and data sources for child causes of death 2000-2016. Geneva: World Health Organization; 2018 (http://www.who.int/healthinfo/global_burden_disease/childcod_methods_2000_2016.pdf?ua=1, accessed 24 April 2018).
(20) Bassani DG, Kumar R, Awasthi S et al. Causes of neonatal and child mortality in India: a nationally representative mortality survey. Lancet, 2010;376(9755):1853-1860.
(21) China Ministry of Health-Unpublished tabulations -- Vital Registration System cause-of-death data submitted annually to WHO.
(22) 全国疾病监测系统死因监测数据集 [National Disease Surveillance System monitoring causes of death 2010]. Chinese Center for Disease Control and Prevention, Beijing, Military Medical Science Press, 2012, ISBN 978-7-80245-827-7.
(23) 中国疾病监测报告[Cause-of-death data from Chinese Disease Surveillance Points], China Ministry of Health, 2004-2009.
(24) China Centre for Disease Control and Prevention (CDC). Death Registration System -Unpublished tabulations for year 2013.
(25) Zhou M, Wang H, Zhu J, et al. Cause-specific mortality for 240 causes in China during 1990–2013: a systematic subnational analysis for the Global Burden of Disease Study 2013. Lancet 2016; 387: 251–72.
(26) GBD2015 Mortality and Causes of Death Collaborators. Global, regional, and national life expectancy, all-cause mortality, and cause-specific mortality for 249 causes of death, 1980–2015: a systematic analysis for the Global Burden of Disease Study 2015. Lancet 2016;388(10053):1459–1544.
(27) Registrar General of India. Causes of Death in India in 2001-2003. New Delhi, Registrar General of India, Government of India, 2009.
(28) Jha P, Gajalakshmi V, Gupta PC, Kumar R, Mony P, Dhingra N et al. Prospective study of one million deaths in India: rationale, design, and validation results. PLoS Med, 2006;3(2):e18.
(29) Aleksandrowicz L, Malhotra V, Dikshit R, Gupta P, Kumar R, Sheth J, Rathi S, Suraweera W, Miasnikof P, Jotkar R, Sinha D, Awasthi S, Bhatia P, Jha P. Performance criteria for verbal autopsy-based systems to estimate national causes of death: development and application to the Indian Million Death Study. BMC Medicine 2014, 12:21
(30) Registrar General of India and the Centre for Global Health Research. Causes of Death Statistics for India 2010-2013. A Joint Report of the Registrar General of India and the Centre for Global Health Research. Government of India Ministry of Home Affairs – Sample Registration System, 2015. (http://www.censusindia.gov.in/2011- common/Sample_Registration_System.html )
(31) World Health Organization. Global Tuberculosis Report 2017. Geneva, WHO, 2017. (32) World Health Organization. World Malaria Report 2017. Geneva, WHO, 2017. (33) Meek SR. Epidemiology of malaria in displaced Khmers on the Thai-Kampuchean border. Southeast Asian
J Trop Med Public Health, 1988;19(2):243-52. (34) Luxemburger C, Ricci F, Nosten F, Raimond D, Bathet S, White NJ. The epidemiology of severe malaria in
an area of low transmission in Thailand. Trans R Soc Trop Med Hyg, 1997;91(3):256-62. Epub 1997/05/01. (35) Alles HK, Mendis KN, Carter R. Malaria mortality rates in South Asia and in Africa: implications for
malaria control. Parasitol Today, 1998;14(9):369-75. (36) Douglas NM, Pontororing GJ, Lampah DA, Yeo TW, Kenangalem E, Poespoprodjo J, et al. Mortality
attributable to Plasmodium vivax malaria: a clinical audit from Papua, Indonesia. BMC Med. 2014;12(1):217.
(37) World Health Organization. World Malaria Report 2008. Geneva, World Health Organization, 2008. (38) Final Report: Global Pertussis Burden Expert Elicitation. 2011. Geneva, World Health Organization; 2011. (39) Simons E, Ferrari M, Fricks J, Wannemuehler K, Anand A, Burton A, et al. Assessment of the 2010 global
measles mortality reduction goal: results from a model of surveillance data. Lancet, 2012, 379(9832):2173-
8. (40) Dabbagh A, Patel MK, Dumolard L, et al.. Progress towards regional measles elimintation, worldwide,
2000-2016. Weekly Epidemiological Record. 2017; 43(92):649-660. (41) de Martel C, Maucort-Boulch D, Plummer M, Franceschi S. World-wide relative contribution of hepatitis
B and C viruses in hepatocellular carcinoma. Hepatology 2015;62:1190-200. (42) International Agency for Research on Cancer (2016). HCC cases attributable to HBV or HCV by
region. Unpublished estimates, Lyon: IARC. (43) Perz JF, Armstrong GL, Farrington LA, Hutin YJ, Bell BP. The contribution of hepatitis B virus and hepatitis
C virus infections to cirrhosis and primary liver cancer worldwide. J Hepatol. 2006; 45:529–38. (44) Global Burden of Disease Study 2013 Collaborators. Global, regional, and national incidence, prevalence,
and years lived with disability for 301 acute and chronic diseases and injuries in 188 countries, 1990–2013: a systematic analysis for the Global Burden of Disease Study 2013. Lancet 2015; 386: 743–800.
(45) World Health Organization. WHO Estimates of the Global Burden of Foodborne Diseases. Geneva, World Health Organization, 2015. Available at http://www.who.int/foodsafety/publications/foodborne_disease/fergreport/en/ (accessed 28 Aug 2016).
(46) Torgerson PR, Devleesschauwer B, Praet N, Speybroeck N, Willingham AL, et al. (2015) World Health Organization Estimates of the Global and Regional Disease Burden of 11 Foodborne Parasitic Diseases, 2010: A Data Synthesis. PLoS Med 12(12): e1001920. doi: 10.1371/journal.pmed.1001920
(47) Chinese Center for Disease Control and Prevention. CDC. Reported human rabies deaths 1950-2010. Chinese CDC: Beijing.
(48) Zhou H, Vong S, Liu K, et al. Human Rabies in China, 1960-2014: A Descriptive Epidemiological Study. Rupprecht CE, ed. PLoS Neglected Tropical Diseases. 2016;10(8):e0004874. doi:10.1371/journal.pntd.0004874.
(49) Helleringer S, Noymer A. Assessing the Direct Effects of the Ebola Outbreak on Life Expectancy in Liberia, Sierra Leone and Guinea. PLOS Currents Outbreaks. 2015 Feb 19 . Edition 1.
(50) Parpia AS, Ndeffo-Mbah ML, Wenzel NS, et al. Effects of Response to 2014–2015 Ebola Outbreak on Deaths from Malaria, HIV/AIDS, and Tuberculosis, West Africa. Emerging Infectious Diseases. 2016;22(3):433-441. doi:10.3201/eid2203.150977
(51) Takahashi S, Metcalf CJ, Ferrari MJ, Moss WJ, Truelove SA, Tatem AJ, Grenfell BT, Lessler J. Reduced vaccination and the risk of measles and other childhood infections post-Ebola. Science. 2015 Mar 13;347(6227):1240-2. doi:10.1126/science.aaa3438.
(52) WHO, UNICEF, UNFPA, The World Bank and the United Nations Population Division. Trends in maternal mortality: 1990 to 2015. Geneva: World Health Organization; 2015.
(53) Ferlay J, Soerjomataram I, Ervik M, Dikshit R, Eser S, Mathers C, Rebelo M, Parkin DM, Forman D, Bray, F. GLOBOCAN 2012 v1.0, Cancer Incidence and Mortality Worldwide: IARC CancerBase No. 11 [Internet]. Lyon, International Agency for Research on Cancer, 2013. Available at: http://globocan.iarc.fr (accessed 13 January 2014).
(54) GBD 2015 Mortality and Causes of Death Collaborators. Supplementary Appendix to Global, regional, and national life expectancy, all-cause mortality, and cause-specific mortality for 249 causes of death, 1980–2015: a systematic analysis for the Global Burden of Disease Study 2015. Lancet 2016; 388: 1459–544.
(55) Barker B, Degenhardt L. Accidental drug-induced deaths in Australia 1997-2001. NDARC Technical Report No.163. National Drug and Alcohol Research Centre, University of New South Wales, Sydney, 2003
(56) World Drug Report 2016. Vienna: United Nations Office on Drugs and Crime; 2016. (57) Global status report on road safety 2015. Geneva, World Health Organization; 2015. (58) Global status report on violence prevention 2014. Geneva, World Health Organization; 2014. (59) UNODC Data Portal. Homicide counts and rates (2000-2015). Available at https://data.unodc.org/ (60) CRED. EM-DAT: The CRED International Disaster Database. Belgium, Université Catholique de Louvain,
2017. (61) Allansson M, Melander E, Themnér L (2017) Organized violence, 1989-2016. Journal of Peace Research
54(4). (62) Iraq Coalition Casualty Count. Afghanistan coalition military deaths by year and nationality 2001-2017.
Available at: http://icasualties.org/OEF/ByYear.aspx (63) Iraq Body Count. Iraqi deaths from violence 2003–2017. Available at: http://www.iraqbodycount.org/ (64) Burnham G, Lafta R, Doocy S, Roberts L. Mortality after the 2003 invasion of Iraq: a cross-sectional cluster
sample survey. Lancet 2006; 368 (9545): 1421-28. (65) Iraq Family Health Survey Study Group. Violence-Related Mortality in Iraq from 2002 to 2006. N Engl J
Med, 2008, NEJMsa0707782. (66) Office for the Coordination of Humanitarian Affairs (OCHA) - Occupied Palestinian Territory (OPT).
http://www.ochaopt.org (67) B’Tselem – The Israeli Information Center for Human Rights in the Occupied Territories. Statistics on
injuries and deaths suffered by both sides in the conflict. http://www.btselem.org/statistics (68) Human Rights Watch. Philippines’ ‘War on Drugs’. Available at: https://www.hrw.org/tag/philippines-war-
drugs (accessed 3 June 2017). (69) Philippine Information Agency. #Realnumbersph. Available at: http://pia.gov.ph/realnumbers (accessed 13
June 2017). (70) Price M, Klingner and Ball 2013.Preliminary Statistical Analysis of Documentation of Killings in Syria. UN
OHCHR commissioned report, January 2013. Available at http://www.ohchr.org/Documents/Countries/SY/PreliminaryStatAnalysisKillingsInSyria.pdf (accessed 17 January 2014).
(71) UN Secretary General Ban Ki-moon. Statement by the Secretary-General on Fulfilling our Collective Responsibility on Syria. 12 Mar 2015. http://www.un.org/sg/statements/index.asp?nid=8457
(72) Syrian Observatory for Human Rights. 7 Feb 2015. http://www.syriahr.com/en/2015/02/about-2-millions-killed-and-wounded-in-47-months-and-it-is-still-not-enough/
(73) Wikipedia. Casualties of the Syrian Civil War. https://en.wikipedia.org/wiki/Casualties_of_the_Syrian_Civil_War (accessed 30 Nov 2015).
(74) Syrian Observatory for Human Rights. http://www.syriahr.com/en/?p=62760 (accessed 13 June 2017) (75) UN Office for the Coordination of Humanitarian Affairs, November 2016. Yemen 2017 Humanitarian Needs
Overview. Available at https://docs.unocha.org/sites/dms/Yemen/YEMEN%202017%20HNO_Final.pdf (accessed 14 June 2017).
(76) UN Office for the Coordination of Humanitarian Affairs. Under-Secretary-General for Humanitarian Affairs and Emergency Relief Coordinator, Stephen O’Brien Statement to the Security Council on Yemen, New York, 26 January 2017. Available at: http://reliefweb.int/report/yemen/under-secretary-general-humanitarian-affairs-and-emergency-relief-coordinator-11 (accessed 14 June 2017).
(77) International Campaign to Ban Landmines. Landmine monitor. Available at http://www.the-monitor.org/. (78) National Consortium for the Study of Terrorism and Responses to Terrorism. Global Terrorism Database
http://www.start.umd.edu/gtd/ (accessed 6 June 2017). (79) Wikipedia contributors, "List of terrorist incidents in 2016," Wikipedia, The Free Encyclopedia,
https://en.wikipedia.org/w/index.php?title=List_of_terrorist_incidents_in_2016&oldid=781977266 (accessed June 14, 2017).
(80) Wikipedia contributors, "List of terrorist incidents in 2017," Wikipedia, The Free Encyclopedia, https://en.wikipedia.org/w/index.php?title=List_of_terrorist_incidents_in_2017&oldid=784560926 (accessed June 14, 2017).
(81) Amnesty International. Deaths sentences and executions (annual reports). Available at https://www.amnesty.org/en/latest/research/ (accessed 14 June 2017).
(82) Amnesty International. China’s Deadly Secrets, 10 April 2017. Available at https://www.amnesty.org/en/documents/asa17/5849/2017/en/ (accessed 14 June 2017).
(83) Human Rights Watch. Death penalty webpages. Available at https://www.hrw.org/tag/death-penalty (accessed 14 June 2017).
1590 8. Other unintentional injuries Rest of V, W39, W44, W53-W64, W77-W99, X20-X32, X50-X59, Y40-Y86, Y88, Y89
1600 B. Intentional injuries X60-Y09, Y35-Y36, Y870, Y871
1610 1. Self-harm X60-X84, Y870
1620 2. Interpersonal violence X85-Y09, Y871
1630 3. Collective violence and legal intervention Y35-Y36
—, not available
a Deaths coded to “Symptoms, signs and ill-defined conditions” (R00-R94, R96-R99) are distributed proportionately to all causes within Group I
and Group II.
b For deaths under age 5, refer to classification in Annex Tables B.
c Cancer deaths coded to ICD categories for malignant neoplasms of other and unspecified sites including those whose point of origin cannot
be determined, and secondary and unspecified neoplasms (C76, C80, C97) were redistributed pro-rata across malignant neoplasm categories within each age–sex group, so that the category “Other malignant neoplasms” includes only malignant neoplasms of other specified sites.
d Deaths coded to F19 (Multiple and other drug use) and X44 (Accidental poisoning by other and unspecified drugs and medicines) have been
redistributed to the GHE drug categories as described in Section 6. Deaths coded to X49 (Accidental poisoning by other and unspecified chemicals) have been redistributed to GHE accidental poisoning and GHE opioid use disorders categories as described in Section 6.
e Ischaemic heart disease deaths may be miscoded to a number of so-called cardiovascular “garbage” codes. These include heart failure,
ventricular dysrhythmias, generalized atherosclerosis and ill-defined descriptions and complications of heart disease. Relevant ICD-10 codes are I46, I47.2, I49.0, I50, I51.4, I51.5, I51.6, I51.9 and I70.9.
f Injury deaths where the intent is not determined (Y10-Y34, Y872) are distributed proportionately to all causes below the group level for injuries.
g For countries with 3-digit ICD10 data, for “Road injury” use: V01-V04, V06, V09-V80, V87, V89 and V99. For countries with 4-digit ICD10
Annex Table B Groupings of countries, areas and territories used for global and regional tabulations
B.1 Global
Afghanistan, Albania, Algeria, Angola, Antigua and Barbuda, Argentina, Armenia, Australia, Austria, Azerbaijan, Bahamas, Bahrain, Bangladesh, Barbados, Belarus, Belgium, Belize, Benin, Bhutan, Bolivia (Plurinational State of), Bosnia and Herzegovina, Botswana, Brazil, Brunei Darussalam, Bulgaria, Burkina Faso, Burundi, Cabo Verde, Cambodia, Cameroon, Canada, Central African Republic, Chad, Chile, China; Taiwan, China; Colombia, Comoros, Congo, Costa Rica, Côte d'Ivoire, Croatia, Cuba, Cyprus, Czechia, Democratic People's Republic of Korea, Democratic Republic of the Congo, Denmark, Djibouti, Dominican Republic, Ecuador, Egypt, El Salvador, Equatorial Guinea, Eritrea, Estonia, Ethiopia, Fiji, Finland, France, Gabon, Gambia, Georgia, Germany, Ghana, Greece, Grenada, Guatemala, Guinea, Guinea-Bissau, Guyana, Haiti, Honduras, Hungary, Iceland, India, Indonesia, Iran (Islamic Republic of), Iraq, Ireland, Israel, Italy, Jamaica, Japan, Jordan, Kazakhstan, Kenya, Kiribati, Kuwait, Kyrgyzstan, Lao People's Democratic Republic, Latvia, Lebanon, Lesotho, Liberia, Libya, Lithuania, Luxembourg, Madagascar, Malawi, Malaysia, Maldives, Mali, Malta, Mauritania, Mauritius, Mexico, Micronesia (Federated States of), Mongolia, Montenegro, Morocco, Mozambique, Myanmar, Namibia, Nepal, Netherlands, New Zealand, Nicaragua, Niger, Nigeria, Norway, Oman, Pakistan, Panama, Papua New Guinea, Paraguay, Peru, Philippines, Poland, Portugal, Puerto Rico, Qatar, Republic of Korea, Republic of Moldova, Romania, Russian Federation, Rwanda, Saint Lucia, Saint Vincent and the Grenadines, Samoa, Sao Tome and Principe, Saudi Arabia, Senegal, Serbia, Seychelles, Sierra Leone, Singapore, Slovakia, Slovenia, Solomon Islands, Somalia, South Africa, South Sudan, Spain, Sri Lanka, Sudan, Suriname, Swaziland, Sweden, Switzerland, Syrian Arab Republic, Tajikistan, Thailand, The former Yugoslav Republic of Macedonia, Timor-Leste, Togo, Tonga, Trinidad and Tobago, Tunisia, Turkey, Turkmenistan, Uganda, Ukraine, United Arab Emirates, United Kingdom, United Republic of Tanzania, United States of America, Uruguay, Uzbekistan, Vanuatu, Venezuela (Bolivarian Republic of), Viet Nam, West Bank and Gaza Strip, Yemen,
Zambia, Zimbabwe
World Health Organization Page 72
B.2 WHO Region*
WHO African Region
Algeria, Angola, Benin, Botswana, Burkina Faso, Burundi, Cabo Verde, Cameroon, Central African Republic, Chad, Comoros, Congo, Côte d'Ivoire, Democratic Republic of the Congo, Equatorial Guinea, Eritrea, Ethiopia, Gabon, Gambia, Ghana, Guinea, Guinea-Bissau, Kenya, Lesotho, Liberia, Madagascar, Malawi, Mali, Mauritania, Mauritius, Mozambique, Namibia, Niger, Nigeria, Rwanda, Sao Tome and Principe, Senegal, Seychelles, Sierra Leone, South Africa, South Sudan, Swaziland, Togo, Uganda, United Republic of Tanzania, Zambia, Zimbabwe
WHO Region of the Americas
Antigua and Barbuda, Argentina, Bahamas, Barbados, Belize, Bolivia (Plurinational State of), Brazil, Canada, Chile, Colombia, Costa Rica, Cuba, Dominican Republic, Ecuador, El Salvador, Grenada, Guatemala, Guyana, Haiti, Honduras, Jamaica, Mexico, Nicaragua, Panama, Paraguay, Peru, Saint Lucia, Saint Vincent and the Grenadines, Suriname, Trinidad and Tobago, United States of America, Uruguay, Venezuela (Bolivarian Republic of)
WHO South-East Asia Region
Bangladesh, Bhutan, Democratic People's Republic of Korea, India, Indonesia, Maldives, Myanmar, Nepal, Sri Lanka, Thailand, Timor-Leste
WHO European Region
Albania, Armenia, Austria, Azerbaijan, Belarus, Belgium, Bosnia and Herzegovina, Bulgaria, Croatia, Cyprus, Czechia, Denmark, Estonia, Finland, France, Georgia, Germany, Greece, Hungary, Iceland, Ireland, Israel, Italy, Kazakhstan, Kyrgyzstan, Latvia, Lithuania, Luxembourg, Malta, Montenegro, Netherlands, Norway, Poland, Portugal, Republic of Moldova, Romania, Russian Federation, Serbia, Slovakia, Slovenia, Spain, Sweden, Switzerland, Tajikistan, The former Yugoslav Republic of Macedonia, Turkey, Turkmenistan, Ukraine, United Kingdom, Uzbekistan
WHO Eastern Mediterranean Region
Afghanistan, Bahrain, Djibouti, Egypt, Iran (Islamic Republic of), Iraq, Jordan, Kuwait, Lebanon, Libya, Morocco, Oman, Pakistan, Qatar, Saudi Arabia, Somalia, Sudan, Syrian Arab Republic, Tunisia, United Arab Emirates, Yemen
WHO Western Pacific Region Australia, Brunei Darussalam, Cambodia, China, Fiji, Japan, Kiribati, Lao People's Democratic Republic, Malaysia, Marshall Islands, Micronesia (Federated States of), Mongolia, New Zealand, Papua New Guinea, Philippines, Republic of Korea, Samoa, Singapore, Solomon Islands, Tonga, Vanuatu, Viet Nam
* WHO Member States with a population of less than 90 000 population in 2016 were not included in the analysis; these include:
Andorra, Cook Islands, Dominica, Marshall Islands, Monaco, Nauru, Niue, Palau, Saint Kitts and Nevis, San Marino, Tuvalu.
World Health Organization Page 73
B.3 World Bank income grouping*
Low income
Afghanistan, Benin, Burkina Faso, Burundi, Central African Republic, Chad, Comoros, Democratic People's Republic of Korea, Democratic Republic of the Congo, Eritrea, Ethiopia, Gambia, Guinea, Guinea-Bissau, Haiti, Liberia, Madagascar, Malawi, Mali, Mozambique, Nepal, Niger, Rwanda, Senegal, Sierra Leone, Somalia, South Sudan, Togo, Uganda, United Republic of Tanzania, Zimbabwe
Lower middle income
Angola, Armenia, Bangladesh, Bhutan, Bolivia (Plurinational State of), Cabo Verde, Cambodia, Cameroon, Congo, Côte d'Ivoire, Djibouti, Egypt, El Salvador, Georgia, Ghana, Guatemala, Honduras, India, Indonesia, Jordan, Kenya, Kiribati, Kyrgyzstan, Lao People's Democratic Republic, Lesotho, Mauritania, Micronesia (Federated States of), Mongolia, Morocco, Myanmar, Nicaragua, Nigeria, Pakistan, Papua New Guinea, Philippines, Republic of Moldova, Sao Tome and Principe, Solomon Islands, Sri Lanka, Sudan, Swaziland, Syrian Arab Republic, Tajikistan, Timor-Leste, Tunisia, Ukraine, Uzbekistan, Vanuatu, Viet Nam, West Bank and Gaza Strip, Yemen, Zambia
Upper middle income
Albania, Algeria, Argentina, Azerbaijan, Belarus, Belize, Bosnia and Herzegovina, Botswana, Brazil, Bulgaria, China, Colombia, Costa Rica, Croatia, Cuba, Dominican Republic, Ecuador, Equatorial Guinea, Fiji, Gabon, Grenada, Guyana, Iran (Islamic Republic of), Iraq, Jamaica, Kazakhstan, Lebanon, Libya, Malaysia, Maldives, Mauritius, Mexico, Montenegro, Namibia, Panama, Paraguay, Peru, Romania, Russian Federation, Saint Lucia, Saint Vincent and the Grenadines, Samoa, Serbia, South Africa, Suriname, Thailand, The former Yugoslav Republic of Macedonia, Tonga, Turkey, Turkmenistan, Venezuela (Bolivarian Republic of)
High income
Antigua and Barbuda, Australia, Austria, Bahamas, Bahrain, Barbados, Belgium, Brunei Darussalam, Canada, Chile, Taiwan, China; Cyprus, Czechia, Denmark, Estonia, Finland, France, Hungary, Germany, Greece, Iceland, Ireland, Israel, Italy, Japan, Kuwait, Latvia, Lithuania, Luxembourg, Malta, Netherlands, New Zealand, Norway, Oman, Poland, Portugal, Puerto Rico, Qatar, Republic of Korea, Saudi Arabia, Seychelles, Singapore, Slovakia, Slovenia, Spain, Sweden, Switzerland, Trinidad and Tobago, United Arab Emirates, United Kingdom, United States of America, Uruguay
* This regional grouping classifies countries, areas and territories according to the World Bank analytical income of economies based on the 2016 Atlas gross national income per capita estimates (World Bank list of economies, July 2017).
World Health Organization Page 74
Annex Table C GATHER checklist
Item # Checklist item Location reported
Objectives and funding
1 Define the indicator(s), populations (including age, sex, and geographic entities), and time period(s) for which estimates were made.
Sections 2-3
2 List the funding sources for the work. Acknowledgments
Data Inputs
For all data inputs from multiple sources that are synthesized as part of the study:
3 Describe how the data were identified and how the data were accessed. Section 4.1
4 Specify the inclusion and exclusion criteria. Identify all ad-hoc exclusions. Section 4.2
5 Provide information on all included data sources and their main characteristics. For each data source used, report reference information or contact name/institution, population represented, data collection method, year(s) of data collection, sex and age range, diagnostic criteria or measurement method, and sample size, as relevant.
Table 4.1: data with “Excluded” in the notes column were not used
6 Identify and describe any categories of input data that have potentially important biases (e.g., based on characteristics listed in item 5).
N/A
For data inputs that contribute to the analysis but were not synthesized as part of the study:
7 Describe and give sources for any other data inputs.
Population by age and sex Section 2
Total number of deaths by age and sex Section 2
China/India Sections 6-7
Program estimates of cause of death Section 8
GBD2015 estimates for causes of death Section 9
For all data inputs:
8 Provide all data inputs in a file format from which data can be efficiently extracted (e.g., a spreadsheet rather than a PDF), including all relevant meta-data listed in item 5. For any data inputs that cannot be shared because of ethical or legal reasons, such as third-party ownership, provide a contact name or the name of the institution that retains the right to the data.
http://www.who.int/healt hinfo/global_burden_dise ase/estimates/en/index1. html
Data analysis
9 Provide a conceptual overview of the data analysis method. A diagram may be helpful.
Section 1
10 Provide a detailed description of all steps of the analysis, including mathematical formulae. This description should cover, as relevant, data cleaning, data pre-processing, data adjustments and weighting of data sources, and mathematical or statistical model(s).
Sections 4-10
11 Describe how candidate models were evaluated and how the final model(s) N/A: statistical models
12 Provide the results of an evaluation of model performance, if done, as well as the results of any relevant sensitivity analysis.
N/A: statistical models were not used to synthesize data
13 Describe methods for calculating uncertainty of the estimates. State which sources of uncertainty were, and were not, accounted for in the uncertainty analysis.
Section 10
14 State how analytic or statistical source code used to generate estimates can be accessed.
15 Provide published estimates in a file format from which data can be efficiently extracted.
http://www.who.int/healt hinfo/global_burden_dise ase/estimates/en/index1. html
16 Report a quantitative measure of the uncertainty of the estimates (e.g. uncertainty intervals).
Section 10
17 Interpret results in light of existing evidence. If updating a previous set of estimates, describe the reasons for changes in estimates.
Section 11, Annex Table D
18 Discuss limitations of the estimates. Include a discussion of any modelling assumptions or data limitations that affect interpretation of the estimates.
Annex Table D Methods used for estimation of mortality levels and causes of death, by country, 2000-2016 All-cause mortality method groups:
VR: Life tables based on death rates computed from vital registration data.
VR-adj: Life tables based on UNPD’s World Population Prospects – the 2017 revision, and child mortality estimates from the UN-IGME, with annual estimates informed by completeness-adjusted vital registration data.
WPP: Life tables based on UNPD’s World Population Prospects – the 2017 revision, and child mortality estimates from the UN-IGME .
HIV: Life tables based on UNPD’s World Population Prospects – the 2017 revision and child mortality estimates from the UN-IGME, adjusted to maximize consistency with UNAIDS HIV estimates and with VR data where available.
HIV+non: Life tables based on UNPD’s World Population Prospects – the 2017 revision and child mortality estimates from the UN-IGME, with explicit modelling of HIV and non-HIV mortality by UNPD. Life tables adjusted to maximize consistency with UNAIDS HIV estimates and with VR data where available.
Child cause of death methods:
VR data Death registration data from the WHO Mortality Database
Sample VR Cause of death data from the China Maternal and Child Surveillance System (MCMSS)
VRMCM Multi-cause models based on death registration data
VAMCM Multi-cause models based on verbal autopsy data
IndiaVAVR Multi-cause models based on India state-level verbal autopsy and death registration data
Cause of death (COD) methods for ages 5+
Useable VR See Section 4.
GBD2016+WHO WHO/UNAIDS/WPP2015 estimates for HIV deaths and all-cause deaths, GBD2016 study estimates, and WHO and UN Interagency cause-specific estimates (see Section 8 above)
GBD2016adj+WHO As for GBD2016+WHO with additional adjustments based on 2013 death registration data (see Section 6)
MDS+WHO WHO/UNAIDS/WPP2015 estimates for HIV deaths and all-cause deaths, Million Death Study estimates, and WHO and UN Interagency cause-specific estimates (see Section 7)
Completeness Note: (a) Completeness estimated for death registration data with cause of death for ages 15+ from the WHO Mortality Database. This estimate may differ from the completeness assessed for total registered deaths used in the development of WHO life tables (9).
Country
All-cause mortality method
Neonatal method
1-59 month method
COD method for ages 5+
Latest available VR year
Latest year completeness
(a) Average usability
2007-latest
Afghanistan WPP VAMCM VAMCM GBD2016+WHO
Albania VR-adj VRMCM VRMCM GBD2016+WHO 2010 55 47
Algeria WPP VAMCM VAMCM GBD2016+WHO
Angola HIV VAMCM VAMCM GBD2016+WHO
Antigua and Barbuda VR-adj VR data VR data Useable VR 2015 87 66
Argentina VR-adj VR data VR data Useable VR 2015 100 67
Deaths coded to “Symptoms, signs and ill-defined conditions” (780-799 in ICD-9 and R00-R99 in ICD-10) are distributed proportionately to all for neonatal deaths, but exclusively to Group I and Group II for the postneonatal deaths. b
Also referred to as “intrapartum-related complications”