Jan 2017 3. Joe is investigating the effect of light intensity on the height of cress seedlings. He grows the cress in 5 plastic trays. He puts each tray under a different light intensity. (a) Suggest how Joe could estimate the average height of the cress seedlings at each light intensity. .................................................................................................................................. .................................................................................................................................. .................................................................................................................................. .................................................................................................................................. (3) The table below shows Joe’s results. distance of seedlings from light, in cm average height of seedlings in mm 1 40 2 20 3 10 4 5 5 2.5 (b) Describe and explain the results in the table. .................................................................................................................................. .................................................................................................................................. .................................................................................................................................. .................................................................................................................................. (4)
Transcript
Jan 2017
3. Joe is investigating the effect of light intensity on the height of cress seedlings.
He grows the cress in 5 plastic trays.
He puts each tray under a different light intensity.
(a) Suggest how Joe could estimate the average height of the cress seedlings at each light
.................................................................................................................................. (3) The table below shows Joe’s results. distance of seedlings from light, in cm average height of seedlings in mm 1 40 2 20 3 10 4 5 5 2.5
(b) Describe and explain the results in the table.
7. Freddie and Ben were learning about digestion in class. They decided to investigate the effect of changing temperature on the breakdown of starch, using
amylase. Iodine solution is used to detect the presence of starch. (a) Name the product produced when amylase breaks down starch.
.................................................................................................................................. (1) Freddie and Ben mixed together amylase and starch at 30 °C. They took a dimple tile and added three drops of iodine solution to each dimple. After one minute, a drop of the starch and amylase mixture was added to iodine in the first dimple. They recorded the colour of the iodine solution. The starch and amylase mixture was added to each of the dimples in turn, at one minute intervals, until the iodine solution no longer changed colour. This showed that the amylase had completely digested the starch. The time taken to digest the starch completely was recorded in minutes. Freddie and Ben repeated the experiment at six other temperatures, 0 °C, 10 °C, 20 °C, 40 °C, 50 °C and 60 °C. No starch digestion was observed at 0 °C or 60 °C during the 13 minutes of the experiment.
The results of the experiment are shown below.
0 °C
20 °C
30 °C
10 °C
9 Minutes
5 Minutes
3 Minutes
10 Minutes
13 Minutes
40 °C
50 °C
60 °C
13 Minutes
12 Minutes
(b) (i) Describe the colour changes that occur when iodine solution is mixed with starch.
........................................................................................................................... (1) (ii) Name the variable changed by Freddie and Ben.
........................................................................................................................... (1) (iii) Explain why Freddie and Ben recorded the result of the 30 °C experiment as 5 minutes.
........................................................................................................................... (2) (c) (i) Use the information in the diagram to plot the graph below, showing the time taken to digest
starch, in minutes, against temperature, in °C. time, in minutes temperature, in °C
(3)
(ii) Draw a line of best fit.
(1)
(iii) Use the graph to predict the temperature at which amylase digests starch at its fastest rate.
........................................................................................................................... (2) A different type of amylase is often used in the food industry to break down starch. The amylase is usually obtained from bacteria and works best at temperatures between 50–60 °C. (d) (i) Suggest how this bacterial amylase differs from the amylase that Freddie and Ben used.
........................................................................................................................... (1) (ii) Suggest why it is an advantage for the food industry to use amylase that works best at between 50–60 °C.
2 The steps taken when testing a leaf for starch are outlined in the statements below. The steps are not in the correct order. (a) Write the numbers 2 to 5 in the box below to show the correct order. (Number 1 has been done for you.)
stage
number
heat the leaf in boiling ethanol
dip the leaf in hot water again
spread the leaf over a white tile
dip the leaf in hot water 1
1
add iodine solution to the leaf and look for a colour change
(2)
(b) Suggest a reason for doing the following steps in the method. (i) heat the leaf in boiling ethanol
........................................................................................................................... (1) (iii) add iodine solution to the leaf
Q5 The diagram below shows the human respiratory system.
(a) Give the names of the organs labelled A–D in the diagram.
A ........................... B ........................... C ........................... D ........................... (4) (b) Suggest two ways in which structure A is important.
.................................................................................................................................. (3) (e) Name two other diseases of the respiratory system caused by smoking.
5 In 1772, Joseph Priestly carried out experiments with mice and plants in bell jars. The bell jars were airtight, so that gases could not move in or out. The mice were provided with food and water.
The mice were respiring. (a) Complete the following equation for respiration.
.................................................................................................................................. (3) (b) Describe a test for carbon dioxide gas.
The rate of respiration can be measured by measuring the volume of carbon dioxide released
per minute. The following data were collected to investigate the effect of temperature on the rate of
respiration.
(d) (i) Use the table above to complete the horizontal axis of the graph below. (1) (ii) Add an appropriate scale to the vertical axis of the graph below. (1) (iii) Plot a graph of the rate of respiration against temperature. (2) (iv) Draw a curve of best fit through the points. (1)
(e) Describe the effect of temperature on the rate of respiration.
6. Coral reefs are extremely important habitats for tens of thousands of species of organisms. (a) Define the term habitat.
.................................................................................................................................. (1) The diagram below is an example of part of a food web for a coral reef.
Phytoplankton and seagrass are producers.
From the food web opposite name an organism which
(i) is a herbivore ....................................................................................................
(ii) is both a secondary and tertiary consumer ............................................................
(iii) has no predators ............................................................................................... (3)
Corals are animals which build coral reefs. They are very sensitive to pollution. Coral is normally brightly coloured. When a coral dies it turns white.
Recent research has found that some of the chemicals found in suntan cream may dissolve in seawater and become poisonous to coral.
Scientists need to investigate how changing the concentration of these chemicals will affect the
number of corals dying.
Below is a picture of a glass tank with some coral in it.
You are provided with 5 of these tanks, suntan cream, seawater and living coral. You may use other pieces of apparatus. (c) Describe how you could investigate the effect of changing the concentration of suntan cream on the number of corals dying. You should include details of how your investigation will be valid and reliable.
5 Offspring produced by sexual reproduction vary from each other. Some of this variation is continuous and some is discontinuous. (a) (i) In sexual reproduction in humans, two sex cells fuse together to form a single cell. Give the names of the two sex cells involved.
name of male sex cell: ...................................................................................... (1)
name of female sex cell: ................................................................................... (1) (ii) Explain the difference between discontinuous and continuous variation, giving an example of
each.
........................................................................................................................... ........................................................................................................................... ........................................................................................................................... ........................................................................................................................... (4) Below is a table which shows the average birth weight of baby boys in the first weeks after birth.
On the graph grid, draw a line graph to show how the mass of a baby changes in the first 40 weeks after birth.
(i) label both axes and add suitable scales to them (2) (ii) plot the data points (3) (iii) add a line or curve (1)
c) Use the results to describe how the mass of a baby boy changes in the 40 weeks after birth.
6 Tom wanted to investigate the effects of drinking fizzy cola on his pulse rate.
First, he measured his resting pulse rate every minute for four minutes when sitting down. Then he drank some cola. He continued to measure his pulse rate each minute for the next five minutes.
(a) Suggest why Tom began the investigation by first measuring his resting pulse rate.
........................................................................................................................... ............................................................................................................................ (1) Tom’s four readings for his resting pulse rate, in beats per minute, are listed below. 70 75 65 74 (b) Calculate an average resting pulse rate for Tom. Make sure you show your working.
................................................................................................. beats per minute. (2) (c) Suggest why Tom took several readings to establish his resting pulse rate.
The table below shows Tom’s pulse rate for the five minutes after he drank the fizzy cola.
(d) (i) Complete the scales on the horizontal and vertical axes. (2)
(ii) Plot the results on the axes and join the points with a smooth curve. (3)
(iii) Describe the effect of fizzy cola on Tom’s pulse rate.
........................................................................................................................... ........................................................................................................................... ........................................................................................................................... (2) (iv) Tom’s teacher suggested he also measured his pulse rate after he drank fizzy water. Explain why measuring Tom’s pulse rate before and after he drank fizzy water improved the
investigation.
........................................................................................................................... ........................................................................................................................... ........................................................................................................................... (2) (v) Use the space below to suggest a reliable method for investigating the effect of exercise on your
factor two: ................................................................................................................. (1) Their results are shown in the table below.
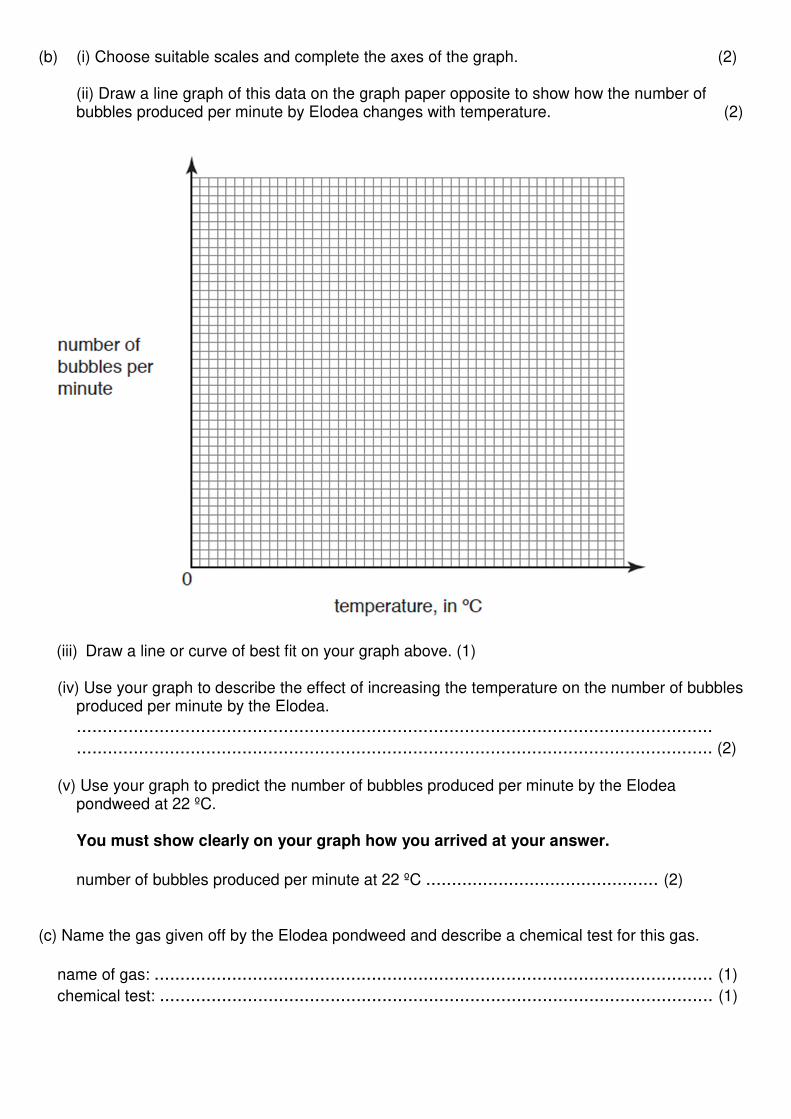
(b) (i) Choose suitable scales and complete the axes of the graph. (2) (ii) Draw a line graph of this data on the graph paper opposite to show how the number of
bubbles produced per minute by Elodea changes with temperature. (2)
(iii) Draw a line or curve of best fit on your graph above. (1) (iv) Use your graph to describe the effect of increasing the temperature on the number of bubbles
produced per minute by the Elodea.
........................................................................................................................... ........................................................................................................................... (2) (v) Use your graph to predict the number of bubbles produced per minute by the Elodea
pondweed at 22 ºC. You must show clearly on your graph how you arrived at your answer.
number of bubbles produced per minute at 22 ºC ............................................. (2) (c) Name the gas given off by the Elodea pondweed and describe a chemical test for this gas.
name of gas: ............................................................................................................ (1)
chemical test: ........................................................................................................... (1)
summer 2013
5 The African Elephant (Loxodonta africana) is the largest living land animal. Elephants have been hunted by humans for their ivory tusks.
Below is a table showing an estimate of the size of the population of elephants in Kenya since 1970.
The Convention on International Trade in Endangered Species (CITES) banned the trade of ivory
in 1990.
(a) Write down the name of the vertebrate group to which the African Elephant belongs.
(c) Follow the instructions below to plot a line graph of the data in the table. Instruction 1: Complete the horizontal axis with a linear scale to show the year. (1)
Instruction 2: Add a linear scale to the vertical axis to show the African Elephant population; try to make sure that you use as much of the graph paper as possible. (1)
Instruction 3: Using the data in the table opposite, plot the four points on the graph to show
how the African Elephant population has changed over time. (2)
Instruction 4: Join the points using a curve of best fit. (1)
(d) Describe and explain the shape of the graph which you have drawn above.
6. All plants need to carry out the process of photosynthesis to survive. The more photosynthesis a plant carries out, the healthier and faster it will grow. (a) (i) Write down the name of the nutrient which plants make when they carry out photosynthesis.
................................................................................................................................... (1) (ii) Write down the name of the by-product of photosynthesis.
................................................................................................................................... (1) (iii) Sunlight is needed for photosynthesis. Write down the names of TWO chemicals which are required for photosynthesis.
Like all living organisms, plants need to carry out the process of respiration in all of their cells. At night plants use up their stored starch in respiration. (b) (i) Write down the name of the chemical used to test for the presence of starch in a leaf.
............................................................................................................................ (1) (ii) Write down the colour this chemical turns in the presence of starch.
............................................................................................................................ (1) (iii) Describe the steps you would need to carry out in a school laboratory to test a leaf for the
presence of starch. Remember to include any safety precautions which you would take.
(b) Marine plants and phytoplankton are the producers in sea food chains. Suggest what effect an oil spill would have on the numbers of primary consumers in the area.
(c) Look at the picture below. It shows a sea bird with oil from an oil spill covering its feathers.
Suggest two effects this could have on the bird and why it is likely to result in the bird dying if it is not helped.
effect on bird 1: .......................................................................................................
reason it might cause the bird to die: ..........................................................................
effect on bird 2: ......................................................................................................
reason it might cause the bird to die: ......................................................................... (4)
(d) Oil is difficult to clean up. Recently, scientists have discovered naturally occurring bacteria which can digest oil. These bacteria could be used to help remove the oil from oil spills. Underline the word or phrase which best completes the following sentence. Bacteria are animals fungi plants single-celled organisms (1)
(d) Scientists need to find the best conditions in which to grow the bacteria. They already know that the concentration of nitrates available to them affects how fast they grow.
Suggest one other factor which might affect how fast the bacteria can grow and reproduce.
It is possible to grow these bacteria in a glass petri dish on a special substance called agar gel. As the bacteria grow, they cover the surface of the gel and make it look dark and cloudy. The larger the cloudy areas on the agar, the more bacteria there are.
The picture above show a petri dish with dark areas of growth of bacteria on agar gel after 48 hours.
(f) Using the space below, suggest how you could find out the best concentration of nitrates for
bacterial growth. (It is possible to buy agar gel containing different concentrations of nitrates for the bacteria to grow on.) Describe clearly how you would make your investigation a fair test. You may use diagrams to help you with your answer.