Abstract Efforts to improve restraint design for human occupant protection require evaluations performed with anthropomorphic test devices (ATDs) and computational models to predict injury risk and rate restraint performance. As additional improvements in restraint performance are becoming increasingly difficult to achieve, increasing the precision with which we are able to predict injury is of primary importance. This requires commensurate improvement in the tools that are used to evaluate restraint performance and predict injury. The goal of the current study was to quantify the whole‐body kinematic response of eight post mortem human surrogates (PMHS) tested in the same 40 km/h frontal impact condition while restrained by a three‐ point belt. Kinematic data, obtained during the tests with a motion capture system, were later combined with a rigid body motion analysis that yielded three‐dimensional skeletal displacements of the head, T1, T8, L2, L4, pelvis and bilateral acromia relative to the vehicle buck. These calculated data were then used to develop three‐dimensional displacement corridors to quantify the whole‐body kinematic response of restrained PMHS for a frontal impact conducted in a controlled laboratory environment. The provided response corridors will be immediately useful for efforts to evaluate or enhance the kinematic performance of ATDs and computational models. Keywords Corridors, Frontal, Kinematics, PMHS, Restrained I. INTRODUCTION Road traffic injuries are a well‐established public health problem and are a leading cause of death globally. Over 1.2 million fatalities and as many as 50 million injuries occur annually on the world’s roads [1]. It has been estimated that road‐related deaths will rise to become the fifth leading cause of death by the year 2030 with as many as an estimated 2.4 million fatalities occurring annually [1]‐[2]. In high‐income, developed countries the greatest proportion (approximately 65%) of reported deaths occurs to vehicle occupants [1]. While increased seat belt usage and advances in restraint design have substantially improved the injury outcome for restrained occupants, numerous fatalities and debilitating injuries are still occurring nonetheless [3]‐[6]. For restrained vehicle occupants, injuries to the head and thorax are primary sources of morbidity and mortality occurring from motor vehicle accidents [7]‐[14]. This is especially true for older occupants who are more susceptible to injury resulting from the restraining forces applied to the torso during a crash [12]‐[14]. This combination of societal aging and the associated vulnerability of older persons to restraint loading injuries is a principal motivation for continued passenger safety research [15]‐[17]. Further mitigating injuries to restrained occupants requires a more complete understanding of how the human skeletal system moves during a crash event. Occupant kinematics not only dictate the interaction between the restraint system and the thorax, but also the potential for contact between the vulnerable head and the interior structures of the vehicle. Effectively evaluating the performance of current restraint systems, as well as optimizing future restraint designs, requires the use of biofidelic evaluation tools to emulate human occupant motion and to predict injury during an impact event. Anthropomorphic testing devices (ATDs) and computational models are the most commonly utilized human surrogates for this purpose. Since the effectiveness of these tools is related to their biofidelity, assessment of kinematic response characteristics relative to available benchmarking human data is a crucial task in ensuring accurate prediction of human Joseph Ash is Graduate Research Assistant at the University of Virginia Center for Applied Biomechanics in Charlottesville, VA, USA (1‐ 434‐296‐7288 (phone), 1‐434‐296‐3453 (fax), jha7e@ virginia.edu). Qi Zhang a Graduate Research Assistant at the University of Virginia Center for Applied Biomechanics . David Lessley, Greg Shaw, and Jason Forman are Senior Scientists at the University of Virginia Center for Applied Biomechanics. Jeff Crandall is the Director of the University of Virginia Center for Applied Biomechanics. Whole‐Body Kinematics: Response Corridors for Restrained PMHS in Frontal Impacts Joseph H. Ash, David J. Lessley, Jason L. Forman, Qi Zhang, C. Greg Shaw, Jeff R. Crandall IRC-12-21 IRCOBI Conference 2012 - 142 -
Transcript
Abstract Efforts to improve restraint design for human occupant protection require evaluations performed
with anthropomorphic test devices (ATDs) and computational models to predict injury risk and rate restraint
performance. As additional improvements in restraint performance are becoming increasingly difficult to
achieve, increasing the precision with which we are able to predict injury is of primary importance. This
requires commensurate improvement in the tools that are used to evaluate restraint performance and predict
injury. The goal of the current study was to quantify the whole‐body kinematic response of eight post mortem
human surrogates (PMHS) tested in the same 40 km/h frontal impact condition while restrained by a three‐
point belt. Kinematic data, obtained during the tests with a motion capture system, were later combined with
a rigid body motion analysis that yielded three‐dimensional skeletal displacements of the head, T1, T8, L2, L4,
pelvis and bilateral acromia relative to the vehicle buck. These calculated data were then used to develop
three‐dimensional displacement corridors to quantify the whole‐body kinematic response of restrained PMHS
for a frontal impact conducted in a controlled laboratory environment. The provided response corridors will be
immediately useful for efforts to evaluate or enhance the kinematic performance of ATDs and computational
Road traffic injuries are a well‐established public health problem and are a leading cause of death globally.
Over 1.2 million fatalities and as many as 50 million injuries occur annually on the world’s roads [1]. It has been
estimated that road‐related deaths will rise to become the fifth leading cause of death by the year 2030 with as
many as an estimated 2.4 million fatalities occurring annually [1]‐[2]. In high‐income, developed countries the
greatest proportion (approximately 65%) of reported deaths occurs to vehicle occupants [1]. While increased
seat belt usage and advances in restraint design have substantially improved the injury outcome for restrained
occupants, numerous fatalities and debilitating injuries are still occurring nonetheless [3]‐[6]. For restrained
vehicle occupants, injuries to the head and thorax are primary sources of morbidity and mortality occurring
from motor vehicle accidents [7]‐[14]. This is especially true for older occupants who are more susceptible to
injury resulting from the restraining forces applied to the torso during a crash [12]‐[14]. This combination of
societal aging and the associated vulnerability of older persons to restraint loading injuries is a principal
motivation for continued passenger safety research [15]‐[17].
Further mitigating injuries to restrained occupants requires a more complete understanding of how the
human skeletal system moves during a crash event. Occupant kinematics not only dictate the interaction
between the restraint system and the thorax, but also the potential for contact between the vulnerable head
and the interior structures of the vehicle. Effectively evaluating the performance of current restraint systems,
as well as optimizing future restraint designs, requires the use of biofidelic evaluation tools to emulate human
occupant motion and to predict injury during an impact event. Anthropomorphic testing devices (ATDs) and
computational models are the most commonly utilized human surrogates for this purpose. Since the
effectiveness of these tools is related to their biofidelity, assessment of kinematic response characteristics
relative to available benchmarking human data is a crucial task in ensuring accurate prediction of human
Joseph Ash is Graduate Research Assistant at the University of Virginia Center for Applied Biomechanics in Charlottesville, VA, USA (1‐434‐296‐7288 (phone), 1‐434‐296‐3453 (fax), jha7e@ virginia.edu). Qi Zhang a Graduate Research Assistant at the University of Virginia Center for Applied Biomechanics . David Lessley, Greg Shaw, and Jason Forman are Senior Scientists at the University of Virginia Center for Applied Biomechanics. Jeff Crandall is the Director of the University of Virginia Center for Applied Biomechanics.
Whole‐Body Kinematics: Response Corridors for Restrained PMHS in Frontal Impacts
Joseph H. Ash, David J. Lessley, Jason L. Forman, Qi Zhang, C. Greg Shaw, Jeff R. Crandall
IRC-12-21 IRCOBI Conference 2012
- 142 -
occupant injury and corresponding restraint performance. However, in order to improve the utility of ATDs and
computational models it is necessary to carry out biofidelity evaluations using more detailed kinematic data
than has been previously available.
Kinematic measurements during high‐rate events such as frontal impacts with restrained occupants have
historically been accomplished using two‐dimensional (2D) video analysis from conventional high‐speed video
imaging [17]‐[18]. Using this technique the trajectory of a visible photo target on the surface of the body is
tracked relative to either the vehicle or a fixed laboratory reference frame. This method, however, is
confounded by several factors: 1) the fact that the skeletal structure of interest is within the body and is not
directly visible to the high‐speed imager, 2) the actual 3D motion of such a skeletal structure is approximated by
the 2D motion of the overlying photo target, and 3) such analysis is limited by the issues of imager lens
distortion and parallax. While such analysis has long been the standard for kinematic analysis in the field of
impact biomechanics, the associated limitations prevent a comprehensive kinematic analysis to be performed
that includes the three‐dimensional (3D) motion of selected skeletal structures within the body.
Recently, in the field of impact biomechanics, the use of high‐rate video‐based optoelectronic
stereophotogrammetric systems (OSSs) has been combined with specialized retroreflective target hardware to
provide accurate kinematic measurement of specific anatomical structures in restrained post mortem human
surrogates (PMHS) during simulated vehicle collisions [19]‐[20]. Using this methodology, the OSS tracks the
displacements of visible target clusters rigidly attached to specific underlying bones. The collected target
trajectory is then transformed to the corresponding bone center using a rigid body transformation. The
advantage of this methodology is that it provides detailed 3D trajectories of specific skeletal structures that are
within the body, such as individual vertebrae, which are not directly visible or accessible for measurement by
other available means.
The goal of the current study was to develop whole‐body kinematic response corridors from PMHS tests in
which detailed skeletal kinematics were measured during simulated vehicle collisions. Specifically, the study
utilized the results from eight 40 km/h frontal impact sled tests involving PMHS restrained by a three‐point belt
in which 3D skeletal displacements were obtained for the head, spine, pelvis and shoulders. These data were
used to construct corresponding kinematic response corridors for the head, spine, pelvis and shoulders to be
used as biofidelity targets for the evaluation and development of frontal impact ATDs and computational
models.
II. METHODS
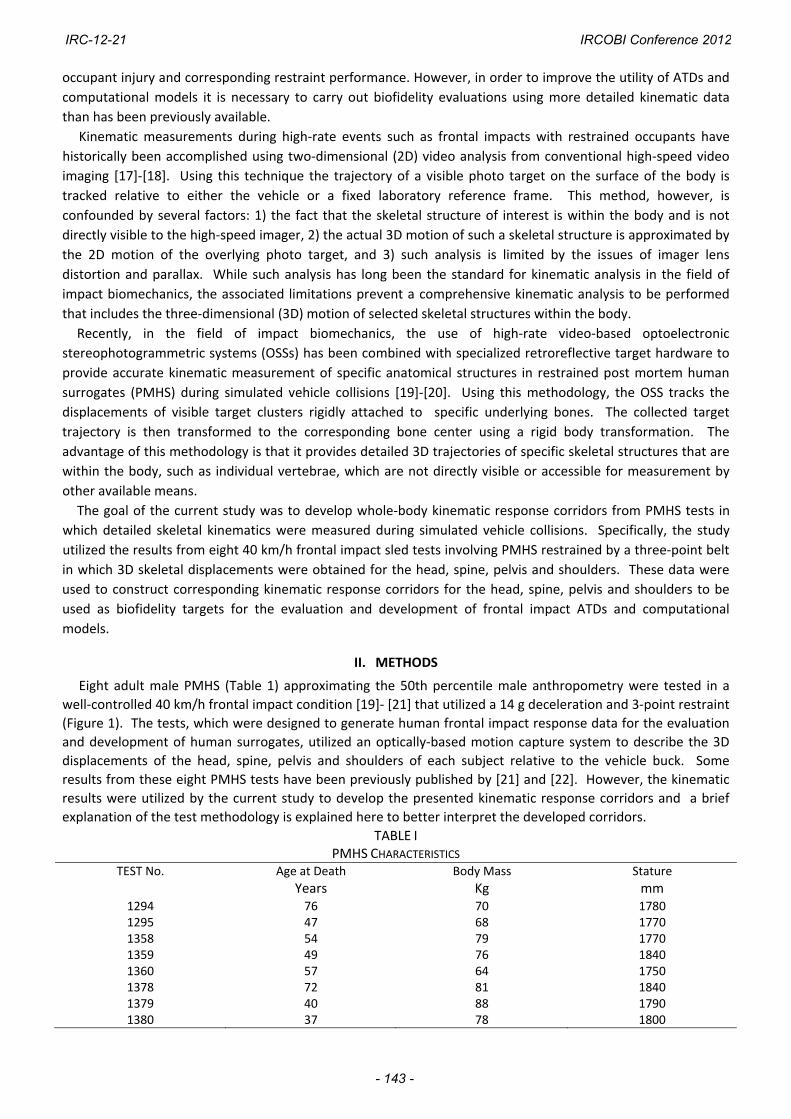
Eight adult male PMHS (Table 1) approximating the 50th percentile male anthropometry were tested in a
well‐controlled 40 km/h frontal impact condition [19]‐ [21] that utilized a 14 g deceleration and 3‐point restraint
(Figure 1). The tests, which were designed to generate human frontal impact response data for the evaluation
and development of human surrogates, utilized an optically‐based motion capture system to describe the 3D
displacements of the head, spine, pelvis and shoulders of each subject relative to the vehicle buck. Some
results from these eight PMHS tests have been previously published by [21] and [22]. However, the kinematic
results were utilized by the current study to develop the presented kinematic response corridors and a brief
explanation of the test methodology is explained here to better interpret the developed corridors.
TABLE I PMHS CHARACTERISTICS
TEST No. Age at Death Body Mass Stature
Years Kg mm 1294 76 70 17801295 47 68 17701358 54 79 17701359 49 76 18401360 57 64 17501378 72 81 18401379 40 88 17901380 37 78 1800
IRC-12-21 IRCOBI Conference 2012
- 143 -
Experimental Test methodology
The eight PMHS (Table 1) were selected based on the absence of pre‐existing fractures, lesions or other bone pathology as confirmed by a computed tomography (CT) scan performed prior to the testing. Collection of three‐dimensional trajectories required several pre‐test preparation and post‐test analysis steps. First, specific anatomical locations were selected and identified for kinematic measurement including the head, 1st thoracic vertebrae (T1), 8th thoracic vertebra (T8), 2nd lumbar vertebra (L2), 4th lumbar vertebra (L4), pelvis, right acromion (RAc) and left acromion (LAc) and are illustrated in Figure 1. Second, at each of these measurement locations, visible four‐target clusters (Figure 1), used for measurement of translation and rotation, were surgically attached to the skull, selected vertebrae, pelvis and shoulders. Third, each subject, with surgically implanted measurement hardware installed, was seated on a rigid horizontal seat surface and was positioned into a seated posture approximating that described by [23]. Fourth, the subject was restrained by a 3‐point lap and shoulder belt in a right‐front passenger configuration and was then subjected to a simulated 40 km/h frontal collision [19]. Fifth, during the impact event a 16‐camera, 1000 Hz optoelectronic stereophotogrammetric system (Vicon, MX series, Oxford, UK) was used to track the trajectories of the attached target clusters. Finally, the recorded trajectories of the attached target clusters were used to calculate the trajectories of the underlying skull, selected vertebrae, acromia and pelvis using a coordinate transformation and the assumption of rigid body motion described in detail by [20]. The test fixture (Figure 1) and test methodology was described by [19], and was designed to provide a reasonable approximation of a real‐world frontal crash with a restrained occupant, while providing repeatable and reproducible test conditions that would allow whole‐body kinematic response to be comprehensively measured and analyzed. The restraint consisted of a 3‐point lap and shoulder belt with anchor positions approximating those found in a typical mid‐size U.S. sedan. The belt did not include a retractor, and the webbing material, which was replaced for each test, was manufactured by Narricut (International twill pattern 13195, 6‐8% elongation, 6000 lbf minimum tensile strength). Pelvis and lower extremity movements were restricted using a rigid knee bolster and footrest which were adjusted to be in contact with the knees and feet of each subject at the time of impact. The combination of lap belt, knee bolster and footrest was designed to minimize pelvic and lower extremity movements during the impact event while allowing the characteristic forward torso motion associated with an actual automotive restraint system.
Skeletal Displacements
Using the collected four‐marker cluster trajectories provided by the motion capture system during each test, the video data analysis methods [19]‐[20] were used to calculate transformation matrices describing the positions and orientations of each skeletal structure with respect to a global, laboratory‐fixed reference frame throughout the impact event. However, it is often more advantageous for the positions and orientations to be described relative to a moving coordinate system such as one attached to the vehicle. Thus, through matrix multiplication [19] the positions and orientations of all selected skeletal structures were described relative to the vehicle at each millisecond throughout the test event. The position data, calculated over the duration of the test event, provided the 3D displacements of the head, selected vertebrae, acromia and pelvis with respect to the vehicle coordinate system (Figure 1) which conformed to the recommendations set forth by SAE‐J211 [24]. For each measurement location, a local anatomically‐based coordinate system [25] was created on the selected skeletal structure of interest. The calculated displacements are the displacements of the origins of each of these skeletal coordinate systems and are illustrated in Figure 1. Since the subjects approximated the 50th percentile adult male anthropometry, no scaling of the displacement data was performed. Corridor Construction For each skeletal measurement location the X‐axis, Y‐axis, and Z‐axis displacements were obtained with respect to the vehicle buck for each subject at one millisecond intervals. Thus, for a given measurement location (i.e. T1) and displacement component (i.e. X‐axis) a total of eight displacement time‐history curves were obtained from the eight tested subjects. These eight displacement time‐history curves were used to generate a characteristic average curve along with a one standard deviation (S.D.) corridor around the characteristic average curve [26]. Using this corridor development technique, the inherent variation in a set of eight displacement curves is accounted for in both the vertical direction (variation in displacement for a given time value) and also the horizontal direction (variation in time for a given displacement value). For each point on the characteristic curve the S.D. in both the vertical and horizontal directions were calculated and were then used as the axes of a one S.D. ellipse of displacement variation associated with that particular point on the
IRC-12-21 IRCOBI Conference 2012
- 144 -
characteristic average curve (Figure 2). This same process was repeated for each point on the characteristic average curve, and a one S.D. ellipse [27] was obtained for each point along the characteristic average curve. Plotting each point on the characteristic average along with its determined one S.D. ellipse swept out a one S.D. region of displacement variation surrounding the characteristic average curve. This swept out region was taken as the final one S.D. corridor associated with a given measurement location and displacement component. This process was repeated for the X‐axis, Y‐axis, and Z‐axis displacement components for each of the eight measurement locations to determine a total of 24 skeletal displacement corridors.
Fig. 1. Test fixture (upper left), measurement hardware (upper right), and kinematic measurement locations
(lower).
Fig. 2. Corridor Construction
+ 1 S.D.
- 1 S.D. Characteristic Average
Variation Ellipse
1 S.D.
1 S.D.
IRC-12-21 IRCOBI Conference 2012
- 145 -
III. RESULTS
Eight simulated 40 km/h frontal impacts (Figure 3) were performed using eight restrained PMHS that
approximated 50th percentile anthropometry. During each test, skeletal kinematic data were successfully
collected for the head, T1, T8, L2, L4, acromia and pelvis at each millisecond during the impact event. From
these data, 24 displacement response corridors were generated. These specifically included X‐axis, Y‐axis, and
Z‐axis displacement time‐history corridors for the head, T1, T8, L2, L4, bilateral acromia and pelvis relative to
the vehicle buck.
20 ms 100 ms 140 ms
Fig. 3. Still frames from high speed imager for test 1358 (other test results similar).
Skeletal Kinematics
Peak X‐axis excursion of the head, spine and shoulders was observed to occur at approximately 120 ms.
Figure 4 provides the mean peak displacements of each measured location for the eight PMHS in both the
positive and negative X‐axis, Y‐axis, Z‐axis directions (refer to the vehicle coordinate axes in Figure 1 where the
positive X‐axis is forward, the positive Y‐axis is to the occupant’s right and positive Z‐axis is upward). The
trajectory of each measured skeletal location is illustrated in Figure 5 using test 1294 as an example (other tests
were similar). Specifically, Figure 5 provides lateral, posterior, and superior 2D views of the 3D spine shape and
position occurring during the test. An overhead view of the trajectory of each acromion is also provided in
Figure 5. All 2D views are provided by projecting the 3D anatomical kinematic data onto the desired 2D
reference frame of interest (e.g. Z‐X plane, Z‐Y plane and X‐Y plane).
-200
-100
0
100
200
300
400
500
Head T1 T8 L2 L4 Pelvis LAc RAc
Mea
n P
eak
Dis
plac
emen
t wrt
to V
ehic
le (
mm
)
X-axis
Y-axis
Z-axis
- X-axis
- Y-axis
- Z-axis
Fig. 4. Mean peak X‐axis, Y‐axis, and Z‐axis displacements with respect to the vehicle coordinate system.
IRC-12-21 IRCOBI Conference 2012
- 146 -
Fig. 5. Example of 3D spine shape and position at 20 ms intervals. Provided views are lateral (upper left),
posterior (upper right), and overhead views without acromia (lower left) and with acromia (lower right).
Skeletal Displacement Corridors
Figures 6 – 9 illustrate the generated displacement corridors for the selected measurement locations. For
each measurement location corridor plots are provided for the X‐axis, Y‐axis and Z‐axis skeletal displacement
relative to the vehicle buck. Specifically, each corridor plot provides the eight PMHS displacement time‐
histories, the calculated characteristic average curve and the one S.D. corridor constructed around the
characteristic average.
IV. DISCUSSION
The current study represents an important step in the ongoing effort to address injuries in restrained vehicle
occupants by improving the current understanding of skeletal motions in a restrained occupant during an
impact. Effectively quantifying such skeletal motions is a challenging task since the specific structures of
interest (e.g. individual vertebrae) are within the body and are not directly visible or easily accessible for
measurement. While previous studies have either investigated whole‐body kinematics using external targets to
infer the motion of the underlying skeletal system [17]‐[26],[28] or have investigated kinematics occurring only
in the sagittal plane [17],[28]‐[29], the current study utilizes directly measured skeletal motions to quantify
-200
0
200
400
600
800
-200 0 200 400 600
X-a
xis
Pos
itio
n (m
m)
Y-axis Position (mm)
RAc LAc
100ms 120ms
140ms
160ms
160ms
120ms
120ms
80ms
60ms
40ms 40ms
60ms
0ms
Head
0ms
-1200
-1000
-800
-600
-400
-200-200 0 200 400 600
Z-a
xis
Pos
itio
n (m
m)
X-axis Position (mm)
Head
T1
T8
L2 L4
Pelvis
0ms 60ms 80ms
100ms
120ms
140ms 160ms
-1200
-1000
-800
-600
-400
-200-200 0 200 400 600
Z-a
xis
Pos
itio
n (m
m)
Y-axis Position (mm)
Head
T1
T8
L2 L4
Pelvis
0ms 80ms
100ms
120ms
140ms 160ms
-200
0
200
400
600
800
-200 0 200 400 600
X-a
xis
Pos
itio
n (m
m)
Y-axis Position (mm)
80ms
100ms 120ms
140ms
160ms
60ms
Head
T1
T8
IRC-12-21 IRCOBI Conference 2012
- 147 -
whole‐body skeletal motion in three dimensions. Such 3D displacement response corridors will provide an
effective means to evaluate the biofidelity of ATDs and computational models in terms of whole‐body kinematic
response at the skeletal level when tested in the same laboratory condition. Such a comprehensive set of
whole‐body displacement response corridors has been previously unavailable for efforts to improve human
surrogates (ATDs and computational models).
Fig. 6. Displacement corridors for the head (left column) and T1 (right column).
IRC-12-21 IRCOBI Conference 2012
- 148 -
Fig. 7. Displacement corridors for T8 (left column) and L2 (right column).
IRC-12-21 IRCOBI Conference 2012
- 149 -
Fig. 8. Displacement corridors for L4 (left column) and pelvis (right column).
IRC-12-21 IRCOBI Conference 2012
- 150 -
Fig. 9. Displacement corridors for the left acromion (left column) and the right acromion (right column).
IRC-12-21 IRCOBI Conference 2012
- 151 -
The well‐controlled test condition and kinematic measurement methodology produced generally well‐behaved displacement responses that revealed repeatable and consistent characteristics occurring across all tested subjects for a given measured parameter (e.g T1 X‐axis displacement). As expected, some measured parameters were associated with more response variation across the tested subjects than others. Figure 4 above, which summarizes the mean peak displacement magnitudes, provides some insight into which responses were the most characteristic across the eight PMHS. Using data from Figure 4, Figure 10 provides the coefficient of variation (Cv), or the ratio of the S.D. to the mean, for the peak values associated with each measured parameter. Parameters with a small value of Cv (Cv ≤ 0.2) identify PMHS responses that are inherently the most stable and well‐behaved, with minimal variation across subjects in comparison to the magnitude of the measured response. Such parameters, due to their highly characteristic behavior, should be targeted first from a biofidelity standpoint prior to moving onto other displacement responses, which may be more varied across the tested subjects. Referring to Figure 10, it is interesting that of the 13 parameters with Cv ≤ 0.2, 11 of these occur along the X and Z axes that make up the sagittal plane (Z‐X plane). This occurs in part because motions along the X and Z axes are generally associated with the greatest magnitudes for the tested condition, and thus will naturally have lower Cv values for similar subject‐to‐subject variations. While previous studies [17] and [28]‐[29] have reasonably focused on quantifying motions in the Z‐X plane, the current study demonstrates substantial displacements occurring perpendicular to the Z‐X plane (Y‐axis displacement) particularly at the more superior measurement locations. These out‐of‐plane motions represent an additional perspective on occupant kinematics and may influence how the thorax interacts with the restraint system, possibly affecting deformation of the ribcage and subsequent risk of rib fracture. Additionally, the Y‐axis displacement of the head could be important relative to air bag interaction and associated risk of head injury. Thus, it is important for ATDs and computational models, used to evaluate restraint systems, to be biofidelic with regard to these observed skeletal motions occurring along the X, Y, and Z coordinate axes.
Fig. 10. Mean peak displacement values for Cv.
Limitations and Future Work
The primary limitation with the current study is the use of the underlying kinematic response data generated from PMHS. While PMHS represent the best available human surrogate to assess skeletal kinematics during an impact, the lack of muscle tone and muscle activation is known to affect kinematic response leading to inherent differences between the PMHS and a living human. Additionally, the quantified displacement responses are from a single frontal impact condition. Despite these limitations, the presented response corridors or “targets” represent useful kinematic benchmarks for a restrained occupant. The practical application of these “targets” is for the kinematic evaluation of both ATDs and finite element models tested in the same condition. Performing an effective
0
0.2
0.4
0.6
0.8
1
1.2
1.4
1.6
Head T1 T8 L2 L4 Pelvis LAc RAc
Mea
n P
eak
Dis
plac
emen
t wrt
to V
ehic
le -
c v
X-axis
Y-axis
Z-axis
-X-axis
-Y-axis
-Z-axis
IRC-12-21 IRCOBI Conference 2012
- 152 -
kinematic evaluation with a surrogate (e.g. ATD) using the presented response corridors will require: 1) that the surrogate be tested in the same impact condition as the PMHS presented in current study and 2) that displacements on the surrogate be measured in anatomically consistent locations to those measured on the PMHS presented here, as described by [30]. Once displacements are obtained at anatomically consistent locations [30] for the same 40 km/h frontal impact condition, then the measured surrogate displacements can be compared to the presented response corridors to quantify the level of kinematic biofidelity exhibited by the tested surrogate.
V. CONCLUSIONS
Improving the current understanding of human skeletal motion under impact loading is a crucial step in improving the biofidelity of the human surrogates used to design restraint systems and evaluate injury risk for restrained vehicle
occupants. The current study developed whole‐body kinematic response corridors from PMHS tests in which detailed skeletal kinematics were measured during simulated vehicle collisions. Specifically, the study utilized the results from eight 40 km/h frontal impacts with PMHS restrained by a three‐point belt in which 3D skeletal displacements were obtained for the head, spine, pelvis and shoulders. These data were used to construct corresponding kinematic response corridors to be used as biofidelity targets for the evaluation and development of frontal impact ATDs and computational models.
VI. ACKNOWLEDGEMENT
US Department of Transportation National Highway Traffic Safety Administration provided both technical
and financial support via Cooperative Agreement Nos. DTNH22‐06‐H‐00050 and DTNH22‐09‐H‐00247. Japan
Automobile Research Institute (JARI) provided support for three of the tests. Note that the views expressed in
this paper are those of the authors and not of the sponsors.
VII. REFERENCES
[1] WHO, Global status report on road safety: time for action, Technical Report, World Health Organization, 2009.
[2] WHO, World health statistics, Technical Report, World Health Organization, 2008. [3] Viano, DC, Ridella, S, Crash Causation: a Case Study of Fatal Accident Circumstances and Configurations, SAE
Transactions, Paper No. 960458, Warrendale, PA: Society of Automotive Engineers, 1996. [4] Elvik, R, Vaa, T, The handbook of road safety measures, Elsevier Science ,Amsterdam, 2004. [5] NHTSA, Motor vehicle occupant protection facts 2006, Washington, DC, National Highway Traffic Safety
Administration, 2008. [6] NHTSA, Fatalities in Frontal Crashes Despite Seat Belts and Air Bags. Review of All CDS Cases Model and
Calendar Years 2000‐2007 122 Fatalities. HS 811 202, September, NHTSA US DOT, Washington, DC, 2009. [7] Huelke DF, Sherman HW, Murphy MJ, Kaplan RJ, Effectiveness of Current and Future Restraint Systems in
Fatal and Serious Injury Automobile Crashes. Data From On‐Scene Field Accident Investigations. Paper 790323, Society of Automotive Engineers (SAE), 1979.
[8] Backaitis S, Dalmotas D, Injury patterns and injury sources of unrestrained and three‐point belt restrained car occupants in injury producing frontal collisions, Annual Proceedings of Association for the Advancement of Automotive Medicine (AAAM), 1985.
[9] Viano D, Melvin J, McLeary J, Madeira R, Shee T, Measurement of head dynamics and facial contact forces in the Hybrid III dummy, 30th Stapp Car Crash Conference, #861891, Society of Automotive Engineers (SAE) P‐189, 1986.
[10] Foret‐Bruno J, Le Cox J, Thomas C, Brutel G, In Depth Analysis of Frontal Collisions As Regards the Influence of Overlap and Intrusion On Occupant Severe and Fatal Injuries, International Technical Conference on the Enhanced Safety of Vehicles (ESV), pages 676‐683, 1994.
[11] Allsop D, and Kennett K, Skull and Facial Bone Trauma, Accidental Injury: Biomechanics and Prevention‐ 2nd Edition, pages 253‐276, Springer, New York, 2002.
IRC-12-21 IRCOBI Conference 2012
- 153 -
[12] Morris A, Welsh R, Frampton R, Charlton J, Fildes B, An Overview of Requirements for the Crash Protection of Older Drivers, Annual Proceedings of Association for the Advancement of Automotive Medicine (AAAM), Tempe, USA, pages 141‐156, 2002.
[13] Morris A, Welsh R, Hassan A, Requirements for the Crash Protection of Older Vehicle Passengers, Annual Proceedings of Association for the Advancement of Automotive Medicine (AAAM), Lisbon, Portugal, pages 165‐180, 2003.
[14] Kent R, Balandin D, Bolotnik N, Pilkey W, Purtsezov S, Optimal control of restraint forces in an automobile impact. Journal of Dynamic Systems, Measurement, and Control, 129, pages 415‐424, 2007.
[15] Rouhana SW, Bedewi PG, Sundeep VK, Prasad P, Zwolinski JJ, Meduvsky AG, Rupp JD, Jeffreys TA, Schneider LW, Biomechanics of 4‐Point seat belt systems in frontal impacts, Stapp Car Crash Journal, 47, pages 367‐399, 2003.
[16] Bostrom O, Haland Y, Benefits of a 3+2 point belt system and an inboard torso side support in frontal, far‐side and rollover crashes, Proceedings of International Technical Conference on the Enhanced Safety of Vehicles (ESV), Paper 451, Nagoya, Japan, 2003.
[17] Forman J, Lessley DJ, Kent RW, Bostrom O, Pipkorn B, Whole‐body Kinematic and Dynamic Response of Restrained PMHS in Frontal Sled Tests. Stapp Car Crash Journal, 50, pages 299‐336, 2006.
[18] Forman JL, Lopez‐Valdez F, Lessley DJ, Kindig M, Kent RW, Kuppa S, Bostrom O, Rear seat occupant safety; an investigation of a progressive force‐limiting, pretensioning 3‐point belt system using adult PMHS in frontal sled tests, Stapp Car Crash Journal, 53, pages 49‐74, 2009.
[19] Shaw G, Parent D, Purtsezov S, Lessley D, Crandall J, Kent R, Guillemot H, Ridella S, Takhounts E, Martin P, Impact response of restrained PMHS in frontal sled tests: skeletal deformation patterns under seat belt loading, Stapp Car Crash Journal, 53, pages 1‐48, 2009.
[20] Lessley D, Shaw G, Riley P, Forman J, Crandall J, Assessment and Validation of a Methodology for Measuring Anatomical Kinematics of Restrained Occupants During Motor Vehicle Collisions, Journal Biosensors and Bioelectronics, S1, 2011.
[21] Crandall J, Lessley D, Shaw G, Ash J, Displacement response of the spine in restrained PMHS during frontal impacts, Japanese Society of Automotive Engineering Annual Congress, Yokohama, Japan, 2012.
[22] Shaw CG, Parent DP, Purtsezov S, Lessley DJ, Kerrigan JR, Shin J, Crandall JR, Zama Y, Ejima S, Kamiji K, Yasuki T, Frontal Impact PMHS Sled Tests for FE TORSO Model Development. Proceedings of IRCOBI Conference, York, United Kingdom, 2009.
[23] Schneider LW, Robbins DH, Pflug MA, Snyder RG, Anthropometry of Motor Vehicle Occupants, Vol. 3, Specifications and Drawings, Report HS‐806 717, UMTRI‐83‐53‐2,UMTRI, 1983.
[24] Society of Automotive Engineers, SurfaceVehicle Recommended Practice J211‐1 –Instrumentation for Impact Test – Part 1 –Electronic Instrumentation, Warrendale, PA, 2003..
[25] Wu G, van der Helm FCT, Veeger HEJ, Makhsous M, Van Roy P, Anglin C, Nagels J, Karduna AR, McQuade K, Wang X, ISB recommendation on definitions of joint coordinate systems of various joints for the reporting of human joint motion‐‐part II: shoulder, elbow, wrist and hand, Journal of Biomechanics, 5, 38, pages 981‐992, 2005.
[26] Lessley DJ, Crandall JR, Shaw CG, Kent RW, Funk JR, A Normalization Technique for Developing Corridors from Individual Subject Responses, Society of Automotive Engineers, Paper 2004‐01‐0288, 2004.
[27] Shaw JM, Herriott RG, McFadden JD, Donnelly BR, Bolte JH, Oblique and Lateral Impact Response of the PMHS Thorax, Stapp Car Crash Journal, 50, pages 147‐167, 2006.
[28] Arbogast KB, Balasubramanian S, Seacrist T, Maltese MR, Garcia‐Espana JF, Kent RW, Tanji H, Higuchi K, Comparison of head and spinal kinematics for children and adults in low‐speed frontal crashes, Stapp Car Crash Journal, 53, pages 329–372, 2009.
[29] Lopez‐Valdes FJ, Lau A, Lamp J, Riley P, Lessley DJ, Damon A, Kindig M, Kent R, Balasubramanian S, Seacrist T, Maltese MR, Arbogast KB, Higuchi K, Tanji H, Analysis of spinal motion and loads during frontal impacts; Comparison between PMHS and ATD, Annual Proceedings of Association for the Advancement of Automotive Medicine (AAAM), 54, pages 61‐78, 2010.
[30] Parent D, Lessley D, Shaw G, Crandall J, Identification of anatomical landmarks for whole‐body kinematic measurement in the THOR Mod Kit frontal impact ATD, Japanese Society of Automotive Engineering Annual Congress, Yokohama, Japan, 2012.