Whole genome comparisons revealpanmixia among fall armyworm(Spodoptera frugiperda) from diverselocationsKatrina A. Schlum1, Kurt Lamour2, Caroline Placidi de Bortoli2, Rahul Banerjee2, Robert Meagher3, Eliseu Pereira4,Maria Gabriela Murua5, Gregory A. Sword6, Ashley E. Tessnow6, Diego Viteri Dillon7, Angela M. Linares Ramirez8,Komivi S. Akutse9, Rebecca Schmidt-Jeffris10, Fangneng Huang11, Dominic Reisig12, Scott J. Emrich1,13* andJuan Luis Jurat-Fuentes1,2*
Abstract
Background: The fall armyworm (Spodoptera frugiperda (J.E. Smith)) is a highly polyphagous agricultural pest withlong-distance migratory behavior threatening food security worldwide. This pest has a host range of > 80 plantspecies, but two host strains are recognized based on their association with corn (C-strain) or rice and smallergrasses (R-strain). The population genomics of the United States (USA) fall armyworm remains poorly characterizedto date despite its agricultural threat.
Results: In this study, the population structure and genetic diversity in 55 S. frugiperda samples from Argentina,Brazil, Kenya, Puerto Rico and USA were surveyed to further our understanding of whole genome nuclear diversity.Comparisons at the genomic level suggest a panmictic S. frugiperda population, with only a minor reduction ingene flow between the two overwintering populations in the continental USA, also corresponding to distinct hoststrains at the mitochondrial level. Two maternal lines were detected from analysis of mitochondrial genomes. Wefound members from the Eastern Hemisphere interspersed within both continental USA overwinteringsubpopulations, suggesting multiple individuals were likely introduced to Africa.
Conclusions: Our research is the largest diverse collection of United States S. frugiperda whole genome sequencescharacterized to date, covering eight continental states and a USA territory (Puerto Rico). The genomic resourcespresented provide foundational information to understand gene flow at the whole genome level among S.frugiperda populations. Based on the genomic similarities found between host strains and laboratory vs. fieldsamples, our findings validate the experimental use of laboratory strains and the host strain differentiation based onmitochondria and sex-linked genetic markers extends to minor genome wide differences with some exceptionsshowing mixture between host strains is likely occurring in field populations.
* Correspondence: [email protected]; [email protected] Science and Technology Graduate Program, University ofTennessee, Knoxville, TN 37996, USAFull list of author information is available at the end of the article
Schlum et al. BMC Genomics (2021) 22:179 https://doi.org/10.1186/s12864-021-07492-7
BackgroundLarvae of the fall armyworm, Spodoptera frugiperda (J.E.Smith, 1797) (Lepidoptera: Noctuidae), are a highly pol-yphagous agricultural pest affecting key food and fiberstaples such as corn (Zea mays L.), cotton (Gossypiumspp. L.), sorghum (Sorghum bicolor L.), rice (Oryzasativa L.), and vegetable crops [1]. Damage by S. frugi-perda in its native subtropical range in the Americas re-sults in 15–100% yield loss, depending on the level ofinfestation [2]. In most of the continental USA this pestdoes not diapause or survive cold winters. Overwinteringpopulations in southern Texas and Florida migratenorthward yearly over several generations to populatenorthern regions in USA and Canada [3].For more than a decade, effective control of S. frugi-
perda in the Western hemisphere has been providedmainly by genetically modified corn and cotton produ-cing insecticidal Cry and Vip3A proteins from the bac-terium Bacillus thuringiensis (Bt). However, resistance toCry1F, Cry1Ab and Cry1A.105 insecticidal proteinsquickly developed in Puerto Rico and the continentalUSA (Florida and North Carolina) [4, 5], as well as Brazil[6] and Argentina [7]. More recently, the economic im-portance of this pest has further increased with its intro-duction in sub-Saharan Africa [8], subsequent spread toIndia and Southeastern Asia [9], and more recentlyAustralia [10]. An estimate using data from twelve Afri-can countries indicates that yield losses resulting from S.frugiperda injury could be 21–53% of their annual cornproduction, which equals to US$2.5–$6.2 billion inlosses [11]. While yet to be detected in molecularscreens [12], resistance alleles to Bt toxins could havebeen carried by invasive S. frugiperda to the Easternhemisphere.Populations of S. frugiperda are composed of sympat-
ric mixtures of two genetically differentiated strainsbased on host preference, a “rice” (R) strain feeding onrice, millet and smaller grasses, and a “corn” (C) strainfeeding preferentially on corn and sorghum [13, 14].There is evidence supporting that this differentiation in-volves reproductive incompatibility [15] and differentialsusceptibility to xenobiotics [16]. Signatures of positiveselection for genes involved in chemoreception, detoxifi-cation, and digestion were also detected in whole-genome comparisons of nine C- and R-strain individuals[17]. Being morphologically indistinguishable, C and Rindividuals are discriminated using genetic markers lo-cated on the mitochondrial COI (cytochrome oxidasesubunit I) and sex-linked (Z chromosome) Tpi (triose-phosphate isomerase) genes [18–21]. However, host pref-erence is not absolute and discrepancies amonghaplotype markers have been reported. For example, theTpi marker agrees with assortative mating and host as-sessments [22] in describing S. frugiperda samples from
corn in the Eastern Hemisphere as C-strain, yet a pre-dominant COI-R strain marker is obtained in these col-lections [9]. These conflicting results may reflectinterstrain hybridization [22] or be driven by maternallyinherited symbionts that skew the distribution and diver-sity of certain haplotypes [23]. Additional factors influ-encing these conflicting haplotyping results may includeincomplete lineage sorting and plant host behavioralplasticity.Nucleotides found at COI host strain marker sites have
been commonly grouped into “haplotypes” with relativeproportions associated to geographic origin [24], enab-ling differentiation of “Texas” and “Florida” overwinter-ing S. frugiperda populations in the USA. Migratorystudies with these haplotypes determined that the“Texas” population is distributed throughout South,Central and North America [25, 26], while the “Florida”population locates to Florida and the Caribbean but mi-grates through the eastern USA seaboard to reachCanada [27, 28]. Haplotype profiling of S. frugiperdafrom Africa, India and Southeastern Asia supports intro-ductions in Africa of individuals from the “Florida”population and subsequent spread to Asia [9, 12].In this work, we collected and sequenced 55 genomic
DNA (gDNA) samples of S. frugiperda from three conti-nents, with an emphasis on C-strain individuals fromNorth and South America. Genome-wide comparisonsallowed testing for gene flow between geographically dis-tant S. frugiperda populations and comparing genetic di-versity between field and laboratory-reared S. frugiperda.Based on Fst values there is limited genetic differenti-ation between Texas vs. Florida populations and samplesfrom these locations display similar genetic nucleotidediversity. Host strain differentiation was supported bynuclear and mitochondrial genome differences. Com-parison of mitochondrial genomes detected two clusterswhere the clusters correlate by and large with host strainand resistance to the Cry1F toxin. The exceptions to thiscorrelation suggest that C-strain individuals based onnuclear genome have likely mated with R-strain individ-uals. We also observed no detectable reduction in gen-etic diversity in well-established S. frugiperda laboratory-reared colonies, which supports using laboratory strainsof this pest as a model for field populations.
ResultsHost strain typingOf the 55 S. frugiperda samples used in this study, al-most half (26, 47.3%) originated from field collectionsrepresenting eight states in the USA. The average map-ping rate, defined as the proportion of sample sequen-cing reads mapping to the reference genome assembly,was 88.2% with a range of between 60.62 to 96.82%, ac-cording to SAMtools flagstat. Identification of the C-
Schlum et al. BMC Genomics (2021) 22:179 Page 2 of 12
and R- host strains for each individual was performedusing nuclear Tpi and mitochondrial COI geneticmarkers described elsewhere [26]. Given that samplecollections were from or around cornfields, we expectedto observe a majority of C-strain samples. The COI1164marker identified all samples as C-strain. In contrast,typing based on the nucleotides at the TPi183 site re-sulted in 42 samples identified as C-strain individuals(C/C), 8 as R-strain individuals (T/T), 3 as interstrainhybrids (C/T) and 2 that were undetermined due to lowsequencing coverage at this locus. All eight identified R-strain samples were from the USA (3 from Texas, 2 fromMaryland and Tennessee each, and 1 from Puerto Rico).
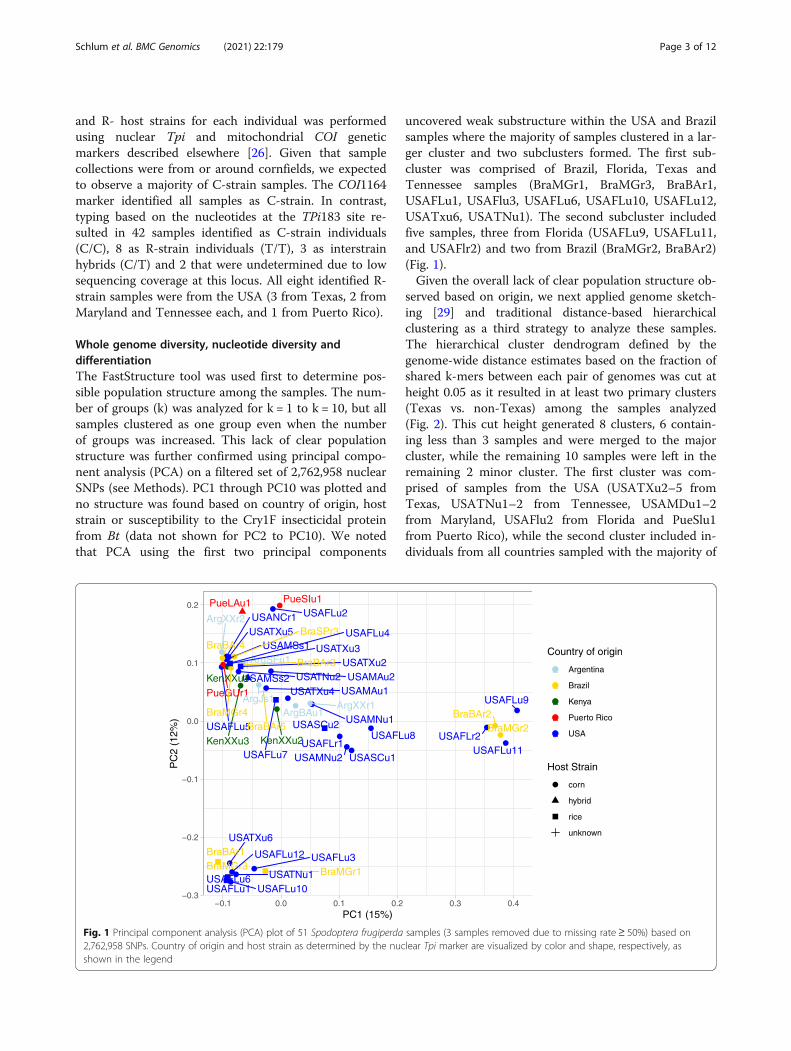
Whole genome diversity, nucleotide diversity anddifferentiationThe FastStructure tool was used first to determine pos-sible population structure among the samples. The num-ber of groups (k) was analyzed for k = 1 to k = 10, but allsamples clustered as one group even when the numberof groups was increased. This lack of clear populationstructure was further confirmed using principal compo-nent analysis (PCA) on a filtered set of 2,762,958 nuclearSNPs (see Methods). PC1 through PC10 was plotted andno structure was found based on country of origin, hoststrain or susceptibility to the Cry1F insecticidal proteinfrom Bt (data not shown for PC2 to PC10). We notedthat PCA using the first two principal components
uncovered weak substructure within the USA and Brazilsamples where the majority of samples clustered in a lar-ger cluster and two subclusters formed. The first sub-cluster was comprised of Brazil, Florida, Texas andTennessee samples (BraMGr1, BraMGr3, BraBAr1,USAFLu1, USAFlu3, USAFLu6, USAFLu10, USAFLu12,USATxu6, USATNu1). The second subcluster includedfive samples, three from Florida (USAFLu9, USAFLu11,and USAFlr2) and two from Brazil (BraMGr2, BraBAr2)(Fig. 1).Given the overall lack of clear population structure ob-
served based on origin, we next applied genome sketch-ing [29] and traditional distance-based hierarchicalclustering as a third strategy to analyze these samples.The hierarchical cluster dendrogram defined by thegenome-wide distance estimates based on the fraction ofshared k-mers between each pair of genomes was cut atheight 0.05 as it resulted in at least two primary clusters(Texas vs. non-Texas) among the samples analyzed(Fig. 2). This cut height generated 8 clusters, 6 contain-ing less than 3 samples and were merged to the majorcluster, while the remaining 10 samples were left in theremaining 2 minor cluster. The first cluster was com-prised of samples from the USA (USATXu2–5 fromTexas, USATNu1–2 from Tennessee, USAMDu1–2from Maryland, USAFlu2 from Florida and PueSlu1from Puerto Rico), while the second cluster included in-dividuals from all countries sampled with the majority of
Fig. 1 Principal component analysis (PCA) plot of 51 Spodoptera frugiperda samples (3 samples removed due to missing rate≥ 50%) based on2,762,958 SNPs. Country of origin and host strain as determined by the nuclear Tpi marker are visualized by color and shape, respectively, asshown in the legend
Schlum et al. BMC Genomics (2021) 22:179 Page 3 of 12
samples from USA representing Florida/eastern sea-board. The three samples from Puerto Rico were in-terspersed across both clusters and always clusteredwith Florida samples, yet genomic distances betweenclusters were small (< 0.05 Mash distance). Similar tothe PCA clusters, these two clusters did not correlatewith host strain designation or geographic origin, withthe first cluster including both R- and C-strain sam-ples and the second cluster containing both R- andC-strain samples as well as three interstrain hybrids(Supplemental Fig. S1).Mash distance is a proxy for genome pairwise dis-
tance, with 0 representing identical genomes (all k-mers that comprise the sketches are present in bothsequences). The Mash distances across all countriessurveyed were averaged to be < 0.05 (Table S2, rangeof average distance was 0.043 to 0.045), probablyreflecting recent population expansion. Moreover,these Mash distances support that R and C-strainsare members of the same species, as the estimatedgenetic variation is comparable to at least 95%
average nucleotide identity (ANI), which is the ANIcutoff for eukaryotic species [29].
Gene flow between overwintering populations in the USAPrevious work based on the ratios of four pre-determined COI haplotypes suggested that the overwin-tering Florida S. frugiperda population is mostly repro-ductively isolated from the overwintering population inTexas, with genetic exchange mostly occurring at thenorth and south ends of the Appalachian mountainchain [27]. As mentioned above, we observed that C-strain samples from Texas and Florida/eastern seaboarddid not separate based on hierarchical clustering ofgenome-wide distances, and Florida samples were foundacross both groups (Fig. 2). Further, when comparingthe two R-strain samples from Texas and the twelve C-strain samples from Florida/eastern seaboard, we de-tected a low pairwise weighted Fst value (0.0115) basedon 2,726,958 SNPs. This very low Fst value suggests nopopulation separation at the nuclear level, supporting re-cent population separation or ongoing gene flow
Fig. 2 Dissimilarity heatmap of Mash distances across all 55 Spodoptera frugiperda samples, colored by country of origin as indicated. Twooutgroups (Spodoptera litura and Spodoptera exigua) were added. Samples were named as described in Materials and Methods
Schlum et al. BMC Genomics (2021) 22:179 Page 4 of 12
between Texas and Florida overwintering populations,independently of host strain.Based on the same Texas R-strain and Florida C-strain
groupings, mean diversity was determined. Mean diver-sity for the field samples from Texas R-strain and Flor-ida C-strain samples was estimated at 0.0016 and 0.0013,respectively (Fig. 3). Next, we determined the Fst valuebased on 406 mitochondrial SNPs found across all sam-ples in these groups. The mitochondrial Fst for Texas R-strain and Florida C-strain samples was estimated at0.7961. This Fst estimate being close to 1 suggests gen-etic differentiation between the R and C strains is thestrongest at the mitochondrial level, possibly due to twomain ancestral lineages. Although we see a stronger dif-ference between geographic regions than between R andC strains in this study, the estimated mitochondrial tonuclear Fst ratio of 46.8 is consistent with previously re-ported sex-based differences in dispersal [30] and/ormating preference differences between strains [31]. Evenso, our data suggest hybridization occurs and some C-
strain nuclear genomes have a clearly R-strain associatedmitochondrial genome (see Fig. 5).
Laboratory vs. field diversityLaboratory-reared strains of S. frugiperda are commonlyused for diverse physiological, toxicological and geneticstudies, yet their genetic resemblance to field popula-tions has not been investigated. To investigate the differ-entiation level between two well established laboratorystrains (> 20 years) originating from the same location inthe USA (Mississippi, MS) and all field USA populationssurveyed, we estimated a weighted Fst (fixation index).As shown in Table 1, there was moderate differentiationbetween the MS laboratory strains and field USA fieldpopulations, with an Fst range of 0.0310 to 0.0961. Mod-erate differentiation was also observed when comparingthe MS laboratory strains with other more recentlyestablished (< 10 years) laboratory populations fromNorth Carolina (NC) and Florida (FL), with an Fst rangeof 0.0131to 0.1302. The samples least differentiated(Fst = 0.0131) from the MS laboratory populations wereFL laboratory, while the most distinct (Fst = 0.0961) werethe samples collected from Maryland (MD). Overall,these moderate Fst values [32] suggest small differencesat the allelic level between laboratory and field-collectedgroups. Genetic diversity in the two laboratory MS col-onies was slightly different but comparable to diversityin field USA populations (Fst = 0.0761 on average) and toeither of the two overwintering populations (Fst =0.0398).Additionally, we surveyed overall genomic diversity
using 3 kbp windows and estimated mean diversity forthe same two MS laboratory strains compared to all fieldand laboratory S. frugiperda samples surveyed. Mean nu-clear diversity was 0.0013 for Benzon (USAMSs1) andSIMRU (USAMSs2) laboratory strains (n = 2), comparedto 0.0016 for field Texas samples (n = 8), and 0.0014 forfield Florida/eastern USA samples (n = 16).
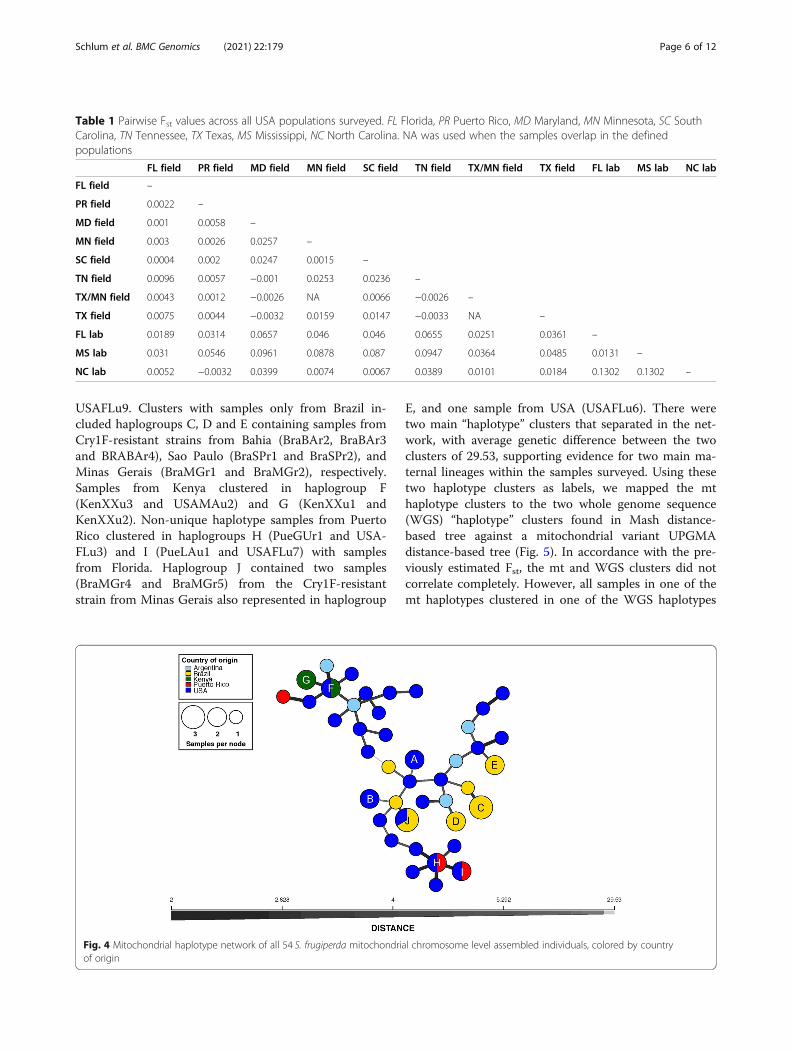
Diversity across the mitochondrial genomeWe investigated the maternal lineage among all but oneof the S. frugiperda samples (due to lack of a completemitochondrial genome in sample BraBAr4) by compar-ing genetic diversity of whole mitochondrial (mt) ge-nomes. Using a total of 390 SNPs, we generated ahaplotype network as described in Materials andMethods (Fig. 4). Consistent with a large amount ofstanding variation in the species, the mitochondrial se-quences appeared unique except for 22 samples formingten haplogroups (A to J) with more than one sample(Fig. 4). Two of these haplogroups contained only sam-ples from USA, haplogroup A formed by samples of thesame laboratory S. frugiperda strain (USAMSs1 andUSAMSs2), and haplogroup B containing USAFLu5 and
Fig. 3 Nucleotide diversity box plots between 14 C-strain Florida(FL) vs. 2 R-strain Texas (TX) samples
Schlum et al. BMC Genomics (2021) 22:179 Page 5 of 12
USAFLu9. Clusters with samples only from Brazil in-cluded haplogroups C, D and E containing samples fromCry1F-resistant strains from Bahia (BraBAr2, BraBAr3and BRABAr4), Sao Paulo (BraSPr1 and BraSPr2), andMinas Gerais (BraMGr1 and BraMGr2), respectively.Samples from Kenya clustered in haplogroup F(KenXXu3 and USAMAu2) and G (KenXXu1 andKenXXu2). Non-unique haplotype samples from PuertoRico clustered in haplogroups H (PueGUr1 and USA-FLu3) and I (PueLAu1 and USAFLu7) with samplesfrom Florida. Haplogroup J contained two samples(BraMGr4 and BraMGr5) from the Cry1F-resistantstrain from Minas Gerais also represented in haplogroup
E, and one sample from USA (USAFLu6). There weretwo main “haplotype” clusters that separated in the net-work, with average genetic difference between the twoclusters of 29.53, supporting evidence for two main ma-ternal lineages within the samples surveyed. Using thesetwo haplotype clusters as labels, we mapped the mthaplotype clusters to the two whole genome sequence(WGS) “haplotype” clusters found in Mash distance-based tree against a mitochondrial variant UPGMAdistance-based tree (Fig. 5). In accordance with the pre-viously estimated Fst, the mt and WGS clusters did notcorrelate completely. However, all samples in one of themt haplotypes clustered in one of the WGS haplotypes
Table 1 Pairwise Fst values across all USA populations surveyed. FL Florida, PR Puerto Rico, MD Maryland, MN Minnesota, SC SouthCarolina, TN Tennessee, TX Texas, MS Mississippi, NC North Carolina. NA was used when the samples overlap in the definedpopulations
FL field PR field MD field MN field SC field TN field TX/MN field TX field FL lab MS lab NC lab
FL field –
PR field 0.0022 –
MD field 0.001 0.0058 –
MN field 0.003 0.0026 0.0257 –
SC field 0.0004 0.002 0.0247 0.0015 –
TN field 0.0096 0.0057 −0.001 0.0253 0.0236 –
TX/MN field 0.0043 0.0012 −0.0026 NA 0.0066 −0.0026 –
TX field 0.0075 0.0044 −0.0032 0.0159 0.0147 −0.0033 NA –
Fig. 4 Mitochondrial haplotype network of all 54 S. frugiperda mitochondrial chromosome level assembled individuals, colored by countryof origin
Schlum et al. BMC Genomics (2021) 22:179 Page 6 of 12
(“one” in purple in Fig. 5), while the other mt haplotypecontained a mix of WGS haplotypes. While not all sam-ples were phenotyped, all samples classified as resistantto the Cry1F toxin clustered in the mt haplotype groupwith majority of corn strain samples.
DiscussionWe report on the genome-level comparison of 55 S. fru-giperda samples from diverse locations, mostly from thenative range in the Americas but also including samplesfrom an African location (Kenya) where the insect is adevastating exotic pest. While using the C-strain S. frugi-perda genome for alignments could have underestimateddiversity in R-strain individuals, this approach is sup-ported by previous surveys using both corn and rice ge-nomes with minimal differences found based on thenumber of variants called and Fst values [33].The population structure of the 55 genomic S. frugi-
perda samples was surveyed using parametric and non-parametric methods. Based on FastStructure
(parametric), no population structure was found eitherwithin samples from the Eastern Hemisphere or betweenthe Eastern and Western Hemisphere samples. Sincemethods based on parametric estimation of allele fre-quencies methods are sensitive to sample size, one possi-bility is that the lack of structure detected is a reflectionof the relatively small number of R-strain samples (only8 individuals and potentially 2 hybrids) analyzed. A moreeven distribution would address potential limited sam-pling of some locations surveyed, especially samplesrepresenting the Eastern Hemisphere (e.g. Africa). How-ever, results from a previous study of genetic S. frugi-perda diversity in the Western Hemisphere usingamplified fragment length polymorphism (AFLP) alreadysupported a large interbreeding population [34].Both PCA and FastStrucutre analyses found little to
no population structure based on the nuclear genome.Furthermore, the Mash distance-based hierarchical clus-ters showed weak correlation between nuclear genomeand host strain. In contrast, the Hamming Distance tree
Fig. 5 UPGMA distance-based tree on biallelic variant SNPs in 54 mitochondrial chromosome level assembled individuals rooted with Spodopteralitura as an outgroup
Schlum et al. BMC Genomics (2021) 22:179 Page 7 of 12
based on the mitochondrial genome detected two sub-populations within the samples surveyed, which were as-sociated with host strain and the southern Texas andFlorida subpopulations previously described based onfour mitochondrial COI haplotypes [35]. Further, weidentified individuals that appeared to have a C-strainnuclear genome with an R-strain associated mitochon-dria (maternal lineage). This discrepancy is consistentwith conflicting host strain assignments obtained usingspecific genetic markers between R-strain and interstrainhybrids, as previously reported [22]. The lack of consist-ent clustering based on host strain at the nuclear gen-ome level and the weak correlation betweenmitochondrial haplotype and nuclear genome groupingssuggest that either there is some level of hybridizationbetween host strains or that the current locus markersmay not be sufficient to discriminate host strains. Al-though previous research found the groupings based ona neighbor joining tree of nuclear genome SNPs to cor-relate with host strain (9 corn and 9 rice S. frugiperdasamples from Mississippi) [17], that finding could be af-fected by limited sample size. Low amount of geneticvariation across the whole nuclear genome between theC- and R-strains is suggestive of genome differentiationafter the ecological differentiation of host strains andthat reproductive and behavioral barriers are isolating C-and R-strains [36]. In testing this hypothesis, future re-search should involve analyses of a larger sample size ofC- and R-strain individuals from Texas and Florida.Our analysis included samples collected from locations
(Maryland & Tennessee) close to predicted hybridizationzones for TX and FL overwintering S. frugiperda popula-tions [27], and as expected these associated with bothgeographic regions. There were also three exceptions tothe geographic separation: two Texas samples that werefound in the predominately Florida represented groupand one Florida sample was found in the predominatelyTexas population. This observation suggests that the re-productive isolation between Texas and Florida/Easternseaboard is not absolute and mating may be occurring inoverlapping locations, as previously suggested [27]. Fu-ture work should include increased sampling from po-tential hybrid zones (Georgia/New York) and Texas. TheMash distance-based clusters suggested that Puerto Ricosamples are genetically closer to Florida, since they werefound in sub-clusters with Florida-based samples. How-ever, due to low representation and small genomic dis-tances between each cluster, our data is not able to showconclusive support for migration models suggesting sig-nificant exchanges between S. frugiperda from PuertoRico and Florida [28].Mitochondrial Fst estimates obtained between C- and
R- host strains (0.7961) were highly similar to the Fstvalue (0.938) from a prior analysis of 9 corn and 9 rice
sympatric samples from Mississippi (USA) [17]. More-over, the nuclear DNA Fst found in our study comparingall corn versus rice strains (0.0173) is also similar to theprevious study’s estimate (0.019) [17]. The two mito-chondrial haplotypes found in our analysis could be ex-plained by selective mating or some form ofreproductive incompatibility. Despite the fact that sus-ceptibility to Cry1F was not known for all samples, weobserved that all Cry1F-resistant strains clustered to oneof the mitochondrial haplotypes, despite their geographicorigin. Although speculative given the comparatively lownumber of confirmed Cry1F resistant samples, thisgrouping may reflect partitioning of resistance with thehaplotype group only containing C-strain samples. Fur-ther work including Cry1F-resistant R-strain sampleswould be necessary to test for associations betweenmitochondrial haplotype and resistance to Cry1F.One possibility to explain the mitochondrial haplo-
types detected could be that they are based on repro-ductive incompatibility from infection by parasites suchas Wolbachia [37]. However, we only detected shortfragments (< 100 bp) matching to the RefSeq Wolbachiagenomes on NCBI as of May 9, 2020 using BLAST (datanot shown). This observation is in agreement with legand head tissues being mostly used for isolating geneticmaterial. In testing for Wolbachia infection, we ex-tracted genomic DNA from a limited number of avail-able abdominal samples and performed sequencing ofPCR amplicons using primers amplifying the outer sur-face protein precursor (wsp) Wolbachia gene. Ampliconsof the same size (Fig. S2) and containing exactly thesame sequence (Fig. S3), were detected in all samplestested independently of mitochondrial haplotype. Theseobservations support no influence of Wolbachia infec-tion on reproductive isolation of clustered populations.However, due to lack of detailed data on Wolbachiastrains infecting S. frugiperda, a more detailedcharacterization would be needed to conclusively ruleout the possibility of incompatibility. Further, lack ofclear correspondence between genome-based andmitochondria-based haplotypes suggest on-goinghybridization between C- and R-strains, consistent withdetection of two potential hybrids among our 54 sam-ples. Consistent lack of concordance between the nu-clear and mitochondrial Fst values suggests thatbiological mitochondria-nuclear interactions are notmaintained, further supporting that the samples analyzedare part of a panmictic population with little to no popu-lation structure.Previous reports providing comparisons of genetic di-
versity in laboratory-reared and wild populations of thelepidopteran Plutella xylostella [38], Tephritid fruit flies[39], and locusts [40] support loss of allele number andheterozygosity during adaptation to mass rearing. In
Schlum et al. BMC Genomics (2021) 22:179 Page 8 of 12
contrast, in Drosophilid fruit flies [41] and in long-established laboratory lines of Anastrepha fraterculus(Tephritidae) [42] high genetic variability remained. Wecompared diversity in two long-established (> 20 years)S. frugiperda laboratory lines. Both laboratory lines, Ben-zon (USAMSs1) and SIMRU (USAMSs2), originatedfrom field collections in Mississippi and they were theleast differentiated from the TX/MN field collections.Interestingly, more recently established laboratory popu-lations from NC and FL [5] presented lower Fst valuescompared to field samples. This moderate differentiationbetween laboratory and field samples could be indicativeof good culture management involving maintenance oflarge populations and/or regular introgression of fieldindividuals. Another possibility could be that some ofthe field samples compared display low diversity, yet thisis unlikely given samples from Central and South Amer-ica (for Texas population) and the Caribbean (for Floridapopulations) based on current S. frugiperda migratorymodels [25]. It is important to consider that despite thelack of overall differentiation between laboratory andfield S. frugiperda, differentiation probably occurs duringadaptation to mass rearing, resulting in selection of spe-cific alleles that may not be representative of field popu-lations. Thus, while our observations suggest laboratorystrains contain genetic diversity similar to field popula-tions, laboratory strains may have specific allele frequen-cies that may not be representative of field populations.
ConclusionsOverall, this study provides a diverse characterization ofS. frugiperda whole and mitochondrial genome diversity.Findings from the study support lack of clear S. frugi-perda population structure among the locations sam-pled. Only mitochondrial genomes indicated twodifferent maternal lines mostly separating host strains.The genomic resources generated allow further explor-ation of gene flow and how it may affect management ofS. frugiperda as an expanding global superpest usinglaboratory-reared and field-collected individuals.
MethodsSamples and strain typingDetails of the 55 laboratory and field-collected S. frugi-perda samples sequenced are found in SupplementaryTable 1 and Fig. S4. Adults (moths) were captured usingsex pheromone baited traps [43], with most collectionsites near corn plantings to optimize trap capture effi-ciency of C-strain males. Laboratory-reared sampleswere obtained from rearing facilities. Susceptibility toCry1F toxin from B. thuringiensis for these laboratorysamples was tested in bioassays presented elsewhere [5,44–46]. Larval samples were collected at field and la-boratory rearing locations and used when available. The
collected specimens were identified as S. frugiperda bymorphology features [47] and stored at − 20 °C until re-quired for analysis.We followed a sample naming protocol that included
the first three letters representing the country of origin(Bra for Brazil, Arg for Argentina, USA for United Statesof America, Ken for Kenya, and Pue for Puerto Rico),the next two letters representing the first two letters ofthe state/province of origin (SP for Sao Paulo, TX forTexas, etc. XX when unknown), and the third letterrepresenting the Cry1Fa susceptibility phenotype whenknown (“r” for resistant, “s” for susceptible and “u” forunknown). A number was used when necessary to differ-entiate samples with the same geographic origin andCry1F susceptibility phenotype.Host strain (C versus R) was determined based on se-
quence identity at specific marker positions in referencemtCoI1164 and Tpi183 sequences, as described else-where [12]. The mitochondrial COI1287 marker identi-fied all samples as C-strain, so the nuclear Tpi183marker was used as a more reliable marker of host strain[21]. The mitochondrial COI1164 marker was not usedbecause it did not fall under any of the pre-defined COIhaplotypes [25] for any of the samples.
DNA extraction, library preparation, and sequencingGenomic DNA was isolated from individual carcasses offifth instar S. frugiperda larvae after dissecting the guttissue or from legs or heads of adults using the PureLink Genomic DNA mini kit (Invitrogen), followingmanufacturer’s protocols, and then quantified using aNanodrop spectrophotometer (Thermo Scientific). Ex-tracted DNA was then sheared randomly to between 250and 500 bp using a Covaris M220 focused ultrasonicator(Woburn, MA), according to manufacturer’s instruc-tions. The fragmented DNA was then ligated with dual-indices using a KAPA Hyper prep PCR-free library kit(Roche) according to the manufacturer’s directions. Theligated fragments were quantified using quantitativePCR and a KAPA Library quantification kit (Roche), andthen submitted for sequencing on an Illumina HiSeqXdevice running a 2 × 150 bp paired-end configuration(Admera Health, NJ). Raw paired-end sequence reads foreach sample (55) are available for download in the NCBISequence Read Archive (SRA) under SRR12044614-SRR12044668 with associated metadata available underNCBI BioProject id PRJNA640063. The raw data wasprocessed to remove low quality reads using the CLCGenomics Workbench v9.5.2 (Qiagen) trim functionwith default parameters.
Filtering and mappingRaw reads were quality-trimmed at both ends, filteredfor adapter sequences and error corrected for known
Schlum et al. BMC Genomics (2021) 22:179 Page 9 of 12
Illumina artifacts and PhiX sequencing control usingBBDuk (https://jgi.doe.gov/data-and-tools/bbtools/) withoptions trimq = 15 and filter = 23. Further quality controland confirmation that adapter and non-relevant (con-taminants, primer artifacts) sequences were removedfrom filtered reads were performed using FastQC [48].Given the prevalence of C-strain among our samplesand similar number of variants called when using bothS. frugiperda corn and rice genomes [33], we mappedthe remaining reads to the S. frugiperda corn referencegenome (v3.1) downloaded from https://bipaa.genouest.org/sp/spodoptera_frugiperda_pub/ (assembled length of312Mb across 29,949 scaffolds [17]) using a Burrows-Wheeler aligner algorithm (bwa-mem) [49]. The averagemapping rate for all samples was determined by aver-aging the percentage of mapped alignments in the BAMfile per sample to the reference genome, as determinedby SAMtools flagstat [50].Variants were then called using the SAMtools mpileup
utility [50], resulting in detection of 126,977,977 singlenucleotide polymorphisms (SNPs) and indels. The unfil-tered dataset contained 120,398,863 SNPs. Three sam-ples (USATXu1, BraSPr2,BraSPr1 and BraMGr5) wereremoved from SNP analysis because they had missingvariant call rate greater than 50%, resulting in 51 sam-ples. Further filtering was applied using vcftools [51] tofilter out SNPs only, minor allele frequency being lessthan or equal to 0.05, genotype present in at least 50%of the 51 samples surveyed and PLINK2 [52] filteringonly 2 distinct alleles, removing mismatched alleles, zeroobservations at allele, and missing variant ID. This re-sulted in final filtered SNP dataset of 2,762,958. This fil-tered dataset was used on all nuclear SNP analyes: PCA,nucleotide diversity (pi) and Fst estimates.
PhylogenomicsThe Mash distance method was used to measure pairwisedissimilarity of genomic sequences [29]. One key advantageof sketching-based approaches is that they neither requirede novo genome assembly nor a pre-existing reference gen-ome to identify related individuals. The Mash method esti-mates sequence similarity via the Jaccard similaritycoefficient (the ratio of shared k-mers to total k-mers) for a“random” subset of k-mer pairs for each genome surveyed.The Jaccard similarity (J) is then used to calculate dissimi-larity between two genomes (D) as D = 1-J. All S. frugiperdaindividuals were sketched with Mash [29] using a 10,000sketch size, k-mer size of 21 and minimum copy of each k-mer equal to 2, per previous recommendations of repre-senting genomes with minimal computational costs [29].All sample sketches were screened against the Mash Refseqdatabase and other Spodoptera species (Spodoptera exigua,GCA_011316535.1; and Spodoptera litura, GCA_002706865.2) as outgroups.
SNP diversityWeighted Fst values as indicators of total genetic vari-ance in a subpopulation were calculated using VCFtools[51] by the Weir and Cockerham estimator on 1 kbp, 3kbp and 5 kbp windows. The variation in window sizewas used to confirm that there was little to no change inFst when the window was varied. For Fst calculationsusing the mitochondrial genome, each base pair positionwas compared. Nuclear genome (pi) values were calcu-lated using 1 kbp windows when comparing corn vs. ricehost strain, and 3 kbp when comparing Fst values foroverwintering FL/TX vs. USA laboratory samples. Wealso used 3 kbp windows for Fst comparisons across thenuclear genome with populations defined by mitochon-dria haplotype network groupings, Mash genome defined“haplotypes”, and host strain haplotypes. For all nucleo-tide diversity analyses, a total of 2,762,958 filtered SNPsas described in the Filtering and Mapping section wasused to assess diversity using VCFtools [51].
Mitochondrial genome assemblyMitochondrial sequences were extracted from the wholegenome sequence reads using NOVOplasty [53] with themitochondrial partial COI sequence MH932092.1 as theseed. A continuous complete mitochondrial chromosomeof around 15 kbp was generated for all 55 samples, exceptfor BraBAr5, which was excluded from further analysis.The whole mitochondrial FASTA sequences were assem-bled for each sample and then aligned via bwa-mem(https://github.com/lh3/bwa) with default options. Mito-chondrial variants were called using SAMtools mpileupbased on the S. frugiperda corn reference genome at Lepi-doDB (https://bipaa.genouest.org/sp/spodoptera_frugiperda_pub/). The vcf files were compressed usingSAMtools bgzip, indexed using SAMtools tabix andmerged using SAMtools BCFtools merge [50]. Missing ge-notypes were replaced with sequence at the mitochondrialreference genome from the S. frugiperda corn genome atLepidoDB. The vcf files were then filtered by removing 16multi-allelic sites and 92 uninformative sites due to beingfound in 2 samples or less via the informloci function inthe adegenet R package [54], resulting in 298 sitesremaining. These remaining mitochondrial sites were usedto build a haplotype network using the R package pegashaploNet function [55] with Euclidean distance and an in-finite site model used for building the network.
StructurePLINK –make-bed [56] was used to generate the inputfile to FastStructure [57], a variation of Structure madefor larger SNP datasets. FastStructure is a generativemodel-based approach based on Hardy-Weinberg equilib-rium assumptions between alleles and linkage disequilib-rium between genotyped loci. The FastStructure script
Schlum et al. BMC Genomics (2021) 22:179 Page 10 of 12
structure.py was used to determine k, the number of as-sumed populations or genetic groups that share a subsetof allele frequencies from k = 2 to 10. Then k = 2 waschosen by the FastStructure’s choosek.py script for modelcomplexity that maximizes marginal likelihood, and k = 1for model components to explain structure. Additionally,PCA eigenvalues and eigenvectors were generated usingPLINK 2.0 [52, 56] and visualized in R using ggplot2 [58].
AbbreviationsSNP: Single nucleotide polymorphism; C-strain: Corn strain; R-strain: Ricestrain
Supplementary InformationThe online version contains supplementary material available at https://doi.org/10.1186/s12864-021-07492-7.
Additional file 1: Supplementary Table 1. Describing details ofsamples analyzed, and Table 2 showing Mash distances based oncountry. Supplementary Figure S1. Showing clustering based on Mashdistances, Figure S2 showing amplification of Wolbachia in selectedsamples, Figure S3 showing the amplified sequences in Fig. S2, andFigure S4 showing the geographic locations sampled.
AcknowledgementsWe would like to thank Rodney Nagoshi for review and helpful comments.
Authors’ contributionsKAS performed the bioinformatics, interpreted the results, generated thefigures and drafted the manuscript. JLJF designed the experimental plan,coordinated the project, interpreted the results and edited/drafted themanuscript. SJE advised on all analyses, interpreted the resulted and edited/drafted the manuscript. KL performed all genomic sequencing. CPDB and RBperformed all sample prep. RM, EP, MGM, GAS, AET, DVD, AMLR, KSA, RSJ, FHand DH provided fall armyworm samples. All authors read, edited andapproved the manuscript for submission.
FundingThis project was funded by Agriculture and Food Research InitiativeFoundational Program competitive grant 2018–67013-27820 and HatchMultistate NC-246 from the US Department of Agriculture National Instituteof Food and Agriculture.
Availability of data and materialsSequence data presented in this study are available for download at theNCBI Sequence Read Archive (SRA) under SRR12044614-SRR12044668 withassociated metadata available under NCBI BioProject id PRJNA640063.
Declarations
Ethics approval and consent to participateNot applicable.
Consent for publicationNot applicable.
Competing interestsThe authors have no competing interests.
Author details1Genome Science and Technology Graduate Program, University ofTennessee, Knoxville, TN 37996, USA. 2Department of Entomology and PlantPathology, University of Tennessee, Knoxville, TN 37996, USA. 3USDA-ARSCenter for Medical, Agricultural and Veterinary Entomology (CMAVE), InsectBehavior and Biocontrol Research Unit, Gainesville, FL 32608, USA.4Departamento de Entomologia, Universidade Federal de Viçosa, Viçosa, MG36570, Brazil. 5Estación Experimental Agroindustrial Obispo Colombres,
T4101XAC Las Talitas, Tucumán, Argentina. 6Department of Entomology,Texas A&M University, College Station, TX 77843, USA. 7Department ofAgro-Environmental Sciences, Isabel Research Substation, University of PuertoRico, Isabela, PR 00662, USA. 8Department of Agro-Environmental Sciences,Lajas Research Substation, University of Puerto Rico, Lajas, PR 00667, USA.9International Centre of Insect Physiology and Ecology, Nairobi, Kenya.10USDA-ARS Temperate Fruit & Vegetable Research Unit, Wapato, WA 98951,USA. 11Department of Entomology, Louisiana State University AgriculturalCenter, Baton Rouge, LA 70803, USA. 12Department of Entomology and PlantPathology, North Carolina State University, Raleigh, NC 27695, USA.13Department of Electrical Engineering and Computer Science, University ofTennessee, Knoxville, TN, USA.
Received: 16 October 2020 Accepted: 26 February 2021
Paula-Moraes SV, Peterson J, Hunt T. Host plants of Spodoptera frugiperda(Lepidoptera: Noctuidae) in the Americas. Afr Entomol. 2018;26(2):286–300.
2. Hruska AJ, Gould F. Fall armyworm (Lepidoptera: Noctuidae) and Diatraealineolata (Lepidoptera: Pyralidae): impact of larval population level andtemporal occurrence on maize yield in Nicaragua. J Econ Entomol. 1997;90(2):611–22.
3. Westbrook J, Fleischer S, Jairam S, Meagher R, Nagoshi R. Multigenerationalmigration of fall armyworm, a pest insect. Ecosphere. 2019;10(11):e02919.
4. Storer NP, Babcock JM, Schlenz M, Meade T, Thompson GD, Bing JW,Huckaba RM. Discovery and characterization of field resistance to Bt maize:Spodoptera frugiperda (Lepidoptera: Noctuidae) in Puerto Rico. J EconEntomol. 2010;103(4):1031–8.
5. Huang F, Qureshi JA, Meagher RL, Reisig DD, Head GP, Andow DA, Ni X,Kerns D, Buntin GD, Niu Y, et al. Cry1F resistance in fall armywormSpodoptera frugiperda: single gene versus pyramided Bt maize. PLoS One.2014;9(11):e112958.
6. Farias JR, Andow DA, Horikoshi RJ, Sorgatto RJ, Fresia P, dos Santos AC,Omoto C. Field-evolved resistance to Cry1F maize by Spodoptera frugiperda(Lepidoptera: Noctuidae) in Brazil. Crop Protect. 2014;64:150–8.
7. Chandrasena DI, Signorini AM, Abratti G, Storer NP, Olaciregui ML, Alves AP,Pilcher CD. Characterization of field-evolved resistance to Bacillusthuringiensis-derived Cry1F delta-endotoxin in Spodoptera frugiperdapopulations from Argentina. Pest Manag Sci. 2018;74(3):746–54.
8. Goergen G, Kumar PL, Sankung SB, Togola A, Tamò M. First report ofoutbreaks of the fall armyworm Spodoptera frugiperda (J E smith)(Lepidoptera, Noctuidae), a new alien invasive pest in west and CentralAfrica. PLoS One. 2016;11(10):e0165632.
9. Nagoshi RN, Htain NN, Boughton D, Zhang L, Xiao Y, Nagoshi BY, Mota-Sanchez D. Southeastern Asia fall armyworms are closely related topopulations in Africa and India, consistent with common origin and recentmigration. Sci Rep. 2020;10(1):1421.
10. Department of Agriculture and Fisheries, Queensland Government, Australia.First mainland detection of fall armyworm [https://www.daf.qld.gov.au/news-media/media-centre/biosecurity/news/first-mainland-detection-of-fall-armyworm].
11. Day R, Abrahams P, Bateman M, Beale T, Clottey V, Cock M, Colmenarez Y,Corniani N, Early R, Godwin J, et al. Fall armyworm: impacts andimplications for Africa. Outlooks Pest Manag. 2017;28(5):196–201.
12. Nagoshi RN, Koffi D, Agboka K, Tounou KA, Banerjee R, Jurat-Fuentes JL,Meagher RL. Comparative molecular analyses of invasive fall armyworm inTogo reveal strong similarities to populations from the eastern UnitedStates and the greater Antilles. PLoS One. 2017;12(7):e0181982.
13. Pashley DP. Host-associated genetic differentiation in fall armyworm(Lepidoptera: Noctuidae): a sibling species complex? Ann Entomol Soc Am.1986;79:898–904.
14. Pashley DP. Quantitative genetics, development, and physiologicaladaptation in host strains of fall armyworm. Evolution. 1988;42(1):93–102.
15. Pashley DP, Martin JA. Reproductive incompatibility between host strains of thefall armyworm (Lepidoptera: Noctuidae). Ann Entomol Soc Am. 1987;80:731–3.
16. Hay-Roe MM, Meagher RL, Nagoshi RN. Effects of cyanogenic plants onfitness in two host strains of the fall armyworm (Spodoptera frugiperda). JChem Ecol. 2011;37(12):1314–22.
Schlum et al. BMC Genomics (2021) 22:179 Page 11 of 12
17. Gouin A, Bretaudeau A, Nam K, Gimenez S, Aury J-M, Duvic B, Hilliou F,Durand N, Montagné N, Darboux I, et al. Two genomes of highlypolyphagous lepidopteran pests (Spodoptera frugiperda, Noctuidae) withdifferent host-plant ranges. Sci Rep. 2017;7(1):11816.
18. Levy H, Garcia-Maruniak A, Maruniak J. Strain identification of Spodopterafrugiperda (Lepidoptera: Noctuidae) insects and cell line; PCR-RFLP ofcytochrome oxidase C subunit 1 gene. Fla Entomol. 2002;85(1):186.
19. Nagoshi RN, Meagher RL, Adamczyk JJ Jr, Braman SK, Brandenburg RL,Nuessly G. New restriction fragment length polymorphisms in thecytochrome oxidase I gene facilitate host strain identification of fallarmyworm (Lepidoptera: Noctuidae) populations in the southeastern UnitedStates. J Econ Entomol. 2006;99(3):671–7.
20. Nagoshi RN, Meagher RL. Using intron sequence comparisons in the triose-phosphate isomerase gene to study the divergence of the fall armywormhost strains. Insect Mol Biol. 2016;25(3):324–37.
21. Nagoshi RN. The fall armyworm triose phosphate isomerase (Tpi) gene as amarker of strain identity and interstrain mating. Ann Entomol Soc Am. 2010;103(2):283–92.
22. Nagoshi RN. Evidence that a major subpopulation of fall armyworm foundin the Western hemisphere is rare or absent in Africa, which may limit therange of crops at risk of infestation. PLoS One. 2019;14(4):e0208966.
23. Cook James M, Delgado AM. Effects of a sex-ratio distortingendosymbiont on mtDNA variation in a global insect pest. BMC EvolBiol. 2009;9(1):49.
24. Nagoshi RN, Silvie P, Meagher RL. Comparison of haplotype frequenciesdifferentiate fall armyworm (Lepidoptera: Noctuidae) corn-strain populationsfrom Florida and Brazil. J Econ Entomol. 2007;100(3):954–61.
25. Nagoshi RN, Fleischer S, Meagher RL, Hay-Roe M, Khan A, Murua MG, SilvieP, Vergara C, Westbrook J. Fall armyworm migration across the LesserAntilles and the potential for genetic exchanges between north and southAmerican populations. PLoS One. 2017;12(2):e0171743.
26. Nagoshi RN, Nagoshi BY, Canarte E, Navarrete B, Solorzano R, Garces-CarreraS. Genetic characterization of fall armyworm (Spodoptera frugiperda) inEcuador and comparisons with regional populations identify likelymigratory relationships. PLoS One. 2019;14(9):e0222332.
27. Nagoshi RN, Meagher RL, Hay-Roe M. Inferring the annual migrationpatterns of fall armyworm (Lepidoptera: Noctuidae) in the United Statesfrom mitochondrial haplotypes. Ecol Evol. 2012;2(7):1458–67.
28. Nagoshi RN, Rosas-Garcia NM, Meagher RL, Fleischer SJ, Westbrook JK,Sappington TW, Hay-Roe M, Thomas JM, Murua GM. Haplotype profilecomparisons between Spodoptera frugiperda (Lepidoptera: Noctuidae)populations from Mexico with those from Puerto Rico, South America, andthe United States and their implications to migratory behavior. J EconEntomol. 2015;108(1):135–44.
30. Rašić G, Schama R, Powell R, Maciel-de Freitas R, Endersby-Harshman NM,Filipović I, Sylvestre G, Máspero RC, Hoffmann AA. Contrasting geneticstructure between mitochondrial and nuclear markers in the dengue fevermosquito from Rio de Janeiro: implications for vector control. Evol Appl.2015;8(9):901–15.
31. Finley LWS, Haigis MC. The coordination of nuclear and mitochondrialcommunication during aging and calorie restriction. Ageing Res Rev. 2009;8(3):173–88.
32. Hartl DL, Clark AG. Principles of population genetics. 4th ed. Sunderland:Sinauer Associates; 2007.
33. Nam K, Nhim S, Robin S, Bretaudeau A, Nègre N, d’Alençon E. Postitiveselection alone is sufficient for whole genome differentiation at the earlystage of speciation process in the fall armyworm. BMC Evol Biol. 2020;20:152–68.
34. Clark PL, Molina-Ochoa J, Martinelli S, Skoda SR, Isenhour DJ, Lee DJ, KrummJT, Foster JE. Population variation of the fall armyworm, Spodopterafrugiperda, in the Western hemisphere. J Insect Sci. 2007;7:5.
35. Nagoshi RN, Meagher RL, Flanders K, Gore J, Jackson R, Lopez J, ArmstrongJS, Buntin GD, Sansone C, Leonard BR. Using haplotypes to monitor themigration of fall armyworm (Lepidoptera: Noctuidae) corn-strainpopulations from Texas and Florida. J Econ Entomol. 2008;101(3):742–9.
36. Groot AT, Marr M, Heckel DG, SchÖfl G. The roles and interactions ofreproductive isolation mechanisms in fall armyworm (Lepidoptera:Noctuidae) host strains. Ecol Entomol. 2010;35:105–18.
37. Correa CC, Ballard JWO. Wolbachia associations with insects: winning orlosing against a master manipulator. Front Ecol Evol. 2016;3.
38. Perry KD, Keller MA, Baxter SW. Genome-wide analysis of diamondbackmoth, Plutella xylostella L., from Brassica crops and wild host plants revealsno genetic structure in Australia. Sci Rep. 2020;10:12047.
39. Gilchrist AS, Cameron EC, Sved JA, Meats AW. Genetic consequences ofdomestication and mass rearing of pest fruit fly Bactrocera tryoni (Diptera:Tephritidae). J Econ Entomol. 2012;105(3):1051–6.
40. Berthier K, Chapuis MP, Simpson SJ, Ferenz HJ, Habib Kane CM, Kang L,Lange A, Ott SR, Babah Ebbe MA, Rodenburg KW, et al. Laboratorypopulations as a resource for understanding the relationship betweengenotypes and phenotypes: a global case study in locusts. Adv InsectPhysiol. 2010;39:1–37.
41. Simões P, Pascual M, Coelho MM, Matos M. Divergent evolution ofmolecular markers during laboratory adaptation in Drosophila subobscura.Genetica. 2010;138(9–10):999–1009.
42. Parreño MA, Scannapieco AC, Remis MI, Juri M, Vera MT, Segura DF, CladeraJL, Lanzavecchia SB. Dynamics of genetic variability in Anastrepha fraterculus(Diptera: Tephritidae) during adaptation to laboratory rearing conditions.BMC Genet. 2014;15(Suppl 2):S14.
43. Meagher RL. Trapping fall armyworm (Lepidoptera: Noctuidae) adults intraps baited with pheromone and a synthetic floral volatile compound. FlaEntomol. 2001;84(2):288–92.
44. Banerjee R, Hasler J, Meagher R, Nagoshi R, Hietala L, Huang F, Narva K,Jurat-Fuentes JL. Mechanism and DNA-based detection of field-evolvedresistance to transgenic Bt corn in fall armyworm (Spodoptera frugiperda).Sci Rep. 2017;7(1):10877.
45. Santos-Amaya OF, Rodrigues JVC, Souza TC, Tavares CS, Campos SO, GuedesRNC, Pereira EJG. Resistance to dual-gene Bt maize in Spodoptera frugiperda:selection, inheritance, and cross-resistance to other transgenic events. SciRep. 2015;5(1):18243.
46. Santos-Amaya OF, Tavares CS, Rodrigues JVC, Campos SO, Guedes RNC, AlvesAP, Pereira EJG. Fitness costs and stability of Cry1Fa resistance in Brazilianpopulations of Spodoptera frugiperda. Pest Manag Sci. 2017;73(1):35–43.
47. Fall armyworm. University of Florida Publication Number EENY-98. http://entnemdept.ufl.edu/creatures/field/fall_armyworm.htm#host
48. Andrews S. FastQC: a quality control tool for high throughput sequencedata. Available online at: http://www.bioinformatics.babraham.ac.uk/projects/fastqc/
49. Li H, Durbin R. Fast and accurate short read alignment with Burrows-Wheeler Transform. Bioinformatics. 2009;25:1754–60.
50. Li H. A statistical framework for SNP calling, mutation discovery, associationmapping and population genetical parameter estimation from sequencingdata. Bioinformatics. 2011;27(21):2987–93.
51. Danecek P, Auton A, Abecasis G, Albers CA, Banks E, DePristo MA,Handsaker RE, Lunter G, Marth GT, Sherry ST, et al. The variant call formatand VCFtools. Bioinformatics. 2011;27(15):2156–8.
52. Purcell S, Neale B, Todd-Brown K, Thomas L, Ferreira MAR, Bender D, MallerJ, Sklar P, de Bakker PIW, Daly MJ, Sham PC. PLINK: a toolset for whole-genome association and population-based linkage analysis. Am J HumanGen. 2007;81:559–75.
53. Dierckxsens N, Mardulyn P, Smits G. NOVOPlasty: de novo assembly of organellegenomes from whole genome data. Nucleic Acids Res. 2017;45(4):e18.
54. Jombart T, Ahmed I. Adegenet 1.3-1: new tools for the analysis of genome-wide SNP data. Bioinformatics. 2011;27(21):3070–1.
55. Paradis E. Pegas: an R package for population genetics with an integrated–modular approach. Bioinformatics. 2010;26(3):419–20.
56. Chang CC, Chow CC, Tellier LCAM, Vattikuti S, Purcell SM, Lee JJ. Second-generation PLINK: rising to the challenge of larger and richer datasets.GigaScience. 2015;4:7.
57. Pritchard JK, Stephens M, Raj A. fastSTRUCTURE: Variational inference ofpopulation structure in large SNP data sets. Genetics. 2014;197(2):573–89.
58. Wickham H. ggplot2 elegant graphics for data analysis. New York: Springer-Verlag; 2016.
Publisher’s NoteSpringer Nature remains neutral with regard to jurisdictional claims inpublished maps and institutional affiliations.
Schlum et al. BMC Genomics (2021) 22:179 Page 12 of 12