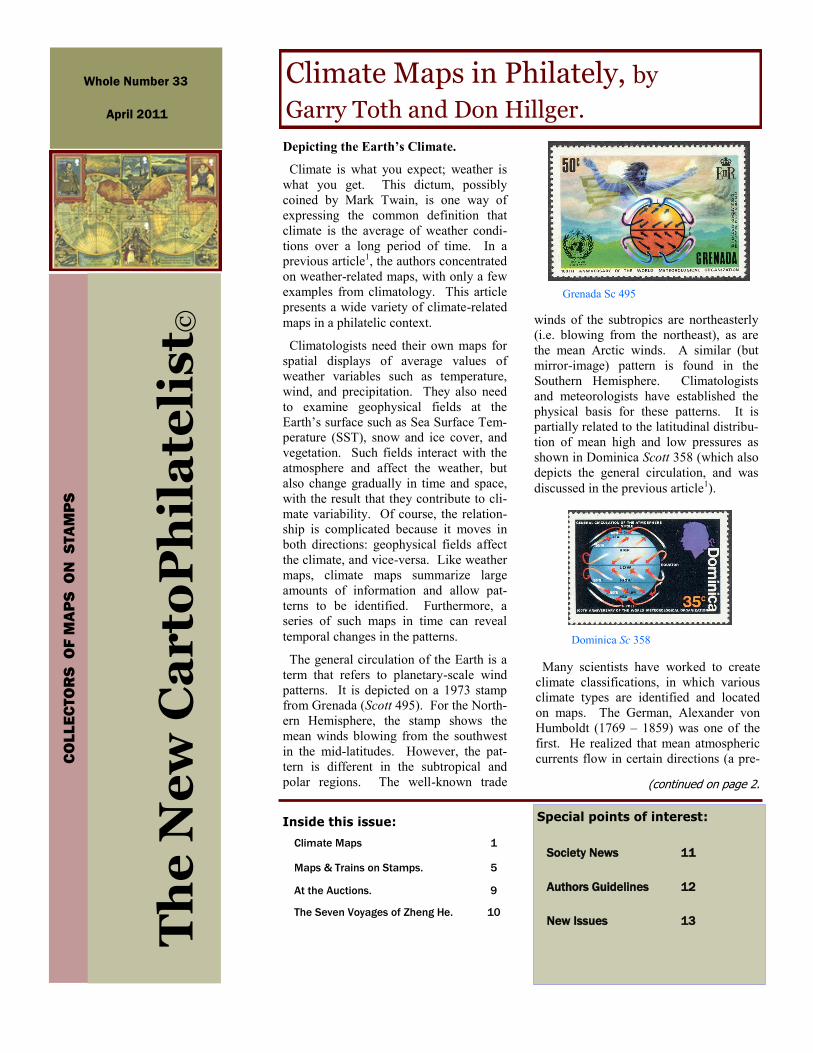
winds of the subtropics are northeasterly
(i.e. blowing from the northeast), as are
the mean Arctic winds. A similar (but
mirror-image) pattern is found in the
Southern Hemisphere. Climatologists
and meteorologists have established the
physical basis for these patterns. It is
partially related to the latitudinal distribu-
tion of mean high and low pressures as
shown in Dominica Scott 358 (which also
depicts the general circulation, and was
discussed in the previous article1).
Climate Maps 1
Maps & Trains on Stamps. 5
At the Auctions. 9
The Seven Voyages of Zheng He. 10
Climate Maps in Philately, by Garry Toth and Don Hillger.
Special points of interest:
Society News 11
Authors Guidelines 12
New Issues 13
Inside this issue:
Depicting the Earth’s Climate.
Climate is what you expect; weather is
what you get. This dictum, possibly
coined by Mark Twain, is one way of
expressing the common definition that
climate is the average of weather condi-
tions over a long period of time. In a
previous article1, the authors concentrated
on weather-related maps, with only a few
examples from climatology. This article
presents a wide variety of climate-related
maps in a philatelic context.
Climatologists need their own maps for
spatial displays of average values of
weather variables such as temperature,
wind, and precipitation. They also need
to examine geophysical fields at the
Earth‟s surface such as Sea Surface Tem-
perature (SST), snow and ice cover, and
vegetation. Such fields interact with the
atmosphere and affect the weather, but
also change gradually in time and space,
with the result that they contribute to cli-
mate variability. Of course, the relation-
ship is complicated because it moves in
both directions: geophysical fields affect
the climate, and vice-versa. Like weather
maps, climate maps summarize large
amounts of information and allow pat-
terns to be identified. Furthermore, a
series of such maps in time can reveal
temporal changes in the patterns.
The general circulation of the Earth is a
term that refers to planetary-scale wind
patterns. It is depicted on a 1973 stamp
from Grenada (Scott 495). For the North-
ern Hemisphere, the stamp shows the
mean winds blowing from the southwest
in the mid-latitudes. However, the pat-
tern is different in the subtropical and
polar regions. The well-known trade
Th
e N
ew
Ca
rto
Ph
ila
teli
st©
CO
LL
EC
TO
RS
O
F M
AP
S O
N S
TA
MP
S
Whole Number 33
April 2011
(continued on page 2.
Grenada Sc 495
Dominica Sc 358
Many scientists have worked to create
climate classifications, in which various
climate types are identified and located
on maps. The German, Alexander von
Humboldt (1769 – 1859) was one of the
first. He realized that mean atmospheric
currents flow in certain directions (a pre-
THE NEW CARTOPHILATELIST, NUMBER 33, APRIL 2011 PAGE 2
cursor to the idea of the general circula-
tion) and drew a map in which locations
with the same mean annual temperature
were joined. This could be considered
the first climate map. No known stamp
shows it, but Mexico Scott 2176, issued
in 1999, depicts von Humboldt and a
map of the Americas, which he visited
in an epic scientific voyage from 1799
to 1804.
Mexico Sc 2176
Wladimir Köppen (1846 – 1940), born
in Russia, was a meteorologist and cli-
matologist who spent most of his work-
ing life in Germany. He was the first to
develop a formal climate classification
system, based on average temperature
and precipitation on vegetation. It was
published in 1900. His basic principles
still contribute to modern classifications.
A Russian stamp from 2003 (Scott 6788)
shows a typical climate classification
over most of the world, similar to that of
Köppen. In it we see hot dry desert ar-
eas in yellow tones, hot humid tropical
Russia Sc 6788
forest areas in red tones, and the colder
mid-latitude and polar climates in green
and blue tones. A similar climate classi-
fication map, only for Africa, is found in
the margin of Comoro Islands Scott
387a, from 1978.
Other climate variables have also been
depicted on stamps. The previous arti-
cle1 referred to Grenada Scott 497
(showing worldwide mean annual rain-
fall) and Upper Volta Scott 107 (with a
regional mean rainfall map). In another
example, a 1995 stamp from Hungary
(Scott 3490) shows what may be a map
of average precipitation over the coun-
try, though the details are not specified
in the stamp.
Comoro Islands Sc 387a
Hungary Sc 3490
Grenada Sc 1156
Namibia Scott 690-693
Cuba Sc 1590.
Philatelic climate-related map items
often require interpretation of the dis-
played fields. For example, Grenada
Scott 1156, from 1983, is presented as a
“satellite weather map” with no further
explanation. It most likely shows either
mean annual cloudiness or mean annual
precipitation over the world.
The authors are unaware of any stamps
that depict climatological air tempera-
tures. However, the cachet of the FDC
of Namibia Scott 690-693 (1991) nicely
shows Namibia‟s average annual air
temperatures.
Cuba issued an interesting climate-
related stamp in 1971 (Scott 1590). In it
are the historical tracks of major hurri-
canes. Such storms in this area have
two mean tracks: toward the northwest
and into the Gulf of Mexico, or recur-
ring near Florida to end up heading
northeastward over the Atlantic Ocean
off the southeastern U.S. coast. Almost
all the tracks shown in this stamp fall in
one or the other of those two major
groupings.
Arid areas form one major climate
category. The label attached to Russia
Scott 5749 (1989) provides a general
worldwide view of arid regions. In
some areas, drought and desertification
may act to change the climate. Two
stamps (Iraq Scott 826 and 827) issued
in 1977 for the Nairobi UN Conference
on Desertification depict areas of North
Africa and the Middle East that are
Continued from page 1.
Continued on page 3.
THE NEW CARTOPHILATELIST, NUMBER 33, APRIL 2011 PAGE 3
prone to desertification. As part of the
International Year on Deserts and De-
sertification, Ethiopia Scott 1711 (2006)
presents a more detailed map including
three categories of arid areas, with the
apparent goal of focusing attention on
vulnerability to desertification in various
parts of the world, and in particular in
North Africa.
Russia Sc 5749.
Iraq Sc 826.
Ethiopia Scott 1711 .
Drought and desertification had major
impacts on some areas of Africa in the
1980s. The FDC for UN-Geneva Scott
140 (1986) has a cachet and cancel that
highlight those areas.
UN-Geneva Sc 140.
As mentioned above, geophysical sur-
face fields are important for weather and
climate. For example, SSTs undergo
slow changes (the El Niño and La Niña
phenomena are examples of such
changes) which are linked to climatic
extremes. During El Niño years, the
northwestern coast of South America
can suffer devastating floods and mud-
slides as a result of abnormally high
precipitation. The SST measured by the
NOAA-19 weather satellite is shown in
the cachet of a launch cover from 6 Feb-
ruary 2009. The warm equatorial waters
are in warm colours, while the colder
colours represent the colder waters of
both polar regions.
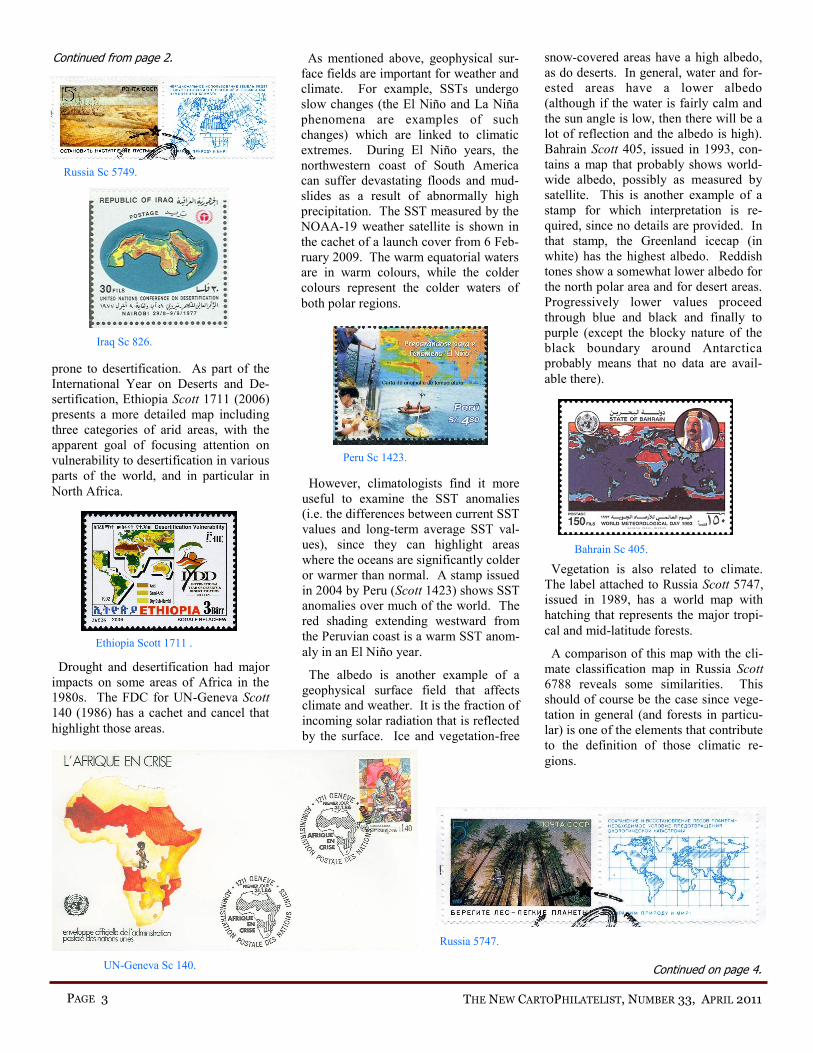
However, climatologists find it more
useful to examine the SST anomalies
(i.e. the differences between current SST
values and long-term average SST val-
ues), since they can highlight areas
where the oceans are significantly colder
or warmer than normal. A stamp issued
in 2004 by Peru (Scott 1423) shows SST
anomalies over much of the world. The
red shading extending westward from
the Peruvian coast is a warm SST anom-
aly in an El Niño year.
The albedo is another example of a
geophysical surface field that affects
climate and weather. It is the fraction of
incoming solar radiation that is reflected
by the surface. Ice and vegetation-free
Peru Sc 1423.
snow-covered areas have a high albedo,
as do deserts. In general, water and for-
ested areas have a lower albedo
(although if the water is fairly calm and
the sun angle is low, then there will be a
lot of reflection and the albedo is high).
Bahrain Scott 405, issued in 1993, con-
tains a map that probably shows world-
wide albedo, possibly as measured by
satellite. This is another example of a
stamp for which interpretation is re-
quired, since no details are provided. In
that stamp, the Greenland icecap (in
white) has the highest albedo. Reddish
tones show a somewhat lower albedo for
the north polar area and for desert areas.
Progressively lower values proceed
through blue and black and finally to
purple (except the blocky nature of the
black boundary around Antarctica
probably means that no data are avail-
able there).
Bahrain Sc 405.
Vegetation is also related to climate.
The label attached to Russia Scott 5747,
issued in 1989, has a world map with
hatching that represents the major tropi-
cal and mid-latitude forests.
A comparison of this map with the cli-
mate classification map in Russia Scott
6788 reveals some similarities. This
should of course be the case since vege-
tation in general (and forests in particu-
lar) is one of the elements that contribute
to the definition of those climatic re-
gions.
Russia 5747.
Continued from page 2.
Continued on page 4.
THE NEW CARTOPHILATELIST, NUMBER 33, APRIL 2011 PAGE 4
The Earth‟s ice, on water and on land,
is another surface field that affects the
weather and the climate and has come
into more attention with increasing wor-
ries about melting due to global warm-
ing. A large number of countries have
recently issued stamps with the common
theme Protect the Polar Regions and
Glaciers (PPRG). Several of these in-
clude maps of ice cover. One interesting
example is a minisheet of two stamps
issued in 2009 by Iceland (Scott 1162).
Thermal ink was used in this item, so
that the depiction changes with tempera-
ture.
When viewed “cold”, the sheet shows
red hatching that represents ice cover
over a large portion of the Arctic in
2009. When viewed “hot”, a much
smaller area of hatching remains over
part of Greenland and Iceland. It
represents a forecast of ice cover in the
year 2100 under continued global
warming. An ice-free Arctic ocean
would have major impacts on the cli-
mate, not only of the Nordic countries,
Iceland Sc1162.
but also on other parts of the world,
through atmospheric interconnections.
Cuba Sc 3391.
Stratospheric ozone in the atmosphere
has been measured for several decades.
It has significant variations in both
space and time. While not a traditional
climate variable, ozone is important
because it protects animals and plants
from harmful solar ultraviolet radiation.
However, in the latter part of the 20th
century stratospheric ozone was being
destroyed by man-made chemicals
known as CFCs (chlorofluorocarbons).
British Antarctic Territory Sc 283.
NOAA-19.
The problem came into sharp focus
when a strong negative anomaly (a
“hole”) in the ozone over Antarctica was
detected in the early 1980s by the Brit-
ish Antarctic Survey. British Antarctic
Territory Scott 283 (issued in 1999)
commemorates this discovery.
The “climatology” of ozone had
changed from its normal values, and it
would take significant international co-
operation to slow (and eventually halt)
the destruction of ozone. Several
stamps show the ozone hole over Ant-
arctica, including a 1992 issue from
Cuba (Scott 3391).
Climate-related maps and weather
maps on stamps are a rather specialized
part of cartophilately. The authors, both
meteorologists, hope that readers have
found our two articles to be both inter-
esting and informative. The authors‟
website on Weather and Climate Philat-
ely (http://rammb.cira.colostate.edu/dev/
hillger/weather.htm) contains a wide
variety of philatelic material related to
all aspects of weather and climate. Most
of the climate-related items discussed in
this article can be found at http://
rammb.cira.colostate.edu/dev/hillger/
climate-maps.htm. The ozone and
PPRG items are also found in the pages
in the authors‟ website that treat those
two categories.
Reference
1 Hillger, D. and G. Toth, 2008: Phila-
telic Weather Maps, The New Cartophi-
latelist, #23, October, 2008. A table of
stamps to accompany the article is found
at http://rammb.cira.colostate.edu/dev/
hillger/wx-maps.htm
Biographical Notes
Garry Toth, MSc is a research meteor-
ologist with Environment Canada at the
Prairie and Arctic Storm Prediction Cen-
tre in Edmonton. Send correspondence
to: [email protected]
Don Hillger, PhD is a research meteor-
ologist with the National Oceanic and
Atmospheric Administration (NOAA)
and holds a cooperative position at
Colorado State University. Send corre-
spondence to: [email protected]
■
Continued from page 3.