Leicestershire Numeracy Team Numeracy across the Curriculum Key Stages 3 and 4 This document contains support for all those responsible for leading or co-ordinating Numeracy across the Curriculum. Perhaps the most essential is a model policy that you can adapt to meet the needs and position of development of this cross strand and cross subject skills. This policy is deliberately brief as it is the practice and embedding of pupils’ numerical skills into all classrooms, laboratories and workshops that is more important than a folder in an office. The Appendices are included as suggestions as to how you might want to audit and further cross-curricular numeracy work in your school. Particularly useful are the further details in the areas of collaboration that have been written by Sue Prior; Head of Mathematics at St Martins Catholic School in Stoke Golding. Many thanks to her for allowing us to use this detailed document. The exemplar material in this document is drawn from real practice by real teachers in real schools! The majority of it is from St Martins where each department has given meeting time to the consideration of what numeracy they use, how they use and teach it and points for development. This process was started in August 2001 with a teacher day INSET session on Numeracy across the Curriculum and has continued throughout the academic year 2001 – 02. Our thanks are given to Paul Scola, Headteacher, for supporting this work that can now be shared throughout Leicestershire. Other schools have contributed to the development of this material, many informally but Lutterworth and Brookvale High Schools deserve a special mention. PLEASE use this to benefit YOUR PUPILS! 1
Transcript
Leicestershire Numeracy Team
Numeracy across the Curriculum
Key Stages 3 and 4
This document contains support for all those responsible for leading or co-ordinating Numeracy across the Curriculum.
Perhaps the most essential is a model policy that you can adapt to meet the needs and position of development of this cross strand and cross subject skills. This policy is deliberately brief as it is the practice and embedding of pupils’ numerical skills into all classrooms, laboratories and workshops that is more important than a folder in an office.
The Appendices are included as suggestions as to how you might want to audit and further cross-curricular numeracy work in your school. Particularly useful are the further details in the areas of collaboration that have been written by Sue Prior; Head of Mathematics at St Martins Catholic School in Stoke Golding. Many thanks to her for allowing us to use this detailed document.
The exemplar material in this document is drawn from real practice by real teachers in real schools! The majority of it is from St Martins where each department has given meeting time to the consideration of what numeracy they use, how they use and teach it and points for development. This process was started in August 2001 with a teacher day INSET session on Numeracy across the Curriculum and has continued throughout the academic year 2001 – 02. Our thanks are given to Paul Scola, Headteacher, for supporting this work that can now be shared throughout Leicestershire. Other schools have contributed to the development of this material, many informally but Lutterworth and Brookvale High Schools deserve a special mention.
PLEASE use this to benefit YOUR PUPILS!
Electronic copies can be e-mailed to you or downloaded from Mathsweb @www.leics.gov.uk/education/ngfl/numeracy ; choose Teachers then Key Stage 3 &4 and scroll down to section 10.
1
Leicestershire Education Authority
Outline Numeracy Policy
The Authority wishes to point out that many of the ideas in its Numeracy policy originated in the book “Numeracy across the
Curriculum” ISBN 0 906588 47 2 by Mary Ledwick, published by The Mathematical Association. Copies of the book can be
obtained from The Mathematical Association, 259 London Road, Leicester, LE2 3BE.
You can link to their website using:http://www.m-a.org.uk/index.htm
------------------------------- school is committed to raising the standards of numeracy of all of its students, so that they develop the ability to use numeracy skills effectively in all areas of the curriculum and the skills necessary to cope confidently with the demands of further education, employment and adult life.
Whole School Numeracy Policy
Contents:
Introduction & Contextual Information
I Raising Standards
II Consistency of Practice
III Areas of Collaboration
IV Transfer of Skills
Appendices:
1.1 The skills of a numerate year 6 pupil
1.2 The skills of a numerate year 9 pupil
1.3 Exemplar suggestions on details of further collaboration
1.4 National Strategy – Numeracy across the Curriculum objectives1.4a Exemplar of amended objectives for Religious Education
1.5 Mathematical Association audit. 1.5a Exemplar of Completed Audit for Data Handling
1.6 Possible job description / role for a Numeracy across the Curriculum co-ordinator
4
Introduction:
The purposes of our whole-school numeracy policy:
I. to develop, maintain and improve standards in numeracy across the school;II. to ensure consistency of practice including methods, vocabulary, notation, etc.;
III. to indicate areas for collaboration between subjects;IV. to assist the transfer of pupils’ knowledge, skills and understanding between subjects.
Contextual Information:
The development of the concept of “numeracy”:
1959 – (Crowther report) - Numeracy is defined as a word to represent the mirror image of literacy.
1982 – (Cockcroft report) - A numerate pupil is one who has the ability to cope confidently with the mathematical needs of adult life. There was an emphasis on the wider aspects of numeracy and not purely the skills of computation.
1995 (OED) – numerate means acquainted with the basic principles of Mathematics
A current definition of numeracy:
Numeracy is a proficiency which is developed mainly in mathematics but also in othersubjects. It is more than an ability to do basic arithmetic. It involves developing confidence and competence with numbers and measures. It requires understanding of the number system, a repertoire of mathematical techniques, and an inclination and ability to solve quantitative or spatial problems in a range of contexts. Numeracy also demands understanding of the ways in which data are gathered by counting and measuring, and presented in graphs, diagrams, charts and tables.
(Framework for Teaching Mathematics – yrs 7 to 9 – DfES)
In the appendices are more thorough descriptions of the numeracy skills appropriate to pupils at the end of Key Stages 2 and 3.
5
Practice at Leics High School
I Raising Standards
Raising Standards in Numeracy across our school cannot be solely judged in increased test percentages. There is a need to evaluate the pupils’ ability to transfer mathematical skills into other subject areas, applying techniques to problem solving. Their confidence in attempting this is initially as important as achieving the correct solution. Pupil interviews and work sampling will be the main processes for evaluating the success of our practice.There are some key roles within school that will ensure that this policy is effective and becomes a well established part of our school practice.
The Senior Management Team has a commitment to the implementation and evaluation of this work. They are aware of the need to create time for liaison and sustain the cross curricular links forged between subject areas. The effectiveness of these links will reduce the replication of work by teachers and pupils.
The Numeracy Co-ordinator. Pilot work in many schools has shown that a designated person with oversight of “Numeracy across the Curriculum” has led to effective practice and positive change. The school is currently exploring with governors the options for such a post.
6
II Consistency of Practice
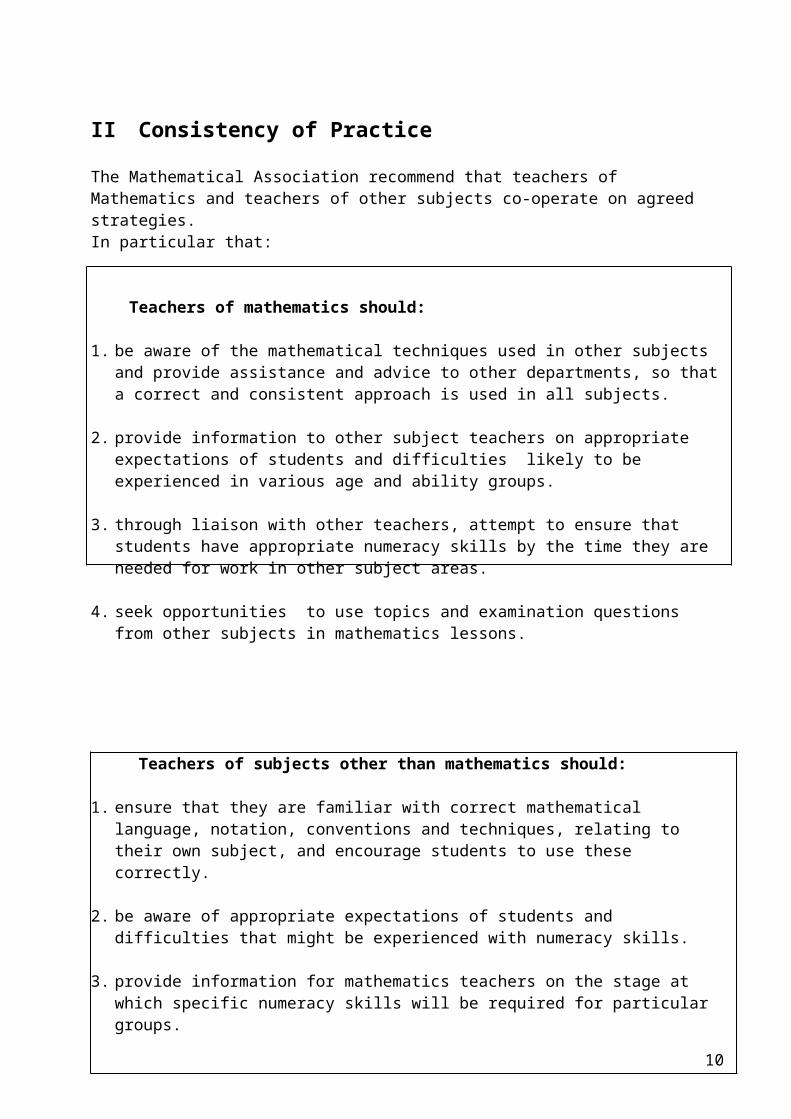
The Mathematical Association recommend that teachers of Mathematics and teachers of other subjects co-operate on agreed strategies.In particular that:
Teachers of mathematics should:
1. be aware of the mathematical techniques used in other subjects and provide assistance and advice to other departments, so that a correct and consistent approach is used in all subjects.
2. provide information to other subject teachers on appropriate expectations of students and difficulties likely to be experienced in various age and ability groups.
3. through liaison with other teachers, attempt to ensure that students have appropriate numeracy skills by the time they are needed for work in other subject areas.
4. seek opportunities to use topics and examination questions from other subjects in mathematics lessons.
Teachers of subjects other than mathematics should:
1. ensure that they are familiar with correct mathematical language, notation, conventions and techniques, relating to their own subject, and encourage students to use these correctly.
2. be aware of appropriate expectations of students and difficulties that might be experienced with numeracy skills.
3. provide information for mathematics teachers on the stage at which specific numeracy skills will be required for particular groups.
4. provide resources for mathematics teachers to enable them to use examples of applications of numeracy relating to other subjects in mathematics lessons.
7
III Our Areas of Collaboration:
Mental Arithmetic Techniques
Staff training has taken place on the variety of arithmetical techniques used by pupils in Key Stages 1, 2 and 3. There is an acceptance that pupils are able to tackle the same questions with a variety of methods. These approaches rely on mixing skills, ideas and facts; this is done by pupils drawing on their personal preferences and the particular question. All departments should give every encouragement to pupils using mental techniques but must also ensure that they are guided towards efficient methods and do not attempt convoluted mental techniques when a written or calculator method is required.
Written Calculations
Again staff training was undertaken on the initial Numeracy across the Curriculum training day to bring all teaching staff up to date with the National Numeracy Strategy and the Mathematics strand of the Key Stage 3 Strategy. Particular emphasis was made of “non-standard” methods, particularly for grid multiplication and division by chunking. The desire for pupils to progress to formal algorithms and the most efficient methods was made but not at the expense of having only a method rather than a cohesive and full understanding.
Role & Use of Calculators
ALL departments are expected to have a policy and consistent practice on the use of calculators. Consideration of these 4 questions, and the policy below, will help them with this.
a) Does the mathematics department ban or limit the use of calculators during Key Stage 3?
b) Where in your subject do you expect pupils to be able to use a calculator?c) Are there, and should there be, situations in your subject when you would not wish
pupils to use calculators?d) Are the calculator skills required of pupils in line with expectations in the
Framework for teaching mathematics?
In simple terms, each department needs to decide and then plan into each module of work whether calculators are banned, ignored, allowed, encouraged or compulsory!
Whole school Policy on the use of calculatorsThe school expects all pupils to bring their own scientific calculator to lessons when required.In deciding when pupils use a calculator in lessons we should ensure that:
pupils’ first resort should be mental methods;
8
pupils have sufficient understanding of the calculation to decide the most appropriate method: mental, pencil and paper or calculator;
pupils have the technical skills required to use the basic facilities of a calculator constructively and efficiently, the order in which to use keys, how to enter numbers as money, measures, fractions, etc.;
pupils understand the four arithmetical operations and recognise which to use to solve a particular problem;
when using a calculator, pupils are aware of the processes required and are able to say whether their answer is reasonable;
pupils can interpret the calculator display in context (e.g. 5.3 is £5.30 in money calculations);
we help pupils, where necessary, to use the correct order of operations – especially in multi-step calculations, such as (3.2 - 1.65) x (15.6 - 5.77).
Vocabulary
The following are all important aspects of helping pupils with the technical vocabulary of Mathematics: Use of Word walls Using a variety of words that have the same meaning e.g. add, plus, sum Encouraging pupils to be less dependent on simple words e.g. exposing them to the word multiply as a replacement for times Discussion about words that have different meanings in Mathematics from everyday life e.g. take away, volume, product etc Highlighting word sources e.g. quad means 4, lateral means side so that pupils can use them to help remember meanings. This applies to both prefixes and suffixes to words.
Pupils should become confident that they know what a word means so that they can follow the instructions in a given question or interpret a mathematical problem. For example a pupil reading a question including the word perimeter should immediately recall what that is and start to think about the concept rather than struggling with the word and then wondering what it means and losing confidence in his / her ability to answer the question. The instant recall of vocabulary and meanings can be improved through flash card activities in starters. Try to do this twice a half term with each group; this may be key vocabulary at the start of a unit of work or recalling vocabulary from previous mathematics.
Measures
There has been a tension for a long time in the use of metric measures between the work of our Maths dept. and the measures used in ADT. Technology teachers have traditionally used millimetres, maths complicate the issue with metres and centimetres. We know this is an area that we need to help pupils with so that they can use all the divisions of a metre confidently, converting between them and, perhaps most importantly, having a sense of the relative size of them and visualising what a particular dimension looks like.
9
We are also aware that QCA and HMI have highlighted the use of rulers and protractors as a national weakness at Key Stage 2 and we are doing all we can to increase pupil confidence and competence with these and other practical equipment in mathematics classrooms and ADT rooms and workshops.
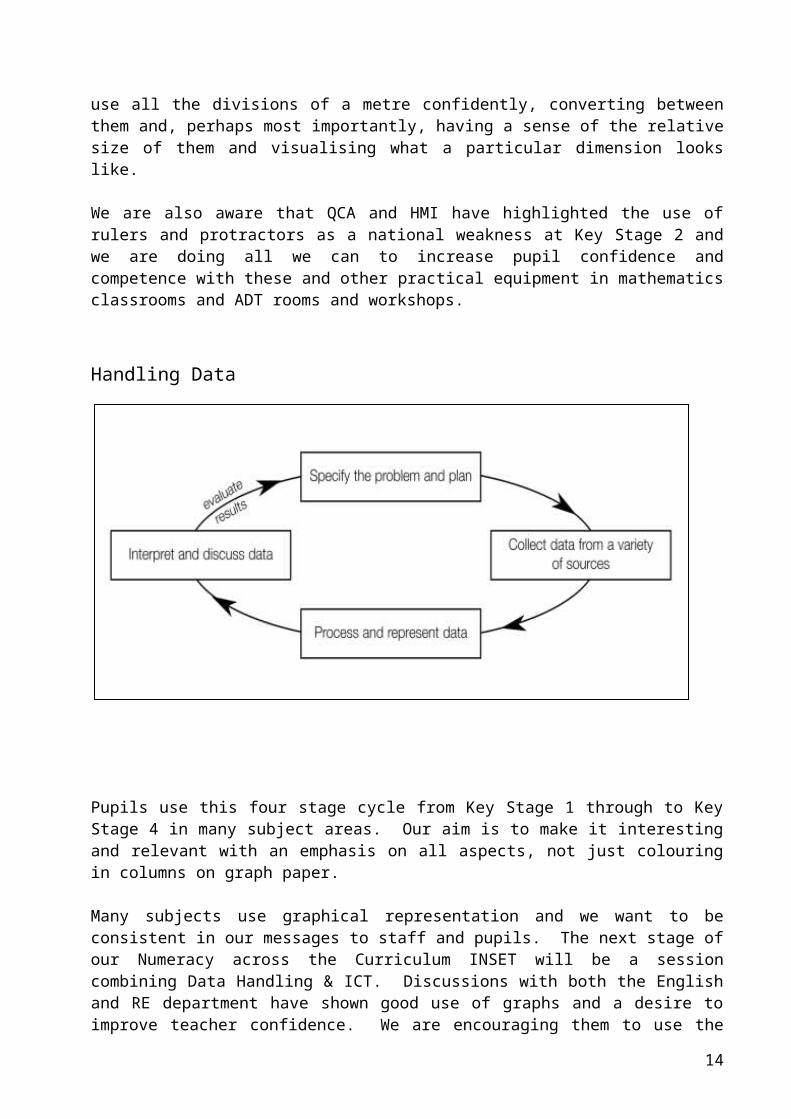
Handling Data
Pupils use this four stage cycle from Key Stage 1 through to Key Stage 4 in many subject areas. Our aim is to make it interesting and relevant with an emphasis on all aspects, not just colouring in columns on graph paper.
Many subjects use graphical representation and we want to be consistent in our messages to staff and pupils. The next stage of our Numeracy across the Curriculum INSET will be a session combining Data Handling & ICT. Discussions with both the English and RE department have shown good use of graphs and a desire to improve teacher confidence. We are encouraging them to use the relevant pages (262 – 271) from the Key Stage 3 Mathematics framework to inform them as to the progression in sophistication of different graphical representations.
10
IV Transfer of Skills:
“It is vital that as the skills are taught, the applications are mentioned and as the applications are taught the skills are revisited.”
The Mathematics team will deliver the National Curriculum knowledge, skills and understanding through the Numeracy Strategy Framework using direct interactive teaching, predominantly in “3 part” lessons. They will make references to the applications of Mathematics in other subject areas and give contexts to many topics. Other curriculum teams will build on this knowledge and help pupils to apply them in a variety of situations. Liaison between curriculum areas is vital to pupils being confident with this transfer of skills and the Maths team willingly offers support to achieve this.
The transfer of skills is something that many pupils find difficult. It is essential to start from the basis that pupils realise it is the same skill that is being used; sometimes approaches in subjects differ so much that those basic connections are not made.
The 3 part lesson has enabled the Maths Dept. to cover work for other subject areas at appropriate times. This is often in the starter activity where key skills are rehearsed and sharpened so that pupils gain more from the forthcoming application in the other subject. One particularly good example of this is liaison with the music department where the maths team teach the basic skill of making quantities “half as much again” so that pupils are able to construct bars of music containing “dotted” notes.
Data Handling should be about all four stages of the cycle and combining stages from different subject areas is a powerful tool. We have had great success combining health and fitness data collected within PE, processed in Mathematics and then returned to PE for evaluation. This could also be used with athletics times and data which is an area we hope to develop in Summer 2003.
We have used the DfES document on Numeracy across the Curriculum, Chapter 3, to raise questions in our department meetings. Subject areas are more aware of the underlying maths skills and approaches that go with the applications that they use. In particular we are making better links with
ART – Symmetry; use of paint mixing as a ratio context.
ENGLISH – comparison of 2 data sets on word and sentence length.
FOOD TECHNOLOGY – recipes as a ratio context, reading scales,
GEOGRAPHY – representing data, use of Spreadsheets
HISTORY – timelines, sequencing events
ICT – representing data; considered use of graphs not just pretty ones!
MFL – Dates, sequences and counting in other languages; use of basic graphs and surveys to practise foreign language vocabulary and reinforce interpretation of data.
11
MUSIC – addition of fractions
PHYSICAL EDUCATION – collection of real data for processing in Maths
RELIGIOUS EDUCATION – interpretation and comparison of data gathered from secondary sources (internet) on e.g. developing and developed world
RESISTANT MATERIALS – measuring skills, units of area and volume
SCIENCE – calculating with formulae, 3 way relationships,
TEXTILES – scale, practical equipment, proportion
12
Appendices1.1 Year 6 Pupils should :
have a sense of the size of a number and where it fits in the number system
know number bonds by heart e.g. tables, doubles and halves
use what they know by heart to work out answers mentally
calculate accurately & efficiently using a variety of strategies, both written & mental
recognise when AND when not to use a calculator; using it efficiently if needs be
make sense of number problems, including non-routine problems, and recognise the operations needed to solve them
explain their methods and reasoning using correct mathematical terms
judge whether their answers are reasonable, and have strategies for checking
suggest suitable units for measuring
make sensible estimates for measurements
explain and interpret graphs, diagrams, charts and tables
use the numbers in graphs, diagrams, charts and tables to predict.
13
1.2 Year 9 pupils should:
have a sense of the size of a number and where it fits into the number system;
recall mathematical facts confidently;
calculate accurately and efficiently, both mentally and with pencil and paper, drawing on a range of calculation strategies;
use proportional reasoning to simplify and solve problems;
use calculators and other ICT resources appropriately and effectively to solve mathematical problems, and select from the display the number of figures appropriate to the context of a calculation;
use simple formulae and substitute numbers in them;
measure and estimate measurements, choosing suitable units and reading numbers correctly from a range of meters, dials and scales;
calculate simple perimeters, areas and volumes, recognising the degree of accuracy that can be achieved;
understand and use measures of time and speed, and rates such as £ per hour or miles per litre;
draw plane figures to given specifications and appreciate the concept of scale in geometrical drawings and maps;
understand the difference between the mean, median and mode and the purpose for which each is used;
collect data, discrete and continuous, and draw, interpret and predict from graphs, diagrams, charts and tables;
have some understanding of the measurement of probability and risk;
explain their methods, reasoning and conclusions, using correct mathematical terms;
judge the reasonableness of solutions and check them when necessary;
give their results to a degree of accuracy appropriate to the context.
14
1.3 Further details - Areas of Collaboration.
Section 1 – Number
Reading and writing numbers
Pupils must be encouraged to write numbers simply and clearly. The symbol for zero with a line through it (), ones which could be mistaken for 7 (1) and continental sevens ( 7) should be discouraged.Most pupils are able to read, write and say numbers up to a thousand, but often have difficulty with larger numbers. It is now common practice to use spaces rather than commas between each group of three figures. eg. 34 000 not 34,000 though the latter will still be found in many text books and cannot be considered incorrect.
In reading large figures pupils should know that the final three figures are read as they are written as hundreds, tens and units.Reading from the left, the next three figures are thousands and the next group of three are millions.
eg. 3 027 251 is three million, twenty seven thousand and fifty one.
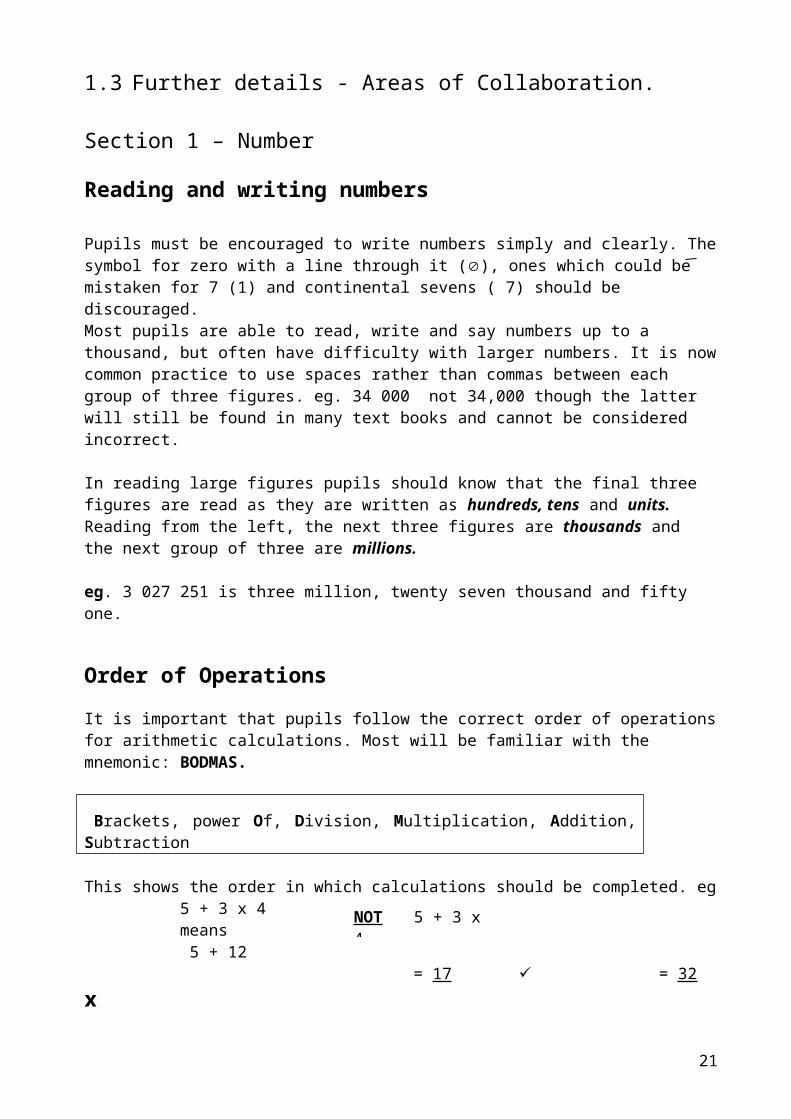
Order of OperationsIt is important that pupils follow the correct order of operations for arithmetic calculations. Most will be familiar with the mnemonic: BODMAS.
Brackets, power Of, Division, Multiplication, Addition, Subtraction
This shows the order in which calculations should be completed. eg 5 + 3 x 4means 5 + 12
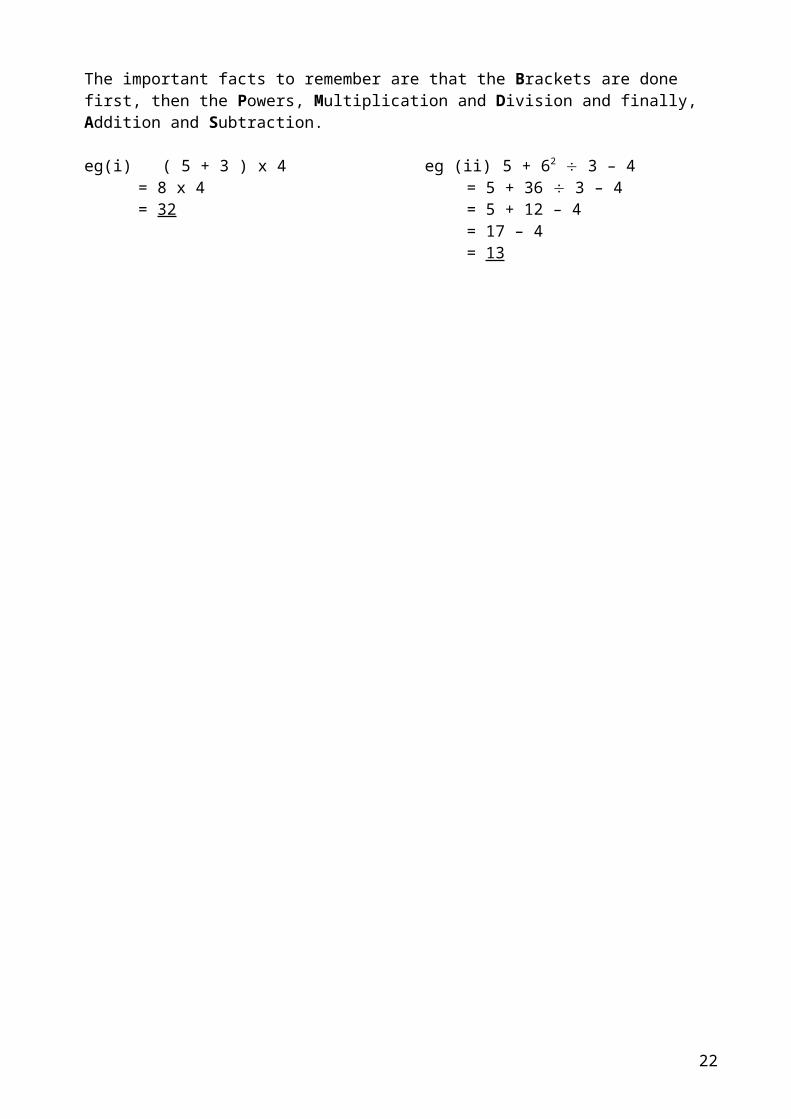
= 17 = 32 xThe important facts to remember are that the Brackets are done first, then the Powers, Multiplication and Division and finally, Addition and Subtraction.
1 For this to be correct it would have to be written: 5 – (12 + 4) so that the bracket is worked out first.
Calculators
Some pupils are over-dependent on the use of calculators for simple calculations. Wherever possible pupils should be encouraged to use mental or pencil and paper methods. It is, however, necessary to give consideration to the ability of the pupil and the objectives of the task in hand. In order to complete a task successfully it may be necessary for pupils to use a calculator for what you perceive to be a relatively simple calculation. This should be allowed if progress within the subject area is to be made. Before completing the calculation pupils should be encouraged to make an estimate of the answer. Having completed the calculation on the calculator they should consider whether the answer is reasonable in the context of the question.
Mental Calculations
Most pupils should be able to carry out the following processes mentally though the speed with which they do it will vary considerably.
recall addition and subtraction facts up to 20
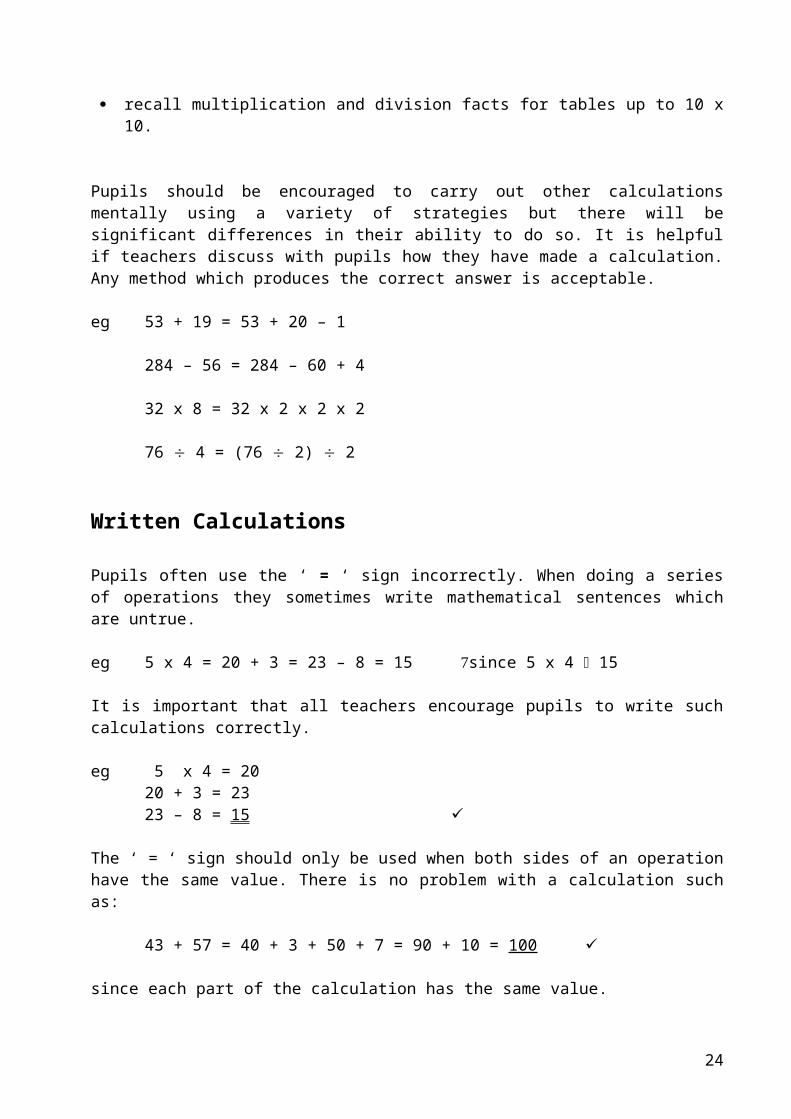
recall multiplication and division facts for tables up to 10 x 10.
Pupils should be encouraged to carry out other calculations mentally using a variety of strategies but there will be significant differences in their ability to do so. It is helpful if teachers discuss with pupils how they have made a calculation. Any method which produces the correct answer is acceptable.
eg 53 + 19 = 53 + 20 – 1
284 – 56 = 284 – 60 + 4
16
32 x 8 = 32 x 2 x 2 x 2
76 4 = (76 2) 2
Written Calculations
Pupils often use the ‘ = ‘ sign incorrectly. When doing a series of operations they sometimes write mathematical sentences which are untrue.
eg 5 x 4 = 20 + 3 = 23 – 8 = 15 since 5 x 4 15
It is important that all teachers encourage pupils to write such calculations correctly.
eg 5 x 4 = 2020 + 3 = 2323 – 8 = 15
The ‘ = ‘ sign should only be used when both sides of an operation have the same value. There is no problem with a calculation such as:
43 + 57 = 40 + 3 + 50 + 7 = 90 + 10 = 100
since each part of the calculation has the same value.
The ‘‘ (approximately equal to) sign should be used when estimating answers.
eg 2 378 – 412 2 400 – 400
2 400 – 400 = 2 000
Pencil & Paper Calculations
All pupils should be able to use some pencil and paper methods involving simple addition, subtraction, multiplication and division. Some less able pupils will find difficulty in recalling multiplication facts to complete successfully such calculations. In these circumstances it may be more useful to use a calculator in your subject to complete the task.
Before completing any calculation, pupils should be encouraged to estimate a rough value for what they expect the answer to be. This should be done by rounding the numbers and mentally calculating the approximate answer.
After completing the calculation they should be asked to consider whether or not their answer is reasonable in the context of the question.
There is no necessity to use a particular method for any of these calculations and any with which the pupil is familiar and confident should be used. Many families of schools are now discussing and beginning to agree common methods across schools.
17
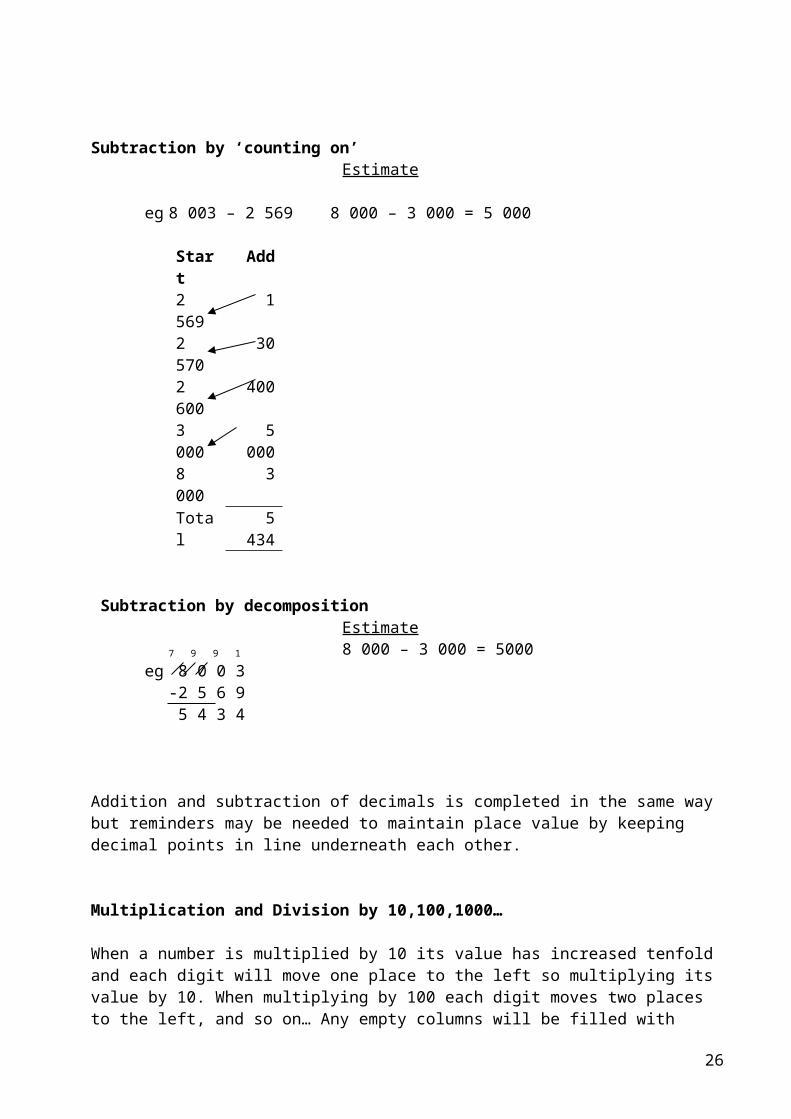
The following methods are some with which pupils may be familiar.
Addition and subtraction of decimals is completed in the same way but reminders may be needed to maintain place value by keeping decimal points in line underneath each other.
Multiplication and Division by 10,100,1000…
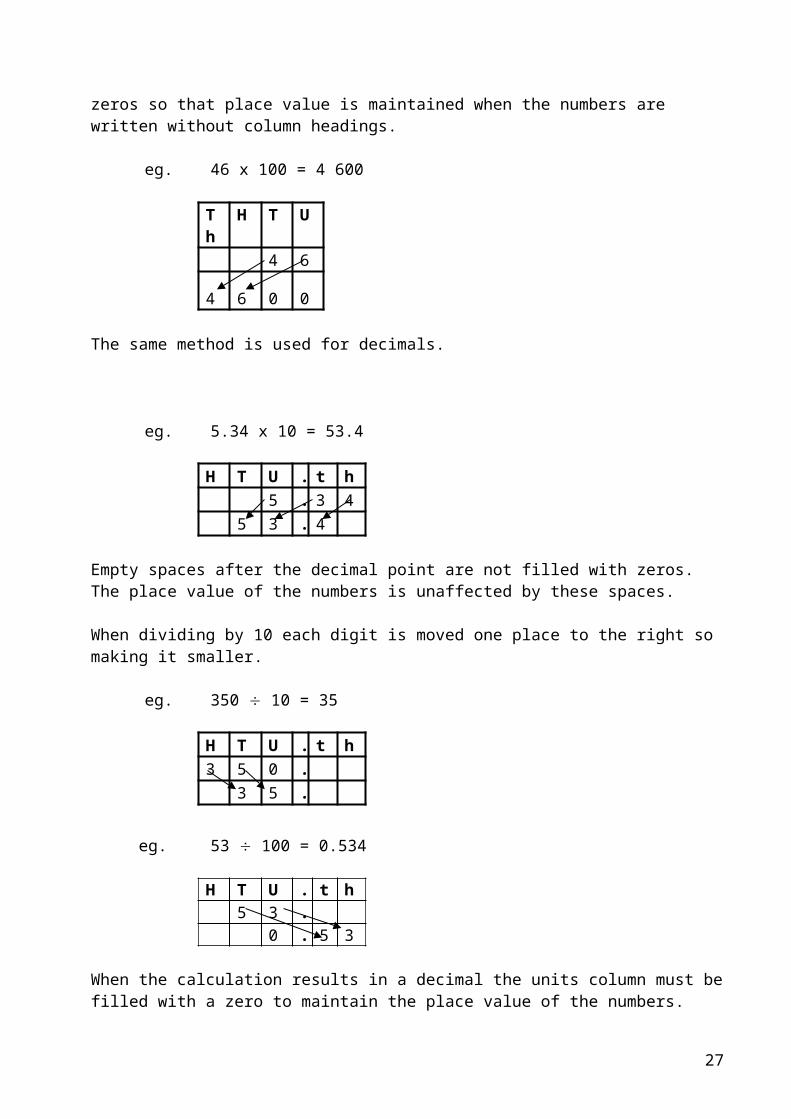
When a number is multiplied by 10 its value has increased tenfold and each digit will move one place to the left so multiplying its value by 10. When multiplying by 100 each digit moves two places to the left, and so on… Any empty columns will be filled with zeros so that place value is maintained when the numbers are written without column headings.
eg. 46 x 100 = 4 600
18
Th
H T U
4 6
4 6 0 0
The same method is used for decimals.
eg. 5.34 x 10 = 53.4
H T U . t h5 . 3 4
5 3 . 4
Empty spaces after the decimal point are not filled with zeros. The place value of the numbers is unaffected by these spaces.
When dividing by 10 each digit is moved one place to the right so making it smaller.
eg. 350 10 = 35
H T U . t h3 5 0 .
3 5 .
eg. 53 100 = 0.534
H T U . t h5 3 .
0 . 5 3
When the calculation results in a decimal the units column must be filled with a zero to maintain the place value of the numbers.
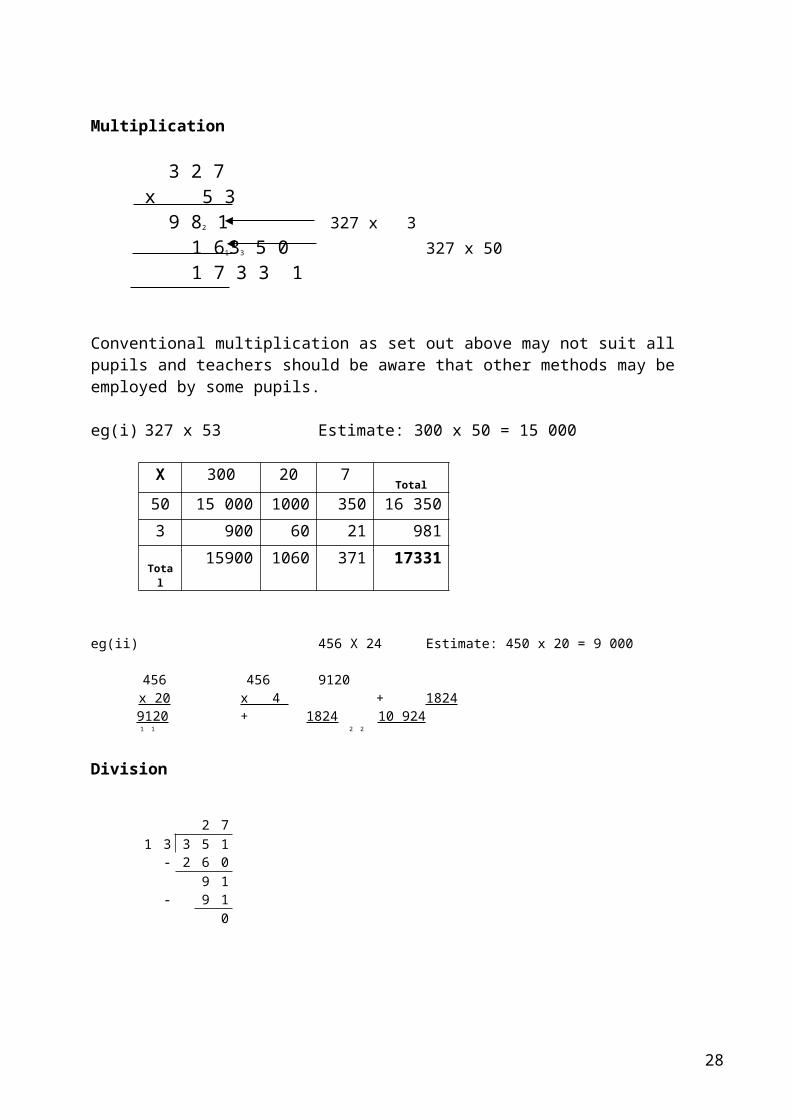
Multiplication
3 2 7x 5 3
9 82 1 327 x 3 1 6133 5 0 327 x 50 1 7 3 3 1
Conventional multiplication as set out above may not suit all pupils and teachers should be aware that other methods may be employed by some pupils.
Chunking is a method for Long Division with which some pupils will be familiar and is based on recall of multiplication of numbers by 5,10, 20 etc. followed by continuous subtraction. eg 351 13
2 71 3 3 5 1
- 1 3 0 1 02 2 1
- 1 3 0 1 09 1
- 5 2 43 9
- 3 9 30 2 7
Any remainders in this type of calculation should be written as a fraction by dividing the remainder by the number by which the calculation has been divided.
20
Multiplying Decimals
As always, estimate the answer. Complete the calculation as if there were no decimal points. In the answer insert a decimal point so that there are the same number of decimal
places in the answer as there were in the original question. Check to see if the answer is reasonableeg (i) 1.2 x 0.3 1 x 0.3 = 0.3
Ignoring the decimal points, this will be calculated as 12 x 3 = 36 and will now need two decimal places in the answer.
Whilst pupils should be familiar with many operations involving percentages in mathematics lessons it is not proposed to elaborate on all of them in this booklet. The following is a sample of operations which pupils will be expected to use in other areas.
Calculating percentages of a quantity
Methods for calculating percentages of a quantity vary depending upon the percentage required. Pupils should be aware that fractions, decimals and percentages are different ways of representing part of a whole and know the simple equivalents
eg 10% = 1/10 12% = 0.12
Where percentages have simple fraction equivalents, fractions of the amount can be calculated.
eg. i) To find 50% of an amount, halve the amount.ii)To find 75% of an amount, find a quarter by dividing by four and then multiply it by three.
Most other percentages can be found by finding 10%, by dividing by 10, and then finding multiples or fractions of that amount
eg. To find 30% of an amount first find 10% by dividing the amount by 10 and then multiply this by three.
21
30% = 3x10%Similarly: 5% = half of 10% and 15% = 10% + 5%Most other percentages can be calculated in this way.
When using the calculator it is usual to think of the percentage as a decimal. Pupils should be encouraged to convert the question to a sentence containing mathematical symbols. (‘of’ means X)
eg. Find 27% of £350 becomes 0.27 X £350 = and this is how it should be entered into the calculator.
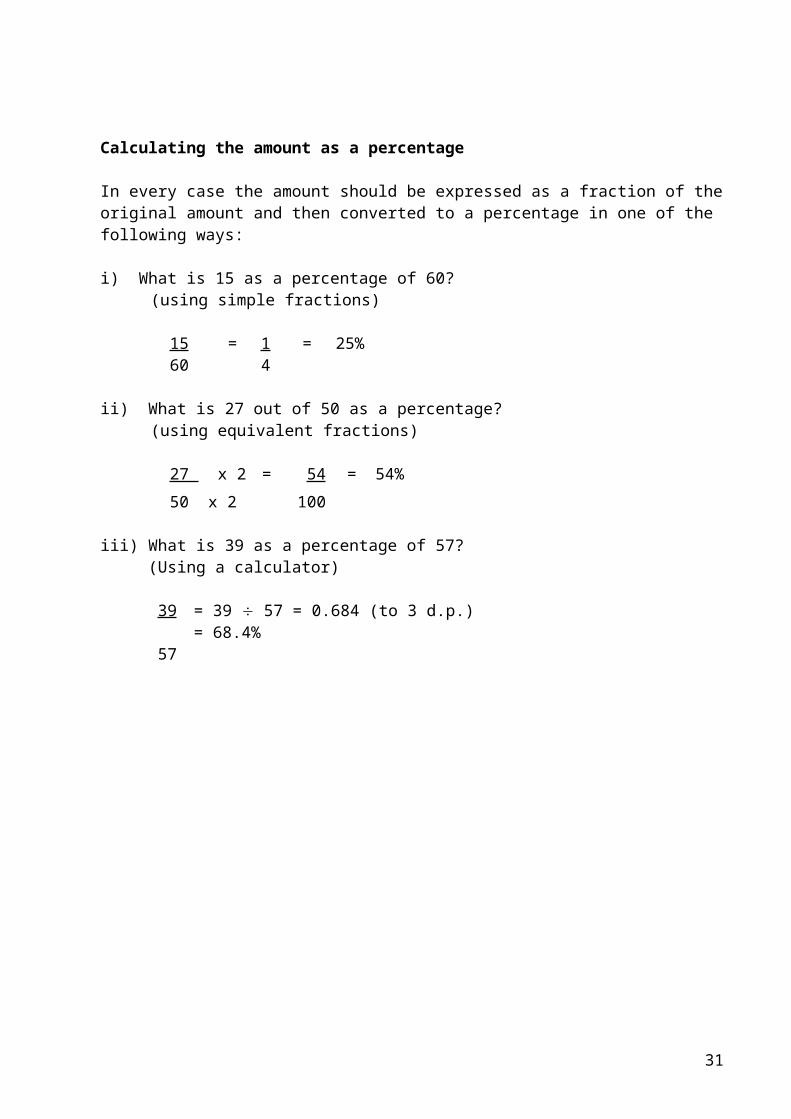
Calculating the amount as a percentage
In every case the amount should be expressed as a fraction of the original amount and then converted to a percentage in one of the following ways:
i) What is 15 as a percentage of 60? (using simple fractions)
15 = 1 = 25%60 4
ii) What is 27 out of 50 as a percentage?
(using equivalent fractions)
27 x 2 = 54 = 54%
50 x 2 100
iii) What is 39 as a percentage of 57?(Using a calculator)
39 = 39 57 = 0.684 (to 3 d.p.) = 68.4%
57
22
Section 2 – Algebra
The most common use of algebra across the curriculum will be in the use of formulae.
When transforming formulae pupils will be taught to use the ‘balancing’ method where they do the same to both sides of an equation.
eg (i) A = lb Make b the subject of the formula [l] A = b
lHowever , in some cases triangles can be useful for specific cases.
eg Density = Mass Volume
M M M
D V D V D V
Density = Mass , Mass = Density x Volume, Volume = Mass Volume Density
Similarly with Distance, Speed and Time
D D D
S T T S T S T Speed = Distance ,Distance = Speed x Time, Time = Distance
Time Speed
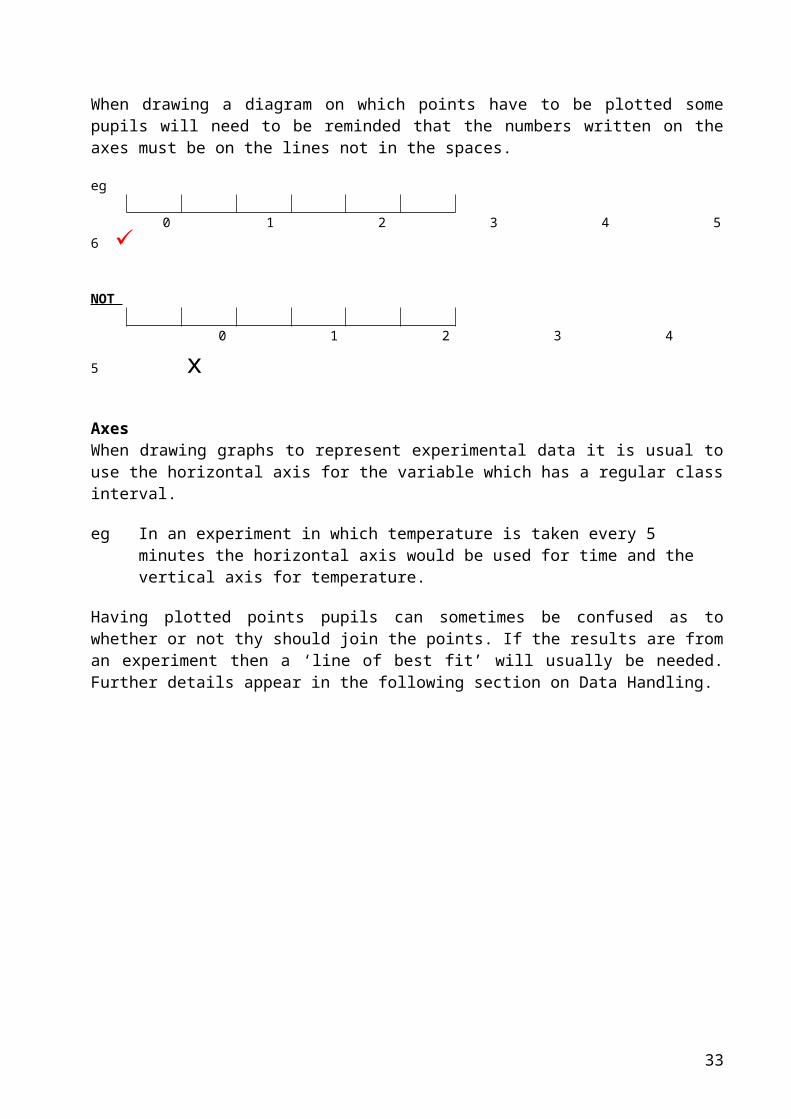
Plotting PointsWhen drawing a diagram on which points have to be plotted some pupils will need to be reminded that the numbers written on the axes must be on the lines not in the spaces.
eg
0 1 2 3 4 5 6
NOT
0 1 2 3 4 5 x
AxesWhen drawing graphs to represent experimental data it is usual to use the horizontal axis for the variable which has a regular class interval.
23
eg In an experiment in which temperature is taken every 5 minutes the horizontal axis would be used for time and the vertical axis for temperature.
Having plotted points pupils can sometimes be confused as to whether or not thy should join the points. If the results are from an experiment then a ‘line of best fit’ will usually be needed. Further details appear in the following section on Data Handling.
24
Section 3 – Data Handling
It is important that graphs and diagrams are drawn on the appropriate paper: bar charts and line graphs on squared or graph paper. pie charts on plain paper.
Bar Charts
These are the diagrams most frequently used in areas of the curriculum other than mathematics. The way in which the graph is drawn depends on the type of data to be processed.
Graphs should be drawn with gaps between the bars if the data categories are not numerical (colours, makes of car, names of pop star, etc). There should also be gaps if the data is numeric but can only take a particular value (shoe size, KS3 level, etc). In cases where there are gaps in the graph the horizontal axis will be labelled beneath the columns.
The labels on the vertical axis should be on the lines.eg.
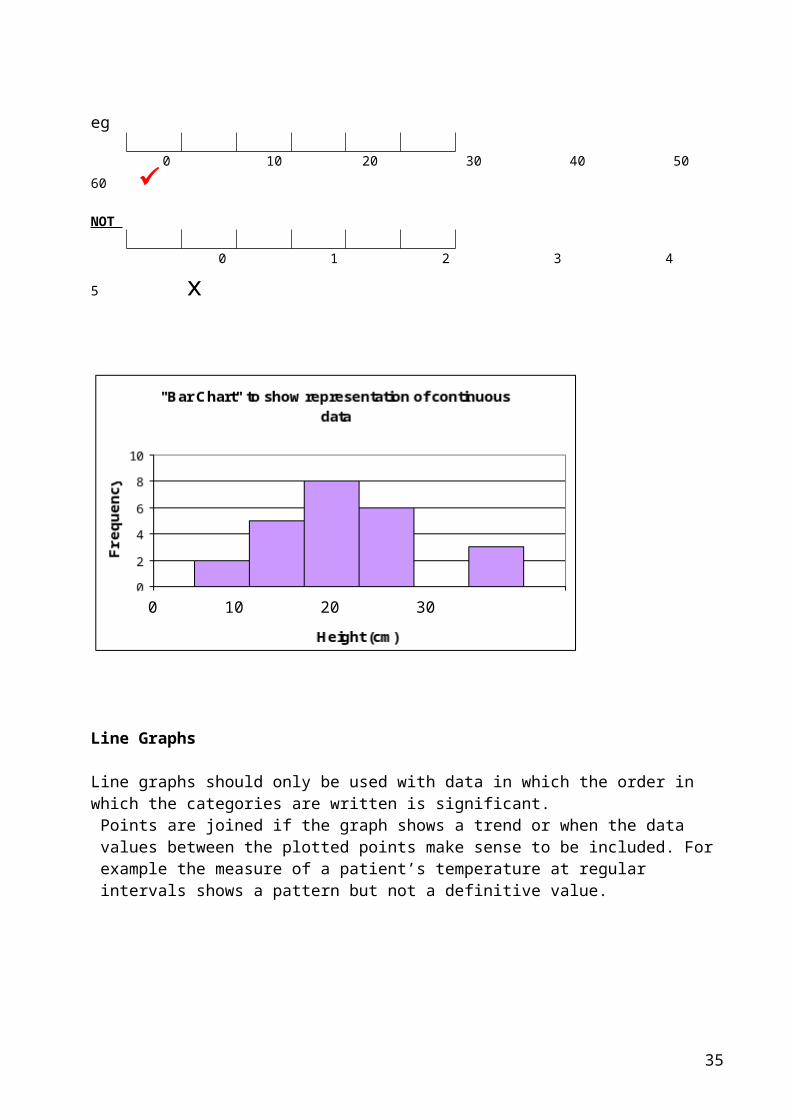
Where the data are continuous, eg. lengths, the horizontal scale should be like the scale used for a graph on which points are plotted.
eg
0 10 20 30 40 50 60 NOT
0 1 2 3 4 5 x
25
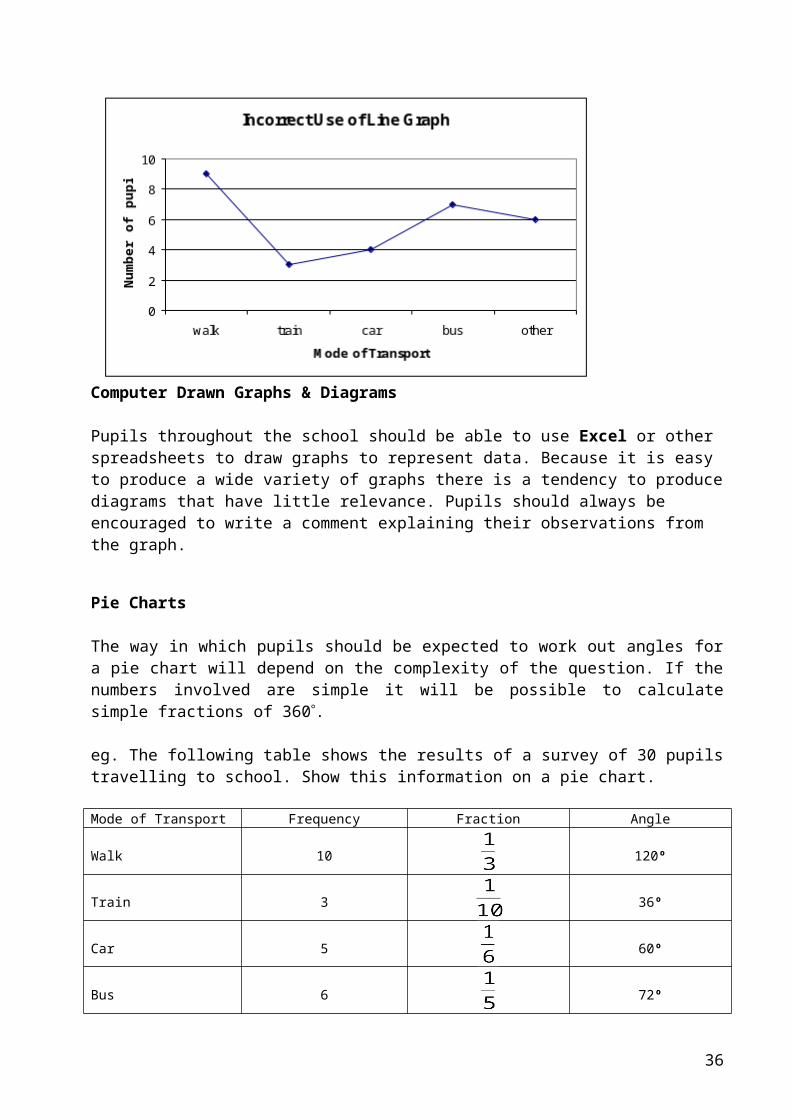
Line Graphs
Line graphs should only be used with data in which the order in which the categories are written is significant.
Points are joined if the graph shows a trend or when the data values between the plotted points make sense to be included. For example the measure of a patient’s temperature at regular intervals shows a pattern but not a definitive value.
Computer Drawn Graphs & Diagrams
Pupils throughout the school should be able to use Excel or other spreadsheets to draw graphs to represent data. Because it is easy to produce a wide variety of graphs there is
26
0 10 20 30 40 50 60 70
a tendency to produce diagrams that have little relevance. Pupils should always be encouraged to write a comment explaining their observations from the graph.
Pie Charts
The way in which pupils should be expected to work out angles for a pie chart will depend on the complexity of the question. If the numbers involved are simple it will be possible to calculate simple fractions of 360.
eg. The following table shows the results of a survey of 30 pupils travelling to school. Show this information on a pie chart.
Mode of Transport Frequency Fraction Angle
Walk 10 120º
Train 3 36º
Car 5 60º
Bus 6 72º
Other 6 72º
Total 30 1 360º
However, with more difficult numbers which do not readily convert to a simple fraction pupils should first work out the share of 360 to be allocated to one item and then multiply this by its frequency.
eg. 180 pupils were asked their favourite core subject.
27
Each pupils has 360 180 = 2 of the pie chart.
Subject Number of pupils Pie Chart AngleEnglish 63 63 x 2 = 126ºMathematics 75 75 x 2 = 150ºScience 42 42 x 2 = 84º
Total 180 360º
If the data is in percentage form each item will be represented by 3.6 on the pie. To calculate the angle pupils will need to multiply the frequency by 3.6.
eg. 43% will be represented by 43 X 3.6 = 154.8 155
Any calculations of angles should be rounded to the nearest degree only at the final stage of the calculation. If the number of items to be shown is 47 each item will need:
360 47 = 7.659574468
This complete number should be used when multiplying by the frequency and then rounded to the nearest degree.
Using Data
RangeThe range of a set of data is the difference between the highest and the lowest data values.
eg. If in an examination the highest mark is 80% and the lowestmark is 45%, the range is 35% because 80% - 45% = 35%
The range is always a single number , so it is NOT 45% - 80%
Averages Three different averages are commonly used:
Mean – is calculated by adding up all the values and dividing by the number of values.
Median – is the middle value when a set of values has been arranged in order.
Mode - is the most common value. It is sometimes called the modal group.
eg. for the following values: 3, 2, 5, 8, 4, 3, 6, 3, 2,
Median – is 3 because 3 is in the middle when the values are put in order.
2, 2, 3, 3, 3, 4, 5, 6, 8
Mode - is 3 because 3 is the value which occurs most often.
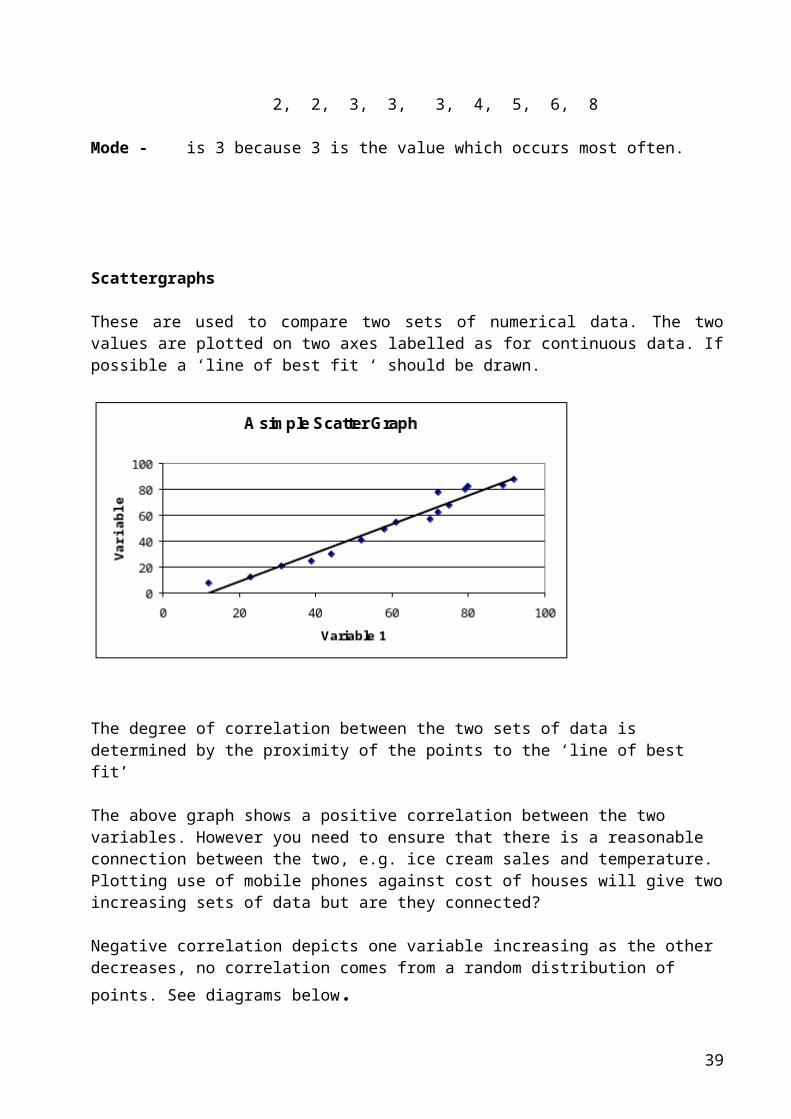
Scattergraphs
These are used to compare two sets of numerical data. The two values are plotted on two axes labelled as for continuous data. If possible a ‘line of best fit ‘ should be drawn.
The degree of correlation between the two sets of data is determined by the proximity of the points to the ‘line of best fit’
The above graph shows a positive correlation between the two variables. However you need to ensure that there is a reasonable connection between the two, e.g. ice cream sales and temperature. Plotting use of mobile phones against cost of houses will give two increasing sets of data but are they connected?
Negative correlation depicts one variable increasing as the other decreases, no correlation comes from a random distribution of points. See diagrams below.
29
30
1.4 National Documentation
Key Stage 3 National Strategy - Numeracy across the curriculum objectives
The next 3 sides contain the National Strategy objectives.This is available as an A3 leaflet.It is also useful to adapt and amend for each subject so that ONLY the relevant objectives are available for teacher reference. This cuts down on paperwork and allows teachers to focus on specific concepts and skills when appropriate and not drag in every tenuous link to their subject.As a personal foible the Using & Applying objective that appears last in the original document has been placed first in this exemplar and indeed all other versions produced by MP for the numeracy team – it is the most important aspect of children transferring confidence and competence in order to use Mathematics in all areas of study.
31
Numeracy across the curriculum
Start of Year 7 Year 7 Year 8 Year 9 (including extension objectives)
Have a sense of the size of a number and where it fits into the number system
Place value, ordering and rounding Recognise and extend number
sequences. Estimate by approximating (round to
nearest 10, 100 or 1000).
Place value, ordering and rounding Compare and order decimals; know that
when comparing measurements they must be in the same units.
Round positive whole numbers to the nearest 10, 100 or 1000 and decimals to the nearest whole number or one decimal place.
Place value, ordering and rounding Round decimals to the nearest whole
number or to one or two decimal places.
Integers, powers and roots Use squares, positive and negative
square roots, cubes and cube roots, and index notation for small positive integer powers.
Place value, ordering and rounding Multiply and divide by any integer power
of 10. Understand upper and lower bounds;
round numbers to three decimal places and a given number of significant figures.
Begin to write numbers in standard form.Integers, powers and roots Use simple instances of the index laws.
Recall mathematical facts confidentlyCalculate accurately and efficiently, both mentally and with pencil and paper, drawing on a range of calculation strategies
Calculations with whole numbers and decimals Understand and use the relationships
between the four operations, and the principles of the arithmetic laws.
Use brackets. Add and subtract two two-digit numbers
mentally. Use column addition and subtraction of
numbers involving decimals. Know multiplication facts to 10 10,
and quickly derive associated division facts.
Multiply a two-digit number by a single-digit number mentally.
Calculations with whole numbers and decimals Know and use the order of operations,
including brackets. Use standard column procedures to add
and subtract whole numbers and decimals with up to two places.
Multiply and divide three-digit by two-digit whole numbers; extend to multiplying and dividing decimals with one or two places by single-digit whole numbers.
Calculations with whole numbers and decimals Use the order of operations, including
brackets, with more complex calculations.
Use standard column procedures for multiplication and division of integers and decimals; understand where to position the decimal point by considering equivalent calculations.
Calculations with whole numbers and decimals Understand the effects of multiplying
and dividing by numbers between 0 and 1.
Calculate using fractions, decimals and percentages and use proportional reasoning to simplify and solve problems
Fractions, decimals, percentages, ratio and proportion Reduce a fraction to its simplest form by
cancelling common factors. Use a fraction as an ‘operator’ to find
fractions of numbers or quantities. Order a mixed set of numbers or
measurements with up to three decimal places.
Understand percentage as the number of parts in every 100.
Find simple percentages of small whole-number quantities.
Fractions, decimals, percentages, ratio and proportion Simplify fractions by cancelling all
common factors. Recognise the equivalence of
percentages, fractions and decimals. Calculate simple percentages and
fractions of quantities. Use ratio notation, reduce a ratio to its
simplest form, and divide a quantity into two parts in a given ratio.
Solve simple problems about ratio and proportion using informal strategies.
Fractions, decimals, percentages, ratio and proportion Add and subtract fractions by writing
them with a common denominator; calculate fractions of quantities.
Calculate percentages and find the outcome of a given percentage increase or decrease.
Reduce a ratio expressed in different units to its simplest form; divide a quantity into two or more parts in a given ratio.
Use the unitary method to solve simple word problems involving ratio and direct proportion.
Fractions, decimals, percentages, ratio and proportion Add, subtract, multiply and divide
fractions; cancel common factors before multiplying or dividing.
Compare two ratios; interpret and use ratio in a range of contexts.
Use proportional reasoning to solve a problem, choosing the correct numbers to take as 100%, or as a whole.
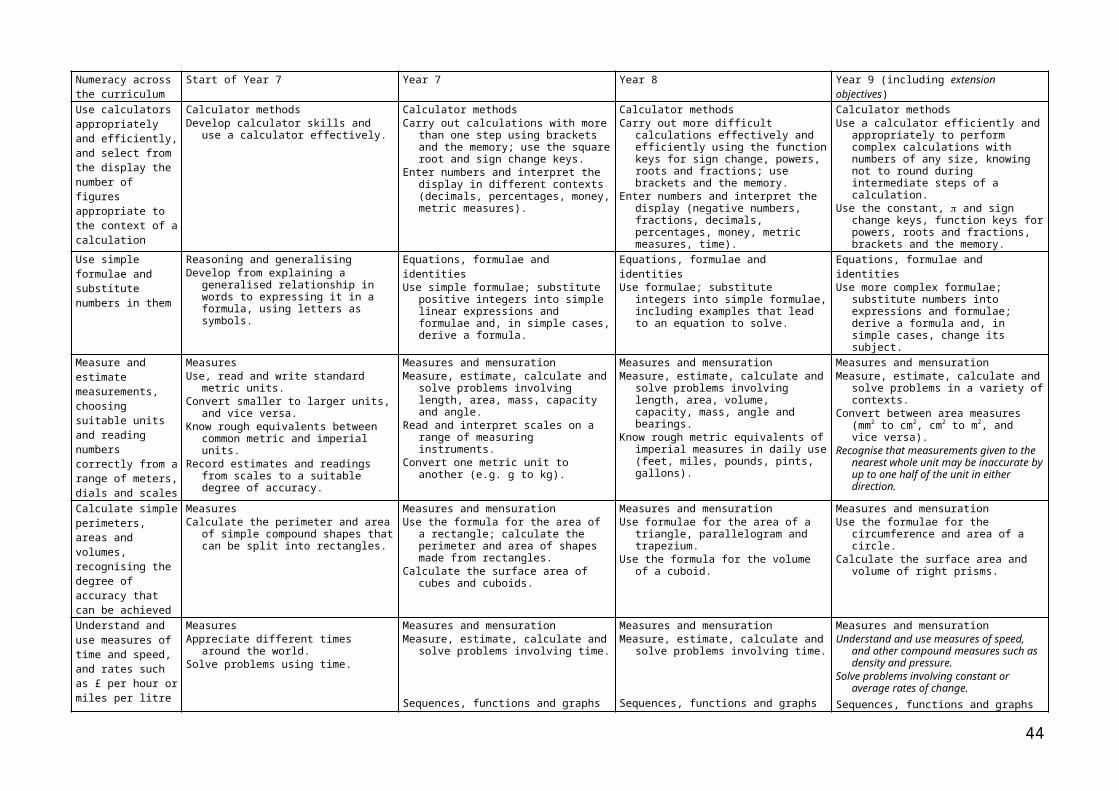
Use calculators appropriately and efficiently, and select from the display the number of figures appropriate to the context of a calculation
Calculator methods Develop calculator skills and use a
calculator effectively.
Calculator methods Carry out calculations with more than
one step using brackets and the memory; use the square root and sign change keys.
Enter numbers and interpret the display in different contexts (decimals, percentages, money, metric measures).
Calculator methods Carry out more difficult calculations
effectively and efficiently using the function keys for sign change, powers, roots and fractions; use brackets and the memory.
Enter numbers and interpret the display (negative numbers, fractions, decimals, percentages, money, metric measures, time).
Calculator methods Use a calculator efficiently and
appropriately to perform complex calculations with numbers of any size, knowing not to round during intermediate steps of a calculation.
Use the constant, and sign change keys, function keys for powers, roots and fractions, brackets and the memory.
32
Numeracy across the curriculum
Start of Year 7 Year 7 Year 8 Year 9 (including extension objectives)
Use simple formulae and substitute numbers in them
Reasoning and generalising Develop from explaining a generalised
relationship in words to expressing it in a formula, using letters as symbols.
Equations, formulae and identities Use simple formulae; substitute positive
integers into simple linear expressions and formulae and, in simple cases, derive a formula.
Equations, formulae and identities Use formulae; substitute integers into
simple formulae, including examples that lead to an equation to solve.
Equations, formulae and identities Use more complex formulae; substitute
numbers into expressions and formulae; derive a formula and, in simple cases, change its subject.
Measure and estimate measurements, choosing suitable units and reading numbers correctly from a range of meters, dials and scales
Measures Use, read and write standard metric
units. Convert smaller to larger units, and vice
versa. Know rough equivalents between
common metric and imperial units. Record estimates and readings from
scales to a suitable degree of accuracy.
Measures and mensuration Measure, estimate, calculate and solve
problems involving length, area, mass, capacity and angle.
Read and interpret scales on a range of measuring instruments.
Convert one metric unit to another (e.g. g to kg).
Measures and mensuration Measure, estimate, calculate and solve
problems involving length, area, volume, capacity, mass, angle and bearings.
Know rough metric equivalents of imperial measures in daily use (feet, miles, pounds, pints, gallons).
Measures and mensuration Measure, estimate, calculate and solve
problems in a variety of contexts. Convert between area measures (mm2
to cm2, cm2 to m2, and vice versa). Recognise that measurements given to
the nearest whole unit may be inaccurate by up to one half of the unit in either direction.
Calculate simple perimeters, areas and volumes, recognising the degree of accuracy that can be achieved
Measures Calculate the perimeter and area of
simple compound shapes that can be split into rectangles.
Measures and mensuration Use the formula for the area of a
rectangle; calculate the perimeter and area of shapes made from rectangles.
Calculate the surface area of cubes and cuboids.
Measures and mensuration Use formulae for the area of a triangle,
parallelogram and trapezium. Use the formula for the volume of a
cuboid.
Measures and mensuration Use the formulae for the circumference
and area of a circle. Calculate the surface area and volume
of right prisms.
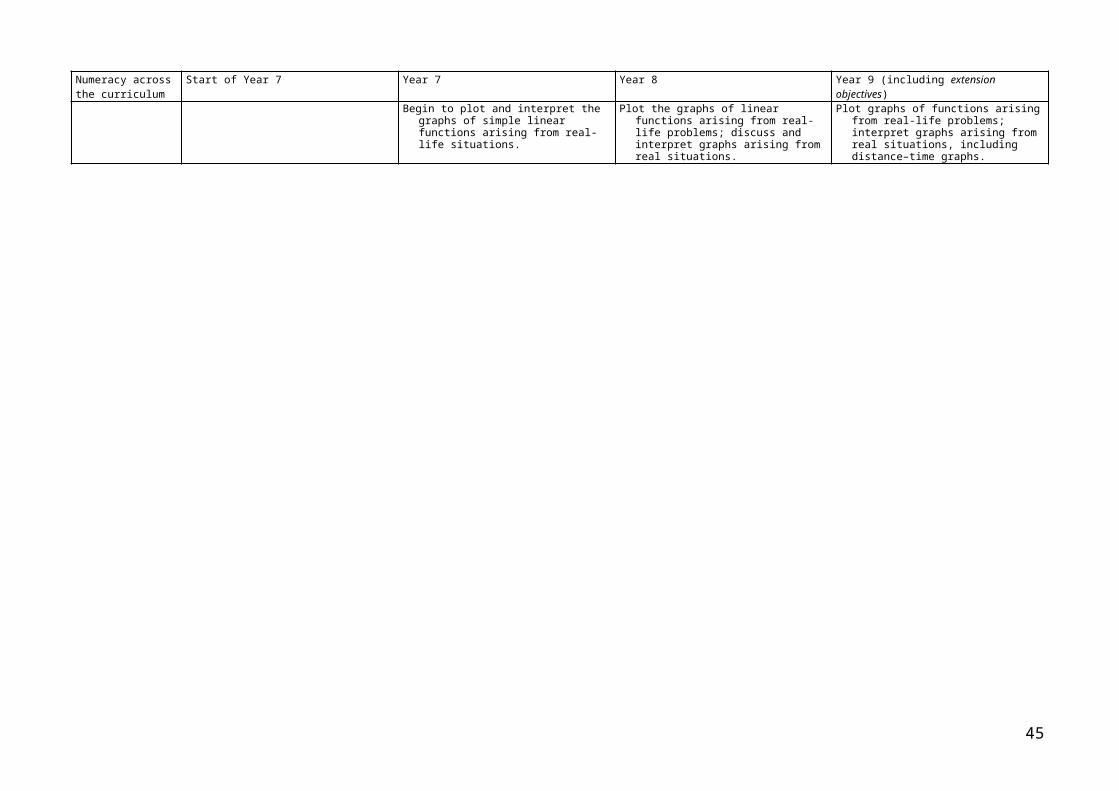
Understand and use measures of time and speed, and rates such as £ per hour or miles per litre
Measures Appreciate different times around the
world. Solve problems using time.
Measures and mensuration Measure, estimate, calculate and solve
problems involving time.
Sequences, functions and graphs Begin to plot and interpret the graphs of
simple linear functions arising from real-life situations.
Measures and mensuration Measure, estimate, calculate and solve
problems involving time.
Sequences, functions and graphs Plot the graphs of linear functions arising
from real-life problems; discuss and interpret graphs arising from real situations.
Measures and mensuration Understand and use measures of speed,
and other compound measures such as density and pressure.
Solve problems involving constant or average rates of change.
Sequences, functions and graphs Plot graphs of functions arising from
real-life problems; interpret graphs arising from real situations, including distance–time graphs.
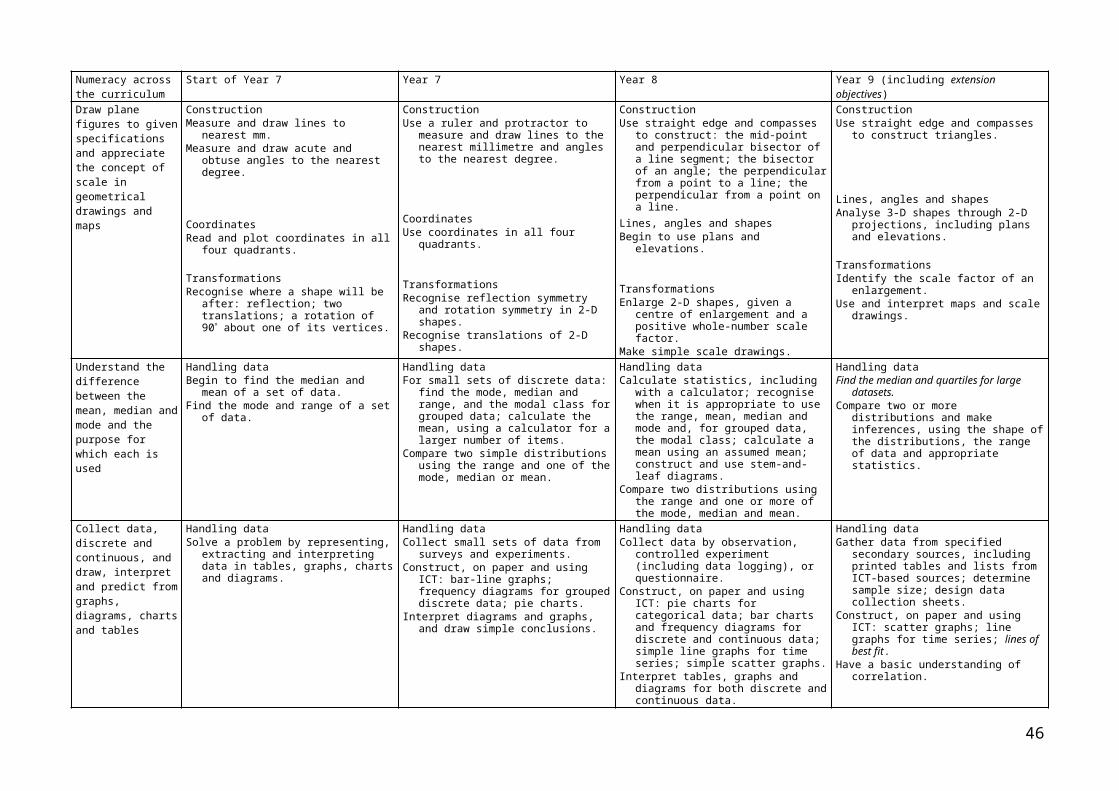
Draw plane figures to given specifications and appreciate the concept of scale in geometrical drawings and maps
Construction Measure and draw lines to nearest mm. Measure and draw acute and obtuse
angles to the nearest degree.
Coordinates Read and plot coordinates in all four
quadrants.
Transformations Recognise where a shape will be after:
reflection; two translations; a rotation of 90 about one of its vertices.
Construction Use a ruler and protractor to measure
and draw lines to the nearest millimetre and angles to the nearest degree.
Coordinates Use coordinates in all four quadrants.
Transformations Recognise reflection symmetry and
rotation symmetry in 2-D shapes. Recognise translations of 2-D shapes.
Construction Use straight edge and compasses to
construct: the mid-point and perpendicular bisector of a line segment; the bisector of an angle; the perpendicular from a point to a line; the perpendicular from a point on a line.
Lines, angles and shapes Begin to use plans and elevations.
Transformations Enlarge 2-D shapes, given a centre of
enlargement and a positive whole-number scale factor.
Make simple scale drawings.
Construction Use straight edge and compasses to
construct triangles.
Lines, angles and shapes Analyse 3-D shapes through 2-D
projections, including plans and elevations.
Transformations Identify the scale factor of an
enlargement. Use and interpret maps and scale
drawings.
33
Numeracy across the curriculum
Start of Year 7 Year 7 Year 8 Year 9 (including extension objectives)
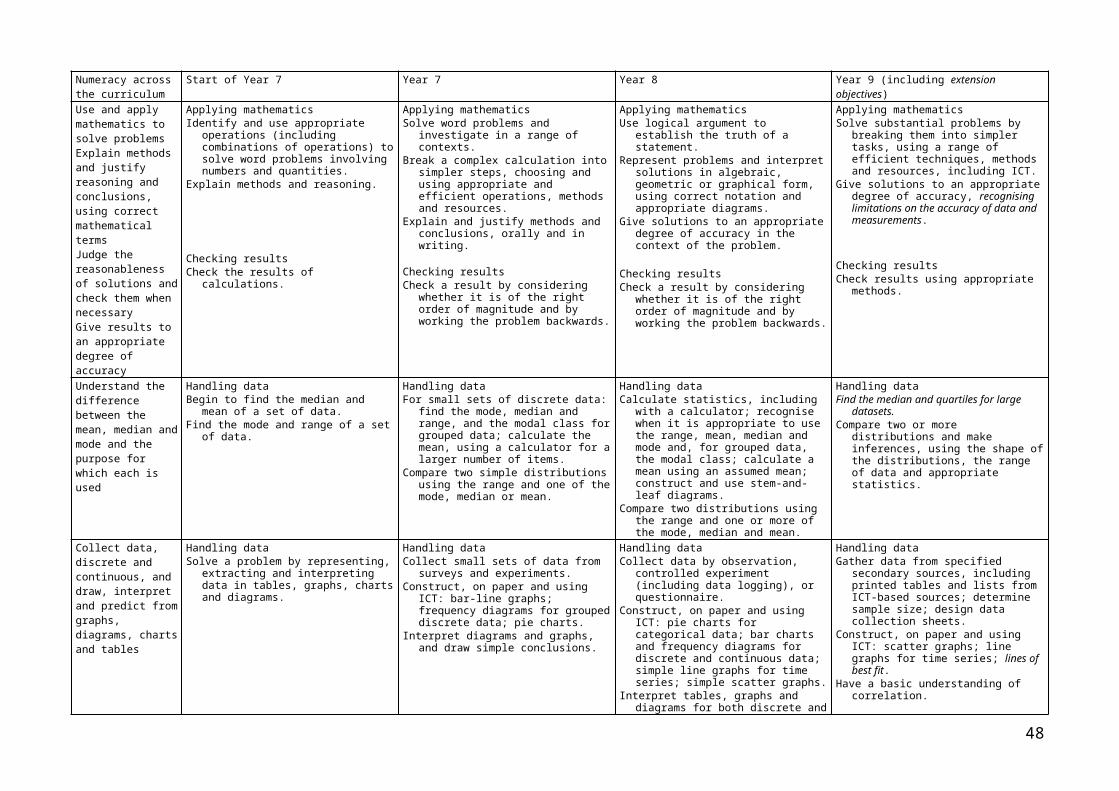
Understand the difference between the mean, median and mode and the purpose for which each is used
Handling data Begin to find the median and mean of a
set of data. Find the mode and range of a set of
data.
Handling data For small sets of discrete data: find the
mode, median and range, and the modal class for grouped data; calculate the mean, using a calculator for a larger number of items.
Compare two simple distributions using the range and one of the mode, median or mean.
Handling data Calculate statistics, including with a
calculator; recognise when it is appropriate to use the range, mean, median and mode and, for grouped data, the modal class; calculate a mean using an assumed mean; construct and use stem-and-leaf diagrams.
Compare two distributions using the range and one or more of the mode, median and mean.
Handling data Find the median and quartiles for large
datasets. Compare two or more distributions and
make inferences, using the shape of the distributions, the range of data and appropriate statistics.
Collect data, discrete and continuous, and draw, interpret and predict from graphs, diagrams, charts and tables
Handling data Solve a problem by representing,
extracting and interpreting data in tables, graphs, charts and diagrams.
Handling data Collect small sets of data from surveys
and experiments. Construct, on paper and using ICT: bar-
line graphs; frequency diagrams for grouped discrete data; pie charts.
Interpret diagrams and graphs, and draw simple conclusions.
Handling data Collect data by observation, controlled
experiment (including data logging), or questionnaire.
Construct, on paper and using ICT: pie charts for categorical data; bar charts and frequency diagrams for discrete and continuous data; simple line graphs for time series; simple scatter graphs.
Interpret tables, graphs and diagrams for both discrete and continuous data.
Handling data Gather data from specified secondary
sources, including printed tables and lists from ICT-based sources; determine sample size; design data collection sheets.
Construct, on paper and using ICT: scatter graphs; line graphs for time series; lines of best fit.
Have a basic understanding of correlation.
Have some understanding of the measurement of probability and risk
Probability Use the language associated with
probability to discuss events, including those with equally likely outcomes.
Probability Use the vocabulary and ideas of
probability, drawing on experience. Use the probability scale from 0 to 1.
Probability Use the vocabulary of probability when
interpreting the results of an experiment; appreciate that random processes are unpredictable.
Know that if the probability of an event occurring is p, then the probability of it not occurring is 1 – p.
Estimate probabilities from experimental data.
Probability Use the vocabulary of probability in
interpreting results involving uncertainty and prediction.
Understand relative frequency as an estimate of probability and use this to compare outcomes of experiments.
Use and apply mathematics to solve problemsExplain methods and justify reasoning and conclusions, using correct mathematical termsJudge the reasonableness of solutions and check them when necessaryGive results to an appropriate degree of accuracy
Applying mathematics Identify and use appropriate operations
(including combinations of operations) to solve word problems involving numbers and quantities.
Explain methods and reasoning.
Checking results Check the results of calculations.
Applying mathematics Solve word problems and investigate in
a range of contexts. Break a complex calculation into simpler
steps, choosing and using appropriate and efficient operations, methods and resources.
Explain and justify methods and conclusions, orally and in writing.
Checking results Check a result by considering whether it
is of the right order of magnitude and by working the problem backwards.
Applying mathematics Use logical argument to establish the
truth of a statement. Represent problems and interpret
solutions in algebraic, geometric or graphical form, using correct notation and appropriate diagrams.
Give solutions to an appropriate degree of accuracy in the context of the problem.
Checking results Check a result by considering whether it
is of the right order of magnitude and by working the problem backwards.
Applying mathematics Solve substantial problems by breaking
them into simpler tasks, using a range of efficient techniques, methods and resources, including ICT.
Give solutions to an appropriate degree of accuracy, recognising limitations on the accuracy of data and measurements.
Checking results Check results using appropriate
methods.
34
1.4a – Exemplar amended objectives for Religious Education
Numeracy across the curriculum
Start of Year 7 Year 7 Year 8 Year 9 (including extension objectives)
Use and apply mathematics to solve problemsExplain methods and justify reasoning and conclusions, using correct mathematical termsJudge the reasonableness of solutions and check them when necessaryGive results to an appropriate degree of accuracy
Applying mathematics Identify and use appropriate operations
(including combinations of operations) to solve word problems involving numbers and quantities.
Explain methods and reasoning.
Checking results Check the results of calculations.
Applying mathematics Solve word problems and investigate in
a range of contexts. Break a complex calculation into simpler
steps, choosing and using appropriate and efficient operations, methods and resources.
Explain and justify methods and conclusions, orally and in writing.
Checking results Check a result by considering whether it
is of the right order of magnitude and by working the problem backwards.
Applying mathematics Use logical argument to establish the
truth of a statement. Represent problems and interpret
solutions in algebraic, geometric or graphical form, using correct notation and appropriate diagrams.
Give solutions to an appropriate degree of accuracy in the context of the problem.
Checking results Check a result by considering whether it
is of the right order of magnitude and by working the problem backwards.
Applying mathematics Solve substantial problems by breaking
them into simpler tasks, using a range of efficient techniques, methods and resources, including ICT.
Give solutions to an appropriate degree of accuracy, recognising limitations on the accuracy of data and measurements.
Checking results Check results using appropriate
methods.
Understand the difference between the mean, median and mode and the purpose for which each is used
Handling data Begin to find the median and mean of a
set of data. Find the mode and range of a set of
data.
Handling data For small sets of discrete data: find the
mode, median and range, and the modal class for grouped data; calculate the mean, using a calculator for a larger number of items.
Compare two simple distributions using the range and one of the mode, median or mean.
Handling data Calculate statistics, including with a
calculator; recognise when it is appropriate to use the range, mean, median and mode and, for grouped data, the modal class; calculate a mean using an assumed mean; construct and use stem-and-leaf diagrams.
Compare two distributions using the range and one or more of the mode, median and mean.
Handling data Find the median and quartiles for large
datasets. Compare two or more distributions and
make inferences, using the shape of the distributions, the range of data and appropriate statistics.
Collect data, discrete and continuous, and draw, interpret and predict from graphs, diagrams, charts and tables
Handling data Solve a problem by representing,
extracting and interpreting data in tables, graphs, charts and diagrams.
Handling data Collect small sets of data from surveys
and experiments. Construct, on paper and using ICT: bar-
line graphs; frequency diagrams for grouped discrete data; pie charts.
Interpret diagrams and graphs, and draw simple conclusions.
Handling data Collect data by observation, controlled
experiment (including data logging), or questionnaire.
Construct, on paper and using ICT: pie charts for categorical data; bar charts and frequency diagrams for discrete and continuous data; simple line graphs for time series; simple scatter graphs.
Interpret tables, graphs and diagrams for both discrete and continuous data.
Handling data Gather data from specified secondary
sources, including printed tables and lists from ICT-based sources; determine sample size; design data collection sheets.
Construct, on paper and using ICT: scatter graphs; line graphs for time series; lines of best fit.
Have a basic understanding of correlation.
35
1.5 Mathematical Association Audit
Reproduced here is the Maths Association audit. It has been modified to fit with Key Stage 3 High schools – further adaptations could be used for 10+, upper or all through schools.
Mathematical Skills N.C. Level NNS Year Year 7 Year 8 Year 9
Number and AlgebraUnderstand place value and order numbers up to 100
2 2
Know when to add or subtract when solving problems
2 2, 3, 4
Recognise odd and even number 2 2
Read and write numbers in figures and words, up to a million
4, 5
Round numbers to the nearest 10, 100 or 1000
3 3, 4, 5
Use <, >, <, > and = symbols 4, 5
Mental addition and subtraction of 2 digit numbers
3 4
Written addition and subtraction of three digit numbers
3 4
Multiplication tables – 2, 3, 4, 5 and 10 and associated division facts
3 4
Use simple fractions and recognise when two simple fractions are equivalent
3,4 4
Use decimal notation – money 3 4
Recognise and use negative numbers in context
3 4
Multiplication tables up to 10 X 10 and associated division facts
4 5
Multiply and divide whole numbers by 10 and 100
4 4,.5,6
Written addition and subtraction of whole numbers
4 5
Short multiplication and division of whole numbers
4 5
Add and subtract decimals to two decimal places
4 5,6
Order decimals to three decimal places
4 6
Recognise and use simple percentages
4 5
36
N.C. Level NNS Year Year 7 Year 8 Year 9Use simple formulae expressed in words
4 4,5,6
Use co-ordinates in the first quadrant
4 4,5
Multi[ply and divide decimals by 10, 100, 1000
5
Order, add and subtract negative numbers in context
5 5,6
+, -, X, ÷ with up to 2 decimal places
5 5, 6
Calculate fractions of quantities 5 5, 6
Use simple ratio and proportion 5 5, 6
Long multiplication 5 5, 6
Long division 5
Check answers using inverse operations
5 4, 5, 6
Estimate and check answers using approximations
5 4, 5, 6
Construct simple formulae 5 5, 6
Use co-ordinates in four quadrants
5 6
Calculate a number as a fraction of another
6 4, 5, 6
Calculate a number as a percentage of another
6 6
Understand and use fraction, decimal and percentage equivalence
6 5, 6
Add and subtract fractions 6 7
Calculate using ratios 6 7
Solve linear equations 6 7
Use co-ordinates for geographical representation
6 7
Calculate percentages of quantities
5 5, 6
Use simple formulae 5 5, 6
Use significant figures 7 9
Multiply and divide fractions and decimals
7 9
37
N.C. Level NNS Year Year 7 Year 8 Year 9Use a calculator efficiently and appropriately
7 9
Use proportional change 7 9
Solve simultaneous linear equations graphically
7 9
Solve simultaneous linear equations algebraically
7 9
Solve simple inequalities 7 9
Calculate power and roots 8
Use standard form 8
Use formulae involving fractions, decimals or negative numbers
8
Calculate the original quantity given the result of proportional change
Find formulae that approximately connect data and express general laws in symbolic form
EP
Use direct proportion EP
Use indirect proportion EP
Use the rules of indices EP
Solve problems using intersections or gradients of graphs
EP
38
Mathematical Skills N.C. Level
NNS Year Year 7 Year 8 Year 9
Shape, Space and Measures
Mathematical names for 2-D and 3-D shapes
2 4, 5, 6
Understand angle as a measure of turn
2 4, 5, 6
Recognise right angles 2 4
Understand reflective symmetry
3 4, 5, 6
Use metric units of length, capacity, mass and time
3 4, 5, 6
Solve problems involving time or timetables
4, 5
Make simple 3-D models from nets
4 4, 5, 6
Draw 2-D shapes in different orientations
4
Understand rotational symmetry
4 4, 5, 6
Reflect simple shapes in a mirror line
4 4, 5, 6
Measure and read scales using appropriate units and accuracy
4 4, 5, 6
Find perimeters of simple shapes
4 4, 5, 6
Find areas by counting squares
4 4, 5
Measure and draw angles 5 5, 6
Know the angle sum of a triangle
5 6
Know the sum of angles at a point
5 6
Identify all the symmetries of 2-D shapes
5 4, 5, 6
Convert one metric unit to another
5 5, 6
Know rough metric/imperial equivalence of common units
5 6
Estimate measures 5 4, 5, 6
Know and use the formula for the area of a rectangle
5 5
Draw and interpret simple scale drawingsRecognise 2-D representations of 3-D
6 4, 5, 6
39
shapesN.C. Level
NNS Year Year 7 Year 8 Year 9
Know and use properties of quadrilaterals
6 7
Use angle and symmetry properties of polygons
6 7
Use angle properties of intersecting and parallel lines
6 8
Devise instructions for a computer to generate and transform shapes
6 7,8,9
Use the formula for the circumference of a circle
6 9
Use the formula for the area of a circle
6 9
Find the areas of plane rectilinear figures
6 7
Use the formulae for the volume of a cuboid
6 8
Enlarge shapes by a positive whole number scale factor
6 8
Use Pythagoras' Theorem in 2-D
7 9
Calculate lengths and areas in plane shapes
7
Calculate volumes of prisms 7 9
Enlarge shapes by a fractional scale factor
9
Determine the locus of a moving object
7 8,9
Understand the limitations of accuracy of measurements
7
Understand and use compound measures
7
Understand and use similarity and congruence
8
Use trigonometry in 2-D 8
Distinguish between formulae for perimeter, area and volume by considering dimensions
EP
Use Pythagoras' Theorem in 3-D
EP
Use trigonometry in 3-D EP
Calculate lengths of circular arcs
EP
Calculate areas of sectors EP
40
Calculate surface area of cylinders
EP
Calculate volume of cones and spheres
EP
41
Mathematical Skills N.C. Level
NNS Year Year 7 Year 8 Year 9
Handling dataSort and classify objects by more than one criterion
2 4
Record results in simple lists, tables and block graphs
2 2
Interpret simple tables and lists
3 3
Interpret pictograms 3 3, 4
Draw pictograms 3 3, 4
Interpret bar graphs 3 4, 5, 6
Draw bar graphs 3 4, 5, 6
Collect data and record them using frequency tables
4 4, 5, 6
Understand and use the mode, the median and the range of a set of data
4 4, 5
Group collected data into equal class intervals
4
Draw frequency diagrams using grouped data
4 6
Interpret line graphs 4 5, 6
Select and use appropriate scales for axesDraw line graphs 4 5, 6
Understand and use the mean of a set of data
5 6
Use averages and ranges to compare two sets of data
5 7
Interpret pie charts 5 6
Understand and use the probability scale from 0 to 1
5 7
Find probabilities using equally likely outcomes or experiment
5 7
Create frequency tables with equal class intervals to record continuous data
6 8
Interpret frequency diagrams 6 8
Draw frequency diagrams 6 8
Draw pie charts 6 8
42
N.C. Level
NNS Year Year 7 Year 8 Year 9
Draw scatter diagrams 6 8
Understand simple correlation
6 9
Use two-way tables to record all the possible outcomes of two events
6 8
Use the fact that the total probability of all mutually exclusive outcomes of an experiment is 1
6 8
Specify and test hypotheses using appropriate methods and taking account of variability and bias
7 9
Find modal class of grouped data
7 9
Estimate the mean, median and range of grouped data
7 9
Use averages and ranges and frequency polygons to compare two sets of data
7 9
Draw a line of best fit on a scatter diagram
7 9
Use relative frequency to estimate probability
7 9
Interpret cumulative frequency tables and diagrams
8
Construct cumulative frequency tables and diagrams
8
Estimate the median, quartiles and inter-quartile range from a cumulative frequency diagram
8
Interpret histograms with unequal class intervals
EP
Understand and use sampling
EP
Draw histograms with unequal class intervals
EP
Use Spearman's coefficient of correlation
EP
43
The number in the second column of the table gives the level of each item in the Mathematics National Curriculum. The table below indicates the highest overall level of work that the majority of pupils in the various ability groups are likely to cover in mathematics lessons.
Year 7 Year 8 Year 9Set 1 6 7 8Set 2 5 5/6 6/7Set 3 3/4 4 5Set 4 2/3 3/4 4
Subject Key
Bs – Business StudiesDa – DanceDr – DramaDt – Design TechnologyEn – EnglishFt – Food TechnologyGg – GeographyHi – HistoryIt – Information and Communication TechnologyLa – LanguagesMa – MathematicsMu – MusicPe – Physical EducationRe – Religious EducationSc – Science
44
1.5a Exemplar of Completed Audit
Audits were distributed to all departments in school. Collated returns allowed for discussion on techniques and teaching strategies.
The school had a high priority on “Graphicacy” and Handling data, following on from a whole staff after school INSET session on Numeracy and Data Handling, with links to ICT This was delivered by the Head of Mathematics in conjunction with a teacher from Humanities and a teacher from Science who both spoke about their use of graphs.Much of the material used was taken from the DfES Numeracy across the Curriculum school based training folder.
Mathematical Skills N.C. Level
NNS Year Year 7 Year 8 Year 9
Handling dataSort and classify objects by more than one criterion
2 4
Record results in simple lists, tables and block graphs
Collect data and record them using frequency tables
4 4, 5, 6 Dt Dt Dt
Understand and use the mode, the median and the range of a set of data
4 4, 5 Gg Gg Gg
Group collected data into equal class intervals
4 Dt Dt Dt
Draw frequency diagrams using grouped data
4 6 Dt Dt Dt
Interpret line graphs 4 5, 6 Sc, Gg, Hi Sc, Gg, Hi Sc, Gg, Hi
Select and use appropriate scales for axes
Sc, Gg Sc, Gg Sc, Gg
Draw line graphs 4 5, 6 Sc, Gg Sc, Gg Sc, Gg
Use the vocabulary of Probability
4 Pe Pe Pe
Understand and use the mean of a set of data
5 6 Gg Gg
Use averages and ranges to compare two sets of data
5 Sc Sc, Gg
45
N.C. Level
NNS Year Year 7 Year 8 Year 9
Interpret pie charts 5 6 Sc Sc Sc
Understand and use the probability scale from 0 to 1
5
Find probabilities using equally likely outcomes or experiment
5
Create frequency tables with equal class intervals to record continuous data
6 It Dt
Interpret frequency diagrams 6
Draw frequency diagrams 6 It Dt Dt
Draw pie charts 6 It, Hi Dt, Hi Hi, Dt
Draw scatter diagrams 6 Dt
Understand simple correlation 6
Use two-way tables to record all the possible outcomes of two events
6
Use the fact that the total probability of all mutually exclusive outcomes of an experiment is 1
6
Specify and test hypotheses using appropriate methods and taking account of variability and bias
7 Sc Sc
Find modal class of grouped data
7
Estimate the mean, median and range of grouped data
7
Use averages and ranges and frequency polygons to compare two sets of data
7
Draw a line of best fit on a scatter diagram
7 Sc Sc
Use relative frequency to estimate probability
7
Interpret cumulative frequency tables and diagrams
8
Construct cumulative frequency tables and diagrams
8
Estimate the median, quartiles and inter-quartile range from a cumulative frequency diagram
8
Interpret histograms with unequal class intervals
EP
46
N.C. Level
NNS Year Year 7 Year 8 Year 9
Understand and use sampling EP Dt (food) Dt (food) Dt (food)
Draw histograms with unequal class intervals
EP
Use Spearman's coefficient of correlation
EP
47
1.6 Possible job description / role for a Numeracy across the Curriculum co-ordinator
Salary:1 additional management allowance
Responsible to:Head of Mathematics & Mathematics Line Manager in SMT
Objectives:To assist the Head of Mathematics in developing numeracy strategy initiatives within the departmentTo develop Mathematics in all other curriculum areas in the school; enabling staff confidence and common approaches.To lead on the applications of mathematics in other subjects and in our every day lives
Key Responsibilities:To co-ordinate the numeracy content in all teaching areasTo provide appropriate Staff INSET and disseminate LEA coursesTo map the progression of numeracy skills across the curriculum
Initial tasks:To plan a way forward over the next two years for all staff and pupils to raise their awareness and use of numeracy skillsTo liaise with Key Stage 2 and Key Stage 4 staff with regard to numeracy developmentsTo integrate numeracy into our home school liaison programme


![Whole Hospital Policy 011111[1]](https://static.documents.pub/doc/80x56/577cc6a61a28aba7119ec61b/whole-hospital-policy-0111111.jpg)


