25


To provide excellent management of the beverage alcoholindustry in Newfoundland and Labrador.
Who We Are
The Newfoundland Liquor Corporation (NLC) is a provincial crown corporation responsible for managing the importation, sale anddistribution of beverage alcohol throughout Newfoundland and Labrador.
We are:
A socially responsible retailer
A manufacturer
An exporter
An employer
operating 22 stores throughout the province, servicing 94 agency stores and distributing to more than 1,500 licensees.
blending and bottling in excess of 83,200 cases of high-quality spirits annually.
of Newfoundland brands and blends throughout Canada and around the world.
dedicated to developing and supporting a skilled workforce throughout the province.

Letterto the MinisterPresident’sMessageRetail andDistribution EffectivenessManufacturingGrowth and ExcellenceExportGrowthInvestingin a Quality WorkplaceSocialResponsibilityFinancialPerformanceCorporateStatisticsNLC CorporateStores Revenue
Table of Contents
page 2
page 3
page 4
page 9
page 10
page 11
page 13
page 14
page 20
page 21

To provide excellent management of the importation,
distribution and sale of quality beverage alcohol.
The Corporation will maximize revenues within a framework
of social responsibility. It will focus on customers, build
partnerships and provide a quality workplace for employees.
Board of Directors (l-r)Jamie M. Smith
Margaret Ayad
Fred Harding
Cecil Lake
Meta Kennedy
Michelle Batterson
Gerald G. Glavine
ChairmanDirector
DirectorDirector
DirectorDirector
President and CEO

Honourable Joan Marie AylwardMinister of FinanceGovernment of Newfoundland and LabradorSt. John’s, NewfoundlandCanada A1B 4J6
Dear Ms. Aylward:
It is my pleasure to submit the 28 annual report of the NewfoundlandLiquor Corporation (NLC). The report covers the fiscal year endingMarch 31, 2001 and summarizes the Corporation’s activities duringthis reporting period.
Sincerely yours,
Gerald G. GlavinePresident and CEO
th
2

President’sMessage
!
!
!
!
!
!
!
Focus on customersProvide quality productsBe a valued business partnerAct with integrity and professionalismBe progressive and responsiveBe a supportive employerPromote responsible use of alcohol
The Corporation will:
3
Progress. Dedication. Growth. These words reflect the corporatespirit of NLC in 2000-01. In all our activities this past year, wewere guided by the goals and objectives of our strategic plan andby the commitment expressed in its mission statement toexcellence in management and to both fiscal and socialresponsibility.
Fiscally, we are pleased to report a year of continued strengthand growth. NLC sales increased in almost all categories. Werealized a net profit of more than $96 million, an increase ofmore than $3 million over the previous year.
As a retailer, we are committed to enhancing consumer choice.Our product listings increased 3.7% during 2000-01. We areoffering an expanded program of in-store promotions. And, ofcourse, our popular Wine Fest continues to grow and was a sold-out success in 2000-01.
As part of our commitment to customer service, we areexpanding and improving our retail spaces. In 2000-01, weopened a second specialty gift store in St. John's, relocated theStephenville store and began to renovate one of our busiestlocations, the Elizabeth Avenue store. Customers can now benefitfrom the opening of three new agency locations, including theMarine Atlantic ferries between Port Aux Basques and NorthSydney. By year end, NLC had a total of 94 agency stores and 22retail outlets to serve the people of Newfoundland and Labrador.
As a manufacturer, we moved forward with initiatives to maximizeproduction efficiencies and enhance our profile as a majorexporter of Newfoundland brands. Bottling plant production wasup 4% over the previous year, and we continue to improve ourfacilities. We also increased our interprovincial sales by 33% overthe previous year.
Social responsibility is part of all that we do. Throughout the year,NLC worked to raise awareness and promote public safety. Ourbroad-based effort included a high-profile Don't Drink and Drive
campaign. We also focused on safe snowmobiling andtargeted drinking by minors. We supported communityorganizations, welcoming into our stores MADD's RedRibbon Campaign and the Salvation Army's KettleCampaign.
We continue to move from being a supply-basedorganization to a socially responsible, customer-focused retailer. As we do so, we are working hard toimprove operating efficiencies and to advance ourtechnological capabilities. We are building a knowledgebase that will enhance our ability to serve ourcustomers and respond to their needs.
This past year, we have our employees to thank for ourcontinued growth and for their willingness to embracechange. In addition, we would also like to thank ourBoard of Directors for their strong and effectiveleadership, and for their vision in moving ourorganization forward.
Gerald G. GlavinePresident and C.E.O.

Retail and DistributionEffectiveness
2000-01 was a year of growth for NLC sales.Throughout the year, we experiencedcontinued growth across most spiritcategories.
Rums increased 6.6%.Whiskey increased 1%.Vodka increased 6%.Liqueurs increased 9%.Coolers increased 27%.Wine increased 11.3%, fueled by offeringsfrom Australia, Chile and South Africa.Indications are for continued, similar growthin the upcoming year.
Effective warehousing is essential to excellence in both management and customer service.
A superb effort by warehouse personnel enabled NLC to effectively service customer needs during a very busy year. We received andshipped 630,000 cases of product, an 8% increase over the previous year.
We are improving and expanding. Acquisition of and connection to facilities on 85 O’Leary Avenue will provide NLC with an expandedwarehouse facility by spring 2002. With the right personnel in place, rationalization of inventory quantities and a refined ordering process,we expect to streamline our entire supply chain.
Effective Warehouse Management
4
62.2%
25.3%10.1%
1.5%0.9%
50.9%
20.2%
10.3% 8.5%
10.1%
Sales - Spirits, Wine, BeerBeer CommissionHarmonized Sales TaxLicensee TaxMiscellaneous
Province of NewfoundlandSupplierAdministrative ExpensesFederal Taxes
CustomsExcise
Harmonized Sales Tax
Fiscal Year 2000-2001 Fiscal Year 2000-2001
Application of RevenueSources of Revenue

Loss Prevention and Effective Auditing
Effective loss prevention and auditing procedures are essential to both profitability and accountability.
The ongoing efforts of store employees combined with well-defined control procedures resulted in another successful year for lossprevention. Store losses represented .08% of total sales.
During the year, audit procedures were conducted on 10 NLC stores and 38 agency stores according to a plan based on riskassessment and priority. Audits were also conducted on three local breweries to verify production reports and related NLCcommissions.
The records of a Newfoundland winery during an eight-year period were examined to ascertain the mark-up payable to NLC on winesales at the winery’s on-site store.
Financial analysis and credit verifications were completed on applications for five agency store competitions held during the year.Support was provided for agency transfers, and timely audit visits were scheduled for newly established agencies.
Assistance was given to store operations to implement the optimum control system for Wine Fest 2000.
NLC assisted the external auditors with their audit plan, the interim audit and year-end procedures. This reduced both audit time andexpense.
Loss Prevention
Effective Auditing
5

Refocusing Our Building Blocks of Customer Service
NLC strives for excellence in meeting the needs of our customers. We aim to provide quality products and services delivered byknowledgeable employees in attractive and accessible facilities.
We are modernizing and adding to our retail outlets. To serve our customers better, NLC opened a new store this year, relocated anotherand began to renovate an existing store.
In December 2000, we opened our second year-round gift store–a 2,700 square-foot location at the Village Mall in St. John’s. Sales havebeen encouraging and are expected to meet projected volumes.
We relocated our Stephenville store to 6,000 square feet of new, modern premises. This outlet is the first in the province to provide a fullyequipped chill room.
NLC plans to renovate all our retail stores as part of our six-year plan. This year, major renovations began at the Elizabeth Avenue store inSt. John’s. Completed renovations will include a significantly larger retail space and a chill room for improved customer service.
We are opening new agency stores. Agency stores expand our retail base to many communities throughout Newfoundland and Labrador.This year, new agency stores were opened in Grey River and Port Blandford. As well, a contract went to Marine Atlantic for the Port AuxBasques to North Sydney ferry service. This initiative was in direct response to passenger requests.
Improving Access and Availability
Three agency stores changed ownership this year; in Bay L’Argent, Queen’s Cove and Robert’s Arm. In all cases, agency storecompetitions were held.
6

We are enhancing customer choice through product listings. To ensure that our product selection meets our dual objective ofsatisfying our customers while optimizing profits, we reviewed our product portfolio. Total active listings number 1,697, an increaseof 3.7% over the previous year. Liqueurs and wines account for most new product additions.
We are implementing a new Shelf Management Plan. Five stores implemented a new plan designed to increase profitability throughchanges in product placement. This initiative, undertaken in conjunction with the Atlantic Association of Canadian Distillers, will beevaluated before adoption in other outlets.
We are expanding our in-store promotions. In-store promotions are increasingly popular with both suppliers and customers. Theyprovide opportunities for customer education and input on our products. We are streamlining our promotions planning. In 2000-01,NLC replaced our yearly promotions schedule with a quarterly schedule. This allows both suppliers and stores to be moreresponsive and effective in focusing on programs to reflect market trends.
Wine Fest continues to grow. NLC’s three-day consumer exhibition featuring wines from around the world was held for the fifthconsecutive year in November 2000. The festival grows each year, with ticket demand exceeding availability, and capacity attendanceof about 2,500 people this year. Representatives of the hospitality industry were invited to attend.
Wine Fest 2000 featured sampling sessions, supplier seminars, a wine-makers luncheon hosted by Italian supplier Banfi, and a galadinner. NLC established a temporary on-site retail store for the event, with sales up more than 12% from the previous year. Aportion of ticket sales–over $5,000 in 2000–was donated to the Newfoundland Symphony Orchestra.
Effective Marketing and Customer Education
March 31, 2000
March 31, 2001
Product Listings 2000/2001
Spirits Wine Imported Beer Coolers
53
495
1,03
9
505
34 68
1,10
4
35
7

Building an Effective Point of Sale System
Point of Sale is where knowledge management meets customer service.
NLC is progressing toward a Point of Sale (POS) system. In 2000, the project’s evaluation team identified a short-list of preferredvendors. Full deployment of the POS system is targeted for late spring/early summer 2002.
New technology and office automation tools were provided to all 22 NLC stores this year to ensure readiness for the launch of POS.
8
Per Capita Consumption (litres)
1997 1998 1999 2000 2001 1997 1998 1999 2000 2001 1997 1998 1999 2000 2001
Spirits Wine Beer
5.79
6.98 7.08
6.10 6.
44 7.15
6.69 7.
50 7.78
11.3
1
89.3
7
99.4
0
88.7
0 95.3
2
90.4
5 95.1
1
90.5
0 99.1
3
98.0
6
National Average
Provincial Average
4.04 4.
23
11.4
6
11.8
8
4.40
12.3
8
5.00 5.57

Manufacturing Growth and Excellence
We are moving to both maximize production efficiencies and enhance our profile as a major exporter of Newfoundland products.
NLC’s bottling plant experienced another full year of operation. Production increased to 83,200 cases, up 4% over the previousyear.
We are continuing our efforts to improve operating efficiencies and replace older equipment. NLC plans to modernize labellingequipment, acquire a new carton erector, replace water treatment equipment, and acquire new transport tanks to increase ourcarrying capacity and reduce transportation costs. Acquisition of and connection to facilities on 85 O’Leary Avenue will producefurther efficiencies by reducing our reliance on off-site storage.
This year, we invited visitors to tour the bottling facility. We hope to offer more and expanded tours to increase awareness of ourproduction capabilities and increase market awareness of local products.
Bottling Plant Improvements
9
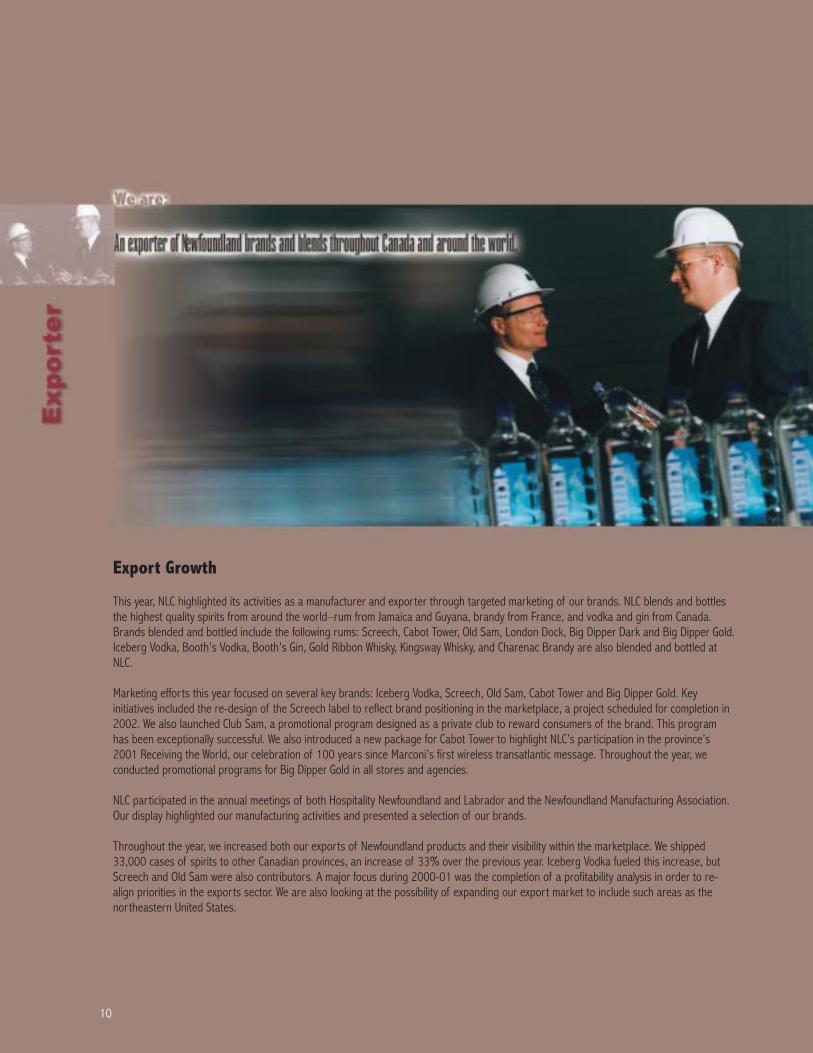
Export Growth
This year, NLC highlighted its activities as a manufacturer and exporter through targeted marketing of our brands. NLC blends and bottlesthe highest quality spirits from around the world–rum from Jamaica and Guyana, brandy from France, and vodka and gin from Canada.Brands blended and bottled include the following rums: Screech, Cabot Tower, Old Sam, London Dock, Big Dipper Dark and Big Dipper Gold.Iceberg Vodka, Booth’s Vodka, Booth’s Gin, Gold Ribbon Whisky, Kingsway Whisky, and Charenac Brandy are also blended and bottled atNLC.
Marketing efforts this year focused on several key brands: Iceberg Vodka, Screech, Old Sam, Cabot Tower and Big Dipper Gold. Keyinitiatives included the re-design of the Screech label to reflect brand positioning in the marketplace, a project scheduled for completion in2002. We also launched Club Sam, a promotional program designed as a private club to reward consumers of the brand. This programhas been exceptionally successful. We also introduced a new package for Cabot Tower to highlight NLC’s participation in the province’s2001 Receiving the World, our celebration of 100 years since Marconi’s first wireless transatlantic message. Throughout the year, weconducted promotional programs for Big Dipper Gold in all stores and agencies.
NLC participated in the annual meetings of both Hospitality Newfoundland and Labrador and the Newfoundland Manufacturing Association.Our display highlighted our manufacturing activities and presented a selection of our brands.
Throughout the year, we increased both our exports of Newfoundland products and their visibility within the marketplace. We shipped33,000 cases of spirits to other Canadian provinces, an increase of 33% over the previous year. Iceberg Vodka fueled this increase, butScreech and Old Sam were also contributors. A major focus during 2000-01 was the completion of a profitability analysis in order to re-align priorities in the exports sector. We are also looking at the possibility of expanding our export market to include such areas as thenortheastern United States.
10

11
Investing in a Quality Workplace
NLC strives to build workplace quality and support the professional and personal development of employees.
At NLC we know that we owe our success to the skill and enthusiasm of our employees. As a specialized industry, we requirespecialized manufacturing employees. We also recognize that skilled retail workers are the cornerstone of customer service andeducation. We are therefore committed to effective communications and pro-active identification of training needs. NLC management ismobilizing to help our employees meet the challenges that come with growth and change.
Expansion and Innovation
In 2000-01, NLC’s corporate local area network was expanded to include all head office employees. These employees were providedwith Internet and e-mail access.
The NLC Systems Department grew to seven positions and is expected to reach 16 employees in the next fiscal year. Expansion andrestructuring of the Systems team will ensure that the necessary resources are available to support the existing IT infrastructure andthe expansion required for POS and future IT initiatives.

Training
Labour Relations
Social Activities
Employment Opportunities
An array of training opportunities was offered to NLC employees during the year. In-house seminars, workshops and meetings were combinedwith post-secondary courses and out-sourced training programs to provide employees with opportunities to improve their personal andprofessional skills. In anticipation of the POS environment, employees were also provided computer skills training.
Other training initiatives included the organization and delivery of pre-retirement planning sessions in St. John’s and Corner Brook. The HumanResources Department took a lead role in planning and organizing sessions for Managers’ and Assistant Managers’ seminars on workplaceethics, creative problem-solving, coaching for performance, and the Employee Assistance Program.
In conjunction with the Memorial University of Newfoundland Centre for Management Development, NLC offered a supervisory managementskills program to Assistant Managers and to other supervisors. For the first time, NLC opened up the program to employees who frequentlyserve in acting managerial roles.
NLC maintained a positive labour relations environment in 2000-01 with few new grievances and none requiring outside assistance forresolution.
In May 2000, a collective agreement amendment resulted in the implementation of pay equity adjustments affecting several classifications andrepresenting the final chapter in a pay equity process begun in 1988.
This year for the first time, NLC employees participated in social activities recognizing Public Service Week. Positive feedback and increasedmorale spurred the Corporation to decide to participate in this event on an annual basis.
Job competition activity reached an all-time high in 2000-01 due to the creation of new positions as well as resignations and retirements. Inaddition, significant recruitment activity of temporary staff was required to cover seasonal peaks as well as on-going call-ins.

Social Responsibility
Social responsibility is a common thread woven through all we do. At NLC, we believe that our role as a socially responsiblecorporation requires much more than compliance and enforcement. We are committed to public education and communityinvolvement.
Programs promoting alcohol awareness were developed and implemented during the year.
The Drinking & Driving Awareness Program was a successful public awareness campaign involving Grade Four students throughoutthe province. Students illustrated NLC brown bags with their impressions of the dangers of drinking and driving. Over 7,000 bagswere collected and distributed by stores. Prizes were awarded in each of the five school zones and to the overall provincial winner.
A Christmas Don’t Drink and Drive campaign highlighted seasonal consumption peaks and promoted safe holidays.
NLC also completed several media campaigns targeted at drinking and driving, safety on water, safe snowmobiling and drinking byminors.
NLC continues to increase its involvement in provincial fundraising efforts. Commitments to fundraising over the next year have beenmade to charitable organizations including: Janeway Children’s Hospital, Child Find Newfoundland and Labrador, and the provincialdivision of the Canadian Diabetes Association.
NLC continues to support the Royal Canadian Legion Poppy Drive, the Salvation Army Kettle Fund and the Red Ribbon Campaign ofMothers Against Drunk Driving (MADD).
Alcohol Awareness
Community Involvement
13

Financial Performance
An organization is truly successful when it strikes a balance between customer needs and operational efficiencies. NLCstrives each year to understand customer needs and translate that understanding into profitability. Our financialstatistics are a reflection of that success.
Auditors’ Report
The Board of Directors,
Newfoundland Liquor Corporation
We have audited the balance sheet of the Newfoundland Liquor Corporation as at
March 31, 2001 and the statements of income, retained earnings and cash flows for the
year then ended. These financial statements are the responsibility of the Corporation's
management. Our responsibility is to express an opinion on these financial statements
based on our audit.
We conducted our audit in accordance with Canadian generally accepted auditing
standards. Those standards require that we plan and perform an audit to obtain
reasonable assurance whether the financial statements are free of material
misstatement. An audit includes examining, on a test basis, evidence supporting the
amounts and disclosures in the financial statements. An audit also includes assessing
the accounting principles used and significant estimates made by management, as well
as evaluating the overall financial statement presentation.
In our opinion, these financial statements present fairly, in all material respects, the
financial position of the Corporation as at March 31, 2001 and the results of its
operations and its cash flows for the year then ended in accordance with Canadian
generally accepted accounting principles.
Deloitte & Touche LLP
Chartered Accountants
St. John's, Newfoundland,
July 25, 2001.

ASSETS
LIABILITIES
EQUITY
CurrentCashAccounts receivableBeer commissions receivableInventories, at cost (Note 2)Prepaid expenses
Capital assets (Note 3)Leased assets (Note 4)Intangible assets (Note 5)
CurrentAccounts payable and accrued liabilitiesAccrued vacation payCurrent portion of long term debt (Note 6)
Accrued severance payLong term debt (Note 6)
Retained earnings
2001
406,285
162,402
$ 51,159,666
100,000
200,000
35,294,745
$ 51,159,666
$ 13,931,1835,650,1813,737,850
22,377,427
46,102,926
4,585,996308,342
$ 13,162,287519,319
13,781,6061,883,315
15,864,921
2000
362,894
182,601
$ 43,948,573
100,000
300,000
29,153,372
$ 43,948,573
$ 12,841,4012,331,9384,208,597
20,811,566
40,556,396
3,103,985105,591
$ 12,268,988408,487
12,777,4751,717,726
14,795,201
Newfoundland Liquor CorporationBalance Sheet as at March 31, 2001
Balance, beginning of the yearNet income for the year
Payments to the Province of Newfoundland
Balance, end of the year
2001
96,141,373
90,000,000
$ 35,294,745
$ 29,153,372
125,294,745
2000
92,830,162
96,000,000
$ 29,153,372
$ 32,323,210
125,153,372
Statement of Retained EarningsFor the Year Ended March 31, 2001
15

SalesCost of goods sold
Inventory, beginning of the yearPurchases
Cost of goods available for sale
Less: Inventory, end of the year
Gross profitCommission revenue on sale of beer
Other incomeCommission on licensee purchasesInterestMiscellaneous
Income from operationsAdministrative and operating expenses (Schedule 1)Net income for the year
2001
$ 109,859,854
46,021,945
22,377,42744,456,084
65,403,77044,655,436
660,554
4,330,336
18,248,169$ 96,141,373
20,811,566
66,833,511
2,699,173970,609
114,389,542
2000
$ 104,391,202
43,142,341
20,811,56642,207,362
62,183,84043,959,460
378,960
4,011,675
17,324,813$ 92,830,162
19,876,587
63,018,928
2,585,8181,046,897
110,154,975
Statement of IncomeFor the Year Ended March 31, 2001
Statement of Cash FlowsFor the Year Ended March 31, 2001
Operating activitiesNet income for the yearItems not requiring (generating) cash
AmortizationGain on disposal of capital assets
Net change in non-cash working capitalAccrual for severance pay
Investing activitiesProceeds on disposal of capital assetsPurchase of capital assets
Financing activitiesPayments to the Province of NewfoundlandDecrease in long term debt
Increase (decrease) in cash for the yearCash, beginning of the yearCash, end of the year
2001
(242,027)
165,58993,117,677
(2,183,284)(1,927,895)
(100,000)(90,100,000)
12,841,401$ 13,931,183
$ 96,141,373
505,359
96,404,705
(3,452,617)
255,389
(90,000,000)
1,089,782
2000
(181)
27,91293,030,275
(505,095)(493,925)
(100,000)(96,100,000)
16,405,051$ 12,841,401
$ 92,830,162
564,876
93,394,857
(392,494)
11,170
(96,000,000)
(3,563,650)
17
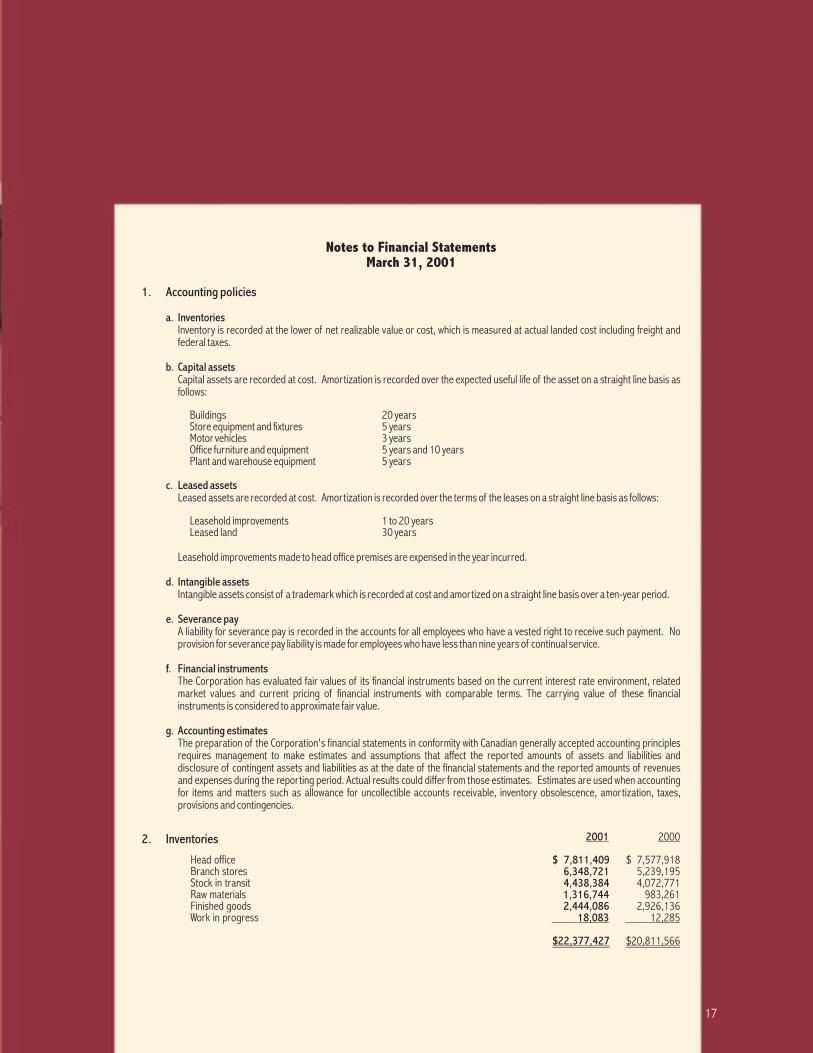
2. Inventories
Head officeBranch storesStock in transitRaw materialsFinished goodsWork in progress
2001
18,083
$22,377,427
$ 7,577,9185,239,1954,072,771
983,2612,926,136
2000
12,285
$20,811,566
$ 7,811,4096,348,7214,438,3841,316,7442,444,086
Notes to Financial StatementsMarch 31, 2001
1. Accounting policies
Inventory is recorded at the lower of net realizable value or cost, which is measured at actual landed cost including freight andfederal taxes.
Capital assets are recorded at cost. Amortization is recorded over the expected useful life of the asset on a straight line basis asfollows:
Buildings 20 yearsStore equipment and fixtures 5 yearsMotor vehicles 3 yearsOffice furniture and equipment 5 years and 10 yearsPlant and warehouse equipment 5 years
Leased assets are recorded at cost. Amortization is recorded over the terms of the leases on a straight line basis as follows:
Leasehold improvements 1 to 20 yearsLeased land 30 years
Leasehold improvements made to head office premises are expensed in the year incurred.
Intangible assets consist of a trademark which is recorded at cost and amortized on a straight line basis over a ten-year period.
A liability for severance pay is recorded in the accounts for all employees who have a vested right to receive such payment. Noprovision for severance pay liability is made for employees who have less than nine years of continual service.
The Corporation has evaluated fair values of its financial instruments based on the current interest rate environment, relatedmarket values and current pricing of financial instruments with comparable terms. The carrying value of these financialinstruments is considered to approximate fair value.
The preparation of the Corporation's financial statements in conformity with Canadian generally accepted accounting principlesrequires management to make estimates and assumptions that affect the reported amounts of assets and liabilities anddisclosure of contingent assets and liabilities as at the date of the financial statements and the reported amounts of revenuesand expenses during the reporting period. Actual results could differ from those estimates. Estimates are used when accountingfor items and matters such as allowance for uncollectible accounts receivable, inventory obsolescence, amortization, taxes,provisions and contingencies.
a. Inventories
b. Capital assets
c. Leased assets
d. Intangible assets
e. Severance pay
f. Financial instruments
g. Accounting estimates
18
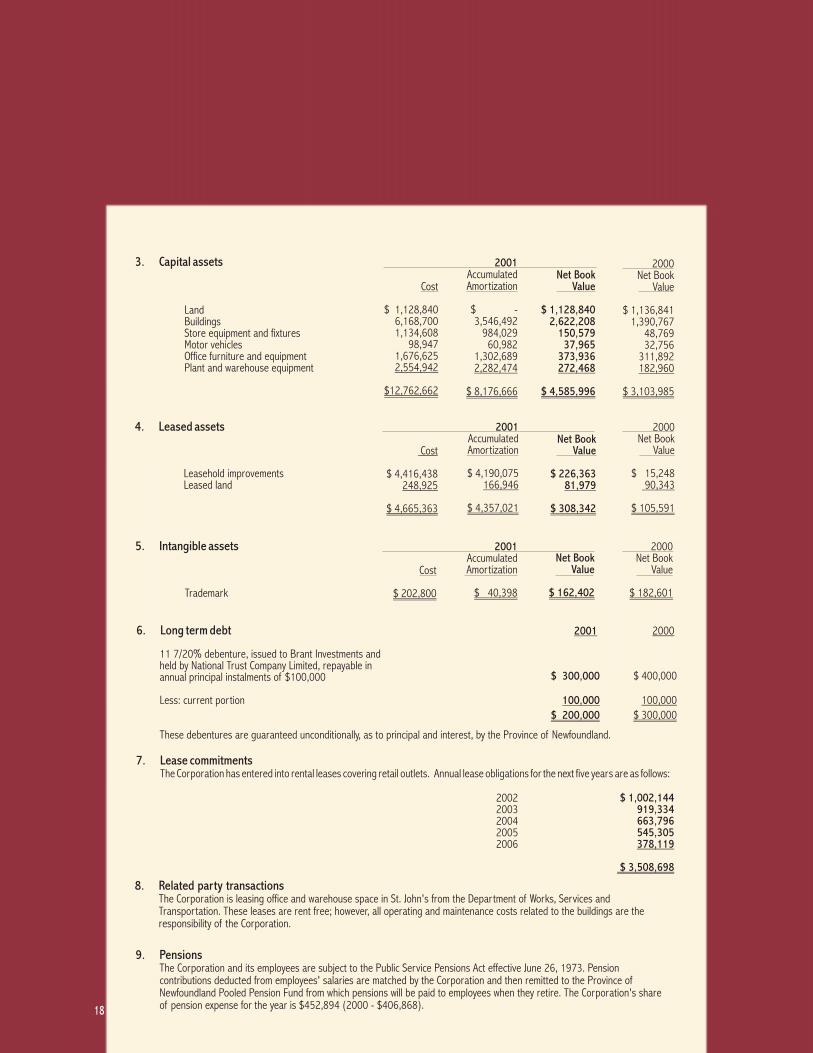
4. Leased assets
5. Intangible assets
6. Long term debt
Leasehold improvementsLeased land
$ 4,416,438
Cost
248,925
$ 4,665,363
2001AccumulatedAmortization
$ 4,190,075166,946
$ 4,357,021
Net BookValue
$ 226,36381,979
$ 308,342
2000Net Book
Value
$ 15,24890,343
$ 105,591
Trademark
Cost
$ 202,800
2001AccumulatedAmortization
$ 40,398
Net BookValue
$ 162,402
2000Net Book
Value
$ 182,601
These debentures are guaranteed unconditionally, as to principal and interest, by the Province of Newfoundland.
11 7/20% debenture, issued to Brant Investments andheld by National Trust Company Limited, repayable inannual principal instalments of $100,000
Less: current portion
2001
$ 300,000
100,000
$ 200,000
2000
$ 400,000
100,000
$ 300,000
7. Lease commitmentsThe Corporation has entered into rental leases covering retail outlets. Annual lease obligations for the next five years are as follows:
20022003200420052006
$ 1,002,144919,334663,796545,305378,119
$ 3,508,698
8. Related party transactionsThe Corporation is leasing office and warehouse space in St. John's from the Department of Works, Services andTransportation. These leases are rent free; however, all operating and maintenance costs related to the buildings are theresponsibility of the Corporation.
9. PensionsThe Corporation and its employees are subject to the Public Service Pensions Act effective June 26, 1973. Pensioncontributions deducted from employees' salaries are matched by the Corporation and then remitted to the Province ofNewfoundland Pooled Pension Fund from which pensions will be paid to employees when they retire. The Corporation's shareof pension expense for the year is $452,894 (2000 - $406,868).
3. Capital assets
LandBuildingsStore equipment and fixturesMotor vehiclesOffice furniture and equipmentPlant and warehouse equipment
Cost
$ 1,128,8406,168,7001,134,608
98,9471,676,6252,554,942
$12,762,662
2001AccumulatedAmortization
$ -3,546,492
984,02960,982
1,302,6892,282,474
$ 8,176,666
Net BookValue
$ 1,128,8402,622,208
150,57937,965
373,936272,468
$ 4,585,996
2000Net Book
Value
$ 1,136,8411,390,767
48,76932,756
311,892182,960
$ 3,103,985

6
Schedule of Administrative and Operating ExpensesFor the Year Ended March 31, 2001
Salaries and employee benefitsAgency store commission and expensesRentInterest and bank chargesMarketingAmortization on capital assetsFreight to storesRepairs and maintenanceHeat and lightStationery and office suppliesStaff trainingCleaningMiscellaneousStore supplies and wrappingCommunicationsMunicipal taxInventory breakage and shortageTravelProfessional feesSecurityInventory storage chargesConsulting feesPostageInsuranceInterest on long term debtDirectors' fees and expensesAmortization on leased assetsAdvertisingDues and subscriptionsUniformsStaff recruitmentMotor vehicle expensesBad debt expense (recovery)New product developmentGain on disposal of capital assets
Total
2001
(242,027)
$ 18,248,169
$ 9,747,1023,626,345
943,790482,691472,209385,370296,887253,722247,294205,134169,157153,422134,456132,833132,289124,834123,000119,298112,78099,76797,47572,07445,59244,98744,67643,54540,61336,13730,48330,15620,50714,6856,886
-
2000
(181)
$17,324,813
$ 9,090,4733,208,462
859,169412,831600,999378,387267,602214,508234,751175,847110,484147,082
61,624111,199141,768111,580145,772136,057
72,30592,86357,292
283,53754,25348,38657,23338,49369,33639,82127,13448,74912,61216,524(4,207)
2,068
19

20
Regular SpiritsWinesLocal BeerImported Beer
Per Unit Profits
$15.
89
$5.3
3
$1.3
4
$1.7
2
$15.
89
$5.1
5
$1.3
6
$1.6
8
$16.
07
$5.3
0
$1.4
0
$1.7
2
$16.
24
$5.2
4
$1.4
3
$1.7
3
1998 1999 2000 2001
RumRye WhiskeyScotch - other WhiskeyGinVodkaBrandyCognacLiqueursMiscellaneousTotal Spirits
1,420,370765,275
98,61053,735
274,36026,960
2,615201,040
13,2002,856,165
1,428,080748,637
96,94953,721
281,48225,957
2,463212,767
13,3232,863,379
1,513,210760,591
95,64654,486
306,28126,685
2,601235,100
14,8783,009,478
1,583,118773,727
93,72855,170
324,78926,629
2,553256,272
12,5863,128,572
SpiritsWineBeerSpecialtyTotal
2,856,1651,665,860
847,11597,435
5,466,575
2,863,3791,711,402
876,466108,337
5,559,584
3,009,4781,976,062
992,965104,791
6,083,296
3,128,5722,201,416
993,97096,139
6,420,097
Fortified WinesCrackling, Sparkling, ChampagneTable WineFlavoured Wines and CiderTotal Wine
100,025225,875946,840393,120
1,665,860
91,404218,124936,927464,947
1,711,402
90,325255,022
1,057,605573,110
1,976,062
90,351234,071
1,152,710724,284
2,201,416
Corporate Statistics
SalesGross Profit on SalesCommission Revenue on Sale of BeerCommission on Licensee PurchasesOther IncomeIncome from Operations
96,021,66057,396,38740,592,6052, 383,986
775,936101,148,914
97,280,28157,843,09141,739,902
2,453,8421,304,089
103,340,924
104,391,20262,183,84043,959,460
2,585,8181,425,857
110,154,975
109,859,85465,403,77044,655,436
2,699,1731,631,163
114,389,542
Local Beer (bottles)Local Beer (cans)Imported BeerTotal Beer
374,54579,649
392,930847,115
347,54079,699
449,227876,466
356,60984,007
552,279992,965
353,68980,810
559,471993,970
Brewer’s AgentClubLoungeHotel / MotelRestaurantTour BoatTourist HomeTransportation ServicesCateringOtherSpecial Events Issues
Number of Liquor Licenses1,607
371668102319
1123
9124
14589
1,493379667103299
93111
14121
605
20012000
1998 1999 2000 2001
Sales and Income, 1998-2001
Product Sales Volumes (litres)
1998 1999 2000 2001
Wine Sales (litres)
1998 1999 2000 2001
Spirit Sales by Product Type (litres)
1998 1999 2000 2001
1998 1999 2000 2001
Beer Sales (litres)

NLC Corporate Stores Revenue
Location Dollar Volume
Eastern Region:
Central Region:
(Year-Ending Mar. 31/01)
Elizabeth Avenue East, St. John’s $9,675,416Murray Premises, St. John’s 4,311,983Kenmount Road, St. John’s 2,862,638Harbour Grace 4,102,375Churchill Square, St. John’s 2,656,543Licensee Branch, St. John’s 2,676,535Mount Pearl 5,855,780Placentia 2,267,503Topsail Road, St. John’s 6,818,613Bay Roberts 3,611,154Agency Store Branch 13,481,205Avalon Mall, St. John’s 2,012,973Village Mall, St. John’s * 478,252Wine Show, St. John’s * 189,928Sundry Sales 2,022,474
Gander $5,431,267Grand Falls 4,566,885Clarenville 9,391,918
Marystown 3,691,976
Corner Brook Plaza $2,470,277Port Aux Basques 1,858,086Stephenville 2,908,825Labrador City 2,304,739Deer Lake 7,526,724Corner Brook Millbrook 4,219,376Happy Valley 2,466,409
*(Not in operation for the full fiscal year)Total: $
Western Region:
109,859,854
21

P.O. Box 8750
Station “A”
90 Kenmount Road
St. John’s, NF
A1B 3V1
Tel: 709.724.1100
Fax: 709.754.0321
Newfoundland Liquor Corporation
Des
igne
dan
dPr
oduc
edby
Perr
y&
But
land
Com
mun
icat
ions


![Liquor (Artisan Liquor) Amendment Bill 2020€¦ · (a) the total volume of craft beer that may be [s 10] Liquor (Artisan Liquor) Amendment Bill 2020 v21 Page 11 Authorised by the](https://static.documents.pub/doc/80x56/602eeddf375040488f6ed805/liquor-artisan-liquor-amendment-bill-2020-a-the-total-volume-of-craft-beer-that.jpg)


