Why are Older People More Likely toVote? The Impact of Ageing on ElectoralTurnout in Europe
Achim Goerres
This article analyses the reasons for higher voting participation among older people in Europe. Overtheir lifetimes, citizens tend to habituate voting and comply with a growing subjective norm ofvoting. Furthermore, the average voting participation of older people is influenced by their longerduration of residence, the lack of a mobilising partner, worse physical health and less education,although life experience replaces the function of formal education over a lifetime. Most of thesefactors are founded on the very nature of human behaviour and the social context of our life course.Thus, they arguably stand outside of the political process and will remain stable into the future.
Higher turnout among older age groups, after basic controls for education andgender, has been a consistent finding in many years of research. Older people aremore likely to vote—no matter when or where the surveys have been carried out.We are so used to this fact that we forget how unusual the stability of the findingis. Across countries, differences exist in electoral systems, party systems, socioeco-nomic development and democratic experience. Variations of these country char-acteristics may have differential impacts on voting participation of various agegroups. Over time, there has been a general decline in turnout and a growingdisenchantment with electoral politics. In addition to this long-term trend, distinctgenerations of voters such as the New Deal generation in the USA (Miller andShanks 1996) or ‘Thatcher’s Children’ in Britain (Russell et al. 1992) have experi-enced electoral politics in different ways, compared to earlier and later cohorts.
Why is it that older people consistently show a higher propensity to vote despite allthese generational changes? This article suggests that older people, compared toyounger fellow citizens, have habituated voting over their lifetime and feel astronger subjective norm to vote. Habituating patterns of social behaviour andcomplying with social norms are universal human propensities that exist every-where. There are some further important differences between older and youngervoters. Older citizens are on average more likely to vote because they have beenliving in an area for longer. They are less likely to vote because: (a) they tend to lacka mobilising partner; (b) suffer from worse health; and (c) are less educated as amember of an older cohort, although life experience replaces the function of formaleducation over a lifetime.
This article analyses international cross-sectional data (the European Social Surveyfrom 2002/3). Countries in the survey vary so much in their political history thatolder people have experienced a multitude of idiosyncratic national histories. Thisresearch design allows the study of common factors such as habituation thataccompany the ageing process and are the same in all countries. After a literature
review, section 1 presents the theoretical conceptualisation of age effects intocohort, life cycle and individual ageing. Section 2 discusses the methods of anage-centred analysis of international cross-sectional data. Section 3 introducesage-related independent variables that we are going to use as proxies for life-cycleand cohort effects. Section 4 shows several series of random-intercept logisticregressions and interprets their results. Section 5 reviews the empirical results inthe light of alternative explanations, outlines their wider political implications andshows avenues for further research.
1. Theory: Age and Political BehaviourImagine meeting two randomly selected citizens in a European country, one ofwhom is, for example, 70 and the other 40 years old. Can you make any statementabout their probabilities of voting participation? Most studies of political behaviourincorporate age as a control variable. The impact of age as a variable is (if at all)discussed only with regards to magnitude vis-à-vis other variables (see, for example,Dalton 2002, ch. 2). This is not very satisfactory because chronological age serves asa surrogate for many other social characteristics that are of importance such aseducation, health or social connectedness.
Recent discussions of the relationship between age and political participation haveconcentrated on the contrast between cohort and life-cycle effects in individualcountries such as Germany, Canada, Britain or the United States (Miller and Shanks1996; Becker 2002; Blais et al. 2004; Clarke et al. 2004). These authors detectdistinct generational variations within one country. A decline in turnout atCanadian national elections, for example, can be explained by a long-term declinein political attentiveness and civic duty to vote (Blais et al. 2004). The disadvantageof the one-nation approach is the lack of generalisation across more than onenation. This approach can help us to explain differences in turnout between agegroups in a given country, but it cannot account for the prevalence of higherturnout among older people in general.
Mark Franklin (2004) explains turnout in established democracies from an inter-nationally comparative point of view. He argues that the fluctuation of aggregateturnout is due to changes in the cohort composition of the electorate. Depending onthe socialisation experience at a young age, young voters belong to a group thatacquires the habit of voting to a greater or lesser extent than the previous cohort.Besides the emphasis on early socialisation experience, Franklin stresses the habitu-ation process connected to voting to explain higher turnout associated with higherage. However, he does not test this proposition sufficiently. My research takes thislast aspect of his argument further.
Voting is the most fundamental form of political participation and can be concep-tualised as a decision based on incentives and resources. If citizens do not havecertain resources such as physical health, they will not vote. Also, they do not go tothe polls if they lack some motivation, such as the belief that it expresses theirallegiance to the political system. Resources to go and vote are minimal comparedto other forms of political participation (Verba et al. 1995, 53–54); neverthelesssome amount of physical ability is needed even for postal voting and some infor-
mation either from experience or the news in order to decide for whom to vote. Inaddition, one needs to feel the motivation to pay the small costs in terms of time.
My theoretical perspective includes instrumental as well as expressive motivations.I assume that people vote because they see it as their duty or from loyalty to thesystem, as well as because they believe that their vote could actually influencepolicies (see, for a recent review, Dowding 2005). On the one hand, Franklin andhis colleagues have shown that institutional restrictions decrease the likelihood ofan individual going to the polls so voters must see some kind of instrumental valuein the act of voting (Franklin 1996; Franklin et al. 1996). On the other hand, AndréBlais (2000) demonstrates that rational choice in the narrow sense, in whichonly personal interests in the political and economic arenas matter, does not holdup.
To what extent can the decision to go and vote based on expressive or instrumentalmotivation differ between age groups? We can retrace differences between agegroups to three types of effects: cohort, life cycle and individual ageing. A ‘cohorteffect’ describes the shared experience by a group that was born during a certainperiod. There are two sub-types of cohort effects. One is the lasting influence ofshared socialisation as a ‘political generation’. It matters, for example, in whatperiod a cohort came of political age. We are much more open to political influencesbetween 15 and 30 (the ‘impressionable years’) than between 50 and 65 (seeHyman 1959; Dawson and Prewitt 1968; Sears and Levy 2003). In Britain, voterswho came of political age during the Thatcher or Blair eras seem to bother lessabout politics, which makes them as a cohort less likely to vote (Clarke et al. 2004).Current British youth do not value formal politics, of which voting forms part, veryhighly (Henn et al. 2002). In terms of an evaluation of resources and incentives, theincentive side of the equation is affected. The cohort as a whole will carry theperception of a lower benefit value of voting (because of disenchantment withformal politics) through their lifetimes. Although political attitudes like these arenot monolithic, they are very stable over a lifespan and will thus make that cohortas a whole less likely to vote in the years to come (Alwin et al. 1991). There are fewhistorical events or processes that can potentially shape generational experiences ata young age across national borders in the realm of voting and create similar lastinginfluences at later age. Examples might be the experience of the world wars or thefall of communism. However, the experience of the young generation is funda-mentally shaped by national circumstances, even if the events were international.This is due to the outspoken national character of parliamentary elections. Theissue, candidates and electoral institutional structures that we experience at ayoung age are the outcome of the national political process.
The second sub-type of cohort effect is the average probability of sharing certainsocial characteristics as a cohort. Today’s elderly have, for example, a lower averagelevel of education as a cohort because mass educational expansion began in mostcountries in the 1970s. This cohort effect affects our variety and amount ofresources to vote. Formal education helps us to understand politics and see thenecessity of voting. Other examples are also general changes like de-unionisation ordecline in party membership in some countries that make younger cohorts lesslikely to be mobilised into voting by political organisations. This type of cohort effect
can qualitatively occur in several countries, but is likely to vary to the extent thattwo cohorts differ in the distribution of a social characteristic.
‘Life-cycle effects’ associated with a certain age stem from the insight that our sociallife course can be separated into different life stages. Each of these stages—youth,adolescence, middle and old age—puts us into social contexts with rather differentdemands on us as individuals. Globally, there are cultural differences in the sociallife course for the individual, but, in Europe, the social perception of one’s lifecourse is very similar.1 Young adults are struggling to succeed in their professionallives, are occupied with starting a family and securing their family’s income. Elderlypeople suffer from deteriorating health, have settled down in a certain area and donot need to support children any more. Changing social circumstances can bereflected in changing political behaviour. The progress through the life cycle doesnot have a simple increasing or decreasing effect on turnout. Young adulthoodmight lead a person to take less interest in politics in order to concentrate onbeginning a family. Once parents have responsibility for children, they might caremore about politics because political output affects not only them, but also theiroffspring. Voting participation can decrease again with old age because of frailty.Life-cycle effects can affect both sides of the resource-incentive assessment.Resources that enable one to take part in politics, such as available free time, forinstance, vary widely over the life cycle. Incentives to vote can also change over thelife cycle. Young people who are likely to move soon have a much lower incentiveto vote for a local candidate than settled voters.
Life-cycle and cohort effects can also appear in conjunction. Take income, forexample. Income is on average lower for all the elderly at all times compared toyounger age groups. This is due to the fact that pensions are always below averageearnings—a clear life-cycle aspect. But, at the same time, the income of the elderlygoes up relative to earlier elderly cohorts because recent retirees have accumulatedmore wealth and higher pension entitlements during their lives. This allows themto benefit from higher income at old age—a cohort aspect.
The third and, as we shall see, strongest effect can be summarised by ‘individualageing’. As we age, there are two universal human features that increase thelikelihood of voting. First, past voting experiences influence the future probabilityof voting. It is widely acknowledged that the repetition of the same behaviour leadsto an increasing probability of performing that behaviour again (see, for a review,Ajzen 2002). If we learn that something brings some kind of gratification to us thatoutweighs our costs, we will do it again. If something does not give us enoughgratification, we will not do it again. Social psychologists disagree to what extentrepetitive behaviour is automatic or still influenced by rational consideration. Therelatively low frequency of voting (with a maximum of maybe 100 elections perlifetime) compared to other forms of human behaviour suggests that pure environ-mental cues (such as an election poster) are not enough to generate an automaticresponse (see Aarts et al. 1998). Instead, we are always required to use somecognitive process to decide whether or not to vote. Nevertheless, voting becomeseasier as we get older. Over a lifetime, our repertoire of situations that we know(and also believe we know) grows steadily. The older we are, the more likely we areto ‘know the show’. We are constantly confronted with a political environment that
is too complex for us to deal with (see Lau 2003). Drawing on our own votingexperience is one type of cognitive short cut. The easier we find the voting decision,the less costs are involved in going to the polls.2
But why do we decide to vote again? The infinitesimally small contribution of ourvote does not get larger by having voted once. We could instead come to theconclusion that voting does not matter and learn from our voting experience not tovote again. Here, the second feature of the individual ageing effect comes in: theolder we are, the more likely we are to adhere to the social norm of voting.3 Votingis a socially desirable behaviour in liberal democracies. Even in recently establisheddemocracies, most citizens go to the polls in national elections. In addition, mostpeople (even if they have not voted) maintain that we ought to vote (see Blais2000). Thus, the norm of voting (a) can be observed by seeing people going to thebooth or reading about turnout figures in the media; and (b) is a moral rule thatbrings social gratification for the voter.4
The transmission process between a social norm and our individual behaviour iscomplex. A social norm affects us differently depending on our social context. Atthe level of the individual, we are motivated to behave in a certain way by our ownsubjective norm. The subjective norm is our perception of the social norm in ourpersonal environment. This subjective norm is the sum of social pressure andgratification that we expect to receive from people who we know (Fishbein andAjzen 1975; Ajzen and Fishbein 1980; Ajzen 1991). Since voting is a widespreadsocial norm in a liberal democracy, many people are likely to subscribe to the viewthat we ought to vote. As we age, the more we become part of a society throughwidening social networks, interactions and social role taking, the higher thenumber of people is in our environment whom we believe to hold that view. As weget older, we can count more people who we think might want us to vote. This is,of course, a probabilistic statement. It is possible to live in a social context wherefew people vote, so that one cannot see anyone go to the booth or feel socialgratification by voting and then talking about it (although one would still beexposed to the voting norm in the media). However, as we age, we are unlikely tofeel increasing social pressure not to vote. Non-voters do not care about voting. Theydo not usually maintain that we ought not to vote. In other words, getting older insuch a social context implies getting to know a growing number of people who donot care about voting and some people who do maintain that voting is desirable.Thus, over a lifetime, the subjective norm to vote increases even in these extremecircumstances because the non-voters in this environment will not affect oursubjective norm, whereas the few voters will.5
In sum, the older we are, the stronger is our subjective norm to vote and the lesscostly the voting decision because of our own past voting experience. This indi-vidual ageing effect should exist regardless of any country context. It is founded onuniversal human features such as the tendency to comply with social norms and touse past experience as a cognitive short cut.
2. MethodsThe discussion so far has stressed that differences between age groups are deter-mined by effects that differ in their level of universality: country-specific effects
(political generation, average probability of sharing certain social characteristics),life-cycle effects that are the same in Europe and the universal individual ageingeffect. As I have shown in the literature review, conventional techniques commonlyused to study age effects, such as the analysis of pooled cross-sectional data, do notallow generalisations beyond the country studied. Furthermore, researchersemploying them face the ‘identification problem’ (see Glenn 1976) (for example, acohort effect can be an ageing effect interacting with a period effect).
To test the proposed age effects and their different levels of universality, I suggeststudying an international, cross-sectional survey, i.e. samples were only taken atone point in time but in several countries. The European Social Survey covers 21European countries that are similar in their cultural perception of the social lifecourse and dissimilar in their political history. The experience of a 70-year-old inPoland is very different from a 70-year-old in Britain with regard to political history,such as the fall of communism, but similar as to social roles associated with the lifecycle such as retirement, grandparenthood or deteriorating health. If we take aprimary interest in age effects that are more universal and depend less on nationalcircumstances, we can use the diversity of countries to isolate these more generaleffects.6 In a cross-sectional data set, we are faced with confounded age-cohort-period effects. However, with a comprehensive international survey such as theEuropean Social Survey that includes many questions about the social backgroundof respondents, we can test hypothesised life-cycle and cohort effects by looking atconceptual variables. We can, for example, model life-cycle variation in incentivesby looking at how long someone has been living in a certain area because we knowthat the older you are, the longer you have lived in a certain place and the higheryour incentive to vote will be. Thus, we can control for age effects at the individuallevel.
Life-cycle and individual ageing effects are hypothesised to be more universal thanpolitical generation effects. Political generation effects are likely to be countryspecific and cannot be totally captured by survey items. We will first pool all datafrom 21 countries (as diverse as Poland, Greece, Sweden or Austria) and control atthe individual level for all life-cycle effects, cohort effects that give cohorts differentprobabilities of attaining a certain social characteristic and part of the politicalgeneration effect (such as the expressed sense of duty to vote). Now we are left witha residual chronological age variable that still represents individual ageing andpolitical generation effects. However, we can hypothesise that the political genera-tion effects cancel each other out in the pooled analysis. This is due to the diversityof countries. The ageing effect is tinged by differences in cohort socialisation incountry A, but these cohort differences will not occur in country B where others arepresent that do not occur in country A.
In the pooled analysis, the residual age variable should show a monotonousincreasing concave relationship because habituation and norm-conforming pro-cesses are likely to show declining rates of growth. Our early experiences of votingwill have a stronger impact of future voting opportunities than later ones. Also, oursubjective norm is likely to grow most in early adulthood, when we experiencemost changes in our social environment. In separate single-country analyses, therelationship between residual age and voting participation is tinged by cohort
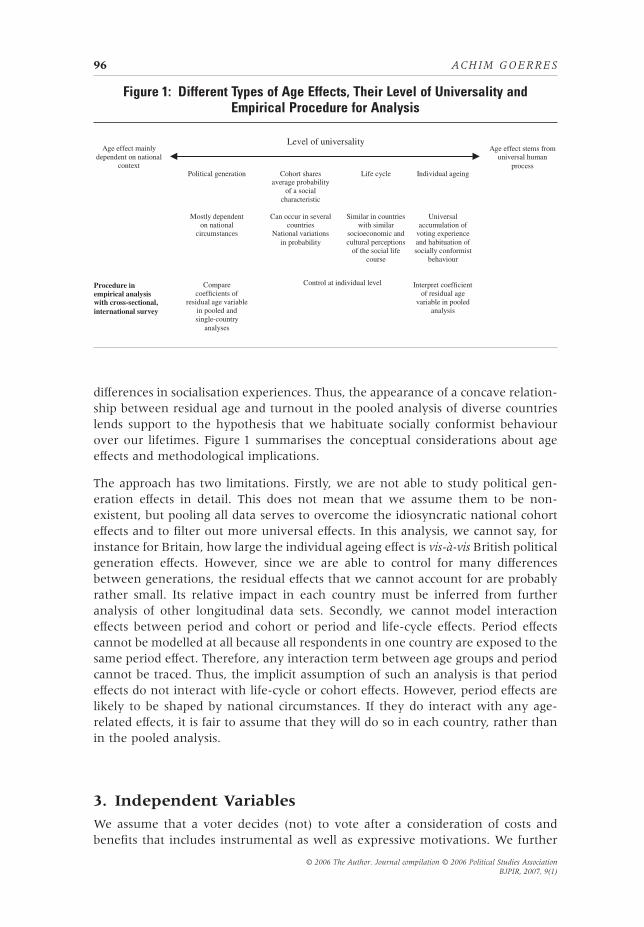
differences in socialisation experiences. Thus, the appearance of a concave relation-ship between residual age and turnout in the pooled analysis of diverse countrieslends support to the hypothesis that we habituate socially conformist behaviourover our lifetimes. Figure 1 summarises the conceptual considerations about ageeffects and methodological implications.
The approach has two limitations. Firstly, we are not able to study political gen-eration effects in detail. This does not mean that we assume them to be non-existent, but pooling all data serves to overcome the idiosyncratic national cohorteffects and to filter out more universal effects. In this analysis, we cannot say, forinstance for Britain, how large the individual ageing effect is vis-à-vis British politicalgeneration effects. However, since we are able to control for many differencesbetween generations, the residual effects that we cannot account for are probablyrather small. Its relative impact in each country must be inferred from furtheranalysis of other longitudinal data sets. Secondly, we cannot model interactioneffects between period and cohort or period and life-cycle effects. Period effectscannot be modelled at all because all respondents in one country are exposed to thesame period effect. Therefore, any interaction term between age groups and periodcannot be traced. Thus, the implicit assumption of such an analysis is that periodeffects do not interact with life-cycle or cohort effects. However, period effects arelikely to be shaped by national circumstances. If they do interact with any age-related effects, it is fair to assume that they will do so in each country, rather thanin the pooled analysis.
3. Independent VariablesWe assume that a voter decides (not) to vote after a consideration of costs andbenefits that includes instrumental as well as expressive motivations. We further
Figure 1: Different Types of Age Effects, Their Level of Universality andEmpirical Procedure for Analysis
Level of universality Age effect mainly
dependent on national context
Procedure in empirical analysis with cross-sectional, international survey
Age effect stems from universal human
process Political generation
Mostly dependent on national
circumstances
Compare coefficients of
residual age variable in pooled and single-country
analyses
Cohort shares average probability
of a social characteristic
Can occur in several countries
National variations in probability
Life cycle
Similar in countries with similar
socioeconomic and cultural perceptions
of the social life course
Individual ageing
Universal accumulation of
voting experience and habituation of socially conformist
conceptualise age effects on voting participation as political generation, a sharedcohort probability of attaining a certain social characteristic, life cycle and individualageing. In line with the methodological approach, we need to control for life-cycleand cohort effects that are not political-generation effects level with a series ofconceptual variables. In order to decide which variables we should include, wemust ask: (a) where cohorts differ in their cost–benefit calculation of voting; and (b)how transitions over the life cycle affect the calculation. Although technicallyunnecessary, we furthermore typify the variables according to the cohort/life-cycledifferentiation for ease of interpretation.7
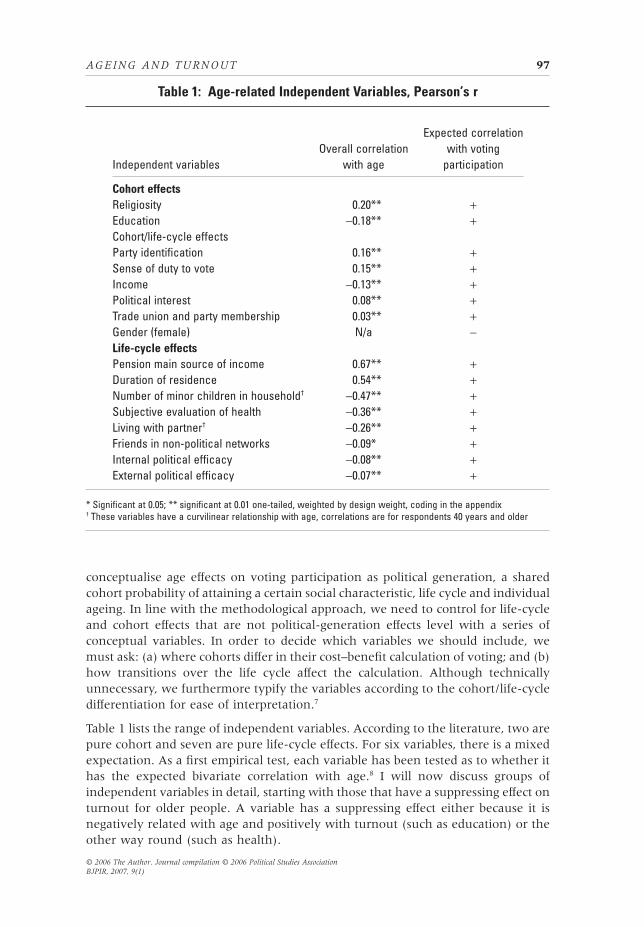
Table 1 lists the range of independent variables. According to the literature, two arepure cohort and seven are pure life-cycle effects. For six variables, there is a mixedexpectation. As a first empirical test, each variable has been tested as to whether ithas the expected bivariate correlation with age.8 I will now discuss groups ofindependent variables in detail, starting with those that have a suppressing effect onturnout for older people. A variable has a suppressing effect either because it isnegatively related with age and positively with turnout (such as education) or theother way round (such as health).
Table 1: Age-related Independent Variables, Pearson’s r
Independent variablesOverall correlation
with age
Expected correlationwith voting
participation
Cohort effectsReligiosity 0.20** +Education -0.18** +Cohort/life-cycle effectsParty identification 0.16** +Sense of duty to vote 0.15** +Income -0.13** +Political interest 0.08** +Trade union and party membership 0.03** +Gender (female) N/a -Life-cycle effectsPension main source of income 0.67** +Duration of residence 0.54** +Number of minor children in household† -0.47** +Subjective evaluation of health -0.36** +Living with partner† -0.26** +Friends in non-political networks -0.09* +Internal political efficacy -0.08** +External political efficacy -0.07** +
* Significant at 0.05; ** significant at 0.01 one-tailed, weighted by design weight, coding in the appendix† These variables have a curvilinear relationship with age, correlations are for respondents 40 years and older
Education, income: the so-called ‘standard model’ of political participation postulatesthat higher socioeconomic status has a positive impact on participation. Highereducation enables citizens to have a better understanding of politics (for anoverview, see Leighly 1995). At the same time, they are more likely—because ofoccupation and income—to be in a social context where norms of participationprevail. Higher-income citizens also have a higher material stake in the system. Thespread of mass education, however, is a relatively recent phenomenon, so there isa clear generational decline in aggregate levels of education. Income declines withage, mirroring cohort and life-cycle differences. Older generations do earn less, butall the elderly have less income as they retire.
Gender: entrenched understandings of traditional gender roles could interact withage since newer cohorts are less likely to hold them. Also, it is necessary to includegender because older age groups are comprised of more women on the grounds oftheir longer life expectancy.
Living with a partner, number of minor children in household, subjective evaluation ofhealth: these are clear life-cycle effects. To live together with a partner increases thechance of voting because the partner is another potential mobilising source. On thegrounds of widowhood and divorce, this is negatively correlated with age for peoplewho are 40 and older. Children enhance one’s personal interest in public provision.A certain amount of physical fitness is needed to undertake even the minimalrequirements of voting. Frailty increases with age (Gehring and Wagner 1999,696–697).9
Friends in non-political networks: probably the most influential work of social geron-tology puts forward the ‘disengagement thesis’ (Cumming and Henry 1961). Theelderly are thought to show a decline in interpersonal activity as they disengagethemselves from their social environment. This disengagement includes the politi-cal sphere, so that levels of participation should drop. The retreat should bereflected in a decline in the number of social networks that are reported to includeclose friends. The social retreat would then not only affect the political spheredirectly, but also decrease the possibility of being mobilised in a non-politicalcontext, such as by friends. Social networks are considered to be important inmaking people participate in politics in general (Knoke 1990). The disengagementthesis has been tested numerous times with mixed results, so its exclusion isnot warranted (Gergen and Back 1966; Glenn and Grimes 1968; Glenn 1969;Rollenhagen 1982).
Internal and external political efficacy: one strand of the social gerontological literaturedeals with problems of ageism in western societies (see, for example, Wilson 2000,161–162). Negative stereotypes of inactivity in the elderly reflect back on seniorcitizens and determine their self-image in a way that may make them feel lesspolitically efficacious. As a result, internal and external political efficacies decrease,so that the political participation of older people is hampered.
Trade union and party membership: membership in a political organisation is a strongmobilising factor in voting because members are exposed to the activists’ efforts to
make them cast their vote favourably to the organisation. Some countries haveexperienced a decline in party and trade union membership, which would bereflected in ageing membership profiles (Widfeldt 1995). Retirement leads to exitfrom trade unions in some countries.
3.2. Boosting Turnout
Sense of duty to vote: in the survey, respondents have been asked to give an answerto the following question on an 11-point scale: ‘To be a good citizen, how importantwould you say it is for a person to vote in elections?’ This variable is helpful to catchsome of the variation in individually felt subjective norms. According to ourtheoretical expectations of norm habituation over a lifetime, we can expect thisitem to show the features of a life-cycle effect. Unfortunately, we must expectover-reporting of such a socially desirable trait, so the proxy loses its power. Inaddition, the decline of the sense of duty to vote as a cohort effect has beenestablished in several country studies (Blais et al. 2004; Clarke et al. 2004).
Religiosity: secularisation makes newer cohorts less religious. Religiosity seems toincrease our felt obligation to comply with social norms.
Duration of residence: this is considered to be one aspect of social connectedness. Thelonger you have been living in a certain area, the more likely you are to be sociallysettled so that you can pay attention to the increasingly familiar problems of thatarea that might need political solutions (Miller and Shanks 1996, 100–106).10
Party identification: research into the decline of institutional forms of political par-ticipation holds that younger generations identify less with parties than with otherpolitical groupings with a smaller scope of activity. On the other hand, the older aperson is, the higher the potential attachment to their party as they have more timeto grow attached, which could explain the higher level of party identificationfor older people (Converse 1976; Butler and Stokes 1983, 59–61; Fuchs andKlingemann 1995; Tilley 2003).
Pension as a main source of income: to be dependent on pensions could be a mobilisingfactor because politics can be important in determining the source of income (seeCampbell 2003).
Political interest: the disengagement thesis would hypothesise a decrease in politicalinterest. But, a competing hypothesis of ‘selective withdrawal’ would demand thatpolitics might be one of the few areas where the elderly decide to remain active.This view predicts a general social retreat among the elderly accompanied by theconcentration on fewer subjects, including politics (Glenn and Grimes 1968). Politi-cal interest is thereby a strong predictor of political participation because itdecreases information costs. Citizens who are politically interested do not viewobtaining information about politics as a costly necessity, but draw some enjoymentfrom it. Younger cohorts, for example in Britain, show less interest in formal politics(Henn et al. 2002).
The following empirical investigation will show that not all of these variables areequally important when considered in a multivariate analysis. I will show that the
pure life-cycle effects of having lived in an area for longer, lacking a cohabiting,mobilising partner and deteriorating health are those factors that have the strongestimpact on an older person’s likelihood to vote.
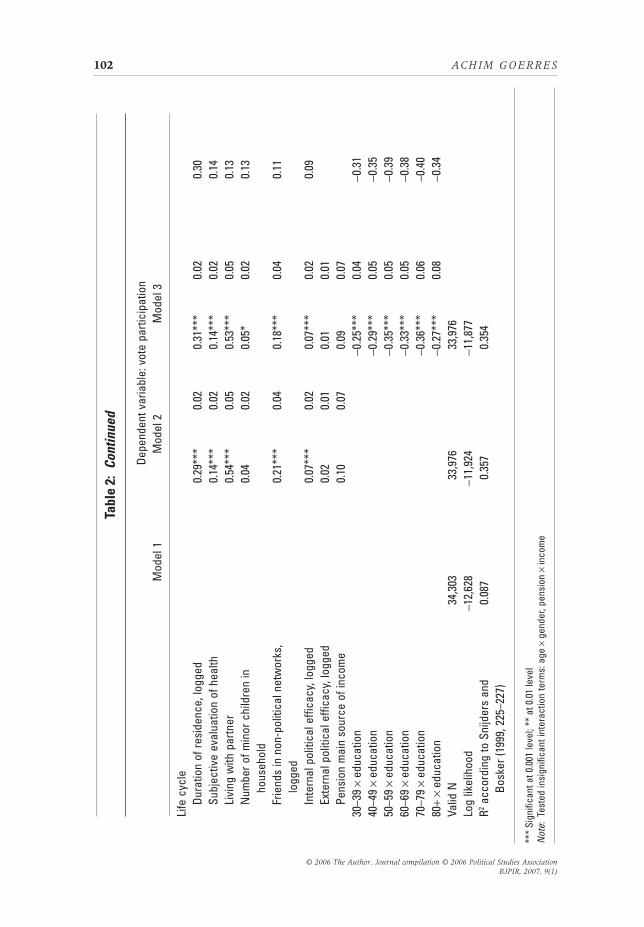
4. ResultsThe empirical analysis can be divided into three different steps. Firstly, I want toestablish the relative impact of the enumerated independent variables in multi-variate models (Table 2, models 1–3). Secondly, I will demonstrate the universalpresence of individual ageing by comparing the results of the pooled analysis withresults from separate country regressions (Figure 2). Thirdly, I will run several testswith sub-samples (Table 3) showing that: (a) the impact of the individual-levelvariables does not vary a great deal depending on the macro country context(models 4a–c); (b) differences between age groups are greater in low-turnoutcountries; and (c) the causal mechanism behind the effect of individual ageing onvoting participation is the habituation of socially conformist behaviour (models5a–b).
I am using random-intercept logistic regression models for the analysis of severalcountries at the same time. We know from the analysis of electoral institutions thatthey affect the average probability of the eligible voter to go to the polls. Bymodelling a random intercept as part of these models, I allow this average prob-ability to vary between countries. The dependent variable is a dichotomy ofwhether the respondent voted in the last national parliamentary election or not.
Table 2 shows a series of three regressions. Model 1 only has age dummies asexplanatory variables as a reference model. Model 2 includes the full list of in-dependent variables. There are some age-related effects that lose significance in themultivariate model: religiosity, income, social networks, external political efficacyand pension as the main source of income. Model 3 introduces an interaction termbetween education and age. The final column in Table 2 shows the difference infitted probabilities between the minimum of the independent variable and themaximum when other effects are being held constant in model 3. However, thesecalculations do not tell us enough about the differences between age groupsbecause the model looks at all variance within as well as between age groups.
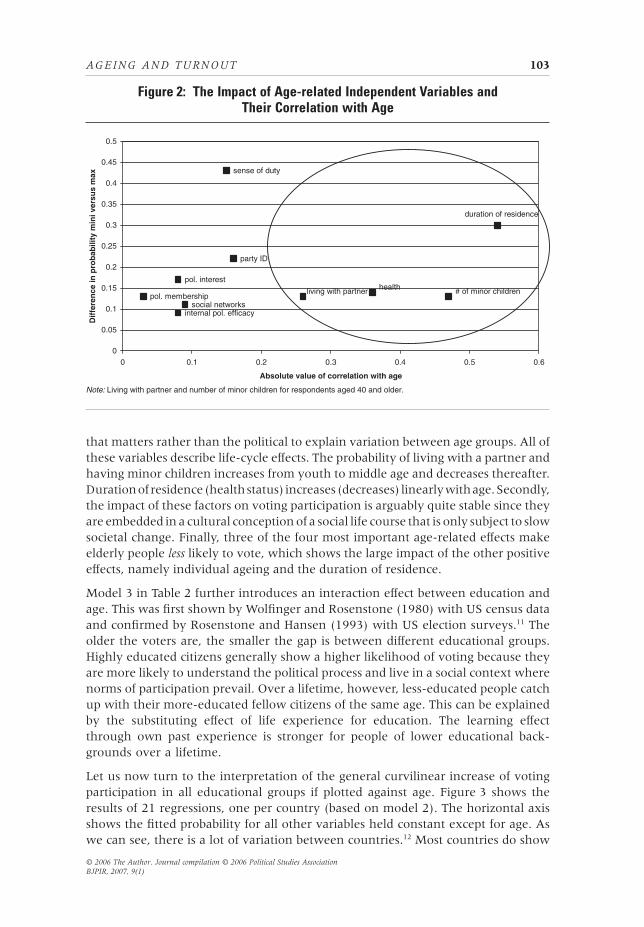
Figure 2 illustrates which variables are most important to explain the differencesbetween age groups. The horizontal axis shows the absolute value of the bivariatecorrelation of the independent variables with age. The vertical axis shows theimpact as calculated by the difference in fitted probabilities. From this age-centredperspective, the variables that stand out as having a relatively high impact, as wellas a stronger correlation with age, are the following: duration of residence, ifsomeone is living with a partner, number of minor children in household andsubjective evaluation of health. However, none of these is as strong as the residualage variable, which would be higher on the vertical and more to the right on thehorizontal axis than any of the control variables.
There are some remarkable aspects about these four factors. For one, all of them arepurely sociological and stand outside of the political process. It is the social context
that matters rather than the political to explain variation between age groups. All ofthese variables describe life-cycle effects. The probability of living with a partner andhaving minor children increases from youth to middle age and decreases thereafter.Durationofresidence(healthstatus) increases(decreases) linearlywithage.Secondly,the impact of these factors on voting participation is arguably quite stable since theyare embedded in a cultural conception of a social life course that is only subject to slowsocietal change. Finally, three of the four most important age-related effects makeelderly people less likely to vote, which shows the large impact of the other positiveeffects, namely individual ageing and the duration of residence.
Model 3 in Table 2 further introduces an interaction effect between education andage. This was first shown by Wolfinger and Rosenstone (1980) with US census dataand confirmed by Rosenstone and Hansen (1993) with US election surveys.11 Theolder the voters are, the smaller the gap is between different educational groups.Highly educated citizens generally show a higher likelihood of voting because theyare more likely to understand the political process and live in a social context wherenorms of participation prevail. Over a lifetime, however, less-educated people catchup with their more-educated fellow citizens of the same age. This can be explainedby the substituting effect of life experience for education. The learning effectthrough own past experience is stronger for people of lower educational back-grounds over a lifetime.
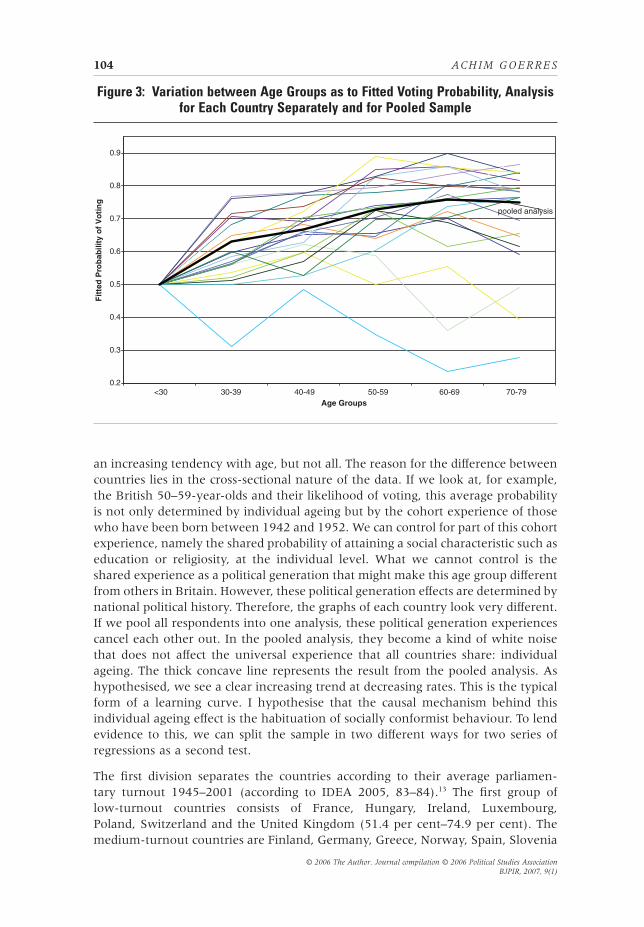
Let us now turn to the interpretation of the general curvilinear increase of votingparticipation in all educational groups if plotted against age. Figure 3 shows theresults of 21 regressions, one per country (based on model 2). The horizontal axisshows the fitted probability for all other variables held constant except for age. Aswe can see, there is a lot of variation between countries.12 Most countries do show
Figure 2: The Impact of Age-related Independent Variables andTheir Correlation with Age
sense of duty
party ID
pol. interest
pol. membership
duration of residence
health nerdlihc ronim fo #rentrap htiw gnivil
social networksinternal pol. efficacy
0
0.05
0.1
0.15
0.2
0.25
0.3
0.35
0.4
0.45
0.5
0 0.1 0.2 0.3 0.4 0.5 0.6
Absolute value of correlation with age
Dif
fere
nce
in p
rob
abili
ty m
ini v
ersu
s m
ax
Note: Living with partner and number of minor children for respondents aged 40 and older.
an increasing tendency with age, but not all. The reason for the difference betweencountries lies in the cross-sectional nature of the data. If we look at, for example,the British 50–59-year-olds and their likelihood of voting, this average probabilityis not only determined by individual ageing but by the cohort experience of thosewho have been born between 1942 and 1952. We can control for part of this cohortexperience, namely the shared probability of attaining a social characteristic such aseducation or religiosity, at the individual level. What we cannot control is theshared experience as a political generation that might make this age group differentfrom others in Britain. However, these political generation effects are determined bynational political history. Therefore, the graphs of each country look very different.If we pool all respondents into one analysis, these political generation experiencescancel each other out. In the pooled analysis, they become a kind of white noisethat does not affect the universal experience that all countries share: individualageing. The thick concave line represents the result from the pooled analysis. Ashypothesised, we see a clear increasing trend at decreasing rates. This is the typicalform of a learning curve. I hypothesise that the causal mechanism behind thisindividual ageing effect is the habituation of socially conformist behaviour. To lendevidence to this, we can split the sample in two different ways for two series ofregressions as a second test.
The first division separates the countries according to their average parliamen-tary turnout 1945–2001 (according to IDEA 2005, 83–84).13 The first group oflow-turnout countries consists of France, Hungary, Ireland, Luxembourg,Poland, Switzerland and the United Kingdom (51.4 per cent–74.9 per cent). Themedium-turnout countries are Finland, Germany, Greece, Norway, Spain, Slovenia
Figure 3: Variation between Age Groups as to Fitted Voting Probability, Analysisfor Each Country Separately and for Pooled Sample
(76.4 per cent–80.8 per cent). The final group of high-turnout countries consists ofAustria, Czech Republic, Denmark, Italy, Netherlands, Portugal and Sweden (83.8per cent–92.0 per cent). Belgium has been excluded from the last group because ofits system of compulsory voting with strong enforcement that leads to high turnout.The size of each sub-sample is between 10,700 and 11,000. Higher average turnoutis relevant in two ways. First of all, the norm of voting is more established in thatcountry since more people practise it. Secondly, comparative research suggests thatturnout is higher when elections are held in a way in which the voter perceives astronger instrumental incentive to vote (Franklin et al. 1996).
Table 3 shows the regressions (models 4a–c). Some of the small-impact coefficientschange significance somewhat. That should not concern us too much because theirminor impact makes them more interesting as control rather than substantivevariables. It is important to note that no coefficient changes its sign.14 Three out ofthe four social characteristics that are so important in explaining variation betweenage groups (duration of residence, health, living with partner) show stable coeffi-cients. Number of children becomes insignificant in all three models. That shows usthat this is not a good proxy, because we cannot be sure about the direction of itsimpact. All other coefficients with strong impacts remain quite similar. Party iden-tification changes its coefficient depending on the country group. It becomes twiceas high in the high-turnout states in comparison to those with low turnout. This isnot due to sampling error, which is relatively small for this independent variable. Itcould be that party identification is a stronger mobilising factor in countries inwhich perceived costs of voting are lower (higher-turnout countries).
If we now turn to the coefficients of the age dummies, we can see that the overallcurvilinear relationship is the same. The interaction terms with education remainquite similar. However, compared to younger age groups, older age groups are themore likely to go to the polls, the lower the average turnout in that country. If youcompare the coefficients line by line, you can see that they decrease from left toright in all instances except for the medium group in the 80-plus category. Thus, anolder citizen differs from a younger one, all other things being equal, more in acountry like Britain or Poland (low turnout) than in Denmark or Austria (highturnout). This can be explained by the fact that in a country with low turnout, thereis less social pressure to conform for all age groups. Thus, a young person in thosecountries feels less incentive to conform to the voting norm. Over a lifetime,however, a person learns to conform more and more as they become part of a socialcontext which values that norm. Starting from a lower level at a younger age, thereis more room for the habituating process towards the top. Highly educated peoplestart from a higher level and the habituation process is less pronounced. In coun-tries with low average turnout, new voters start with a lower incentive to conformto the norm and there is more room for habituation.
Another test for the nature of the habituation process is to split the sample into twogroups according to their reported sense of duty to vote. The group with a low senseof duty is those respondents with a score 0–4, the group with a high sense of dutyis those with a score 5–10.15 The sample with the lower sense of duty consists ofabout 3,600 respondents; the other of about 30,400. Naturally, standard errors areabout half the size in the larger sample compared to the smaller. In general, for
those with a low sense of duty the coefficients of the explanatory variables are equalor a bit higher than in the group with the higher sense. This can be explained by thefact that mobilising or de-mobilising factors have a stronger impact on those whofeel a lower civic duty to vote.
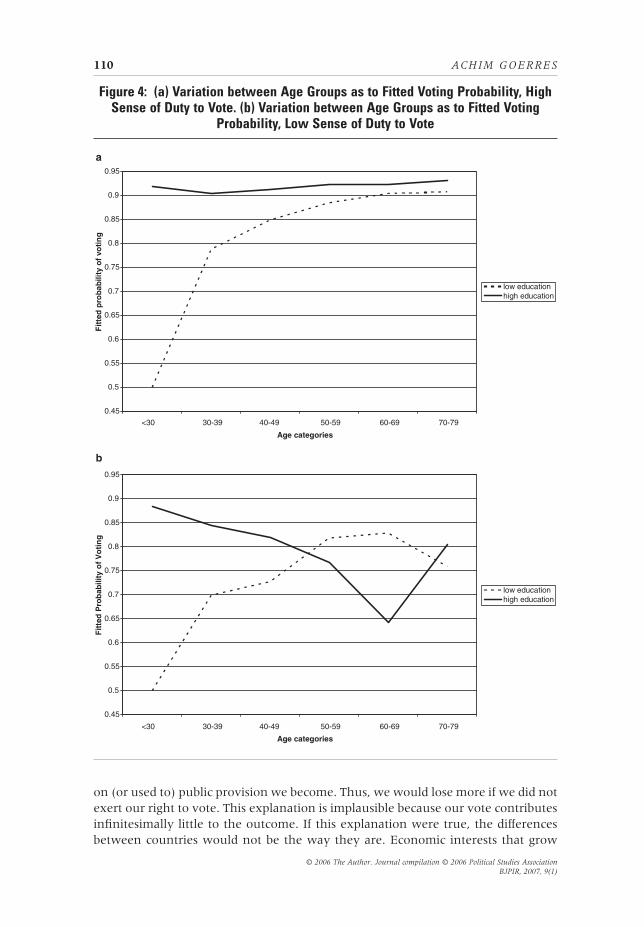
Figure 4 shows the relationship between age, education and the fitted probability ofvoting, all other things being equal for the two sub-groups. Not surprisingly, thosewho feel a high sense of duty have a higher probability of voting in general,compared to their counterparts of the same age and educational background. If wenow look at Figure 4a for those with a high sense of duty, there is no variationbetween age groups and the probability is close to 100 per cent. This is the graphicembodiment of the ceiling of habituation. Those who feel a high sense of duty at ayoung age have a high incentive to vote when they are also more highly educated,which gives voters an understanding of the political process. Thus, life experiencecannot lead to more habituation in this group of voters because they are likely tovote in every election. For those with low educational backgrounds and a highsense of duty, life experience substitutes for understanding the political process byeducation. Figure 4b, in contrast, paints a different picture for those with a lowsense of duty. Here, high educational background does not equate with highparticipation. The relationship across age groups is positive and does not looksimilar to the individual ageing effect. This stems from the fact that those peoplewho are highly educated and thus prone to have a greater understanding of thepolitical process do not habituate voting across their lifetime because they do notperceive it as a civic duty. Thus, it would be inconsistent for them to conform to akind of behaviour that they do not deem desirable. For those with low educationalbackgrounds, there is still some residual effect of life experience teaching them thenorm. It might be that the less educated are more open to social pressure becausethey are not cognitively mobilised to resist the habituation of a norm they do notagree with. All in all, this habituation pattern is much less pronounced, however, incomparison to the other patterns we have seen.
5. ConclusionsThis article has shown that non-political factors are most important in explainingthe higher turnout of older voters, factors that lie in the social context of our lifecycle and the human nature of habituation and seeking to conform. The mostsignificant factor comes from individual ageing through which voters habituate thesocially conformist behaviour of voting. Life experience can further teach theimportance of voting in such a way that it acts as a substitute for education.Individual ageing does not vary between countries with different turnout levels.Additional factors of importance for senior citizens are longer residence in oneplace, the growing likelihood of lacking a mobilising partner and deterioratinghealth.
Are there any alternative explanations for the increasing voting probability ofageing voters? Possibly, the older we are, the more we have at stake in a politicalsystem. In that case, it would not be social norms that drive us, but personalmaterial interest. The older we are, the more we possess and the more dependent
on (or used to) public provision we become. Thus, we would lose more if we did notexert our right to vote. This explanation is implausible because our vote contributesinfinitesimally little to the outcome. If this explanation were true, the differencesbetween countries would not be the way they are. Economic interests that grow
Figure 4: (a) Variation between Age Groups as to Fitted Voting Probability, HighSense of Duty to Vote. (b) Variation between Age Groups as to Fitted Voting
alongside ageing should not depend on the average turnout of the country. Thus,the systematic pattern that age differences are largest in low-turnout countrieswould remain unexplained. Also, direct measures of material interest such asincome and pension income would not be insignificant.
Another hypothesis could attribute the rise in turnout with age to an all-encompassing generational difference in acknowledging voting as an importantfunction of democracy. This notion is equally shared by older people and equallyless shared by younger persons (because they might see other forms of participationas more effective). This explanation is highly unlikely. Why should the elderly inIreland share the same sense of usefulness in voting as older Poles? Both groupshave lived through very different experiences of democracy. Therefore, finding anall-overriding generational effect in so many countries is improbable.
The causal explanation of habituation derives further evidence from a recentexperimental study (Gerber et al. 2003). Voters are influenced by their own pastpolitical behaviour. If a person is mobilised to go and vote in one election, he or shewill have a higher likelihood of going to the polls in the next election. This increasedprobability of voting manifests itself despite a lack of mobilisation at the secondvote. If we accept my explanation, we can also draw some conclusions for the widerpolitical process. The higher turnout among older voters lies in non-political causes.They cannot easily be influenced by policy-makers because they have their roots inthe social framework of our life cycles and in our human nature. Thus, if Europeandemocracies maintain the overall attitude that voting is fundamental to democracy,older people will continue to go to the polls more regularly than younger people. Indemocracies that show growing numbers of older people, we can thus expect anexpanding over-representation of older voters in national elections.
In the last British general election, Age Concern England was campaigning onbehalf of older voters (see their web site www.20millionvotes.org.uk). They invitedMPs from all parties to public discussions of old-age issues and invited older peopleto write to their candidates. Age Concern did not recommend voting for any party,but their campaign was threatening because it demonstrated the massive electoralpower of the grey vote. Whether the vote of older people makes a difference isanother issue because they do not tend to vote for one party only. But, thecombination of demographic weight and high voting probability that goes beyondclass and education makes Age Concern’s threat credible.
Further research should be carried out with qualitative methods to obtain a secondlayer of analysis in addition to the multi-N, quantitative approach used here. Newresearch should concentrate on two things. (1) In-depth interviews with young,middle-aged and older people should focus on single steps in the causal chain thatmakes voters comply with the social norm of voting. (2) Comparisons should bemade across countries to make qualitative judgements about similarities and dif-ferences among older voters in new versus established democracies, especiallylooking into the relationship between political experience in a communist regimeand its impact on subsequent political behaviour in a liberal democracy.
About the Author
Achim Goerres, Government Department, London School of Economics and Political Science,WC2A 2AE, UK, email: [email protected]
NotesThe original data set is the European Social Survey Round 1, version 5. It can be freely downloaded athttp://www.europeansocialsurvey.org. My own coded dataset and command files can be downloadedfrom my personal homepage at http://www.achimgoerres.de. I would like to thank Michael Bruter, RuneDahl Fitjar, Pierre Hausemer, Simon Hix, Simona Milio, Gwen Sasse, David Soskice and Joachim H.Wehner and two anonymous referees for their comments on earlier drafts of this article. Earlier versionsof this article were presented at the annual conference of the Political Studies Association in Leeds in April2005 and the bi-annual conference of the European Consortium for Political Research in Budapest inSeptember 2005. I would like to thank the Economic and Social Research Council, the Ralph Milibandprogramme and the Government Department at the LSE for their financial support.
1. Similarities include a strong emphasis on chronological age as a social marker, a linear (rather thancyclical) perception of the life course from birth to death and an individualistic outlook that permitsvery different social roles along the life course (Albert and Cattell 1994, 64–65; Wilson 2000, 27).
2. As a consequence, this dimension of individual ageing must be less developed in relatively newdemocracies such as the post-communist countries, where the learning process for older voters hasbeen embedded in a relatively unstable political environment over the last 20 years. Although votingwas common in communist countries, the lack of choice bears no resemblance to voting in thepost-communist era. However, the data and research design does not allow us to test this proposition.
3. The increasing tendency of older people to conform to norms in voting behaviour has been observedin Blais (2000, 112), where the author states that older people are more inclined to think ‘in termsof morality and principle’.
4. Cialdini and Trost (1991) make a distinction between a descriptive norm versus an injunctive norm.
5. This dimension of individual ageing should be visible in all consolidated democracies. An older personin a post-communist country is as likely to be exposed to a greater subjective norm to vote (relativeto a younger fellow citizen) as someone in an established democracy. Turnout in consolidated newdemocracies is not lower than in older democracies. Rose and Munro (2003, ch. 4) show that votingparticipation is comparable to the west in post-communist countries, despite distrust of politicalinstitutions and parties.
6. Nie et al. were the first to suggest such an approach to study age and political participation (Nie et al.1974, 322): ‘The nature and timing of major political events vary from country to country. If we finduniformity in the relationship between political activities and age across these nations [Austria, Britain,India, Nigeria, United States], it is unlikely that such uniformity was produced by uniform generationalexperiences. It is far more likely that such uniformity reflects the uniform impact of aging’.
7. Technically, we do not need to make the life cycle and cohort categorisation because these indepen-dent variables mainly serve as control variables to isolate the individual ageing effect. However, theseeffects are well researched, and the conceptual categorisation is a helpful tool to discuss the politicalimplications such as the fact that life-cycle effects are more stable than cohort effects.
8. Each one of them correlates with age at least 0.10 in two or more countries. The table of correlationsis obtainable from the author.
9. One might question the validity of subjective self-evaluation of one’s own health, but this evaluationis, first of all, highly correlated with objective health measures and secondly this self-image is apowerful force by itself (see Bazargan et al. 1991, 183–184).
10. There is also evidence at the ecological level that districts with high levels of residential mobility havelower turnout (Gimpel et al. 2004).
11. Nagler (1991) has correctly raised the problems of artificial interaction effects in logistic regressionthat are due to the S-shaped probability curve. As a simple remedy to test whether the observedinteraction effect between age and education is an artefact or real, I ran the same regression for allseven educational groups separately. The changes in the coefficient of the age dummies correspond towhat we would expect from the interaction effect. Therefore, this interaction term is not an artefactof the regression technique.
12. Sample size for each country is still above 1,000.
13. Vote to voting age population ratio.
14. Sampling error alone can explain much variation just between different samples of the same popu-lation and does not need to hint at systematic differences between the country groups.
15. In general, we can expect bias in terms of respondents over-reporting their sense of duty because itis a socially desirable trait. It is reasonable to assume, however, that this bias does not differ betweenage groups (Verba et al. 1995, appendix B).
BibliographyAarts, H., Verplanken, B. and Van Knippenberg, A. (1998) ‘Predicting behavior from actions in the
past: Repeated decision making or a matter of habit?’, Journal of Applied Social Psychology, 28:15,1355–1374.
Ajzen, I. (1991) ‘The theory of planned behavior’, Organizational Behavior and Human Decision Processes, 50,179–211.
Ajzen, I. (2002) ‘Residual effects of past on later behavior: Habituation and reasoned action perspectives’,Personality and Social Psychology Review, 6:2, 107–122.
Ajzen, I. and Fishbein, M. (1980) Understanding Attitudes and Predicting Social Behavior (New Jersey:Prentice-Hall).
Albert, S. M. and Cattell, M. G. (1994) Old Age in Global Perspective. Cross-cultural and Cross-national Views(New York: G. K. Hall & Co.).
Alwin, D. F., Cohen, R. L. and Newcomb, T. M. (1991) Political Attitudes over the Life Span: The BenningtonWomen after Fifty Years (Madison, WI: University of Wisconsin Press).
Bazargan, M., Kang, T. S. and Bazargan, S. (1991) ‘A multivariate comparison of elderly African Ameri-cans and Caucasians voting behavior: How do social, health, psychological and political variables effecttheir voting?’, International Journal of Aging and Human Development, 32, 181–198.
Becker, R. (2002) ‘Wahlbeteiligung im Lebensverlauf. A-P-K-Analysen für die Bundesrepublik Deut-schland in der Zeit von 1953 bis 1987’, Kölner Zeitschrift für Soziologie und Sozialpsychologie, 54:2,246–263.
Blais, A. (2000) To Vote or Not to Vote. The Merits and Limits of Rational Choice Theory (Pittsburgh: Universityof Pittsburgh Press).
Blais, A., Gidengil, E., Nevitte, N. and Nadeau, R. (2004) ‘Where does turnout decline come from?’,European Journal of Political Research, 43, 221–236.
Butler, D. and Stokes, D. (1983) Political Change in Britain. The Evolution of Electoral Choice (London/Basingstoke: Macmillan).
Campbell, A. L. (2003) How Policies Make Citizens (Princeton/Oxford: Princeton University Press).
Cialdini, R. B. and Trost, M. R. (1991) ‘Social influence: Social norms, conformity, and compliance’, in D.T. Gilbert, S. T. Fiske and G. Lindzey (eds), The Handbook of Social Psychology (Boston: McGraw-Hill),151–191.
Clarke, H. D., Sanders, D., Stewart, M. C. and Whiteley, P. F. (2004) Political Choice in Britain (Oxford:Oxford University Press).
Converse, P. E. (1976) The Dynamics of Party Support: Cohort-analyzing Party Identification (Beverly Hills:Sage).
Cumming, E. and Henry, W. E. (1961) Growing Old: The Process of Disengagement (New York: Basic Books).
Dalton, R. J. (2002) Citizen Politics: Public Opinion and Political Parties in Advanced Western Democracies (NewYork/London: Chatham House).
Dawson, R. E. and Prewitt, K. (1968) Political Socialization: An Analytic Study (Boston: Little Brown).
Dowding, K. (2005) ‘Is it rational to vote? Five types of answer and a suggestion’, British Journal of Politics& International Relations, 7:3, 442–459.
Fishbein, M. and Ajzen, I. (1975) Belief, Attitude, Intention and Behavior: An Introduction to Theory and Research(Reading, MA: Addison-Wesley).
Franklin, M. N. (1996) ‘Electoral participation’, in L. LeDuc, R. G. Niemi and P. Norris (eds), ComparingDemocracies. Elections and Voting in Global Perspective (Thousand Oaks/London/New Delhi: Sage), 216–235.
Franklin, M. N. (2004) Voter Turnout and the Dynamics of Electoral Competition in Established Democracies(Cambridge: Cambridge University Press).
Franklin, M. N., van der Eijk, C. and Oppenhuis, E. (1996) ‘The institutional context: Turnout’, in C. vander Eijk and M. N. Franklin (eds), Choosing Europe? The European Electorate and National Politics in the Faceof Union (Ann Arbor, MI: The University of Michigan Press), 306–331.
Fuchs, D. and Klingemann, H.-D. (eds) (1995) Citizens and the State (Oxford: Oxford University Press).
Gehring, U. W. and Wagner, M. (1999) ‘Wahlbeteiligung im hohen und sehr hohen Alter’, kölner Zeitschriftfür Soziologie und Sozialpsychologie, 51:4, 681–705.
Gerber, A. S., Green, D. P. and Shachar, R. (2003) ‘Voting may be habit-forming: Evidence from arandomized field experiment’, American Journal of Political Science, 47:3, 540–550.
Gergen, K. J. and Back, K. W. (1966) ‘Communication in the interview and the disengaged respondent’,Public Opinion Quarterly, 30, 385–398.
Gimpel, J. G., Morris, I. L. and Armstrong, D. R. (2004) ‘Turnout and local age distribution: Examiningpolitical participation across space and time’, Political Geography, 23, 71–95.
Glenn, N. D. (1969) ‘Aging, disengagement, and opinionation’, Public Opinion Quarterly, 33:1, 17–33.
Glenn, N. D. (1976) ‘Cohort analysts’ futile quest: Statistical attempts to separate age, period and cohorteffects: Response’, American Sociological Review, 41:5, 900–905.
Glenn, N. D. and Grimes, M. (1968) ‘Aging, voting, and political interest’, American Sociological Review, 35,563–575.
Henn, M., Weinstein, M. and Wring, D. (2002) ‘A generation apart? Youth and political participation inbritain’, British Journal of Politics & International Relations, 4:2, 167–192.
Hyman, H. H. (1959) Political Socialization. A Study in the Psychology of Political Behaviour (Glencoe: The FreePress).
IDEA (2005) Voter Turnout since 1945. A Global Report 2002. Available online at: http://www.idea.int/publications/vt/upload/VT_screenopt_2002.pdf (accessed 10 July 2005).
Knoke, D. (1990) ‘Networks of political action: Toward theory construction’, Social Forces, 68, 1041–1063.
Lau, R. R. (2003) ‘Models of decision-making’, in D. O. Sears, L. Huddy and R. Jervis (eds), OxfordHandbook of Political Psychology (Oxford: Oxford University Press), 19–59.
Leighly, J. E. (1995) ‘Attitudes, opportunities and incentives: A field essay on political participation’,Political Research Quarterly, 48:1, 181–209.
Miller, W. E. and Shanks, J. M. (1996) The New American Voter (Cambridge, MA/London: HarvardUniversity Press).
Nagler, J. (1991) ‘The effect of registration laws and education on US voter turnout’, American PoliticalScience Review, 85:4, 1393–1405.
Nie, N. H., Verba, S. and Kim, J.-O. (1974) ‘Political participation and the life cycle’, Comparative Politics,6:3, 319–340.
Rollenhagen, R. E. (1982) Testing Disengagement Theory as an Explanation of Political Inactivity (Department ofPolitical Science, Michigan State University, Ph.D. thesis).
Rose, R and Munro, N. (2003) Elections and Parties in New European Democracies (Washington DC: CQ Press).
Rosenstone, S. J. and Hansen, J. M. (1993) Mobilization, Participation, and Democracy in America (New York:Macmillan).
Russell, A. T., Johnston, R. J. and Pattie, C. J. (1992) ‘Thatcher’s children: Exploring the links between ageand political attitudes’, Political Studies, 40, 742–756.
Sears, D. O. and Levy, S. (2003) ‘Childhood and adult political development’, in D. O. Sears, L. Huddy andR. Jervis (eds), Oxford Handbook of Political Psychology (Oxford: Oxford University Press), 60–109.
Snijders, T. A. B. and Bosker, R. J. (1999) Multilevel Analysis. An Introduction to Basic and Advanced MultilevelModeling (London: Sage).
Tilley, J. R. (2003) ‘Party identification in Britain: Does length of time in the electorate affect strength ofpartisanship?’, British Journal of Political Science, 33, 332–344.
Verba, S., Schlozman, K. L. and Brady, H. E. (1995) Voice and Equality: Civic Voluntarism in American Politics(Cambridge: Harvard University Press).
Widfeldt, A. (1995) ‘Party membership and party representativeness’, in D. Fuchs and H.-D. Klingemann(eds), Citizens and the State (Oxford: Oxford University Press), 134–182.
Wilson, G. (2000) Understanding Old Age. Critical and Global Perspectives (London/Thousand Oaks/NewDelhi: Sage).
Wolfinger, R. E. and Rosenstone, S. J. (1980) Who Votes? (New Haven: Yale University Press).