Why are there few gas bubbles in deep peat in British raised and blanket peat bogs?
R.S. Clymo
School of Biological and Chemical Sciences, Queen Mary University of London, UK
_______________________________________________________________________________________ SUMMARY (1) There is evidence of gas-filled voids - ‘bubbles’ - in deep (> 50–100 cm) peat in North America.
(2) I used corers, designed to collect samples of accurately known volume, to sample peat profiles down to maximum depth 700 cm at five varied bog sites in northern England and southern Scotland, and measured the proportion of space apparently occupied by bubbles.
(3) Of 126 samples in peat below 50 cm depth, three had bubbles occupying 12–15 % of the volume (and one of these was at only 55 cm depth). The other 123 had apparent bubbles distributed in Gaussian fashion, positively and negatively, about zero proportion of total volume and with standard deviation less than 2 %, consistent with these ‘bubbles’ being measurement error.
(4) In northern England and southern Scotland, compared with North America, less variable temperature and cooler summers may lead to concentrations of dissolved gas that are generally too low to allow bubbles to form. Even where bubbles do form in summer, they may re-dissolve at winter temperatures.
KEY WORDS: bubble growth; Henry’s law; large-volume peat corers; methane; surface tension _______________________________________________________________________________________ INTRODUCTION Peatlands have no mineral skeleton, and the dead plants of which they are formed are deformable and decayable. They occupy about 3 % of the Earth’s land surface (Clymo et al. 1998; Yu et al. 2010), occurring on every continent except Antarctica, and they contain in aggregate about as much carbon (450 Gt: Gorham 1991; 612 Gt: Yu et al. 2010) as the pre-industrial atmosphere (580 Gt: Houghton et al. 1990) or current atmosphere (about 850 Gt: Stocker et al. 2013). For most of their up to 10 millennia history they have been net sinks for CO2 and sources of CH4. The surface living layers of most northern peat bogs (a large majority of the total) contain Sphagnum mosses with associated linear-leaved sedges and ericaceous shrubs. These surface moss-containing layers are highly porous, but below them the plant structures collapse as the load of plants and water above increases and aerobic decay reduces their strength. In consequence, the hydraulic conductivity decreases by one to several orders of magnitude. As long as precipitation exceeds evaporation, the peat becomes permanently waterlogged. Microbiological activity uses up molecular oxygen faster than it can diffuse down from the air through water and hence the peat, as it now is, becomes permanently anoxic. The main
source of CH4 is in a layer of rapid decay (Belyea 1996) just below the water table, and perhaps a bit below if there are root exudates, but CH4 and CO2 are also produced at much smaller rates throughout the whole of the anoxic peat (Clymo & Pearce 1995; Daulat & Clymo 1998; Clymo & Bryant 2008).
For most of the time the water table in the raised and blanket bogs sampled in this work is within 2 cm of the mean height (Clymo & Pearce 1995), but in drought it drops 30–50 cm before rising to the mean again on the first heavy rains. The unsaturated layer and the transition to the anoxic layer move down and up with the water table, the microbially mediated processes responding rapidly to these changes. The layer above the depth to which the water table falls in a dry summer is the acrotelm (Ingram 1978). Below it is the permanently anoxic catotelm, which may be as much as 1000 cm deep. The lower part of the acrotelm, subject to periodic oxic and anoxic conditions as the water table fluctuates, is the site of complicated biological and chemical processes, and is the mesotelm (Clymo & Bryant 2008). Above that is the acrotelm proper.
At all depths the concentrations of the gases N2 and Ar are at or close to equilibrium with those in the air while other gases are below (O2) or above (CH4,
CO2) equilibrium with air. In the unsaturated acrotelm proper, part of these gases is dissolved but
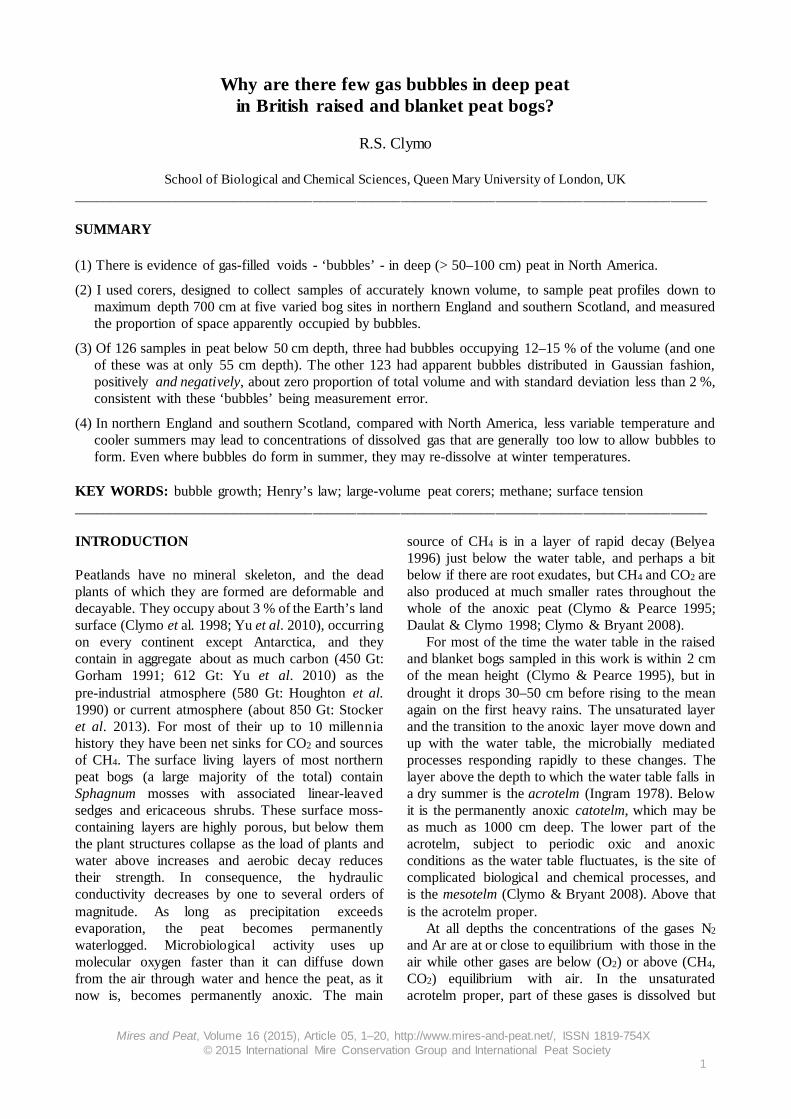
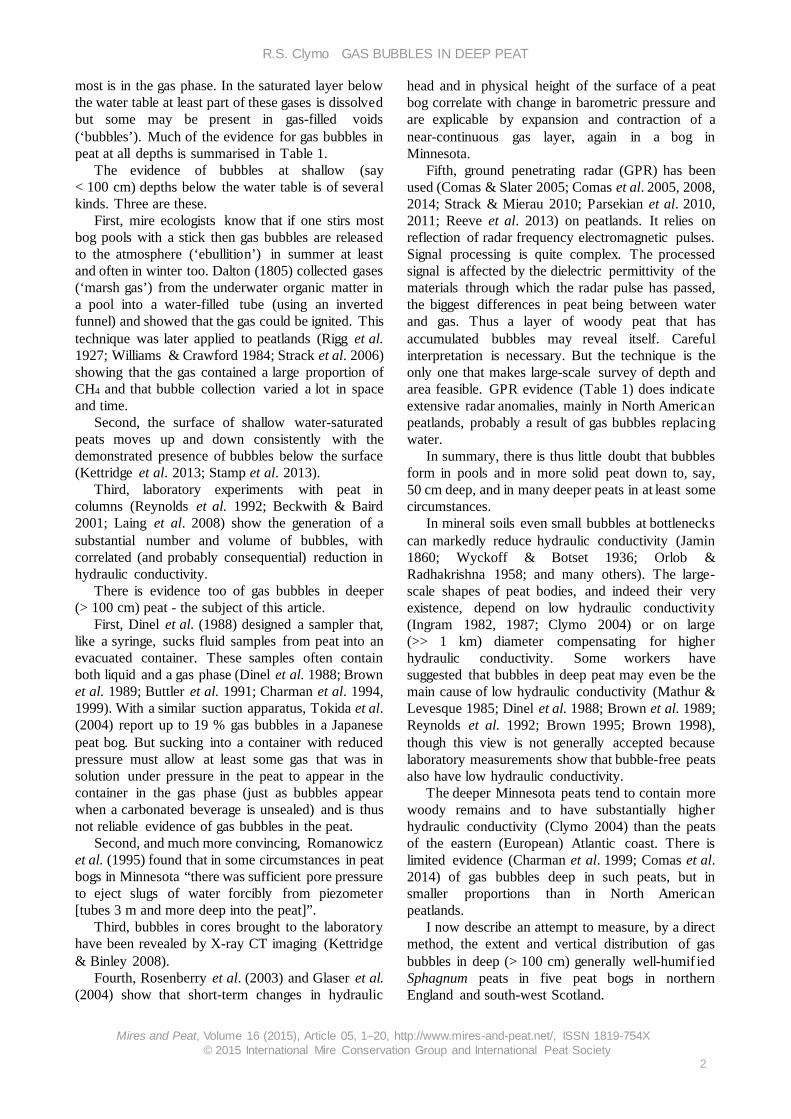
most is in the gas phase. In the saturated layer below the water table at least part of these gases is dissolved but some may be present in gas-filled voids (‘bubbles’). Much of the evidence for gas bubbles in peat at all depths is summarised in Table 1.
The evidence of bubbles at shallow (say < 100 cm) depths below the water table is of several kinds. Three are these.
First, mire ecologists know that if one stirs most bog pools with a stick then gas bubbles are released to the atmosphere (‘ebullition’) in summer at least and often in winter too. Dalton (1805) collected gases (‘marsh gas’) from the underwater organic matter in a pool into a water-filled tube (using an inverted funnel) and showed that the gas could be ignited. This technique was later applied to peatlands (Rigg et al. 1927; Williams & Crawford 1984; Strack et al. 2006) showing that the gas contained a large proportion of CH4 and that bubble collection varied a lot in space and time.
Second, the surface of shallow water-saturated peats moves up and down consistently with the demonstrated presence of bubbles below the surface (Kettridge et al. 2013; Stamp et al. 2013).
Third, laboratory experiments with peat in columns (Reynolds et al. 1992; Beckwith & Baird 2001; Laing et al. 2008) show the generation of a substantial number and volume of bubbles, with correlated (and probably consequential) reduction in hydraulic conductivity.
There is evidence too of gas bubbles in deeper (> 100 cm) peat - the subject of this article.
First, Dinel et al. (1988) designed a sampler that, like a syringe, sucks fluid samples from peat into an evacuated container. These samples often contain both liquid and a gas phase (Dinel et al. 1988; Brown et al. 1989; Buttler et al. 1991; Charman et al. 1994, 1999). With a similar suction apparatus, Tokida et al. (2004) report up to 19 % gas bubbles in a Japanese peat bog. But sucking into a container with reduced pressure must allow at least some gas that was in solution under pressure in the peat to appear in the container in the gas phase (just as bubbles appear when a carbonated beverage is unsealed) and is thus not reliable evidence of gas bubbles in the peat.
Second, and much more convincing, Romanowicz et al. (1995) found that in some circumstances in peat bogs in Minnesota “there was sufficient pore pressure to eject slugs of water forcibly from piezometer [tubes 3 m and more deep into the peat]”.
Third, bubbles in cores brought to the laboratory have been revealed by X-ray CT imaging (Kettridge & Binley 2008).
Fourth, Rosenberry et al. (2003) and Glaser et al. (2004) show that short-term changes in hydraulic
head and in physical height of the surface of a peat bog correlate with change in barometric pressure and are explicable by expansion and contraction of a near-continuous gas layer, again in a bog in Minnesota.
Fifth, ground penetrating radar (GPR) has been used (Comas & Slater 2005; Comas et al. 2005, 2008, 2014; Strack & Mierau 2010; Parsekian et al. 2010, 2011; Reeve et al. 2013) on peatlands. It relies on reflection of radar frequency electromagnetic pulses. Signal processing is quite complex. The processed signal is affected by the dielectric permittivity of the materials through which the radar pulse has passed, the biggest differences in peat being between water and gas. Thus a layer of woody peat that has accumulated bubbles may reveal itself. Careful interpretation is necessary. But the technique is the only one that makes large-scale survey of depth and area feasible. GPR evidence (Table 1) does indicate extensive radar anomalies, mainly in North American peatlands, probably a result of gas bubbles replacing water.
In summary, there is thus little doubt that bubbles form in pools and in more solid peat down to, say, 50 cm deep, and in many deeper peats in at least some circumstances.
In mineral soils even small bubbles at bottlenecks can markedly reduce hydraulic conductivity (Jamin 1860; Wyckoff & Botset 1936; Orlob & Radhakrishna 1958; and many others). The large-scale shapes of peat bodies, and indeed their very existence, depend on low hydraulic conductivity (Ingram 1982, 1987; Clymo 2004) or on large (>> 1 km) diameter compensating for higher hydraulic conductivity. Some workers have suggested that bubbles in deep peat may even be the main cause of low hydraulic conductivity (Mathur & Levesque 1985; Dinel et al. 1988; Brown et al. 1989; Reynolds et al. 1992; Brown 1995; Brown 1998), though this view is not generally accepted because laboratory measurements show that bubble-free peats also have low hydraulic conductivity.
The deeper Minnesota peats tend to contain more woody remains and to have substantially higher hydraulic conductivity (Clymo 2004) than the peats of the eastern (European) Atlantic coast. There is limited evidence (Charman et al. 1999; Comas et al. 2014) of gas bubbles deep in such peats, but in smaller proportions than in North American peatlands.
I now describe an attempt to measure, by a direct method, the extent and vertical distribution of gas bubbles in deep (> 100 cm) generally well-humif ied Sphagnum peats in five peat bogs in northern England and south-west Scotland.
Mineral ‘loam’ in cylinders 10-40 cm diameter; F, L
280 Start at 5 % by volume of entrapped air, steadily reduced by through-flow and diffusion
Faybishenko (1995)
Observation Red Lake Peatland, Minnesota (USA); F
400 “slugs of water ejected from piezometers” (by gas under pressure)
Romanowicz et al. (1995)
Pressure Red Lake Peatland, Minnesota (USA); F
420 episodic 20 cm water pressure fluctuations; up to 13 % gas phase
Rosenberry et al. (2003)
Surface altitude by GPS (Global Positioning System)
Red Lake Peatland, Minnesota (USA); F
~400
> 20 cm fluctuations of surface altitude as gas is released episodically; 20 cm / 400 cm ~ 5 % gas phase
Glaser et al. (2004)
GPR (Ground Penetrating Radar) in 10 m by 10 m grid
Maine (USA); F 840 CH4, CO2; inferred local peaks of 10 % by volume
Comas & Slater (2005)
GPR in whole mire survey Maine (USA); F 800+ inferred, especially below
wooded surface and open pools Comas et al. (2005)
GPR, atmospheric pressure and surface altitude (direct measurement)
Maine (USA); F 500+ inferred 10 to 15 % Comas et al. (2007, 2008, 2011)
GPR, surface altitude (direct measurement) and suction samples
Alberta (Canada); F 460 (GPR) 150 (suction)
0 to 7 % (hollow); 1 to 33 % (hummock)
Strack & Mierau (2010)
GPR
Sturgeon River, Red Lake Peatland, Minnesota (USA); F
site dependent, 300 to 500
inferred 5 to 12 % (mid-slope); 5 to 25 % (near-crest)
Parsekian et al. (2010)
GPR, ebullition through water-filled tube
Sturgeon River, Red Lake Peatland, Minnesota (USA); F
550 5 to 22 % Parsekian et al. (2011)
GPS Red Lake Peatland, Minnesota (USA); F
450 inferred; 10 % gave best fit Reeve et al. (2013)
GPR Maine (USA), Wales (UK); F 800 inferred 5 to 10 % in woody
layer (Maine), 2 to 5 % (Wales) Comas et al. (2014)
REVIEW ALL DEPTHS
Review of work to 2006 Various Various Rosenberry et al. (2006)
a Time domain reflectometry (TDR) is used as a surrogate for water proportion in peat. It depends on quite complex physics and electronics, and requires careful calibration. b Not given, but probably ‘shallow’. c Gas measured. No doubt other gases were also present.
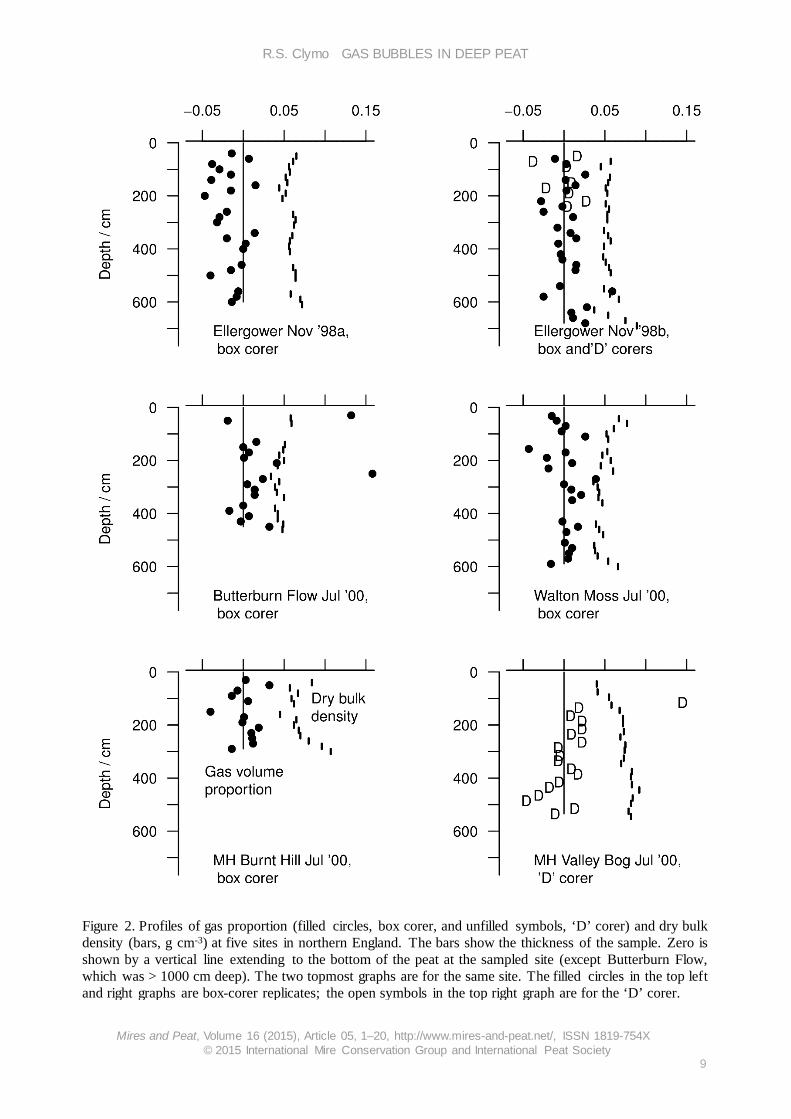
METHODS First I describe the sites, then the calculations on peat samples, then the two corers, and finally some supplementary methods. Sites and cores Five sites were chosen to span a range of types of blanket and raised bog in northern England, of precipitation, and of peat dry bulk density. Details of the five sites are in Table 2; the depths sampled can be seen in Figure 2 (Results). All samples came from below the water table at the sampling time. The peat at all sites was composed mainly of Sphagnum ranging from little humified to highly humified. Profiles consisted of 20 cm thick (deep) samples. At one site, Ellergower, three profiles were made: duplicates with the box corer (corers are described later) on successive days in November, and a single profile with the ‘D’ corer in July, thus allowing reproducibility to be assessed and bias to reveal itself.
The box corer was used at three other sites and the ‘D’ corer at one other (Figure 2). Cores were taken from a platform of wooden duckboards set on hummocks, lawns or shallow hollows, but not below pools. Measurements and calculations on peat samples A sample of peat of known volume was massed (‘weighed’), dried, and massed again. The intrinsic density of the dry peat was determined separately. The volume of peat solid was calculated from the dry mass of peat and its intrinsic density. The volume of liquid (‘peat water’) was got from the density of water at the temperature at which the sample was collected, and the difference between the total mass and the dry mass. The bubble volume was then the total volume minus the volumes of peat and liquid. Let V be volume, M be mass, and ρ be density; and let subscript ‘t’ be total, ‘p’ be dry peat, ‘l’ be liquid, and ‘g’ be gas (bubble). Then bubbles as a proportion of the total volume are given by
[ ] ( )
−−−
l
pt
p
p
tlp
tt
g
ρMM
+ρ
MV
=V+VV
=VV 1111 [1]
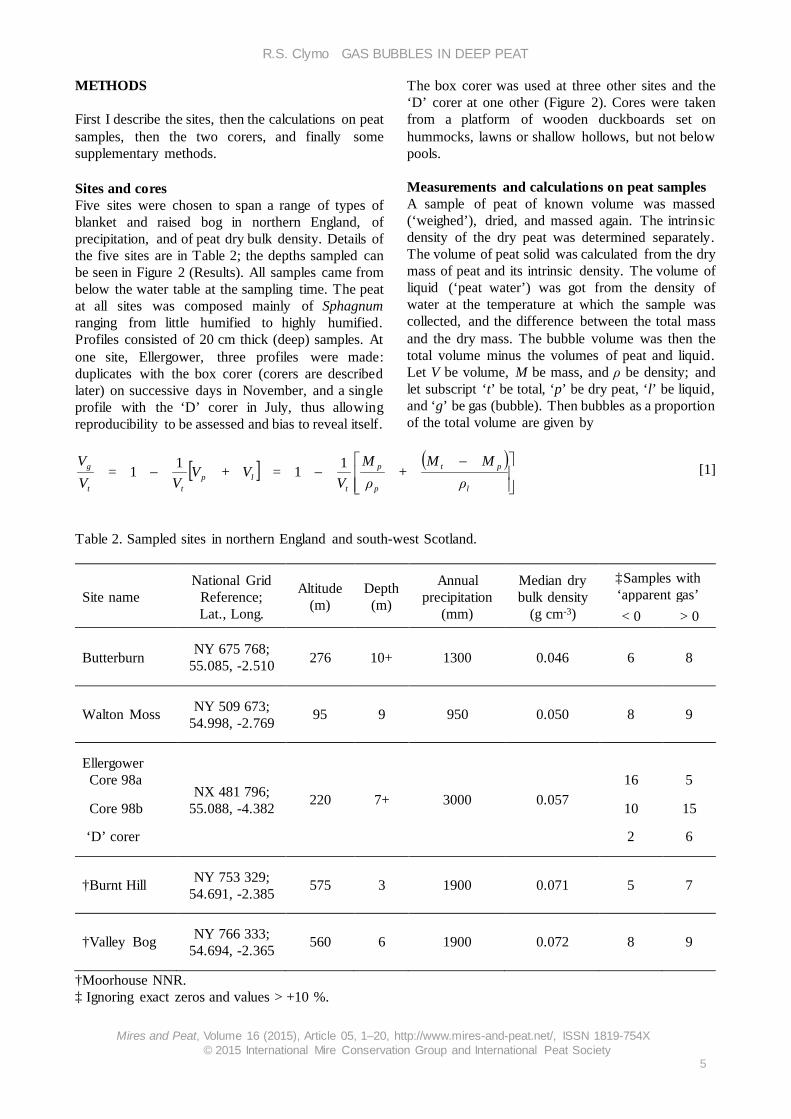
Table 2. Sampled sites in northern England and south-west Scotland.
The intrinsic density ρp of the peat solid, referring to a known volume Vt of a gas-free suspension of peat in water, and of the (dry) mass of peat and of the peat and water together was got from 𝑉𝑉𝑝𝑝 = 𝑉𝑉𝑡𝑡 − 𝑉𝑉𝑙𝑙 [2] so 𝑀𝑀𝑝𝑝𝜌𝜌𝑝𝑝
= 𝑉𝑉𝑡𝑡 −�𝑀𝑀𝑡𝑡−𝑀𝑀𝑝𝑝�
𝜌𝜌𝑙𝑙 [3]
Multiply by ρl and rearrange to give
𝜌𝜌𝑝𝑝 = 𝑀𝑀𝑝𝑝𝜌𝜌𝑙𝑙𝑉𝑉𝑡𝑡𝜌𝜌𝑙𝑙+𝑀𝑀𝑝𝑝−𝑀𝑀𝑡𝑡
[4]
and the dry bulk density (DBD) of peat is given by 𝐷𝐷𝐷𝐷𝐷𝐷 = 𝑀𝑀𝑝𝑝
𝑉𝑉𝑡𝑡 [5]
An error analysis of Equation 1, using plausible
values for errors in each of the five variables weighted by their partial differentials, shows (Clymo 2014) that a 1 % error in Vt constitutes 98 % of the total error: the uncertainty in the proportion of bubbles is overwhelmingly governed by that in the measurement of total volume. Corers Piston corers are liable to collect incomplete cores (Wright 1993) when friction between the core and wall causes peat to be displaced sideways at the core entry; the Hiller borer churns the sample; and the standard 5 cm diameter half-cylinder (‘D’ or ‘Russian pattern’, Belokoptyov & Beresnevich 1955) corer has volume precision and bias that depend on the corer diameter and type of peat, and are often no better than 5–10 % (Clymo unpublished). The errors are likely to be related to edge effects, and thus to be inversely related to the size of the corer. Therefore, I designed and constructed two large-volume corers based on different principles to each other, thus allowing bias to reveal itself. Box corer The design principle is that described by Digerfeldt (1966). A 196 cm long three-sided vertical channel with internal dimensions nominally 10 by 10 cm (actual cross section 103.7 cm2) was made of 3 mm thick type 310 stainless steel (Figure 1, left). Both free edges were bent out at right angles and each supported a slot in which the fourth side slid. To close the bottom of the corer, the bottom 20 cm of the two sides of the channel tapered via a 15 cm radius curve
from the open side of the channel then straight to its back. The end of the slider was made of spring steel with a sharp end. When the slider was pushed fully down the spring steel bent round in the slots and then straight to the corer tip, thus sealing the end. The top end of the corer and the top of the slider were each attached to a standard peat borer ‘handclasp’ connector and as many extension rods on box and on slider as necessary.
Sampling was from duckboards at two adjacent (< 1 m apart) spots used alternately. In use the closed but empty corer was pushed down to a few cm above the top of the section to be sampled. The slider was pulled up to its open (top) position, then the whole corer was pushed steadily down to the required depth cutting three sides but leaving the fourth to minimise the risk of compression. Then the slider was pushed down cutting the fourth side and enclosing the peat core. Finally, the whole corer was pulled up to the surface, the slider withdrawn, and samples taken.
First, the lower end of the peat core was squared off by inserting across the peat core in the open box a tightly fitting plate with a sharp bottom edge. This was then replaced with a watertight end stop. A sample was then defined by inserting a second plate an exact distance above the first, and the peat between the plates was removed, after which the end stop was slid up to the new cut end of the core. The peat at the sites was generally well-humified and it was difficult to extract water even by squeezing. The samples reported here were 20 cm thick (long), giving a volume of 2074 cm3. The core was 196 cm long, but only a central 160 cm was used for samples. An error of 1 mm in positioning the cross plate represents a volume error of 0.5 %. The volume of the corer and the peat at the temperature in the field was corrected to a standard temperature of 10 oC. These corrections were never > 0.2 % of the total volume. Half cylinder ‘D’ corer This corer was a large version of that described by Belokoptyov & Beresnevich (1955). It had a 60 cm long and 4 mm thick vertical flat titanium alloy plate round which a 17 cm diameter half cylinder of 3 mm thick titanium alloy rotated by half a turn (Figure 1, right). Titanium alloy was needed for stiffness and lightness. ‘D’-shaped end plates with sharpened curved sides, at top and bottom, could rotate about a horizontal axis. The whole corer was attached to a standard peat borer ‘handclasp’ connector and as many extension rods as necessary. In use the end plates were locked in the vertical position (presenting minimum resistance), and the corer was pushed down to the required depth. The end plates were rotated and locked into the horizontal position using Bowden
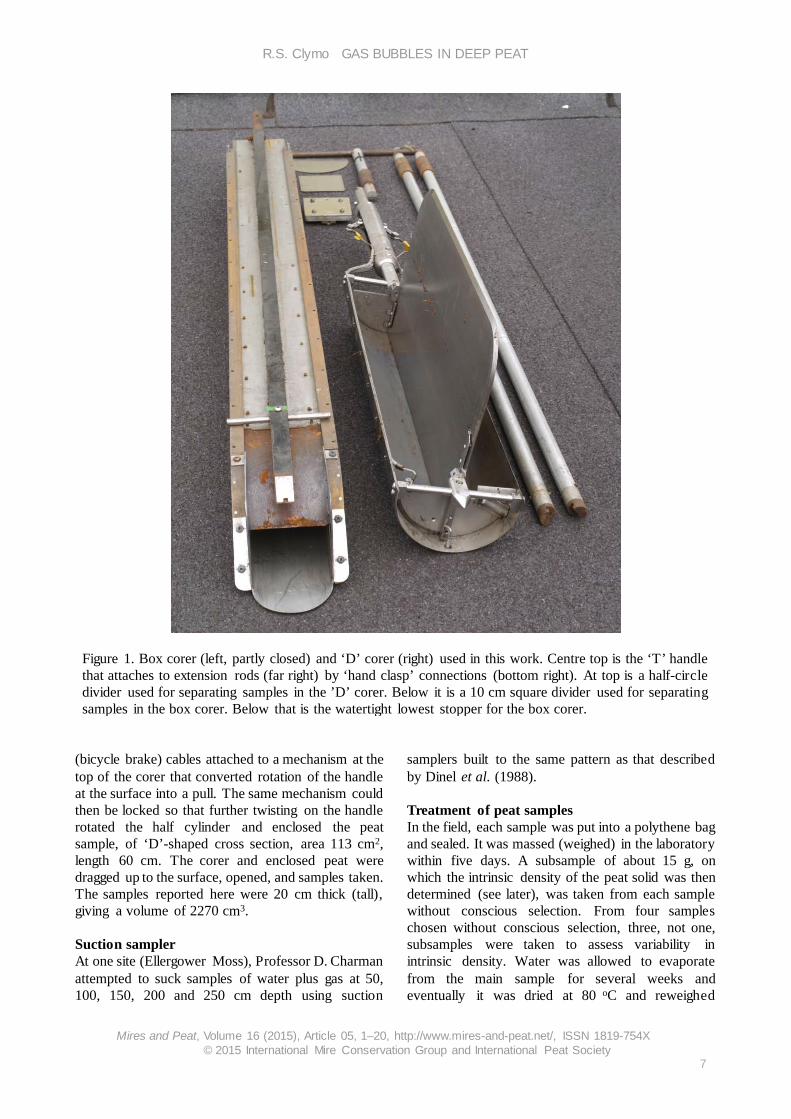
Figure 1. Box corer (left, partly closed) and ‘D’ corer (right) used in this work. Centre top is the ‘T’ handle that attaches to extension rods (far right) by ‘hand clasp’ connections (bottom right). At top is a half-circle divider used for separating samples in the ’D’ corer. Below it is a 10 cm square divider used for separating samples in the box corer. Below that is the watertight lowest stopper for the box corer.
(bicycle brake) cables attached to a mechanism at the top of the corer that converted rotation of the handle at the surface into a pull. The same mechanism could then be locked so that further twisting on the handle rotated the half cylinder and enclosed the peat sample, of ‘D’-shaped cross section, area 113 cm2, length 60 cm. The corer and enclosed peat were dragged up to the surface, opened, and samples taken. The samples reported here were 20 cm thick (tall), giving a volume of 2270 cm3. Suction sampler At one site (Ellergower Moss), Professor D. Charman attempted to suck samples of water plus gas at 50, 100, 150, 200 and 250 cm depth using suction
samplers built to the same pattern as that described by Dinel et al. (1988). Treatment of peat samples In the field, each sample was put into a polythene bag and sealed. It was massed (weighed) in the laboratory within five days. A subsample of about 15 g, on which the intrinsic density of the peat solid was then determined (see later), was taken from each sample without conscious selection. From four samples chosen without conscious selection, three, not one, subsamples were taken to assess variability in intrinsic density. Water was allowed to evaporate from the main sample for several weeks and eventually it was dried at 80 oC and reweighed
(massed). The proportion of bubbles was calculated from Equation 1. Intrinsic density of peat solid The subsample of about 15 g of fresh peat (dried peat does not rewet easily) was suspended in about 100 ml of degassed water and boiled twice under vacuum at room temperature to remove gas bubbles. Even a single 1-mm diameter bubble is enough to invalidate the result. The suspension was transferred, then more degassed water added, to overfill a glass tube into the top of which a B24 ground glass stopper with a 1 mm diameter capillary through it was then placed, taking care to avoid introducing any gas bubbles. The free meniscus at the top of the capillary was blotted in a standard way by drawing a Whatman #40 filter paper slowly across the top of the stopper, and the tube plus contents massed (weighed). The blotting and massing were crucial as the result depends on a relatively small difference - typically 1 % - between it and the mass of the apparatus filled with water. The suspension was decanted, dried at 80 °C and the peat solid massed. The dry mass of the glass and the volume of the tube (from the mass when filled with water) had been separately determined 16 times each and means were used as constants. Equation 4 was used to calculate the intrinsic density of the peat solid. Surface tension The surface tension of the interface between peat pore water and gas bubble was needed for later calculation of bubble development. Capillary tubes were cut from cleaned and repeatedly rinsed Pyrex tubes, and annealed at 700 °C. Distilled water was allowed to reach equilibrium height when the bottom of the vertical tube just touched the surface of the water. The height to the meniscus was measured. This process was repeated for peat pore water, then again for distilled water and pore water. Each tube was used for these four measurements only, then scrapped. Values for pore water were compared with those for distilled water. RESULTS Both box and ‘D’ corers were satisfactory in most of the peats we sampled: they could not penetrate very stiff peats, and the ‘D’ corer particularly lost water in the very fluid peat below 450 cm at Butterburn Flow. Only samples from which we saw no water loss are included. In none of the samples did we see the indent of any bubbles at the cut surface of the samples.
The suction sampler collected only small amounts
of gas and no water at the site where it was tried in November (Ellergower Moss), though the same equipment had succeeded at sites not in this survey. The hydraulic conductivity at Ellergower has been shown to be unusually small (Clymo 2004).
Intrinsic densities of all 126 peat samples were very similar: mean 1.49 g cm-3, CI 1.48 to 1.50 (SD, combining sampling and measurement errors, 0.057 g cm-3, n =126). This is not inconsistent with an earlier estimate for fresh Sphagnum (not peat): 1.55 g cm-3 (Clymo 1970). Error in the intrinsic density (Clymo 2014) contributes less than 3 % of the overall error in the calculated proportion of gas in the peat (this is the contribution to total error, not to the gas proportion).
Profiles of bubble proportion and dry bulk density are shown in Figure 2. Note that the scale runs from -5 to +15 % only. The replicate profiles at Ellergower (Nov 98b box corer and Jul 00 D-corer; Figure 2) agree encouragingly closely, but those for Nov 98a are distinctly biased (Table 2, last two columns) and into the un-physical region of apparent negative proportion of gas. The two box cores at this site were taken on successive days with the same person placing the dividers into the core - a critical operation. The bias is equivalent to about 3 mm error in placing dividers and is not cumulative. It seems implausibly large and although individual errors of similar size appear in other cores there is no evidence of consistent bias. I am unable to explain this result and exclude it from later consideration.
Only three of the putative bubble proportions lie outside zero ± 5 % (Figure 2: Butterburn Flow and Valley Bog) and these three, at 13–15 %, are clearly different from the rest. Two of these samples are the shallowest in their profiles (< 100 cm deep); only the third, at 250 cm deep (Butterburn) is well into the deeper peat, and this peat had unusually low DBD.
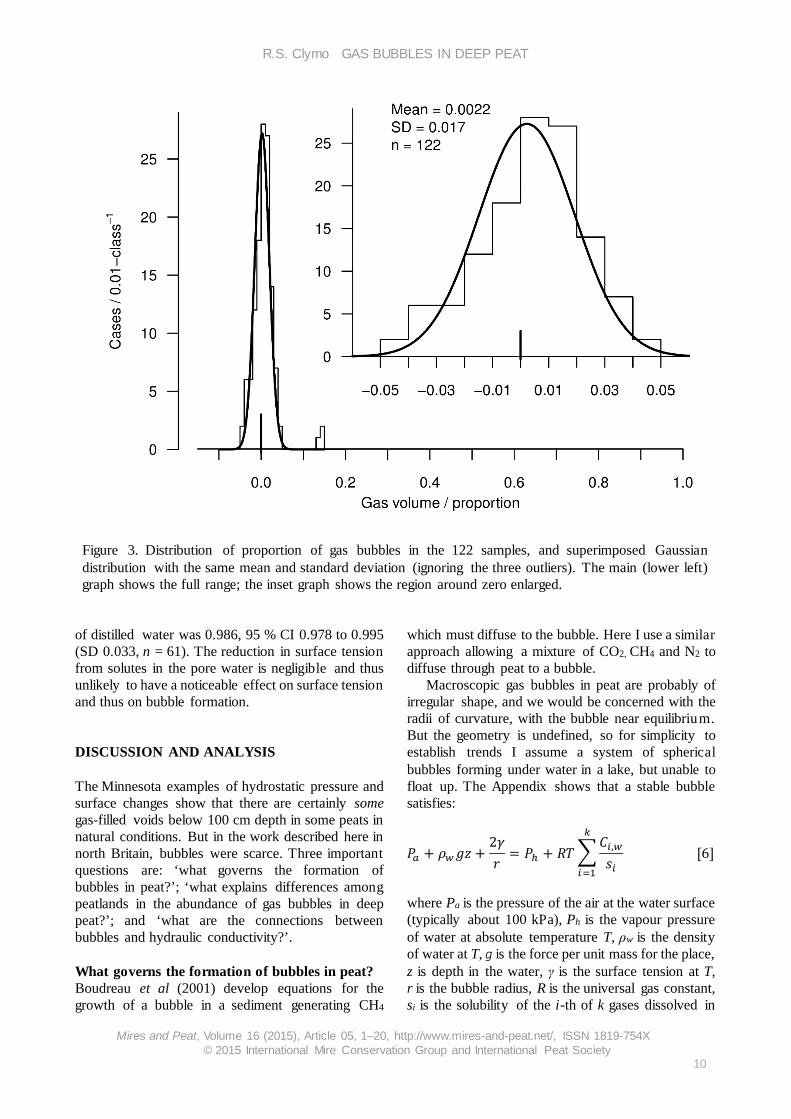
The main graph in Figure 3 is a histogram of all samples drawn on a natural scale while the inset expands the region around zero gas proportion. The inset excludes the three egregious samples with 13–15 % gas, and the apparently biased Ellergower Nov 98a core too. This reduced set of results is nearly symmetric about zero, and has mean 0.0022, 95 % CI -0.0041 to +0.0027 (SD 0.017, n = 102) and a test of the null hypothesis that the results follow a Gaussian distribution has P = 0.36. This is all consistent with the conclusion that most of the results are showing simply measurement plus sampling error with overall variation (standard deviation) of about 2 %.
Capillary rise was measured on pore water from samples every 10 cm to 600 cm depth at Ellergower Moss. No water could be squeezed out below that depth. The mean quotient of rise of pore water / rise
Figure 2. Profiles of gas proportion (filled circles, box corer, and unfilled symbols, ‘D’ corer) and dry bulk density (bars, g cm-3) at five sites in northern England. The bars show the thickness of the sample. Zero is shown by a vertical line extending to the bottom of the peat at the sampled site (except Butterburn Flow, which was > 1000 cm deep). The two topmost graphs are for the same site. The filled circles in the top left and right graphs are box-corer replicates; the open symbols in the top right graph are for the ‘D’ corer.
Figure 3. Distribution of proportion of gas bubbles in the 122 samples, and superimposed Gaussian distribution with the same mean and standard deviation (ignoring the three outliers). The main (lower left) graph shows the full range; the inset graph shows the region around zero enlarged.
of distilled water was 0.986, 95 % CI 0.978 to 0.995 (SD 0.033, n = 61). The reduction in surface tension from solutes in the pore water is negligible and thus unlikely to have a noticeable effect on surface tension and thus on bubble formation. DISCUSSION AND ANALYSIS The Minnesota examples of hydrostatic pressure and surface changes show that there are certainly some gas-filled voids below 100 cm depth in some peats in natural conditions. But in the work described here in north Britain, bubbles were scarce. Three important questions are: ‘what governs the formation of bubbles in peat?’; ‘what explains differences among peatlands in the abundance of gas bubbles in deep peat?’; and ‘what are the connections between bubbles and hydraulic conductivity?’. What governs the formation of bubbles in peat? Boudreau et al (2001) develop equations for the growth of a bubble in a sediment generating CH4
which must diffuse to the bubble. Here I use a similar approach allowing a mixture of CO2, CH4 and N2 to diffuse through peat to a bubble.
Macroscopic gas bubbles in peat are probably of irregular shape, and we would be concerned with the radii of curvature, with the bubble near equilibrium. But the geometry is undefined, so for simplicity to establish trends I assume a system of spherical bubbles forming under water in a lake, but unable to float up. The Appendix shows that a stable bubble satisfies:
𝑃𝑃𝑎𝑎 + 𝜌𝜌𝑤𝑤𝑔𝑔𝑔𝑔 +2𝛾𝛾𝑟𝑟
= 𝑃𝑃ℎ + 𝑅𝑅𝑇𝑇�𝐶𝐶𝑖𝑖,𝑤𝑤𝑠𝑠𝑖𝑖
𝑘𝑘
𝑖𝑖=1
[6]
where Pa is the pressure of the air at the water surface (typically about 100 kPa), Ph is the vapour pressure of water at absolute temperature T, ρw is the density of water at T, g is the force per unit mass for the place, z is depth in the water, γ is the surface tension at T, r is the bubble radius, R is the universal gas constant, si is the solubility of the i-th of k gases dissolved in
the water at T, and Ci,w is the concentration of gas i in the water after a bubble has formed.
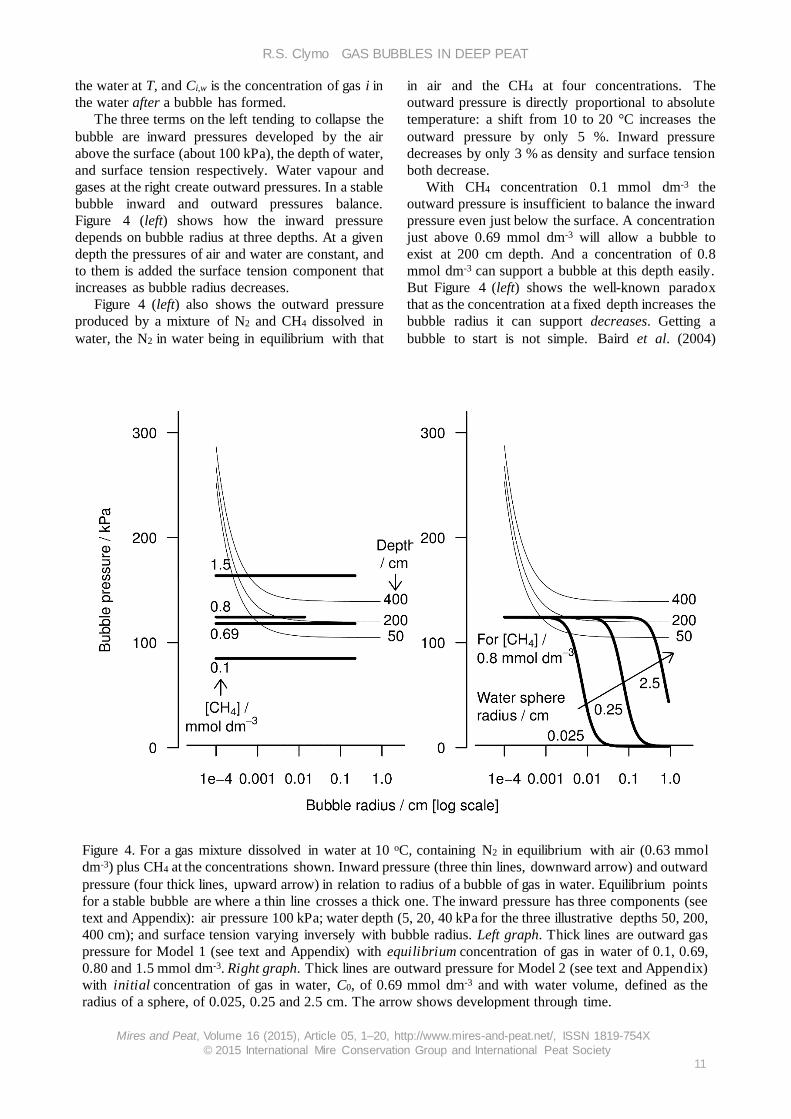
The three terms on the left tending to collapse the bubble are inward pressures developed by the air above the surface (about 100 kPa), the depth of water, and surface tension respectively. Water vapour and gases at the right create outward pressures. In a stable bubble inward and outward pressures balance. Figure 4 (left) shows how the inward pressure depends on bubble radius at three depths. At a given depth the pressures of air and water are constant, and to them is added the surface tension component that increases as bubble radius decreases.
Figure 4 (left) also shows the outward pressure produced by a mixture of N2 and CH4 dissolved in water, the N2 in water being in equilibrium with that
in air and the CH4 at four concentrations. The outward pressure is directly proportional to absolute temperature: a shift from 10 to 20 °C increases the outward pressure by only 5 %. Inward pressure decreases by only 3 % as density and surface tension both decrease.
With CH4 concentration 0.1 mmol dm-3 the outward pressure is insufficient to balance the inward pressure even just below the surface. A concentration just above 0.69 mmol dm-3 will allow a bubble to exist at 200 cm depth. And a concentration of 0.8 mmol dm-3 can support a bubble at this depth easily. But Figure 4 (left) shows the well-known paradox that as the concentration at a fixed depth increases the bubble radius it can support decreases. Getting a bubble to start is not simple. Baird et al. (2004)
Figure 4. For a gas mixture dissolved in water at 10 oC, containing N2 in equilibrium with air (0.63 mmol dm-3) plus CH4 at the concentrations shown. Inward pressure (three thin lines, downward arrow) and outward pressure (four thick lines, upward arrow) in relation to radius of a bubble of gas in water. Equilibrium points for a stable bubble are where a thin line crosses a thick one. The inward pressure has three components (see text and Appendix): air pressure 100 kPa; water depth (5, 20, 40 kPa for the three illustrative depths 50, 200, 400 cm); and surface tension varying inversely with bubble radius. Left graph. Thick lines are outward gas pressure for Model 1 (see text and Appendix) with equilibrium concentration of gas in water of 0.1, 0.69, 0.80 and 1.5 mmol dm-3. Right graph. Thick lines are outward pressure for Model 2 (see text and Appendix) with initial concentration of gas in water, C0, of 0.69 mmol dm-3 and with water volume, defined as the radius of a sphere, of 0.025, 0.25 and 2.5 cm. The arrow shows development through time.
pointed out that at the surface of a peat column the water table rises and falls at least seasonally (Clymo & Pearce 1995), and although the rate is small this may entrap small bubbles, which may survive the continuing upward growth of the peat. But such bubbles may disappear soon after entrapment (Baird et al. 2004), and even if they survive into deep peat the pressure in the bubble increases (owing to the increasing weight of water and peat above), so the gas in a bubble will tend to diffuse out into the peat pore water, and (given a century or more) be removed from the system by diffusion into the air - a surprisingly effective process given time (Clymo & Bryant 2008; Clymo & Williams 2012). More generally, however, in peat without any bubbles, as concentration increases gradually so it can first support only a large bubble, but the solubility of N2 and CH4 is small (the solubility of a gas in water is a partition coefficient, not an amount per unit volume as it is for solids). Most of the gas in the vicinity of the potential bubble thus goes into the bubble, reducing the concentration round about below the value needed to support an actual bubble. We need to consider the volume of water from which gas may be scavenged into the bubble. To begin with, this volume will be small, and it will increase with time as diffusion is able to move gas to the bubble.
The Appendix shows (Model 2) that the inward and outward pressures are given by:
𝑃𝑃𝑎𝑎 + 𝜌𝜌𝑤𝑤𝑔𝑔𝑔𝑔 +2𝛾𝛾𝑟𝑟 = 𝑃𝑃ℎ + 𝑅𝑅𝑇𝑇𝑉𝑉𝑤𝑤�
𝐶𝐶𝑖𝑖.𝑤𝑤.0𝑠𝑠𝑖𝑖𝑉𝑉𝑤𝑤 + 4𝑁𝑁𝑁𝑁𝑟𝑟3 3⁄ [7]
𝑘𝑘
𝑖𝑖=1
where Vw is the volume of water from which gas may be scavenged (described by the radius of a sphere of volume Vw); Ci,w,0 is the concentration of gas i in the water in State 0, before a bubble forms; and N is the number of bubbles that will form in Vw. An example of this equation is shown in Figure 4 (right). At 200 cm deep and with gas concentration of 0.8 mmol dm-3, which could easily support a bubble if one already existed, no bubble can form in the early stages when gas can be scavenged from only 0.025 cm around. By the time scavenging can reach 0.25 cm then a bubble can be supported. The maximum size of bubble will be given by the right-hand intersection of thin and thick lines, where negative feedback will control bubble size. In Model 1, Figure 4 (left), with a gradually increasing concentration of dissolved gas, one expected the first contact to occur at very large radius bubble. But in the more realistic Model 2 first contact occurs at a finite small radius and small scavenging distance. In both models there is a minimum concentration of
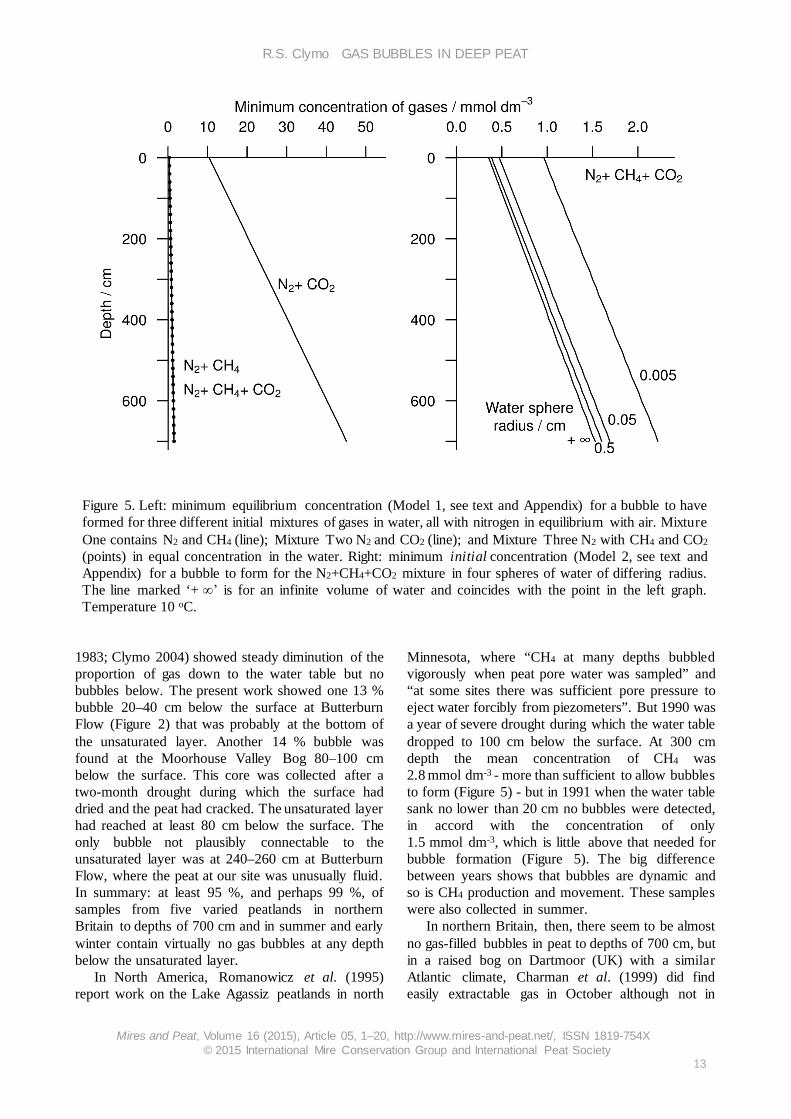
dissolved gas if a bubble is to form. Figure 5 (left) shows the minimum concentration
to be expected for three gas mixtures at various depths after bubbles have formed. The solubility coefficient of CO2 is much greater than that of N2 and CH4 so the concentration of gas in water after a bubble has formed is about 25 times greater. But the minimum concentration when CH4 and CO2 are equimolar (close to the case reported by Clymo & Pearce 1995; Clymo & Bryant 2008) is little different from that with N2 and CH4 alone: the concentration of CH4 in the bubbles is much greater than that of CO2, though the concentrations in water are the same. In practice we need concentration profiles of CH4, but can do without those of CO2. In all cases the minimum concentration increases almost linearly with depth because the thick and thin lines intersect at a shallow angle over the depth range of interest.
In Figure 5 (right) is shown the way in which the first contact (minimum concentration) depends on the scavenging distance. At a given depth one may expect the concentration to increase gradually until a bubble forms, and the bubble can then increase in size as the scavenging distance increases with time.
This analysis has used water for simplicity, but the same principles apply to peat with some modifications. First, the pressure external to the bubble is increased because the density of the peat is greater than that of water, but this increase is less than 2 %. Local and regional hydrological processes may also affect pore water pressure. Second, the surface tension of pore water is less than that of pure water because of surface active substances dissolved from the peat. But this effect is also less than 2 %. Third, all but the smallest gas bubbles in peat will be of irregular shape. Finally, peat pore water may supersaturate, in the sense that the concentration of dissolved gases may be sufficient to support a bubble, but the bubble does not form unless there is a suitable nucleus. There are, of course, abundant solid surfaces in peat, but most are hydrophilic and thus not effective nuclei. We do not know whether or not there are abundant hydrophobic surfaces, such as plant cuticles.
In summary, there is a concentration of dissolved gas, increasing almost linearly with depth, below which bubbles cannot form. What explains differences among peatlands in the abundance of gas bubbles in deep peat? Bubbles are present, by definition, in the unsaturated layer at the surface. Physical analyses similar to the present work on 1 cm slices of 20 cm diameter cores of the top 50 cm of plants and the peat below (Clymo & Hayward 1982; Hayward & Clymo 1982; Clymo
Figure 5. Left: minimum equilibrium concentration (Model 1, see text and Appendix) for a bubble to have formed for three different initial mixtures of gases in water, all with nitrogen in equilibrium with air. Mixture One contains N2 and CH4 (line); Mixture Two N2 and CO2 (line); and Mixture Three N2 with CH4 and CO2 (points) in equal concentration in the water. Right: minimum initial concentration (Model 2, see text and Appendix) for a bubble to form for the N2+CH4+CO2 mixture in four spheres of water of differing radius. The line marked ‘+ ∞’ is for an infinite volume of water and coincides with the point in the left graph. Temperature 10 oC.
1983; Clymo 2004) showed steady diminution of the proportion of gas down to the water table but no bubbles below. The present work showed one 13 % bubble 20–40 cm below the surface at Butterburn Flow (Figure 2) that was probably at the bottom of the unsaturated layer. Another 14 % bubble was found at the Moorhouse Valley Bog 80–100 cm below the surface. This core was collected after a two-month drought during which the surface had dried and the peat had cracked. The unsaturated layer had reached at least 80 cm below the surface. The only bubble not plausibly connectable to the unsaturated layer was at 240–260 cm at Butterburn Flow, where the peat at our site was unusually fluid. In summary: at least 95 %, and perhaps 99 %, of samples from five varied peatlands in northern Britain to depths of 700 cm and in summer and early winter contain virtually no gas bubbles at any depth below the unsaturated layer.
In North America, Romanowicz et al. (1995) report work on the Lake Agassiz peatlands in north
Minnesota, where “CH4 at many depths bubbled vigorously when peat pore water was sampled” and “at some sites there was sufficient pore pressure to eject water forcibly from piezometers”. But 1990 was a year of severe drought during which the water table dropped to 100 cm below the surface. At 300 cm depth the mean concentration of CH4 was 2.8 mmol dm-3 - more than sufficient to allow bubbles to form (Figure 5) - but in 1991 when the water table sank no lower than 20 cm no bubbles were detected, in accord with the concentration of only 1.5 mmol dm-3, which is little above that needed for bubble formation (Figure 5). The big difference between years shows that bubbles are dynamic and so is CH4 production and movement. These samples were also collected in summer.
In northern Britain, then, there seem to be almost no gas-filled bubbles in peat to depths of 700 cm, but in a raised bog on Dartmoor (UK) with a similar Atlantic climate, Charman et al. (1999) did find easily extractable gas in October although not in
April (Charman letter 29 September 2001). In eastern Canada there is evidence of bubbles occupying 2–15 % of the peat but the evidence extends to only 150 cm deep and there may be substantial differences between years. In north Minnesota there are gas-filled bubbles to 400 cm deep, but only in exceptional years. Can these observations be reconciled?
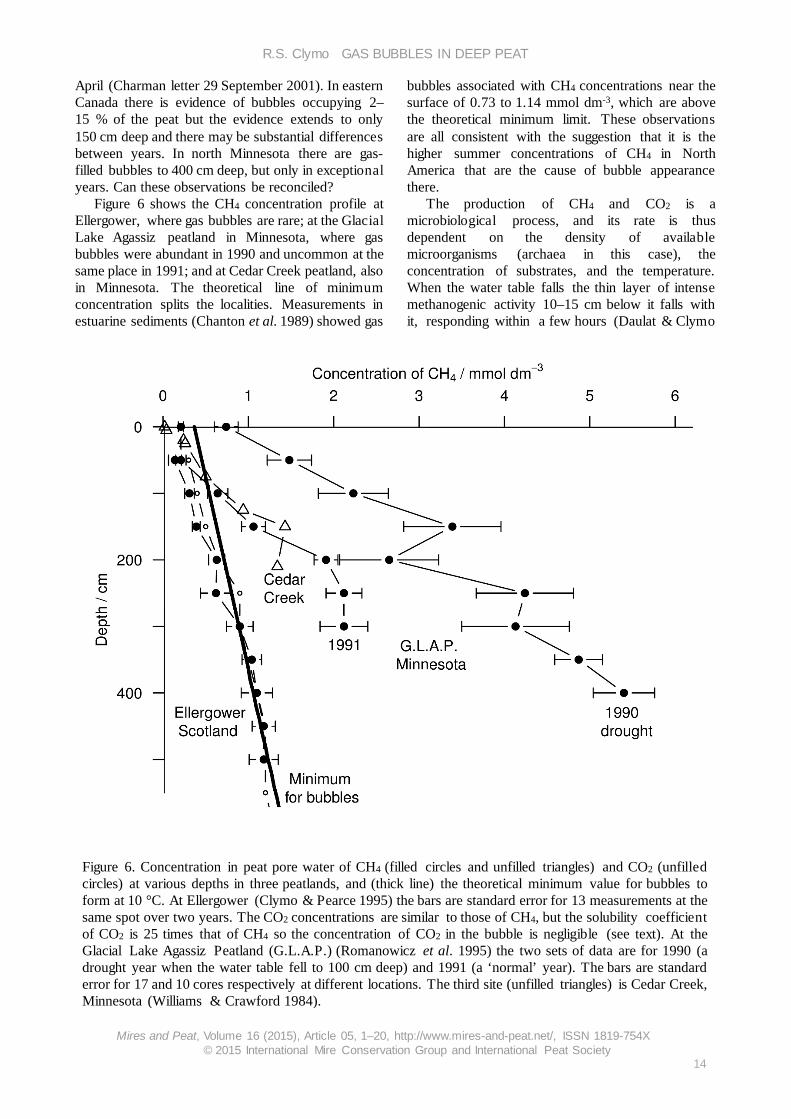
Figure 6 shows the CH4 concentration profile at Ellergower, where gas bubbles are rare; at the Glacial Lake Agassiz peatland in Minnesota, where gas bubbles were abundant in 1990 and uncommon at the same place in 1991; and at Cedar Creek peatland, also in Minnesota. The theoretical line of minimum concentration splits the localities. Measurements in estuarine sediments (Chanton et al. 1989) showed gas
bubbles associated with CH4 concentrations near the surface of 0.73 to 1.14 mmol dm-3, which are above the theoretical minimum limit. These observations are all consistent with the suggestion that it is the higher summer concentrations of CH4 in North America that are the cause of bubble appearance there.
The production of CH4 and CO2 is a microbiological process, and its rate is thus dependent on the density of available microorganisms (archaea in this case), the concentration of substrates, and the temperature. When the water table falls the thin layer of intense methanogenic activity 10–15 cm below it falls with it, responding within a few hours (Daulat & Clymo
Figure 6. Concentration in peat pore water of CH4 (filled circles and unfilled triangles) and CO2 (unfilled circles) at various depths in three peatlands, and (thick line) the theoretical minimum value for bubbles to form at 10 °C. At Ellergower (Clymo & Pearce 1995) the bars are standard error for 13 measurements at the same spot over two years. The CO2 concentrations are similar to those of CH4, but the solubility coefficient of CO2 is 25 times that of CH4 so the concentration of CO2 in the bubble is negligible (see text). At the Glacial Lake Agassiz Peatland (G.L.A.P.) (Romanowicz et al. 1995) the two sets of data are for 1990 (a drought year when the water table fell to 100 cm deep) and 1991 (a ‘normal’ year). The bars are standard error for 17 and 10 cores respectively at different locations. The third site (unfilled triangles) is Cedar Creek, Minnesota (Williams & Crawford 1984).
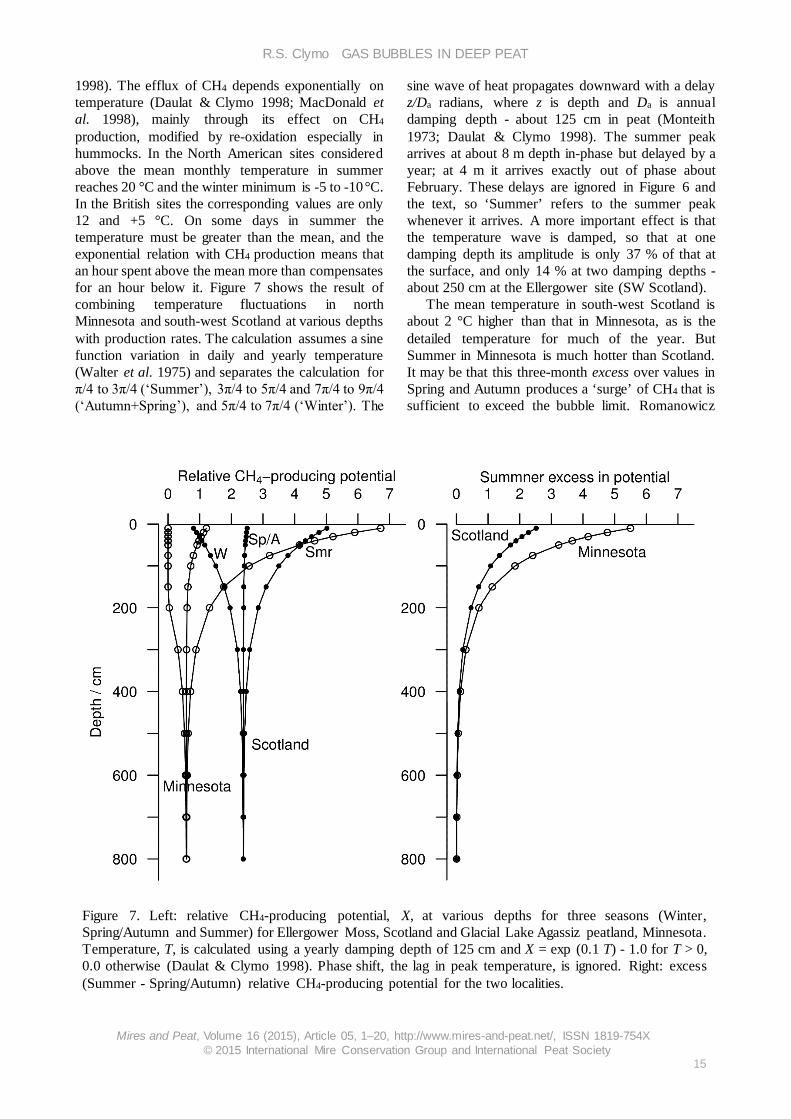
1998). The efflux of CH4 depends exponentially on temperature (Daulat & Clymo 1998; MacDonald et al. 1998), mainly through its effect on CH4 production, modified by re-oxidation especially in hummocks. In the North American sites considered above the mean monthly temperature in summer reaches 20 °C and the winter minimum is -5 to -10 °C. In the British sites the corresponding values are only 12 and +5 °C. On some days in summer the temperature must be greater than the mean, and the exponential relation with CH4 production means that an hour spent above the mean more than compensates for an hour below it. Figure 7 shows the result of combining temperature fluctuations in north Minnesota and south-west Scotland at various depths with production rates. The calculation assumes a sine function variation in daily and yearly temperature (Walter et al. 1975) and separates the calculation for π/4 to 3π/4 (‘Summer’), 3π/4 to 5π/4 and 7π/4 to 9π/4 (‘Autumn+Spring’), and 5π/4 to 7π/4 (‘Winter’). The
sine wave of heat propagates downward with a delay z/Da radians, where z is depth and Da is annual damping depth - about 125 cm in peat (Monteith 1973; Daulat & Clymo 1998). The summer peak arrives at about 8 m depth in-phase but delayed by a year; at 4 m it arrives exactly out of phase about February. These delays are ignored in Figure 6 and the text, so ‘Summer’ refers to the summer peak whenever it arrives. A more important effect is that the temperature wave is damped, so that at one damping depth its amplitude is only 37 % of that at the surface, and only 14 % at two damping depths - about 250 cm at the Ellergower site (SW Scotland).
The mean temperature in south-west Scotland is about 2 °C higher than that in Minnesota, as is the detailed temperature for much of the year. But Summer in Minnesota is much hotter than Scotland. It may be that this three-month excess over values in Spring and Autumn produces a ‘surge’ of CH4 that is sufficient to exceed the bubble limit. Romanowicz
Figure 7. Left: relative CH4-producing potential, X, at various depths for three seasons (Winter, Spring/Autumn and Summer) for Ellergower Moss, Scotland and Glacial Lake Agassiz peatland, Minnesota. Temperature, T, is calculated using a yearly damping depth of 125 cm and X = exp (0.1 T) - 1.0 for T > 0, 0.0 otherwise (Daulat & Clymo 1998). Phase shift, the lag in peak temperature, is ignored. Right: excess (Summer - Spring/Autumn) relative CH4-producing potential for the two localities.
et al. (1995) write that “... during the fall of 1992, extensive gas bubbling was observed ... suggesting the build-up of CH4 may occur each year, peaking in the summer or early fall”. It would be of interest to have measurements of CH4 concentration and bubble abundance in the winter. One of the features of the Ellergower measurements (Figure 7) is that there is little variation in concentration throughout the year - less than the variation at a single time at different sites in Minnesota. Consistent with this explanation is Charman’s finding that a Dinel-pattern vacuum sampler could not extract gas from a Dartmoor bog in April, but was able to in October. What are the connections between bubbles and hydraulic conductivity? Bubbles and hydraulic conductivity affect each other. First, the hydraulic conductivity in the Minnesota peatlands is at least two orders of magnitude greater than it is at Ellergower in Scotland (Chason & Siegel 1986; Clymo 2004) and this must make the movement of bubbles much easier in Minnesota.
Second, bubbles reduce hydraulic conductivity in peat. Laboratory experiments on shallow peats show this (Beckwith & Baird 2001; Baird & Waldron 2003), as do field measurements in shallow peat (Kettridge et al. 2013). One would expect the same physics to apply in deep peat.
The effect of gas bubbles on hydraulic conductivity may contribute to peat accumulation, but the occasional suggestion that it is the main cause of peat accumulation seems wide of the mark. For example, it cannot explain the peat at Ellergower Moss and other sites described in this article because they contain so few bubbles.
The whole subject of hydraulic conductivity of peat needs reconsideration following the demonstration (Pollack 2013) that a highly ordered fourth phase of water (extra to vapour, liquid, and solid) invests hydrophilic surfaces to a depth of about 0.5 mm, and has profoundly different properties to liquid water in bulk. ACKNOWLEDGMENTS I thank M. Johnson and J. Howe who made the corers; B.R. Giles, J. Campbell and P. Thomas for help in the field; P. Ratnesar for help in the laboratory; A.J. Baird, O.M. Bragg, A. Brown, D. Charman and P. Glaser for constructive comments on drafts of this article; landowners and managers for permission to visit the sites; and the Natural Environment Research Council (GR9/03558) for financial support.
REFERENCES Baird, A.J., Beckwith, C.W., Waldron. S. &
Waddington J.M. (2004) Ebullition of methane-containing gas bubbles from near-surface Sphagnum peat. Geophysical Research Letters, 31, #L21505; doi 10.1029/2004GL021157.
Baird, A.J. & Waldron, S. (2003) Shallow horizontal groundwater flow in peatlands is reduced by bacteriogenic gas production. Geophysical Research Letters, 30, #20; doi 10.1029/2003GL018233.
Beckwith, C.W. & Baird, A.J. (2001) Effect of biogenic gas bubbles on water flow through poorly decomposed blanket peat. Water Resources Research, 37, 551–558.
Brown, D.A. (1995) Carbon cycling in peat and the implications for the rehabilitation of bogs. In: Cox, M., Straker, V. & Taylor, D. (eds.) Wetlands Archaeology and Nature Conservation, HMSO, London, 99–107.
Brown, D.A. (1998) Gas production from an ombrotrophic bog effect of climate change on microbial ecology. Climatic Change, 40, 277–284.
Brown, A., Mathur, S.P. & Kushner, D.J. (1989) An ombrotrophic bog as a methane reservoir. Global Biogeochemical Cycles, 3, 205–213.
Buttler, A.J., H. Dinel, Levesque M. & Mathur. S.P. (1991) The relation between movement of subsurface water and gaseous methane in a basin bog with a novel instrument. Canadian Journal of Soil Science, 71, 427–438.
Chanton, J.P., Martens C.S. & Kelley, C.A. (1989) Gas transport from methane-saturated, tidal freshwater and wetland sediments. Limnology and Oceanography, 34, 807–819.
Charman, D.J., Aravena, R., Bryant, C.L. & Harkness, D.D. (1999) Carbon isotopes in peat, DOC, CO2 and CH4 in a Holocene peatland on Dartmoor, south west England, UK. Geology, 9, 539–542.
Charman, D.J., Aravena, R. & Warner, B.G. (1994) Carbon dynamics in a forested peatland in northeastern Ontario, Canada. Journal of Ecology, 82, 55–62.
conductivity and related physical properties of peat, Lost River peatland, northern Minnesota. Soil Science, 142, 91–99.
Clymo, R.S. (1970) The growth of Sphagnum: methods of measurement. Journal of Ecology, 58, 13–49.
Clymo, R.S. (1983) Peat. In: Gore, A.J.P. & Goodall, D.W. (eds.) Mires: Swamp, Bog, Fen and Moor, Ecosystems of the World, Vol. 4A, Elsevier, Amsterdam, 167.
Clymo, R.S. (2004) Hydraulic conductivity of peat at Ellergower Moss, Scotland. Hydrological Processes, 18, 261–274.
Clymo, R.S. (2014) Reporting Research: A Biologist’s Guide to Articles, Talks, and Posters. Cambridge University Press, Cambridge, 238–241.
Clymo, R.S. & Bryant, C.L. (2008) Diffusion and mass flow of dissolved carbon dioxide, methane, and dissolved organic carbon in a 7-m deep raised peat bog. Geochimica et Cosmochimica Acta, 72, 2048–2066; doi:10.1016/j.gca.2008.01.032.
Clymo, R.S. & Hayward P.M. (1982) The ecology of Sphagnum. In: Smith, A.J.E. (ed.) Bryophyte Ecology, Chapman and Hall, London and New York, 229–289.
Clymo, R.S. & Pearce D.M.E. (1995) Methane and carbon dioxide production in, transport thorough, and efflux from a peatland. Philosophical Transactions of the Royal Society of London A, 350, 249–259.
Clymo, R.S., Turunen J. & Tolonen, K. (1998) Carbon accumulation in peatland. Oikos, 81, 368–388.
Clymo, R.S. & Williams, M.M.R. (2012) Diffusion of gases dissolved in peat pore water. Mires and Peat, 10(6), 1–10.
Comas, X., Kettridge, N., Binley, A., Slater, L., Parsekian, A., Baird, A.J., Strack, M. & Waddington, M. (2014) The effect of peat structure on the spatial distribution of biogenic gases within bogs. Hydrological Processes, 28, 5483–5493; doi 10.1002/hyp.10056.
Comas, X. & Slater, L. (2005) Geophysical and hydrological evaluation of two bog complexes in a northern peatland: Implications for the distribution of biogenic gases at the basin scale. Global Biogeochemical Cycles, 19, #GB4023 1–10; doi 10.1029/2005GB002582.
Comas, X., Slater, L. & Reeve, A. (2005) Spatial variability in biogenic gas accumulations in peat soils is revealed by ground penetrating radar (GPR) 2005. Geophysical Research Letters, 32, L08401 1–4; doi 10.1029/2004GL022297.
Comas, X., Slater, L. & Reeve, A. (2007) In situ
monitoring of free-phase gas accumulation and release in peatlands using ground penetrating radar (GPR). Geophysical Research Letters, 34, #L06402 1–5; doi 10.1029/2006GL029014.
Comas, X., Slater, L. & Reeve, A. (2008) Seasonal geophysical monitoring of biogenic gases in a northern peatland: implications for temporal and spatial variability in free phase gas production rates. Journal of Geophysical Research, 113, #G01012 1-12; doi 10.1029/2007JG000575.
Comas, X., Slater, L. & Reeve, A. (2011) Atmospheric pressure drives changes in the vertical distribution of biogenic free-phase gas in a northern peatland. Journal of Geophysical Research, 116, #G04014 1–9; doi 10.1029/2011JG001701.
Dalton, J. (1805) Experimental enquiry into the properties of the several gases or elastic fluids contributing to the atmosphere. Memoirs of the Literary and Philosophical Society of Manchester, Series 2, 1, 244–258.
Daulat, W.E. & Clymo, R.S. (1998) Effects of temperature and watertable on the efflux of methane from peatland surface cores. Atmospheric Environment, 32, 3207–3218.
Digerfeldt, G. (1966) A new type of large-capacity sampler. Geologiska Föreningens i Stockholm Förhandligar, 87, 425–430.
Dinel, H., Mathur, S.P., Brown, A. & Lévesque M. (1988) A field study of the effect of depth on methane production in peatland waters: equipment and preliminary results. Journal of Ecology, 76, 1083–1091.
Faybishenko, B.A. (1995) Hydraulic behavior of quasi-saturated soils in the presence of entrapped air: Laboratory experiments. Water Resources Research, 31, 2421–2433.
Fechner-Levy, E.J. & Hemond, H.F. (1996) Trapped methane volume and potential effects on methane ebullition in a northern peatland. Limnology and Oceanography, 41, 1375–1383.
Glaser, P.H., Chanton, J.P., Morin, P., Rosenberry, D.O., Siegel, D.I., Ruud, O., Chasar, L.I. & Reeve, A.S. (2004) Surface deformations as indicators of deep ebullition fluxes in a large northern peatland. Global Biogeochemical Cycles, 18, 1–15; doi 10.1029/2003GB002069.
Gorham, E. (1991) Northern peatlands: role in the carbon cycle and probable responses to climatic warming. Ecological Applications, 1, 182–195.
Hayward, P.M. & Clymo, R.S. (1982) Profiles of water content and pore size in Sphagnum and peat, and their relation to peat bog ecology. Proceedings of the Royal Society of London B, 215, 299–325.
Houghton, J.T., Jenkins, G.J. & Ephraums, J.J. (eds.) (1990) Climate Change. The IPCC Scientific Assessment. Cambridge University Press, Cambridge, 410 pp.
Ingram, H.A.P. (1978) Soil layers in mires: function and terminology. Journal of Soil Science, 29, 224–227.
Ingram, H.A.P. (1982) Size and shape in raised mire ecosystems: a geophysical model. Nature (London), 297, 300–303.
Ingram, H.A.P. (1987) Ecohydrology of Scottish peatlands. Transactions of the Royal Society of Edinburgh: Earth Sciences, 78, 287–296.
Jamin, J.C. (1860) Mémoire sur l’équilibre et le mouvement des liquides dans les corps poreux (Note on the equilibrium and movement of liquids in porous bodies) Comptes Rendus Hebdomadaires des Séances de l'Académie des Sciences, 50, 172–176.
Kettridge, N. & Binley, A. (2008) X-ray computed tomography of peat soils: measuring gas content and peat structure. Hydrological Processes, 22, 4827–4837; doi 10.1002/hyp.7097.
Kettridge, N., Kellner, E., Price, J.S. & Waddington, J.M. (2013) Peat deformation and biogenic gas bubbles control seasonal variations in peat hydraulic conductivity. Hydrological Processes, 27, 3208–3216; doi 10.1002/hyp.9369.
Laing, C.G., Shreeve, T.G. & Pearce, D.M. (2008) Methane bubbles in surface peat cores: in situ measurements. Global Change Biology, 14, 1–9; doi 10.1111/j.1365-2486.2007.01534.x.
MacDonald, J.A., Fowler, D., Hargreaves, K.J., Skiba, U., Leith, I.D. & Murray, M.B. (1998) Methane emission rates from a northern wetland; response to temperature, water table and transport. Atmospheric Environment, 32, 3219–3227.
Mathur, S.P. & Levesque. M. (1985) Negative effect of depth on saturated hydraulic conductivity of histosols. Soil Science, 140, 462-466.
Monteith, J.L. (1973) Principles of Environmental Physics. Edward Arnold, London, 241 pp.
Orlob, G.T. & Radhakrishna, G.N. (1958) The effects of entrapped gases on the hydraulic characteristics of porous media. Transactions of the American Geophysical Union, 39, 648–659.
Parsekian, A.D., Comas, X, Slater, L. & Glaser, P.H. (2011) Geophysical evidence for the lateral distribution of free-phase gas at the peat basin scale in a large northern peatland. Journal of Geophysical Research, 116, #G03008 1–14; doi 10.1029/2010JG001543.
Parsekian, A.D., Slater, L., Comas, X. & Glaser, P.H. (2010) Variations in free-phase gases in peat landforms determined by ground-penetrating
radar. Journal of Geophysical Research, 115, G02002 1-13; doi 10.1029/2009JG001086.
Pollack, G.H. (2013) The Fourth Phase of Water: Beyond Solid, Liquid, and Vapor. Ebner & Sons, Seattle, USA, 357 pp.
Reeve, A.S., Glaser, P.H. & Rosenberry, D.O. (2013) Seasonal changes in peatland surface elevation recorded at GPS stations in the Red Lake Peatlands, northern Minnesota, USA. Journal of Geophysical Research Biogeosciences, 118, 1616–1626; doi 10.1002/2013JG002404.
Reynolds, W.D., Brown, D.A., Mathur, S.P. & Overend, R.P. (1992) Effect of in-situ gas accumulation on the hydraulic conductivity of peat. Soil Science, 153, 397–408.
Rigg, G.B., Thompson, T.G., Lorah, J.R. & Williams, K.T. (1927) Dissolved gases in waters of some Puget Sound bogs. Botanical Gazette, 84, 264–278.
Romanowicz, E.A., Siegel, D.I., Chanton, J.P. & Glaser, P.H. (1995) Temporal variations in dissolved methane deep in the Lake Agassiz Peatlands, Minnesota. Global Biogeochemical Cycles, 9, 197–212.
Rosenberry, D.O., Glaser, P.H. & Siegel, D.I. (2006) The hydrology of northern peatlands as affected by biogenic gas: current developments and rersearch needs. Hydrological Processes, 20, 3601–3610; doi 10.1002/hyp.6377.
Rosenberry, D.O., Glaser, P.H., Siegel, D.I. & Weeks, E.P. (2003) Use of hydraulic head to estimate gas content and ebullition flux in northern peatlands. Water Resources Research, 39, 1–10; doi 10.1029/2002WR001377.
Stamp, I, Baird A.J. & Heppell, C.M. (2013) The importance of ebulluition as a mechanism of methane (CH4) loss to the atmosphere in a northern peatland. Geophysical Research Letters, 40, 2087–2090; doi 10.1002/grl.50501.
Stocker, T.F., Qin, D, Plattner, G.-K., Tignor, M., Allen, S.K., Boschung, J, Nauels, A., Xia, Y., Bex, V. & Midgley, P.M. (eds.) (2013) Climate Change 2013: the Physical Science Basis. Contribution of Working Group I to the Fifth Assessment Report of the Intergovernmental Panel on Climate Change. Cambridge University Press, Cambridge, 1535 pp.
Strack, M., Kellner, E. & Waddington, J.M. (2005) Dynamics of biogenic gas bubbles in peat and their effects on peatland biogeochemistry. Global Biogeochemical Cycles, 19, #GB1003; doi 10.1029/2004GB002330.
Strack, M., Kellner, E. & Waddington, J.M. (2006) Effect of entrapped gas on peatland surface level fluctuations. Hydrological Processes, 20, 3611–
3622; doi 10.1002/hyp.6518. Strack, M. & Mierau, T. (2010) Evaluating spatial
variability of free-phase gas in peat using ground-penetrating radar and direct measurement. Journal of Geophysical Research, 115, #G02010 1–111; doi 10.1029/2009JG001045.
Strack, M. & Waddington, J.M. (2008) Spatiotemporal variability in peatland subsurface methane dynamics. Journal of Geophysical Research, 113, #G02010; doi 10.1029/JG000472.
Tokida, T., Miyazaki, M., Mizoguchi, M. & Seki, K. (2004) In situ accumulation of methane bubbles in a natural wetland soil. European Journal of Soil Science, 56, 389–396; doi 10.1111/j.1365-2389.2004.00674.x.
Walter, H. & Lieth, H. with Rehder, H. & Harnickell, E. (1975) Klimadiagramm-WeltAtlas.
Gustav Fischer, Jena, 253 pp. Williams, T.T. & Crawford, R.L. (1984) Methane
production in Minnesota peatlands. Applied and Environmental Microbiology, 47, 1266–1271.
Wyckoff, R.D. & Botset, H.G. (1936) The flow of gas-liquid mixtures through unconsolidated sands. Physics, 72, 325–345.
Wright, H.E.Jr. (1993) Core compression. Limnology and Oceanography, 38, 699–701.
Yu, Z., Loisel, J., Brosseau, D.P., Beilman, D.W. & Hunt, S.J. (2010) Global peatland dynamics since the Last Glacial Maximum. Geophysical Research Letters, 37, #L13402; doi 10.1029/2010GL043584.
Submitted 15 Dec 2014, revision 17 Jun 2015 Editor: Stephan Glatzel
_______________________________________________________________________________________ Author for correspondence: Professor R.S. Clymo, School of Biological and Chemical Sciences, Queen Mary University of London, London E1 4NS, UK. Email: [email protected] or [email protected].
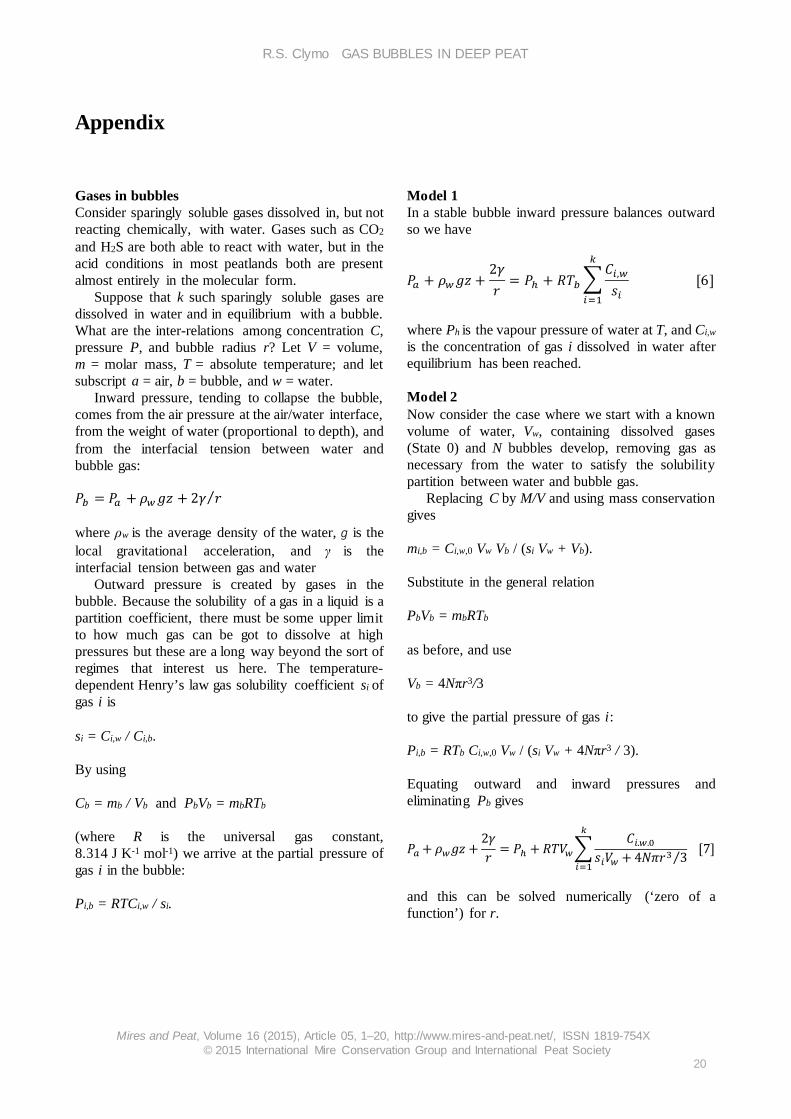
Appendix Gases in bubbles Consider sparingly soluble gases dissolved in, but not reacting chemically, with water. Gases such as CO2 and H2S are both able to react with water, but in the acid conditions in most peatlands both are present almost entirely in the molecular form.
Suppose that k such sparingly soluble gases are dissolved in water and in equilibrium with a bubble. What are the inter-relations among concentration C, pressure P, and bubble radius r? Let V = volume, m = molar mass, T = absolute temperature; and let subscript a = air, b = bubble, and w = water.
Inward pressure, tending to collapse the bubble, comes from the air pressure at the air/water interface, from the weight of water (proportional to depth), and from the interfacial tension between water and bubble gas: 𝑃𝑃𝑏𝑏 = 𝑃𝑃𝑎𝑎 + 𝜌𝜌𝑤𝑤𝑔𝑔𝑔𝑔 + 2𝛾𝛾 𝑟𝑟⁄ where ρw is the average density of the water, g is the local gravitational acceleration, and γ is the interfacial tension between gas and water
Outward pressure is created by gases in the bubble. Because the solubility of a gas in a liquid is a partition coefficient, there must be some upper limit to how much gas can be got to dissolve at high pressures but these are a long way beyond the sort of regimes that interest us here. The temperature-dependent Henry’s law gas solubility coefficient si of gas i is si = Ci,w / Ci,b. By using Cb = mb / Vb and PbVb = mbRTb (where R is the universal gas constant, 8.314 J K-1 mol-1) we arrive at the partial pressure of gas i in the bubble: Pi,b = RTCi,w / si.
Model 1 In a stable bubble inward pressure balances outward so we have
𝑃𝑃𝑎𝑎 + 𝜌𝜌𝑤𝑤𝑔𝑔𝑔𝑔 +2𝛾𝛾𝑟𝑟
= 𝑃𝑃ℎ + 𝑅𝑅𝑇𝑇𝑏𝑏�𝐶𝐶𝑖𝑖,𝑤𝑤𝑠𝑠𝑖𝑖
𝑘𝑘
𝑖𝑖=1
[6]
where Ph is the vapour pressure of water at T, and Ci,w is the concentration of gas i dissolved in water after equilibrium has been reached. Model 2 Now consider the case where we start with a known volume of water, Vw, containing dissolved gases (State 0) and N bubbles develop, removing gas as necessary from the water to satisfy the solubility partition between water and bubble gas.
Replacing C by M/V and using mass conservation gives mi,b = Ci,w,0 Vw Vb / (si Vw + Vb). Substitute in the general relation PbVb = mbRTb as before, and use Vb = 4Nπr3/3 to give the partial pressure of gas i: Pi,b = RTb Ci,w,0 Vw / (si Vw + 4Nπr3 / 3). Equating outward and inward pressures and eliminating Pb gives
𝑃𝑃𝑎𝑎 + 𝜌𝜌𝑤𝑤𝑔𝑔𝑔𝑔 +2𝛾𝛾𝑟𝑟 = 𝑃𝑃ℎ + 𝑅𝑅𝑇𝑇𝑉𝑉𝑤𝑤�
𝐶𝐶𝑖𝑖.𝑤𝑤.0𝑠𝑠𝑖𝑖𝑉𝑉𝑤𝑤 + 4𝑁𝑁𝑁𝑁𝑟𝑟3 3⁄
𝑘𝑘
𝑖𝑖=1
[7]
and this can be solved numerically (‘zero of a function’) for r.