Working papers are in draft form. This working paper is distributed for purposes of comment and discussion only. It may not be reproduced without permission of the copyright holder. Copies of working papers are available from the author.
Why do countries adopt International Financial Reporting Standards? Karthik Ramanna Ewa Sletten
Working Paper
09-102
Why do countries adopt International Financial Reporting Standards?*
This draft: March 24, 2009 Original Draft: January 5, 2009
Abstract In a sample of 102 non-European Union countries, we study variations in the decision to adopt International Financial Reporting Standards (IFRS). There is evidence that more powerful countries are less likely to adopt IFRS, consistent with more powerful countries being less willing to surrender standard-setting authority to an international body. There is also evidence that the likelihood of IFRS adoption at first increases and then decreases in the quality of countries’ domestic governance institutions, consistent with IFRS being adopted when governments are capable of timely decision making and when the opportunity and switching cost of domestic standards are relatively low. We do not find evidence that levels of and expected changes in foreign trade and investment flows in a country affect its adoption decision: thus, we cannot confirm that IFRS lowers information costs in more globalized economies. Consistent with the presence of network effects in IFRS adoption, we find that a country is more likely to adopt IFRS if its trade partners or countries within in its geographical region are IFRS adopters.
* We thank John Core, David Hawkins, Paul Healy, S.P. Kothari, Edward Riedl, Douglas Skinner, Suraj Srinivasan, Rodrigo Verdi, Ross Watts, Joseph Weber, and seminar participants at Boston University, University of Colorado at Boulder, and Harvard University for helpful comments; Beiting Cheng for research assistance; and Harvard University and the Massachusetts Institute of Technology for financial support. Any errors are our responsibility.
1
1. Introduction
The International Accounting Standards Board (IASB) was established in 2001 to
develop International Financial Reporting Standards (IFRS). A year later, European Union (EU)
member states committed to requiring IFRS for all listed corporations in their jurisdictions
effective year 2005 (EC, 2002). The first IFRS was issued in 2003, by which time at least 19
countries required compliance with the international standards. Since then, nearly 70 countries
(including EU countries) have mandated IFRS for all listed companies. Further, about 23
countries have either mandated IFRS for some listed companies or allow listed companies to
voluntarily adopt IFRS. However, as of 2007, at least 40 countries continue to require
domestically developed accounting standards over IFRS, and this list includes some large
economies like Brazil, Canada, China, Japan, India, and the US.1 We investigate why there is
heterogeneity in countries’ decisions to adopt IFRS; in other words, why some countries adopt
IFRS while others do not. Understanding countries’ adoption decisions can provide insights into
the benefits and costs of IFRS adoption.
We focus our analysis on a sample of 102 non-EU countries and examine IFRS adoption
over the period 2002 through 2007.2 We exclude the EU member states from our tests because
their decision to adopt IFRS was closely tied to the establishment of the IASB itself (EC, 2000).
Moreover, the EU member states committed jointly to adopting IFRS (EC, 2002) making an
analysis of their individual adoption decisions infeasible.
We use the economic theory of networks to develop our hypotheses: adopting a set of
standards like IFRS can be more appealing to a country if other countries have adopted it as well
(in this sense, IFRS can be a product with “network effects”). In other words, countries do not
adopt IFRS all at once, and the observed inter-temporal increase in IFRS adoption across
countries can be due to the growing value of the IFRS “network.” We focus our analysis of
network effects at the regional and trade levels. Accordingly, we test whether the likelihood of
1 Several of these countries have committed to adopting (“converging with”) IFRS at some future date. For the purpose of our analyses, we do not consider a country to have adopted IFRS until listed companies in its jurisdiction are in fact required to report under IFRS. For example, in 2004, Albania committed itself to requiring IFRS effective January 1, 2006; the adoption date was subsequently moved to January 1, 2008. 2 We begin our analysis in 2002 because this was the first full year of the IASB’s existence. In Section 2, we discuss some institutional reasons for excluding the international accounting standards that preceded the IASB. We restrict our sample to year 2007 because the macroeconomic data required for our analyses were not available for years beyond 2007 at the initiation of this study.
2
IFRS adoption for a given country in a given year increases with the number of IFRS adopters in
its geographical region and with IFRS adoption among its trade partners.
Economic network theory predicts that in addition to network benefits (synchronization
value), a product with network effects can be adopted due to its direct benefits (autarky value)
(Katz and Shapiro, 1985; Liebowitz and Margolis, 1994). In the case of the IFRS adoption
decision by a country, we argue the direct benefits are represented by both the net economic and
net political value of IFRS over local standards.
The net economic value of IFRS is intended to capture direct pecuniary benefits as they
are usually conceived in economic models of networks. Proponents of IFRS argue that the
standards reduce information costs to an economy, particularly as capital flows and trade become
more globalized: it is cheaper for capital market participants to become familiar with one set of
global standards than with several local standards (Leuz, 2003; Barth, 2008). Accordingly, we
test whether economies with high levels of or expected increases in foreign investment and trade
are more likely to adopt IFRS.3 The benefits from adopting IFRS, however, are likely to diminish
with the relative quality of local governance institutions, including the quality of local GAAP
(high quality institutions present higher opportunity and switching costs to adopting IFRS). Thus,
we also examine whether the likelihood of IFRS adoption decreases with the quality of domestic
governance institutions.
The net political value of IFRS is the benefit arising from the potential political nature of
international accounting standard setting: if IFRS standard setting can be influenced by political
lobbying, more powerful countries are more likely to be able to shape IFRS.4 The prevailing
position of the EU in IFRS standard setting, however, can override this argument. If countries
expect the EU to have a dominant role in IASB affairs (Brackney and Witmer, 2005), they are
likely to have to cede some authority over standard setting to EU interests. Ceding authority over
local standards is, in turn, likely to be less palatable to more powerful countries, which leads to
the prediction that more powerful countries are less likely to embrace IFRS. In addition to
standard-setting power, cultural sensitivities can also affect the net political value of IFRS to a
country. If the IASB is perceived as a European institution, countries that are culturally more
3 Adopting IFRS to lower information costs is conceptually distinct from adopting IFRS due to its “network benefits.” Please see Section 2 for details. 4 Powerful countries can influence IFRS by directly lobbying the IASB; alternately, their influence can be more indirect if the IASB implicitly caters to their interests when developing IFRS.
3
distant from Europe are likely to be less accepting of IFRS (Ding et al., 2005; Ciesielski, 2007;
and Norris, 2007). Thus, we also test whether cultural differences can explain cross-sectional
variation in IFRS adoption.
In addition to the macro-level economic and political factors discussed earlier, it is likely
that a country’s decision to adopt IFRS is influenced by its internal politics: e.g., the actions of
special-interest lobbyists and ideology-driven regulators. It is difficult to specify the nature of
such within-country politics in a large sample of countries, let alone measure it with a reasonable
degree of accuracy: only in more transparent societies like the United States is such an exercise
possible. To the extent that the effects of internal politics on IFRS adoption are systematically
associated to those of the macro-level determinants we study, the associations documented in our
empirical tests can have alternate interpretations. However, we are not aware of any theory that
predicts such a systematic association.
On network effects, the data reveal evidence of regional trends in IFRS adoption, i.e., a
country is more likely to implement IFRS if other countries in its geographical region are IFRS
adopters. We also find evidence that a country is more likely to adopt IFRS if its trade partners
are IFRS adopters. The result is significant for at least two reasons: (1) it suggests countries
internalize the network effects of IFRS in their adoption decisions; and (2) it suggests that as the
network benefits from IFRS get large, countries may adopt the international standards even if the
direct benefits from such standards are inferior to those from locally developed standards.
On economic determinants of IFRS adoption, we find no evidence that the level of and
expected changes in foreign investment and trade affect the likelihood of adoption. Thus, we
cannot confirm that IFRS lowers information costs in more globalized economies. We do find,
however, evidence that the likelihood of IFRS adoption at first increases and then decreases in
the quality of countries’ domestic governance institutions. That quality is measured using a
factor that extracts common variation from a set of proxies measuring the process and output of
countries’ governance systems (including, an economic democracy index and citizen wealth).
The result on governance quality can be interpreted as consistent with both the most poorly
governed countries being less responsive to international standards, and all other countries
conditioning their IFRS adoption decisions on the opportunity and switching costs of domestic
governance standards.
4
There is also evidence that political considerations affect IFRS adoption decisions. We
find that more powerful countries are less likely to adopt IFRS, consistent with more powerful
countries being less willing to surrender standard-setting authority to the IASB. Country-level
power is measured as the first principal component of a set of proxies for countries’ abilities to
influence international decision making (including their size and popularity within the United
Nations). In contrast to the results on power, we do not find evidence of countries’ cultural
closeness to the EU influencing their IFRS adoption decisions, where more Christian countries
and countries with long-settled colonial relations with EU powers are considered culturally
closer to the region.
Academic theories yield mixed predictions on whether the adoption of IFRS is beneficial
to a country. Some scholars have argued that international harmonization in accounting can
improve capital-market efficiency: a common set of international accounting standards can
reduce the information processing and auditing costs to market participants (Barth, 2007; 2008).
Other academics argue that accounting standards evolve in the context of domestic cultural,
legal, and other institutional features (including auditing): international harmonization in
accounting, if it is not accompanied by changes to related capital market institutions, can be
costly (Ball et al., 2000; Ball et al., 2003; Ball, 2006).5 Our analysis of the cross-sectional
variation in country-level IFRS adoption decisions suggests there is evidence consistent with
both sets of arguments. The evidence of a higher IFRS adoption rate among countries with
moderate governance standards is consistent with IFRS being adopted for reasons that can be
beneficial to a country. At the same time, the evidence that the best governed and most powerful
non-EU countries were, as of 2007, less likely to adopt IFRS, suggests that several countries still
perceived IFRS as being costly.
The existing empirical literature on IFRS has focused largely on the determinants and
consequences of IFRS adoption at the firm level.6 The firm-level studies are conditional on
countries’ decisions to allow or mandate IFRS, suggesting that studies of IFRS adoption at the
country-level can complement firm-level studies. A study by Hope et al. (2006) provides some
preliminary evidence on country-level IFRS adoptions through 2005 in a sample of 38 countries
(including 14 EU countries). Their evidence suggests countries with weaker investor protection
5 Leuz and Wysocki (2008) provide a comprehensive survey of the literature on accounting harmonization. 6 Examples include Armstrong et al. (2008), Barth et al. (2008), Christensen et al. (2008), and Daske et al. (2008).
5
and more easily accessible financial markets are more likely to adopt IFRS. We expand the
country-level analysis to a more comprehensive sample of 102 non-EU countries, and develop
and test a number of new factors that can affect IFRS adoption, including political power,
opportunity and switching costs, and network effects. The inclusion of network effects is
particularly useful in that it augments hypotheses on cross-sectional variation in IFRS adoption
with an explanation for the observed inter-temporal increase in IFRS adoption across countries.
We caution against a broad interpretation of the results in this paper in the context of any
ongoing policy debate on IFRS adoption. There are two reasons for this caveat and they are
outlined more thoroughly in the conclusion. In brief, the caveat is associated with: (1) concerns
over “modifications” to IFRS at the country level (countries claim to have adopted IFRS, but in
practice adopt the standards with restrictions); and (2) the likely increasing importance of
network benefits (over direct economic and political factors) in determining IFRS adoption as
more countries adopt the international standards.
The rest of this paper is organized as follows. Starting from the economic theory of
networks, section two develops hypotheses on why countries choose to adopt IFRS. Section
three describes our data and develops proxies for the IFRS-adoption determinants discussed in
section two. Section four provides descriptive statistics and univariate evidence on the
determinants of IFRS adoption. Section five develops multivariate regression-based models for
country-level IFRS adoption and presents results of the multivariate tests. Section six concludes.
2. Theory and hypothesis development
2.1. The economic theory of networks
The decision to adopt IFRS can be analyzed as a decision to adopt a product with
network effects. To see this, note that a standard like IFRS is likely to be more appealing to a
country if other countries choose to adopt it as well. This suggests we can use insights from the
economic theory of networks to develop hypotheses on why countries choose to adopt IFRS.
Network theory suggests that there are generally two factors to consider in adopting
network-dependent products: the intrinsic value of the product and the value of the product’s
network (Katz and Shapiro, 1985). To illustrate, consider a decision to buy a Mac computer
(Liebowitz and Margolis, 1998). The value to a user from buying a Mac can be analyzed as:
6
1. The direct value from using the Mac: this can include the computer’s processing speed,
memory, graphical card, user friendliness, etc.
2. The value from other people using Macs: this can include value derived from being able to
easily share files, obtaining technical service, using a product that is popular with one’s
peers, etc.
The direct value is sometimes referred to in the literature as the autarky value of the
product, while the network-related value is called the synchronization value (Liebowitz and
Margolis, 1996). The existence of the synchronization value of a product suggests that the
product can be adopted even if its autarky value is inferior to that of a substitute product (some
frustrated Windows users can testify to this). The synchronization value of a product is also
known as the value from network effects.
The economics literature on networks also makes the distinction between direct and
indirect network effects (Katz and Shapiro, 1985). Direct network effects are what we will refer
to as synchronization value in this paper. It refers to network effects that are endogenous to the
product. In the case of Mac computers, an example of direct network effects is the value derived
from being able to easily share files as the number of Mac users grows. Indirect network effects
refer to the value derived from having lower prices on complementary goods as the number of
adopters of a network-dependent product increases. An example of indirect network effects in
the case of buying a Mac is the value derived from having lower prices on application software
for Macs as the number of Mac users increases. Liebowitz and Margolis (1994) argue from
earlier theoretical work (e.g., Knight, 1924) that indirect network effects are truly pecuniary in
nature and so should not be internalized in the consideration of synchronization value.
A final distinction to make in discussing the economic theory of networks is that between
network effects and network externalities (Liebowitz and Margolis, 1994). Network externalities
arise when direct network effects are not internalized in the decision to buy a network-dependent
product. In the Mac example, this would result if a user purchased a Mac computer solely for its
autarky value, only to later discover the added benefits from having easy file-sharing capabilities
due to the high rate of Mac adoption among her friends.
2.2. Applying the economic theory of networks to country-level IFRS adoption
7
If IFRS is considered a network-dependent product, then a country’s decision to adopt
IFRS can be viewed through the lens of autarky and synchronization values. The autarky value
of IFRS is the direct value to the adopting country from using the IASB-developed accounting
standards. The synchronization value is the value derived from adopting a body of accounting
standards that is widely used by other countries.
Given the network framework, a country’s decision to adopt IFRS can be expressed as
follows.
Adopt IFRS if and only if:
Autarky Value of IFRS + Synchronization Value of IFRS
> Value of Local GAAP … (1)
In our analysis of the autarky value of IFRS, we classify the potential direct benefit as
arising from economic and political factors. The economic determinants of autarky value are
intended to capture direct pecuniary benefits as they are usually conceived in economic models
of networks. The political determinants are included to test whether adopters consider the
benefits arising from the potentially political nature of international accounting standard setting.
Just as the autarky value of IFRS can be classified into economic and political benefits,
the value of local GAAP can be so classified. The economic value of local GAAP refers
explicitly to the ability of extant accounting standards to facilitate the efficient allocation of
capital in an economy. The political value of local GAAP refers to political benefits from having
local authority over standard setting. Grouping together the economic (political) benefits of IFRS
with the economic (political) benefits of local GAAP, we can rewrite equation (1) as follows.
Adopt IFRS if and only if:
Net Economic Value of IFRS + Net Political Value of IFRS + Synchronization Value of IFRS
> 0 … (2)
We discuss the terms in equation (2) in greater detail in Section 2.3. The inclusion of
political determinants in the equation above is distinct to our setting. In all theoretical models of
network-dependent products we are aware of, the product is usually a consumer good where
8
political lobbying for product specification is unlikely to be a major issue. For example, in the
earlier case of a user’s decision to buy a Mac, the political determinants of autarky would capture
the potential benefit to a user from being able to lobby for future features on Macs. Unless the
user is a consumer with substantial market power (e.g., the federal government), such political
benefits are unlikely to be of concern.
In the context of equation (2) and our earlier discussion on network theory, it is useful to
note the following two points. First, a country can adopt IFRS even if the economic benefits
from such standards are inferior to those from locally developed GAAP. Second, evidence that
synchronization-value proxies explain the IFRS adoption decision is consistent with countries
internalizing the network effects of IFRS (i.e., network-effects in IFRS adoption are not network
externalities). Both points above have implications for whether IFRS is being adopted for its
innate quality or for potential network effects.
2.3. Why do countries adopt IFRS?
In this sub-section, we develop the arguments for and against IFRS adoption in the
context of the framework in equation (2). Our analysis focuses on IFRS as developed and
sponsored by the IASB starting 2002, and specifically excludes International Accounting
Standards promulgated by the IASB’s predecessor, the International Accounting Standards
Committee (IASC). This is because there is evidence to suggest that IASC standards are
culturally quite different from IFRS. In particular, while the IASB’s standards are influenced by
Pan-European accounting traditions (as discussed shortly), the IASC’s work was perceived as
more Anglo-centric. The IASC was established in 1973, the year the UK joined the European
Community. Benston et al. (2006, p. 229) argue that by this time, existing European Community
countries had made significant progress towards accounting harmonization, and the IASC was
created to help the UK have a voice in future cross-country standardization.
As noted in the introduction, we develop our hypotheses around the IFRS adoption
decisions of non-EU countries. We exclude the EU member states from our tests because their
decision to adopt IFRS was closely tied to the establishment of the IASB itself (EC, 2000).7
7 Camfferman and Zeff (2007, p. 431) describe the European Commission’s approval of the reorganization of the IASC into the IASB: they quote the Commission as saying that the reorganization was “a vote of confidence” (IASC, 2000, p. 9) and “driven by a clear determination to make [international accounting standards] of the highest quality (EC, 2000, ¶ 9).”
9
Moreover, the EU member states committed jointly to adopting IFRS (EC, 2002) making an
analysis of their individual adoption decisions infeasible. Finally, there is evidence that the
development of institutions and practices of the IASB are made in consultation with the EU.8 In
subsequent univariate tests, we provide evidence on the differences between EU countries and
the rest of our sample along adoption determinants identified below.
2.3.1. Net economic value of IFRS
We describe the net economic value of IFRS to a country as arising out of two factors:
(1) the value from having a shared body of accounting standards; and (2) the relative quality of
local governance institutions. We discuss these two factors in greater detail below.
The value from having a shared body of accounting standards: IFRS are developed
specifically for wide international use. Proponents of IFRS argue that by adopting a common
body of international standards, countries can expect to lower the cost of information
processing and auditing to capital market participants (Barth, 2007; 2008). More preparers,
users, and auditors of financial reports can be expected to become familiar with one common
set of international accounting standards than with various local accounting standards.
If the adoption of IFRS is expected to lower information costs to capital markets, we
expect countries more dependent on foreign capital and trade to value these economic
benefits more. Absent international accounting standards, foreign investors must incur costs
of becoming familiar with domestic accounting practices. These costs are likely to be passed
on (at least in part) to the investment-destination country. If adopting IFRS is expected to
lower such costs, then we can expect countries that are dependent on foreign capital to do so.
Similarly, countries where foreign trade is an important part of the economy can be expected
to adopt IFRS. Related to the point above, it can be argued that countries choose to adopt
IFRS when they expect to increase the share of foreign capital and trade in their economy:
expected foreign involvement in an economy can make current adoption of international
8 For example, the IASB, in the wake of declining financial markets in 2008, allowed financial institutions to opt for a one-time reclassification of available-for-sale and trading securities as held-to-maturity (HTM). With the HTM classification, financial institutions could reduce the amount of impairment loss to be recognized (by arguing that not all of the extant decline in the market value of a security would be realized at maturity). It has been suggested in the financial press that the IASB made this decision in response to pressure from the EU (e.g., Leone, 2008).
10
standards more attractive. In this sense, even countries with low levels of foreign capital and
trade can choose to adopt IFRS if they are expecting growth in those factors.
Adopting IFRS to lower information costs is conceptually distinct from adopting IFRS
due to its “network benefits.” Conceptually, “network benefits” refer to idea that IFRS
becomes more appealing as more countries adopt it (see Section 2.3.3); whereas adopting
IFRS to lower information costs refer to the standards’ potential “platform benefits.”9
The relative quality of local governance institutions: We expect the relative quality of local
accounting standards to be an important determinant in the decision to adopt IFRS. Local
accounting standards are part of a complex system of governance institutions that include
auditor training, auditing standards, enforcement (regulatory and judicial), precedent for the
protection of property rights, government corruption, and the role of the press, among others
(e.g., Ball et al., 2000; Leuz et al., 2003; Watts, 2003; and Ball, 2006). Thus, in studying the
IFRS adoption decision, we consider jointly the relative quality of local accounting standards
and that of associated governance institutions. Adopting IFRS can be costly if these
institutions are collectively not compatible with the international standards. The relative
quality of extant governance institutions refers to the ability of these institutions to facilitate
the efficient allocation of capital in an economy.
In countries where the quality of extant governance institutions is relatively high, IFRS
adoption is likely to be less attractive. High quality institutions represent high opportunity
and switching costs to adopting international accounting standards. The opportunity costs
arise because in adopting IFRS, countries forgo the benefits of any past and potential future
innovations in local reporting standards specific to their economies. IFRS, by definition, are
the result of an international political economy equilibrium, and thus cannot be expected to
provide reporting standards that are uniquely suited to any given country’s circumstances
(Leuz and Wysocki, 2008). The switching costs arise because countries with well developed
governance institutions are likely to have well developed capital markets, and thus more
market participants needing retraining in IFRS. 9 To see the distinction between platform and network benefits of IFRS, consider in parallel the case of buying a Mac. The platform benefit of a Mac is determined by one’s demand for computing power, while the Mac’s network benefit refers to the value perceived from others using Macs. Similarly, the platform benefit of IFRS is determined by a country’s demand for internationally harmonized accounting (proxied for by levels of and changes in foreign trade and investment), while the network benefit of IFRS refers to the value perceived from others using IFRS.
11
For countries where local governance institutions are not well developed, the prediction
on IFRS adoption is more nuanced. On one hand, opportunity and switching costs in these
countries are lower, so the chance to adopt an externally developed body of accounting
standards presents an advantage. On the other hand, such countries are likely to suffer from
corrupt, slow-moving, or ineffectual governments that are resistant to or incapable of change
(La Porta et al., 1999). At the extreme, countries with weak institutions are failed states,
where the adoption of IFRS is unlikely to be of any interest or consequence (e.g., Taliban-
ruled Afghanistan or Somalia). Thus, among countries with less developed institutions, the
decision to adopt IFRS is likely to be driven by lower opportunity and switching costs only if
such countries are in fact capable and willing to make cost-benefit tradeoffs.
2.3.2. Net political value of IFRS
The adoption of IFRS by a country also involves trading off the potential gain from being
able to influence international standard setting against the value lost from surrendering local
authority over accounting standards. We describe the tradeoffs between these benefits and costs
as constituting the net political value of IFRS to a country. We classify the net political value as
arising from two factors: (1) international power politics; and (2) culture politics.
International power politics: Ceteris paribus, we would expect more powerful countries to
have a larger positive political value since more powerful countries are more likely to be able
to influence the nature of international standards. The influence of powerful countries can be
the result of explicit lobbying and pressure tactics or the result of the IASB implicitly
catering to powerful interests when developing standards.
The dominant position of the EU in IFRS standard setting presents, however, an
important constraint that is likely to alter the prediction above. As noted earlier, the
development of IFRS is strongly linked to support from the EU. The IASB is physically
situated within the EU, and to date, the EU remains the IASB’s largest sponsor (IASB,
2008a). If a country chooses to adopt IFRS, it must either engage in the political process to
try to shape the nature of the international standards, or cede the standard setting role to other
political players. It is unlikely that more powerful countries will adopt the latter route;
however, if they choose to engage in the political process, they will likely have to enter into
12
costly political wrangling with the EU. Faced with this choice, it is reasonable to expect that
more powerful countries are less likely to adopt IFRS.10 On the other hand, for less powerful
countries, there is little political face lost in adopting EU-centric standards. Thus, ceteris
paribus, we can predict that less powerful countries are more likely to adopt IFRS.
Culture politics: In addition to country-level power politics, the perception of IFRS as a
European institution is likely to affect the international standards’ acceptance in a country
(Ding et al., 2005; Ciesielski, 2007; Norris, 2007). In countries that are culturally more
accepting of European institutions, international accounting standards can be more politically
feasible. In countries where European institutions are non-native, adoption of IFRS can be
viewed as abrogating authority to a European standard-setter. Thus, ceteris paribus, we
predict countries that are culturally closer to Europe are more likely to adopt IFRS.
2.3.3. Synchronization value of IFRS
The synchronization value of IFRS refers to the key idea in network theory: that a
network-dependent product becomes more appealing as more countries adopt it. In testing for
network benefits, we test for the effects of regional trends in IFRS adoption. We define regions
around continental and sub-continental geographies (Appendix A). If countries within a region
are influenced by each others’ actions, we can expect the likelihood of IFRS adoption for a given
country to increase as the number of IFRS adopters in that region increases. As an additional test
of network benefits, we examine whether the likelihood of IFRS adoption for a given country
increases in the proportion of its trade partners that are IFRS adopters.11
3. Data and proxies
3.1. Developing the dataset
In this sub-section, we describe the construction of our database of non-EU countries and
their IFRS adoption status. Our data selection procedures are aimed at generating the widest
10 The United States is a likely exception to this rule. Benston et al. (2006, p. 230) argue that the IASB has since its founding been actively involved in courting the SEC’s approval of its standards. 11 We use trade in general to proxy for the platform benefits of IFRS, and trade with IFRS adopters to proxy for the standards’ network benefits. For a country, the platform benefits of IFRS are determined by its demand for international standardization in general, while the network benefit of IFRS refers to the value perceived from others using IFRS in particular.
13
possible coverage of countries and their adoption status given data requirements for dependent
and independent variables. Our dependent variables are the IFRS adoption decision and, where
appropriate, the year of adoption. These data are collected from numerous sources including,
Deloitte’s IASplus.com website, correspondence with country managing partners of big-4 audit
firms, web searches of newswire archives, and World Bank country reports. Our independent
variables are the proxies for the various IFRS adoption determinants described in the previous
section. The proxies are described in the following sub-section.
To construct our database of non-EU countries and their IFRS adoption status, we start
with Deloitte’s IASplus.com website (accessed July 3, 2008). The website lists IFRS adoption
information for 162 legal jurisdictions. Since we are interested in the financial reporting
requirements for listed companies in various countries, we first exclude IASplus.com
jurisdictions that do not have stock exchanges (15 jurisdictions). Next, we exclude the 30
IASplus.com jurisdictions that compose the member states of the EU/ European Economic Area
(EEA). Our reasons for excluding EU countries are discussed earlier. We exclude EEA member
states since they adopted IFRS in conjunction with the EU (EC, 2008). Finally, we also exclude
those IASplus.com jurisdictions for which the World Bank does not report gross domestic
product (GDP) data (15 jurisdictions) in 2001. The World Bank’s World Development Indicators
(WDI) database is our source for GDP data.
The data selection procedure described above yields a final sample of 102 countries. The
countries are listed in Appendix A. As discussed, we obtain the IFRS adoption decision from
Deloitte’s IASplus.com website. This website does not, however, report the year of IFRS
adoption. To obtain adoption-year data, we rely on three different methods: correspondence with
country managing partners of big-4 audit firms, web searches of newswire archives, and World
Bank country reports. For every country listed as having adopted IFRS on IASplus.com, we
contact the country managing partner of a big 4 audit firm with an office in that country
requesting data on the date of IFRS adoption. Additionally, we conduct electronic searches of
newswire archives for press articles describing a country’s adoption of IFRS. Finally, we
reference the World Bank’s country reports on observance of standards and codes: these reports
occasionally detail IFRS adoption dates.
The three auxiliary sources described above jointly yield adoption-year data for every
country listed by IASplus.com as having adopted IFRS. In a few cases, data from a country
14
managing partner of a big 4 audit firm or data from the World Bank country reports disagree
with the IASplus.com data on the country’s adoption status itself. For example, Egypt and Peru
were listed on IASplus.com as requiring IFRS for all listed companies, but at least one (non
Deloitte) big 4 audit partner in each country disagreed: the partners argued that IFRS was not
permitted in those countries. In these circumstances, we err in favor of the big 4 audit partner/
World Bank country report. The disagreement between even big 4 audit firms on the nature of
IFRS adoption in some countries suggests that even if a country is formally listed as having
adopted IFRS, the adoption may be a token gesture. This is an important caveat to our analysis.12
The earliest possible year of adoption in our sample is 2002 (the first year after the
formation of the IASB). Since macroeconomic data that compose our independent variables are
not available for years beyond 2007, we censor adoption information in 2007. In other words, we
record the IFRS adoption status and the year of adoption (if applicable) between the years 2002
and 2007. Even if a country has adopted IFRS since 2007, they are classified as non-adopters for
the purposes of our empirical tests. There are four such countries in our sample effective July 3,
2008. If the determinants of IFRS are dynamic, then our results are only valid in sample. Thus,
the results, in the context of any ongoing policy debate, should be interpreted with caution.
Country-level adoption decisions on the IASplus.com website are categorized into four
groups: IFRS required for listed companies; IFRS required for some listed companies; IFRS
permitted for listed companies; and IFRS not permitted for listed companies. For the purposes of
our empirical analyses, we reclassify these four categories into three: adopters; partial adopters;
and non-adopters. The “adopters” in our dataset are those classified by IASplus.com as having
“IFRS required for listed companies.” The “non-adopters” are those classified as having “IFRS
not permitted for listed companies.” The “partial adopters” in our dataset are a combination of
the second and third IASplus.com categories. We combine these two categories into “partial
adopters” since only four countries in our sample of 102 can be classified as having “IFRS
required for some listed companies.”
3.2. Developing proxies for the IFRS-adoption determinants
In this sub-section, we describe our proxies for the determinants of IFRS adoption
identified in Section 2.3. The data for these proxies are collected from numerous data sources
12 Reassuringly, the IASB itself relies on IASplus.com as a data source (IASB, 2008a, b).
15
including, the World Bank’s WDI database, Andrei Shleifer’s website at Harvard University,13
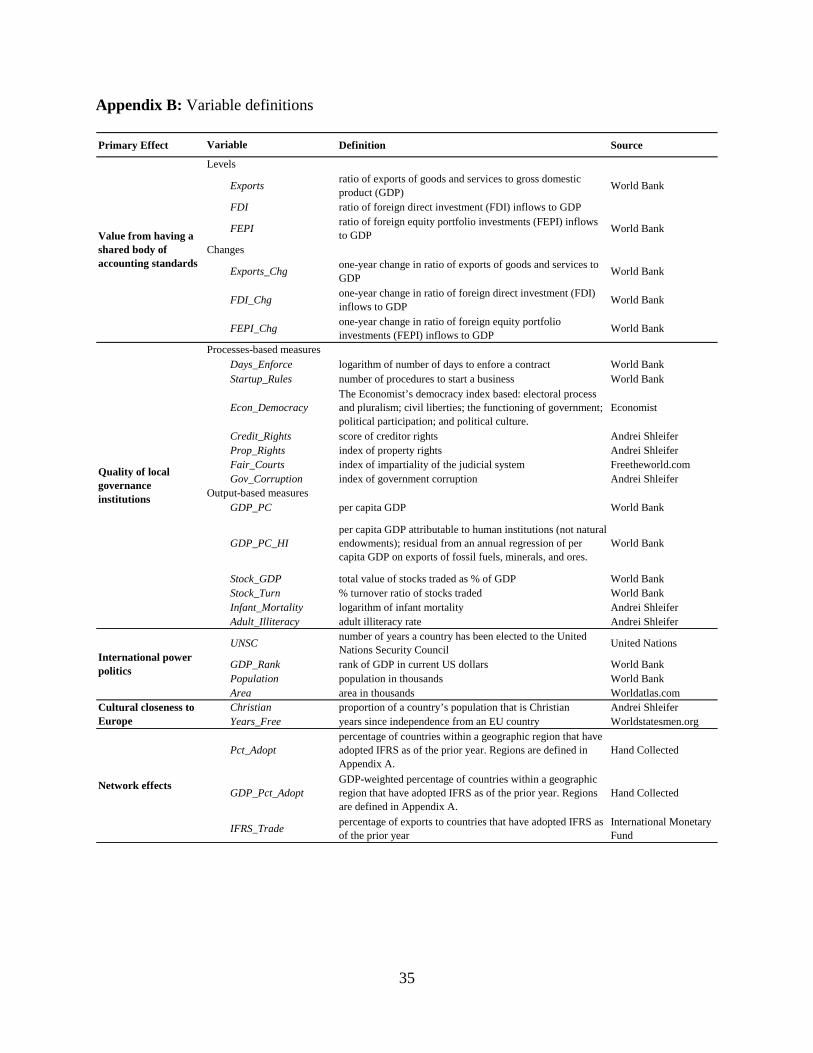
the Economist magazine’s data archives, and the United Nations website. Appendix B provides a
detailed list of all proxies, definitions, and original sources.
Value from having a shared body of accounting standards: In Section 2.3.1, we argue that
countries where the level and expected growth in foreign capital and trade are higher are
more likely to value the economic benefits that can accrue from adopting IFRS. Our proxies
for the level of foreign capital are the ratio of net foreign direct investment inflows to GDP
(FDI) and the ratio of foreign equity portfolio investments to GDP (FEPI). Data to compute
FDI and FEPI are obtained from the WDI database. We collect values for these variables for
all years from 2001 through 2006. The independent variables lag the dependent variables by
one year since contemporaneous macroeconomic data are unlikely to be available when a
country is considering IFRS adoption. Our proxies for expected growth in foreign capital are
realized growths in FDI and FEPI over the relevant prior one-year period (FDI_Chg and
FEPI_Chg). We measure the level of and expected growth in foreign trade as the ratio of
exports of goods and services to GDP (Exports) and the one-year change in exports-to-GDP
(Exports_Chg), respectively. As with foreign investments, data on exports are collected from
the WDI database for the period 2001 through 2006 period.
Quality of local governance institutions: Obtaining good proxies for the quality of local
governance institutions is particularly difficult for at least two reasons. First, the governance
institutions in a country are likely to be influenced by its natural endowment and endogenous
to its other human institutions: thus, a governance system that is “good” (high quality) for
one economy can be ineffective in others. A cross-country metric of governance institution
quality must account for this potential variation in governance institutions. Second, data to
construct detailed cross-country metrics are limited to a few, mostly large economies. For
example, McKinsey & Company puts out the results of an annual CEO survey of governance
factors like the quality of auditing and accounting, but these data are only available for about
25 non-EU countries.
13 http://www.economics.harvard.edu/faculty/shleifer/dataset; accessed July 3, 2008.
16
In obtaining proxies for the quality of local governance institutions, we consider both
process-based and output-based measures. Process-based measures like governance indices
are popular in the literature. The problem with these measures, as alluded to earlier, is that
different processes are likely to be optimal for different economies, depending on their
natural endowments and other human institutions. Output-based measures like GDP are
appealing because notwithstanding the process, if the objective of all governance institutions
is economic development, outputs are a reliable indicator of the quality of those institutions.
The problem with output-based measures is that natural endowments and human institutions
not concerned with governance can influence outputs independently of governance systems.
Our joint use of process and output based measures (through factor analysis, discussed
shortly) is an attempt to mitigate these competing costs and benefits.
On process-based measures, we obtain both broader indicators like indices of credit rights
(Credit_Rights), property rights (Prop_Rights), and government corruption
(Gov_Corruption) from Andrei Shleifer’s website and more narrow measures like the
number of days to enforce a contract (Days_Enforce) and the number of rules to start a
business (Startup_Rules) from the WDI database. In addition, we use the Economist
magazine’s democracy score (Econ_Democracy). The score (scaled from 1 to 10) is intended
to capture the quality of the electoral process, the functioning of government, diversity in
political participation, and the extent of civil liberties. Finally, Bushman and Piotroski (2006)
refer the literature to an index of the impartiality of the judicial system produced by the
Fraser Institute, which we also incorporate in our analysis (Fair_Courts). The broad indices
that capture rights of capital owners, judicial processes, corruption, and civil liberties are
likely to be correlated with the information and control institutions that facilitate efficient
allocation of capital in an economy; they are, however, subjective. The narrower measures
like contract-enforcement days and start-up rules are more objective and can proxy for poor
government facilitation of business (bureaucratic red tape), or entrenched business interests
(oligopolists who have created barriers to entry), or both.
Our primary output-based measure is per capita GDP (GDP_PC). Countries with higher
per capita GDP are richer, and thus, more likely to have better developed governance
institutions. Of course, as noted earlier, per capita GDP is also influenced by natural
endowments, so we calculate a measure of GDP that attempts to separate the effects of the
17
latter, GDP_PC_HI. Specifically, GDP_PC_HI is the residual from an annual regression of
per capita GDP on exports of fossil fuels, minerals, and ores. In addition to GDP, we use data
on stock market size (Stock_GDP) and turnover (Stock_Turn): the relative size and activity
of a country’s stock markets can be a reasonable output-based indicator of the quality of its
capital market governance. Finally, we use two human-development-based output measures,
Infant_Mortality and Adult_Illiteracy. While, the relation between the human development
measures and the quality of information and control institutions is likely indirect, countries
with the poorest human development are likely to be failed or near-failed states, where
adoption of IFRS is unlikely to be of any interest or consequence.
International Power Politics: We use a host of proxies to identify cross-sectional variation in
countries’ power status. First, we use the number of years a country has been elected to the
United Nations Security Council (UNSC). Being elected to the Security Council requires
political influence since countries must gain the support of a plurality of the United Nations
General Assembly. We argue that the political influence necessary of a country to secure a
Security Council seat can be a reasonable proxy for the ability of a country to advance its
interests with an international body like the IASB. Security Council membership data are
aggregated by year from the inception of the United Nations in 1946. As before, data for the
years 2001 through 2006 are collected. Data for all countries up to year 2001 are available in
Kuziemko and Werker (2006). Subsequent data are collected from the United Nations
website. The five permanent members of the UNSC (China, France, Russia, the United
Kingdom, and the US) are coded as being members in every year since 1946 (and thus are
represented by this measure as being very powerful).
In addition to years on the Security Council, we also represent a country’s power by its
GDP_Rank (in current US dollars), its Population, and its geographic Area. The rationale for
GDP_Rank is that larger economies are more likely to have bargaining power on the
international stage than smaller ones. Population is used as a proxy for the size of a country’s
market. Countries with larger markets are more attractive destinations for investors are thus
also more likely to have political bargaining power. Area can also be a proxy for power since
larger countries are historically more powerful (they require larger militaries to establish and
maintain their territories). Data on GDP and population are collected from the WDI database
18
on a yearly basis for the years 2001 through 2006. Area data are collected from the website
worldatlas.com and are static over the years 2001 through 2006.14
Cultural closeness to Europe: To proxy for countries that are culturally closer to Europe, we
use the proportion of a country’s population that is Christian (Christian). We argue that more
Christian nations are more likely to be comfortable with European institutions like IFRS
since Christianity in these countries is likely to have spread through colonization by
European powers. Data on the proportion of Christians in a population are based on 1980
census reports as provided on Andrei Shleifer’s website.
Erstwhile colonial relationships with Europe can result in strong cultural ties regardless
of religion. Such ties are likely to grow stronger with the passage of time, as the iniquities of
colonization fade, and the colonized views the colonizer more favorably. Accordingly, as a
second proxy for cultural closeness, we use the number of years that a country has been
independent from its longest-ruling colonial power, if that power is a current EU member
state (Years_Free). Non-EU countries that have never been systematically colonized are
coded zero, and thus regarded by this measure as being culturally distant from Europe.15
Network effects: We construct three different country-year measures of network effects. The
first, Pct_Adopt, is the percentage of countries within a geographic region that have adopted
IFRS as of the prior year. The second, GDP_Pct_Adopt, is the GDP-weighted percentage of
countries within a geographic region that have adopted IFRS as of the prior year. The regions
used to compute both Pct_Adopt and GDP_Pct_Adopt are defined in Appendix A. The third
measure, IFRS_Trade, is the percentage of total exports to countries that have adopted IFRS
as of the prior year. The network-effect proxies enter the analysis in subsequent hazard-
model-based multivariate tests.
14 In primary analyses, we choose relatively exogenous macroeconomic variables to proxy for the political determinants of IFRS adoption rather than more explicit measures of the relationships between countries and the IASB (e.g., the number of trustees from a given country on the IASC Foundation). Our choice is driven by concerns over endogeneity. We report on regressions using these explicit relationship measures in robustness tests. 15 We do not use proxies for culture developed by Hofstede (1980; 2001) for three reasons: (1) we are interested in measuring cultural closeness to Europe, not culture per se (which is Hofstede’s focus), (2) we are interested in keeping the sample as large as possible (we do not want to be limited by Hofstede’s sample size); and (3) Hofstede’s work has recently come under some criticism in the accounting sociology literature (Baskerville, 2003).
19
On economic and political determinants, we have identified numerous individual proxies.
Since these proxies collectively address the determinants we are interested in measuring, we
extract common factors from them using principal component analysis. Specifically, we identify
the first principal component of the proxies with the widest coverage (details below) for each of
the economic and political determinants. In subsequent multivariate tests, we use these common
factors in lieu of the individual proxies themselves. Appendix C reports on the factor
components, factor loadings, and Eigen values (all above one) for all factors.
On the value from having a shared body of accounting standards, we extract two distinct
proxies, one measuring the level of foreign capital and trade and the other the growth. We refer
to these factors as “Platform” and “Platform_Chg,” respectively, because the direct value from
having a shared resource is sometimes referred to in the literature as the “platform benefit.” In
computing “Platform” and “Platform_Chg,” we exclude foreign equity portfolio investments
because these data are not available for about 20% of our sample.
Among the numerous process- and output-based measures of the quality of local
governance institutions, we use contract-enforcement days, start-up rules, the Economist’s
democracy index, and per capita GDP to construct the factor, Q_Local_Gov1. Our choice of
these particular proxies is driven by their availability for a wide cross-section of countries. The
other governance institution proxies are all significantly correlated with Q_Local_Gov1. Figure 1
shows scatter plots for four of those proxies (on the y axes), Fair_Courts, Gov_Corruption,
Stock_GDP, and Infant_Mortality, with Q_Local_Gov1 (on the x axis). Of particular interest are
Gov_Corruption and Infant_Mortality, since at the extremes, both these proxies can measure the
domestic political conditions that make for failed states.
Since per capita GDP is influenced by natural endowments, we calculate a substitute
factor, Q_Local_Gov2, which is the first principal component of contract-enforcement days,
start-up rules, the Economist’s democracy index, and GDP_PC_HI. In subsequent empirical
tests, we alternately use both Q_Local_Gov1 and Q_Local_Gov2. The factor “Inter_Power” is
used to represent international power politics: it is the first principal component of the number of
years a country has been elected to the UNSC, the country’s GDP rank, population, and area.
The factor “Culture” is used to proxy for a country’s cultural closeness to Europe. It is
constructed from the proportion of a country’s population that is Christian and Years_Free.
20
4. Descriptive statistics and univariate evidence
4.1. Sample composition
Our data sources and sample construction process are described in Section 3.1. Table 1
reports the number of countries classified as adopters, partial adopters, and non-adopters. The
numbers of adopters and non-adopters are roughly similar at 39 and 40, respectively; while
partial adopters include 23 countries. Panel B describes adoption frequency by year. The normal
annual adoption rate does not exceed 4 countries per year. Nevertheless, 10 countries from our
sample adopted in 2005, the year in which EU member countries adopted.
4.2. Descriptive statistics and univariate evidence on autarky value
We compare EU member states and our sample countries in Table 2, Panel A. The two
groups are significantly different on all but a few dimensions. The EU countries are
characterized by greater exports and greater foreign direct investment. They tend to have higher
quality of local governance institutions as measured by fewer Startup_Rules, higher
Econ_Democracy, greater GDP_PC, and a greater value of stocks traded as % of GDP
(Stock_GDP). In terms of political power, they have a higher GDP_Rank and a higher
representation on the United Nations Security Council (although latter differences are not
statistically significant). Overall, there is some evidence that EU countries are more powerful,
more reliant on international capital and trade, and more likely to have better governance
institutions than non EU countries.
Table 2 also provides descriptive statistics that compare full and partial adopters to non-
adopters in the sample. Panel B compares the proxies, while Panel C compares the factors
derived from those proxies. Partial adopters generally do not differ significantly from non-
adopters, except on international power metrics. The partial adopters have shorter Security
Council tenures, a lower GDP_Rank, and smaller population and areas than non-adopters. A
similar result can be found in Panel C, where the median value of “Inter_Power” is significantly
lower for partial adopters.
Among full adopters, we also find some preliminary evidence that more powerful
countries are less likely to adopt IFRS. Both mean and median “Inter_Power” are significantly
smaller for full adopters than for non-adopters. Moreover, means and medians of all variables
that comprise these factors (UNSC, GDP_Rank, Population, and Area) are also significantly
21
smaller for full adopters. There is mixed univariate evidence that adopters and non-adopters
differ with respect to our proxies for international capital and trade. In particular, while the
median values of Exports, Platform, and Platform_Chg are greater for full adopters than non
adopters, the means are not significantly different. Evidence is similarly mixed for the quality of
local governance institutions. Median Q_Local_Gov1 is greater in full adopters than non
adopters, but there is little evidence to supplement this among other statistical comparisons of
governance institutions. This last result is not surprising since governance institutions can be
expected to have a non-linear relation with IFRS adoption (i.e., both countries with the best and
worst governance institutions are less likely to adopt IFRS).
Overall, the univariate tests reported in Table 2 provide evidence that non-adopters are
more powerful on average than either full or partial adopters. Comparisons along other
dimensions yield mixed or no results. We treat this evidence as preliminary and further explore
the autarky value of IFRS in our multivariate tests described in Section 5. Table 3 reports
correlations among the principal component factors that are used in our multivariate tests.
Correlations between factors that are to enter subsequent regression analyses simultaneously do
not exceed 0.3, providing some evidence that the factors capture theoretically autonomous
constructs.
4.3. Univariate evidence on synchronization value
In Table 4, we provide some univariate evidence on the role of network effects in IFRS
adoption decisions as of 2007. Specifically, in Panel A, we use Chi-Square tests to examine
whether IFRS adoption by over 50% of countries in a region increases the likelihood of a country
adopting IFRS in year 2007. The Chi-Squared statistic for a comparison of full adopters, partial
adopters, and non-adopters across the 50% threshold has a p-value of 0.053. Thirty-six percent
(14 of 39) of full adopters are from regions with a >50% adoption rate, compared to 26% of
partial adopters and 13% of non-adopters. In Panel B, we test whether IFRS adoption by
countries representing at least 50% of a region’s GDP increases the likelihood of a country
adopting IFRS in year 2007. The Chi-Squared statistic for a comparison of full adopters, partial
adopters, and non-adopters across the 50% GDP threshold has a p-value of 0.037. Among partial
and full adopters, 39% of countries are from regions with a >50% GDP adoption rate, compared
to 18% among non-adopters.
22
In Panel C, we test whether a country is more likely to adopt IFRS in year 2007 when
over 10% of its export destinations are IFRS adopters (we choose 10% because it represents the
approximate mean and median year 2007 value of IFRS_Trade). Of the 48 countries for which
exports to IFRS adopters represent over 10% of total exports, 22 countries (46%) are themselves
full adopters in 2007. In contrast, of the 54 countries for which exports to IFRS adopters
represent less than 10% of total exports, 17 countries (31%) are themselves full adopters in 2007.
The Chi-Squared statistic for a comparison of full adopters, partial adopters, and non-adopters
across the 10% export threshold is, however, not statistically significant.
5. Multivariate model and evidence
5.1. Hazard model analysis
Our primary multivariate tests are based on hazard model analyses. The hazard model
allows us to test the determinants of countries’ IFRS adoption decisions as functions of the
relative timing of adoption. Additionally, the hazard model lends itself to investigating how
trends in IFRS adoption among other countries affect a given country’s adoption decision
(network effects).
In the hazard analysis, full adoption of IFRS is modeled as the “failure” event, i.e., the
dependent variable is the time to full IFRS adoption. Let “T” be the “survival” time, i.e., the
number of years till full IFRS adoption. Then, T=1 if a country adopts IFRS in 2002, T=2 if a
country adopts IFRS in 2003, and so on. Since the data are censored in 2007, the highest possible
value for T is six. For countries that do not adopt by 2007 or countries that adopt only partially,
T is set to six, and the dependent variable is treated as censored.16 In subsequent analysis, we
estimate how the hazard rate, h(t), and survival probability, S(t), vary as a function of
determinants of IFRS adoption. h(t) and S(t) are defined below.
h(t) = f(t) / S(t) … (3)
S(t) = 1 – F(t) … (4)
16 We include partial adopters with non-adopters because adoption dates for these countries are not available. This treatment of partial adopters is consistent with results in Table 2, where there is little evidence of differences between partial and non- adopters along the economic and political determinants identified.
23
Where f(t) is the probability density function of T and F(t) is the cumulative probability
density function of T.
We estimate two different versions of the hazard model: the counting process hazard
model (Therneau and Grambsch, 2000) and the more-familiar Cox proportional hazard model.
The counting-process method is based on a discrete formulation of the dependent variable (i.e.,
survival time T), which is likely to be more appropriate for our data since we measure T in years
(the Cox model assumes T is continuous). Moreover, in situations where the range of possible
values for T is low (as in the case of our data where T varies between 1 and 6), Box-
Steffensmeier and Jones (2004) argue counting-process method is likely to be more appropriate
for hazard analyses. On average, however, the two methods (Cox and counting-process) are
expected to yield similar results, which is the case in this paper. Consequently, we only report
results based on the counting process model.
A positive coefficient on a covariate in the hazard model implies that the hazard rate is
increasing (survival time is decreasing) in that covariate. In other words, a positive coefficient on
a covariate implies that the likelihood of IFRS adoption is increasing in the covariate. To provide
an estimate of the economic significance of a coefficient, we also report the % change in the
hazard rate in our results. The % change in the hazard rate is the % change in h(t) when the value
of a covariate in question is changed from its 25th to its 75th percentile value.
The independent variables in our hazard analysis are time-varying covariates (TVCs).
TVCs are appropriate for our setting since many of our covariates are based on macroeconomic
variables that change over the event measurement period (i.e., 2002 through 2007). As discussed
earlier, the TVCs are lagged values, i.e., covariates for 2002 are actually macroeconomic data
from 2001 and so on. Lagged TVCs are recommended by Petersen (1995) to avoid the event
simultaneity problem in hazard modeling.
If, as we argue, adoption decisions within regions are correlated, then the data are serially
dependent and we have less information than will be assumed in computing ordinary standard
errors. In other words, if adoption decisions within regions are correlated, ordinary standard
errors will be understated. Accordingly, in all our hazard analyses, we cluster standard errors at
the region level. The clustering is done using the process described in Lin and Wei (1989) and is
24
likely to be particularly important when evaluating the statistical significance of the proxy for
synchronization effects (i.e., the proportion of countries within region that have adopted).
Table 5 reports the results of the counting-process hazard analysis. There are four panels
to Table 5. In Panel A, the independent variables include: Platform, Platform_Chg,
Q_Local_Gov1, Inter_Power, Culture, and Pct_Adopt. We also include the squared value of
governance institution quality, Q_Local_Gov1^2, since we predict a non linear relation between
governance institution and IFRS adoption. In Panel B, we use GDP_Pct_Adopt, the GDP-
weighted proportion of IFRS adopters within a country’s geographical region, to proxy for
network effects. All other covariates are similar to those in Panel A. Panel C is also similar to
Panel A, except that network effects are represented by IFRS_Trade, the percentage of total
exports to countries that have adopted IFRS as of the prior year. In Panel D, we use
Q_Local_Gov2 to proxy for governance institution quality, i.e., we use the governance
institutions factor that controls for the effects of natural endowments on GDP. All other
covariates in Panel D are similar to those in Panel A.
Inferences are similar across all four panels of Table 5. Specifically, the coefficients on
proxies for governance institution quality, international power politics, and network effects are
statistically significant at the 95% confidence level or greater, while the coefficients on proxies
for cultural closeness to Europe and levels and changes of international investment and trade are
not. The evidence in Table 5 does not confirm that countries adopt IFRS because they value
having a shared body of international standards or that cultural considerations vis-à-vis Europe
affect IFRS adoption decisions.
There is evidence that quality of local governance institutions has a non-liner association
with IFRS adoption. The first-order coefficients on the factors for governance institutions are
positive, while the second-order coefficients are negative. The marginal effects on these
coefficients in Panel A of Table 5 suggest that an inter-quartile increase in Q_Local_Gov1 is
associated with a 96.38% increase in the hazard of adopting IFRS, while an inter-quartile
increase in Q_Local_Gov1^2 is associated with a 28.62% decrease in the hazard rate (intuitively,
the hazard measures the conditional probability of IFRS adoption). The evidence suggests that
IFRS adoption is less likely among both countries with the poorest governance institutions,
where international harmonization of accounting standards is unlikely to be of must interest, and
25
countries with good governance institutions, where IFRS adoption is likely to be associated with
high opportunity and switching costs.
The negative coefficients on the proxies for international power politics imply that IFRS
adoption is less likely among more powerful countries. This relation is consistent with the
proposition that more powerful countries are more wary of losing domestic authority over
accounting standard setting. The dominance of the EU in IFRS standard setting and uncertainties
in the political process of international standard setting can be associated with the reluctance of
more powerful countries to adopt IFRS. The change in hazard statistic for power in panel A of
Table 5 is -43.98% indicating that an inter-quartile increase in the Inter_Power covariate is
associated with a 43.98% decrease in the hazard ratio.17
The positive coefficients on Pct_Adopt and GDP_Pct_Adopt are consistent with the
proposition that IFRS adoption is more likely as the proportion of regional adopters increases.
The positive coefficient on IFRS_Trade is also consistent with the existence of network effects.
The results indicate that countries do account for the network effects of IFRS when considering
whether to adopt the international standards: in other words, the network benefits of IFRS cannot
be considered externalities. The magnitude of the network proxy in Panel A suggests that when
the proportion of IFRS adopters in a region increases from 14% to just about 50%, the hazard of
IFRS adoption for a country in that region increases by over 230%.
Overall, from the hazard analyses we can conclude the following: (1) more powerful
countries are less likely to adopt IFRS; (2) a country is more likely to adopt IFRS as the
proportion of IFRS adopters within its region or among its trade partners increases; and (3) there
is a quadratic relation between the quality of local governance institutions and IFRS adoption,
where adoption at first increases and then decreases with governance quality.
5.2. Additional analyses
As a more explicit measure of switching costs to IFRS, we rerun the regressions after
including a dummy for whether IFRS is produced in the country’s official language. As of 2008, 17 As noted earlier, we use the number of years a country has served on the UNSC as an input in constructing our measure of power. China, Russia, and the US, as permanent members of the UNSC, are thus assigned relatively high scores on power. None of these three countries have adopted IFRS fully. To ensure that the results on power are not driven by the permanent UNSC members, we repeat the analysis in Table 5 after excluding these countries (China, Russia, and the US) from the sample. The results are substantively unchanged, suggesting that the sign and significance on power in our multivariate analyses are not driven by the disproportionate influence of permanent membership in the UNSC on this measure.
26
the only IASB-reviewed version of IFRS is in English, thus, the dummy identifies countries with
English as an official language (mostly, former British colonies that conduct at least some
official government business in English). This variable is not statistically significant, nor does its
inclusion in the regressions alter any inferences discussed thus far (results are not tabulated).
In testing the hypothesis that IFRS adoption is more likely among countries that are
culturally closer to Europe, we use the proportion of Christians in a population and the number
of years since a country became independent from an EU country as our proxies. We deliberately
avoid using legal origin to proxy for cultural closeness because legal origin is associated with a
colonial relationship, and it is not clear that a previously existing colonial relationship in itself
indicates a close cultural tie between colonized and colonizer. Moreover, given that European
countries once colonized most of the globe, a measure of closeness based solely on former
colonial relationships would identify most countries in the world as culturally close to Europe.
Notwithstanding the argument above, given that the IASB is the successor body to the
Anglo-centric IASC (which was popular within the Commonwealth), it is possible that current
IASB adopters are more likely to be former British colonies. In other words, it is possible that a
substantial fraction of current IASB adopters are carryovers from the IASC regime. We test this
conjecture by repeating our multivariate tests upon including a dummy to indicate whether a
country has a British-style common law system. The coefficient on this dummy is not
statistically significant and already discussed results are unchanged (results unreported).
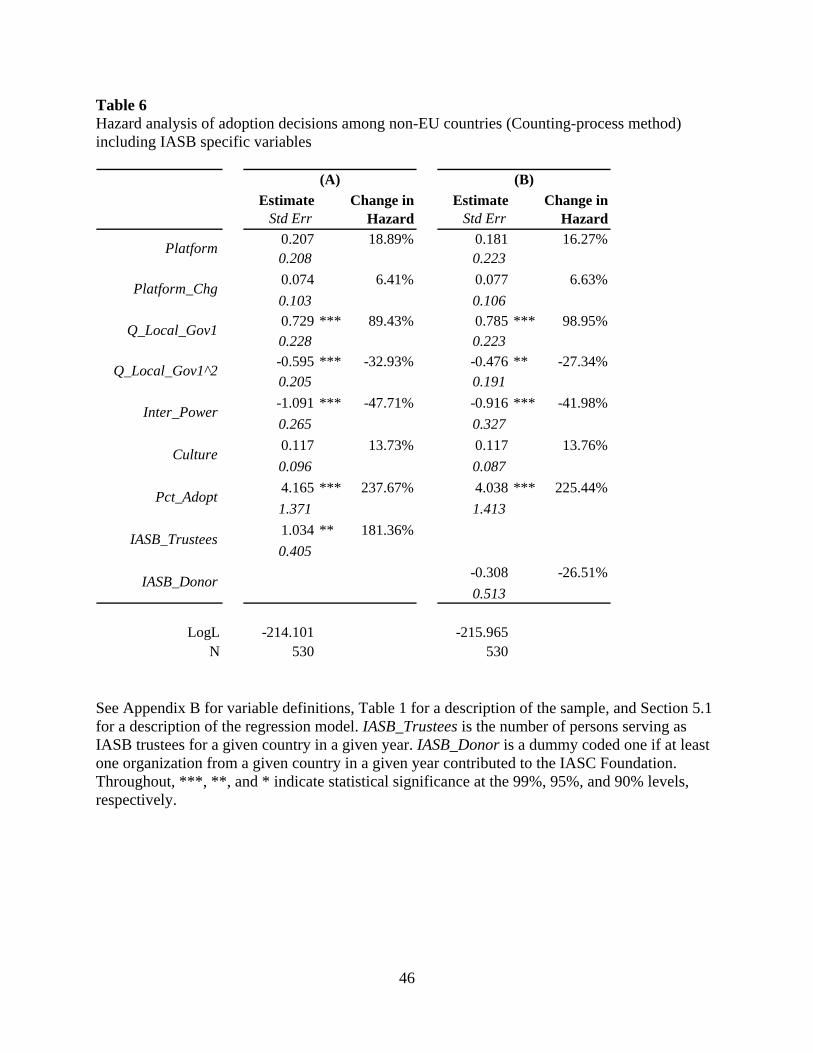
In the tests reported on so far, we have used relatively exogenous macroeconomic
variables to proxy for the political determinants of IFRS adoption. In Table 6, we report on tests
using more explicit variables for the relationships between countries and the IASB. In particular,
we repeat the regressions in Table 5 upon including, alternatively, (a) the number of trustees on
the IASC Foundation from a given country, and (b) a dummy variable if the country is a donor to
the IASC Foundation. The number of trustees on the IASC Foundation can proxy for a country’s
influence with the IASB, and thus for the acceptability of IFRS to that country: countries with
greater representation on the IASC Foundation are more likely to adopt IFRS. A similar
argument can be made for donations from a given country to the IASC.
Both the number of IASC trustees and donations to the IASC are likely to be
endogenously determined with the dependent variable, IFRS adoption. In other words, IFRS
adopters are more likely to both have representation on the IASC board and be financial
27
supporters of the IASB, and the direction of causality is difficult to specify. Accordingly, the
results from the analysis in Table 6 should be interpreted with caution. The results from Panel A
suggest that after controlling for determinants discussed earlier, the likelihood of IFRS adoption
is increasing in the number of trustees from a given country at the IASC (the coefficient on the
trustee variable is positive and significant at the 95% confidence level): an increase from zero to
one IASC trustee increases the hazard of IFRS adoption by 181%. However, Panel B finds no
evidence of a relationship between IFRS adoption and a country’s IASC donation history. The
previously discussed inferences from Table 5 are not affected by inclusion of the IASC proxies
in Table 6.
In additional robustness tests, we use a multinomial logit model in lieu of hazard analysis
to model the determinants of IFRS adoption. Multinomial logit analysis is less suitable to hazard
analysis in our setting because it cannot account for richness in the data about the year of
adoption. However, the multinomial logit model allows us to treat full adopters, partial adopters,
and non-adopters separately (because the model accommodates nominal data as the dependent
variable), rather than force the adoption categories into a binomial choice. The primary findings
from the multinomial logit model analysis are that full adoption of IFRS is more likely for
countries with higher levels of (but not changes in) international investment and trade, and less
likely for more powerful countries and countries with the poorest governance institutions. The
multinomial logit tests find no evidence of differences between non-adopters and partial adopters
along any of the economic and political determinants except levels of international investment
and trade. This finding supports our treatment of partial adopters in the hazard analyses.
6. Conclusion
We investigate why there is heterogeneity in countries’ decisions to adopt IFRS; in other
words, why some countries adopt IFRS while others do not. We focus our analysis on a sample
of 102 non-EU countries, excluding the EU because of it closeness to the IASB. We examine
IFRS adoption over the period 2002 (the first full year of the IASB’s existence) through 2007.
We use the economic theory of networks to develop our hypotheses since a standard like
IFRS is likely to be more appealing to a country if other countries adopt it as well. In other
words, network theory allows us to explain the inter-temporal increase in the adoption of IFRS
across countries. We find evidence consistent with the likelihood of IFRS adoption for a given
28
country increasing with the number of IFRS adopters in its geographical region and with IFRS
adoption among its trade partners. The result is significant for at least two reasons: (1) it suggests
countries internalize the network effects of IFRS in their adoption decisions; and (2) it suggests
that as the network benefits from IFRS get large, countries may adopt the international standards
even if the direct economic benefits from such standards are inferior to those from locally
developed standards.
Economic network theory predicts that in addition to network benefits (synchronization
value), a product with network effects can be adopted due to its direct benefits (autarky value)
(Katz and Shapiro, 1985; Liebowitz and Margolis, 1996). In the case of the IFRS adoption
decision by a country, we argue the direct benefits are represented by both the net economic and
net political value of IFRS over local standards.
The net economic value of IFRS is intended to capture direct pecuniary benefits as they
are usually conceived in economic models of networks. Accordingly, we test whether economies
that are more reliant on foreign investment and trade are more likely to adopt IFRS and whether
the likelihood of IFRS adoption decreases with the quality of domestic governance institutions (a
proxy for both opportunity and switching costs). We find no evidence that the level of and
expected changes in foreign investment and trade affect the likelihood of adoption. Thus, we
cannot confirm that IFRS lowers information costs in more globalized economies. We do find
some evidence that the likelihood of IFRS adoption at first increases and then decreases in the
quality of countries’ domestic governance standards. This result can be interpreted as consistent
with both the most poorly governed countries being less responsive to international standards,
and all other countries conditioning their IFRS adoption decisions on the opportunity and
switching costs of domestic governance standards.
The net political value of IFRS is the benefit arising from the potential political nature of
international accounting standard setting. If countries expect the EU to have a dominant role in
IASB affairs (Brackney and Witmer, 2005), they are likely to have to cede some authority over
standard setting to EU interests. Ceding authority over local standards is, in turn, likely to be less
palatable to more powerful countries, which leads to the prediction that more powerful countries
are less likely to embrace IFRS. There is evidence in the data consistent with this proposition. In
addition to standard-setting power, cultural sensitivities can also affect the net political value of
IFRS to a country. If the IASB is perceived as a European institution, countries that are culturally
29
more distant from Europe are likely to be less accepting of IFRS (Ding et al., 2005; Ciesielski,
2007; Norris, 2007). However, we do not find evidence of cultural differences between adopters
and non-adopters.
Our study of IFRS adoption at the country-level can complement recent firm-level studies
on IFRS. The results of these firm-level studies are mixed. Barth et al. (2008) conclude that
“firms applying [IFRS] from 21 countries generally evidence less earnings management, more
timely loss recognition, and more value relevance of accounting amounts than do a matched
sample of firms applying non-US domestic standards.” Armstrong et al. (2008) in studying the
stock market reaction in European companies to events associated with the adoption of IFRS in
the EU also find evidence “consistent with investors expecting net information quality benefits
from IFRS adoption.” In contrast, Daske et al. (2008) are cautious “to attribute the capital-
market effects for mandatory adopters solely or even primarily to the IFRS mandate;” while
Christensen et al. (2008) find that improvements in earnings management and timely loss
recognition behavior among IFRS adopting firms are “confined to firms with incentives to
adopt,” suggesting that “incentives dominate [IFRS] in determining accounting quality.”
Firm-level studies of IFRS adoption are conditional on countries’ decisions to allow or
mandate IFRS, suggesting that firm-level studies examine the second stage in what is at least a
two-stage process. Further, since firm-level studies require significant amounts of cross-company
data, they have been limited to firms in a few (mostly developed) countries where corporate
financial reports are available in machine-readable format. By examining IFRS adoption across
102 different (non-EU) countries, we expand our understanding of the determinants and
consequences of IFRS adoption to a more global sample. Our evidence of a higher IFRS
adoption rate among countries with moderate governance standards is consistent with IFRS
being adopted for reasons that can be beneficial to a country. At the same time, the evidence that
the best governed and most powerful non-EU countries were, as of 2007, less likely to adopt
IFRS, suggests that several countries still perceived IFRS as being costly.
We caution against any broad interpretation of the results in this paper in the context of
any ongoing policy debate on IFRS adoption. There are two reasons for this caveat. First, the
data in the paper on country-level IFRS adoption are based largely on information provided by
Deloitte on its IASplus.com website. While even the IASB relies on these data (IASB, 2008a, b),
our correspondence with managing partners of non-Deloitte big-4 audit firms in some countries
30
reveal potential errors in the IASplus.com dataset. The “errors” are likely due to disagreements
among auditors on the extent to which a country has adopted IFRS: several countries adopt
“modified” versions of IFRS, and we suspect auditors do not agree on whether the modifications
are substantial enough to constitute something apart from IFRS.
Second, as noted earlier, our analysis covers IFRS adoption through year 2007. As more
countries adopt the international standards, the network benefits from IFRS adoption are likely to
increase. This, in turn, can change the relative importance of direct (autarky) benefits and costs
in determining IFRS adoption. In other words, the determinants of IFRS adoption are likely to be
dynamic, so the magnitude of coefficients documented in this paper are likely to vary as the set
of adopters (or non-adopters) is expanded.
The network-theoretic framework we use to explain the adoption of IFRS across country-
time can be applied in the study of other accounting and corporate governance phenomena. For
example, the adoption of accounting methods, accounting standards, and corporate governance
best practices by firms and jurisdictions are likely to depend on similar such actions by
competitors and associates. In other words, inter-temporal variation in adoption decisions in
panel data, commonly studied in the accounting literature, can be explained by the “network”
value of the product being adopted. The method employed in this paper can be a first step
towards a broader use of network theory in motivating such studies.
31
References
Armstrong, C., M.E. Barth, A.D. Jagolinzer, and E.J. Riedl. 2008. Market reaction to the adoption of IFRS in Europe. Working paper, University of Pennsylvania, Stanford University, and Harvard University.
Ball, R., S.P. Kothari, and A. Robin. 2000. The effect of international institutional factors on properties of accounting earnings. Journal of Accounting and Economics 29: 1-51.
——–, A. Robin, and J.S. Wu. 2003. Incentives versus standards: properties of accounting income in four East Asian countries. Journal of Accounting and Economics 36: 235-270.
——–. 2006. International Financial Reporting Standards (IFRS): pros and cons for investors. Accounting & Business Research 36: 5-27.
Barth, M.E. 2007. Research, standard setting, and global financial reporting. Hanover, MA: New Publishers.
——–. 2008. Global financial reporting: Implications for U.S. Academics. The Accounting Review 83: 1159-1179.
——–, W.R. Landsman, and M.H. Lang. 2008. International accounting standards and accounting quality. Journal of Accounting Research 46: 467-728.
Baskerville, R.F. 2003. Hofstede never studied culture. Accounting, Organizations and Society, 28: 1–14.
Benston, G.J., M. Bromwich, R.E. Litan, and A. Wagenhofer. 2006. Worldwide financial reporting: The development and future of accounting standards. New York: Oxford University Press.
Box-Steffensmeier, J.M., and B.S. Jones. 2004. Event history modeling: A guide for social scientists. New York: Cambridge University Press.
Brackney, K.S., and P.R. Witmer. 2005. The European Union’s role in international standards setting. CPA Journal, November. http://www.nysscpa.org/cpajournal/2005/1105/infocus/p20.htm.
Bushman, R. and J. Piotroski. 2006. Financial reporting incentives for conservative accounting: The influence of legal and political institutions. Journal of Accounting and Economics 42: 107-148.
Camfferman, K., and S.A. Zeff. 2007. Financial reporting and global capital markets: A history of the international accounting standards committee, 1973-2000. New York: Oxford University Press.
Ciesielski, J. 2007. Comment letter of the Investors Technical Advisory Committee. Norwalk, CT: FASB. http://www.fasb.org/investors_technical_advisory_committee/itac_08-31-07.pdf
32
Christensen, H.B., E. Lee, and M. Walker. 2008. Incentives or standards: what determines accounting quality changes around IFRS adoption? Working paper, University of Chicago and University of Manchester.
Daske, H., L. Hail, C. Leuz, and R. Verdi. 2008. Mandatory IFRS Reporting around the world: early evidence on the economic consequences. Journal of Accounting Research 46: 1085-1142.
Ding, Y., T. Jeanjean, and H. Stolowy. 2005. Why do national GAAP differ from IAS? The role of culture. The International Journal of Accounting 40: 325-350.
EC (Commission of the European Communities). 2000. EU Financial Reporting Strategy: The Way Forward. Brussels, Belgium: EC. http://www.iasplus.com/resource/cec.pdf.
——–. 2002. Regulation (EC) No. 1606/2002 of the European Parliament and of the Council of 19 July 2002 on the Application of International Accounting Standards. Brussels, Belgium: EC. http://eur-lex.europa.eu/LexUriServ/LexUriServ.do?uri=OJ:L:2002:243:0001:0004:EN:PDF.
——–. 2008. Table of decisions of Member States and EEA Countries concerning the use of options in the IAS Regulation. Brussels, Belgium: EC. http://ec.europa.eu/internal_market/accounting/docs/ias/ias-use-of-options_en.pdf
Hofstede, G. 1980. Culture’s consequences: international differences in work-related values. Beverly Hills CA: Sage.
——–. 2001. Culture’s consequences, second edition: comparing values, behaviors, institutions and organizations across nations. Thousand Oaks CA: Sage.
Hope, O., J. Jin, and T. Kang. 2006. Empirical evidence on jurisdictions that adopt IFRS. Journal of International Accounting Research 5: 1-20.
International Accounting Standards Board (IASB). 2008a. The IASC Foundation’s Annual Report 2007. London, UK: IASB. http://www.iasb.org/NR/rdonlyres/99A983BD-191F-474B-87A9-E25BB9D7093C/0/IASCF_annual_report_2007.pdf
——–. 2008b. IASB and the IASC Foundation: Who we are and what we do. London, UK: IASB. http://www.iasb.org/NR/rdonlyres/0A5A767C-E7DE-49E5-8B12-499F62F8870C/0/WhoWeAre_Final12508.pdf
International Accounting Standards Committee (IASC). 2000. EU financial reporting strategy. IASC Insight June. London, UK: IASC.
Kalbfleisch, J.D., and R.L. Prentice. 1980. The statistical analysis of failure time data. New York: John Wiley.
Katz, M.L., and C. Shapiro. 1985. Network externalities, competition, and compatibility. American Economic Review 75: 424-440.
33
Knight, F.H. 1924. Some fallacies in the interpretation of social cost. Quarterly Journal of Economics 38: 582-606.
Kuziemko, I., and E. Werker. 2006. How much is a seat on the Security Council worth? Foreign aid and bribery at the United Nations. Journal of Political Economy 114: 905-930.
La Porta, R., F. Lopez-de-Silanes, A. Shleifer, and R. Vishny. 1999. The quality of government. Journal of Law, Economics and Organization 15: 222-279.
Leone, M. 2008. “Spineless?” UK pressure targets fair value weakening. CFO.com, November. http://www.cfo.com/article.cfm/12586836?f=related.
Leuz, C. 2003. IAS versus U.S. GAAP: Information asymmetry-based evidence from Germany’s new market. Journal of Accounting Research 41: 445–472.
——–, D. Nanda, and P. Wysocki, 2003. Earnings management and investor protection: An international comparison. Journal of Financial Economics 69: 505-527.
——–, and P. Wysocki, 2008. Economic consequences of financial reporting and disclosure regulation: A review and suggestions for future research. Working paper, University of Chicago and Massachusetts Institute of Technology.
Liebowitz, S.J., and S.E. Margolis. 1994. Network externality: An uncommon tragedy. Journal of Economic Perspectives 8: 133-150.
——–, and S.E. Margolis. 1996. Market processes and the selection of standards. Harvard Journal of Law and Technology 9: 283-318.
——–, and S.E. Margolis. 1998. Network externalities (effects). In The New Palgrave's dictionary of economics and the law, ed. Peter Newman. London: Palgrave MacMillan.
Lin, D.Y., and L.J. Wei. 1989. The robust inference for the Cox proportional hazards model. Journal of the American Statistical Association 84: 1074-1078.
Norris, F. 2007. “A plan to let S.E.C. accept foreign rules is opposed,” New York Times, September 25, Business section, online edition.
Petersen, T. 1995. Analysis of event histories. In Handbook of statistical modeling for the social and behavioral sciences, ed. G. Arminger, C. C. Clogg and M.E. Sobel. New York: Plenum Press.
Therneau, T.M., and P. M. Grambsch. 2000. Modeling survival data: Extending the Cox model. New York: Springer-Verlag.
Watts, R.L. 2003. Conservatism in Accounting Part I: Explanations and Implications. Accounting Horizons 17: 207-221.
34
Appendix A: List of sample countries by region Region Country Region Country Region Country
Australia (A) Belarus (PA) Kuwait (A)Bangladesh (NA) (A) Lebanon (A)
South Korea (NA) Colombia (NA) Ghana (A)Sri Lanka (PA) Costa Rica (A) Kenya (A)Thailand (NA) Ecuador (NA) Lesotho (PA)Vietnam (NA) El Salvador (PA) Malawi (A)
Guatemala (A) Mali (NA)Aruba (PA) Guyana (A) Mauritius (A)
Armenia (A) Israel (NA)Azerbaijan (PA) Jordan (PA)
Asia-Pacific …Former Communist Bloc …Middle-East
Bosnia and Herzegovina
United Arab Emirates North America
Middle-East
Former Communist Bloc
Latin America Sub-Saharan Africa
Caribbean
Dominican Republic
Trinidad and Tobago
Papua New Guinea
Adoption status is listed in parentheses next to the country name with (A) indicating full adopters of IFRS, (PA) indicating partial adopters (i.e. countries in which IFRS is required for some listed companies or in which IFRS is permitted for listed companies), and (NA) indicating non-adopters as of 2007.
Exports ratio of exports of goods and services to gross domestic product (GDP) World Bank
FDI ratio of foreign direct investment (FDI) inflows to GDP
FEPI ratio of foreign equity portfolio investments (FEPI) inflows to GDP World Bank
Exports_Chg one-year change in ratio of exports of goods and services to GDP World Bank
FDI_Chg one-year change in ratio of foreign direct investment (FDI) inflows to GDP World Bank
FEPI_Chg one-year change in ratio of foreign equity portfolio investments (FEPI) inflows to GDP World Bank
Days_Enforce logarithm of number of days to enfore a contract World BankStartup_Rules number of procedures to start a business World Bank
Econ_DemocracyThe Economist’s democracy index based: electoral process and pluralism; civil liberties; the functioning of government; political participation; and political culture.
Economist
Credit_Rights score of creditor rights Andrei ShleiferProp_Rights index of property rights Andrei ShleiferFair_Courts index of impartiality of the judicial system Freetheworld.comGov_Corruption index of government corruption Andrei Shleifer
GDP_PC per capita GDP World Bank
GDP_PC_HIper capita GDP attributable to human institutions (not natural endowments); residual from an annual regression of per capita GDP on exports of fossil fuels, minerals, and ores.
World Bank
Stock_GDP total value of stocks traded as % of GDP World BankStock_Turn % turnover ratio of stocks traded World BankInfant_Mortality logarithm of infant mortality Andrei ShleiferAdult_Illiteracy adult illiteracy rate Andrei Shleifer
UNSC number of years a country has been elected to the United Nations Security Council United Nations
GDP_Rank rank of GDP in current US dollars World BankPopulation population in thousands World BankArea area in thousands Worldatlas.comChristian proportion of a country’s population that is Christian Andrei ShleiferYears_Free years since independence from an EU country Worldstatesmen.org
Pct_Adoptpercentage of countries within a geographic region that have adopted IFRS as of the prior year. Regions are defined in Appendix A.
Hand Collected
GDP_Pct_AdoptGDP-weighted percentage of countries within a geographic region that have adopted IFRS as of the prior year. Regions are defined in Appendix A.
Hand Collected
IFRS_Trade percentage of exports to countries that have adopted IFRS as of the prior year
International Monetary Fund
Variable
Levels
Value from having a shared body of accounting standards
Changes
Cultural closeness to Europe
Network effects
International power politics
Processes-based measures
Quality of local governance institutions Output-based measures
36
Appendix C: Factor compositions
Effect Factor Name Factor from principle component analysis of:
Factor Loadings Eigen Value N
Exports 0.842FDI 0.842
Exports_Chg 0.717FDI_Chg 0.717
Days_Enforce -0.430Startup_Rules -0.737
Econ_Democracy 0.584GDP_PC 0.816
Days_Enforce -0.345Startup_Rules -0.713
Econ_Democracy 0.672GDP_PC_HI 0.848
UNSC 0.707GDP_Rank 0.916Population 0.744
Area 0.875Christian 0.887
Years_Free 0.887Culture
Inter_Power
1.734
2.657
95
99
Quality of local governance institutions
102
Q_Local_Gov2 1.799 95
1.574
Value from having a shared body of
accounting standards
Cultural closeness to Europe
Platform
Platform_Chg
Q_Local_Gov1
96
95
International power politics
1.418
1.029
See Appendix B for variable definitions and Table 1 for a description of the sample.
37
Figure 1 Scatter plots of additional proxies for quality of local governance institutions on Q_Local_Gov1 (X axis)
38
Table 1 Panel A Distribution of sample countries by IFRS adoption status
Adopters Partial adopters
Non-adopters Total
Number of countries 39 23 40 102
Panel B IFRS adoption frequency by year
Year Adopters All others2002 19 832003 20 822004 24 782005 34 682006 35 672007 39 63
The sample is based on the list of countries on Deloitte’s IASplus.com website; it excludes European Union (EU) member states and countries without GDP data on the World Bank’s WDI database. Partial adopters include those that permit (but do not require) IFRS, as well as those that require IFRS for only some companies.
39
Table 2 Panel A Descriptive statistics for European Union and sample (Non-European Union) countries
Value from having a shared body of accounting standards
Levels
Changes
Quality of local governance institutions
Processes-based measures
Output-based measures
Non-Adopters Full Adopters Partial Adopters
41
Table 2 Panel C Descriptive statistics of factors by adoption status
Effect Factor Name N Mean Median N Mean Median N Mean Median
Quality of local governance institutions Q_Local_Gov2 40
-0.162 23 0.100 -0.120
***
Cultural closeness to Europe Culture 40 -0.011 -0.532 39 -0.055
22 -0.092
-0.261
-0.366
20 -0.179-0.034 -0.275 35
-0.355 ***37
0.0220.141
International power politics Inter_Power 40 0.322 0.110 ***-0.293
** 20 -0.205 -0.223
0.088
Q_Local_Gov1 40 -0.054 -0.375 35 0.179 0.080
-0.024 * 21 0.183
0.007 -0.258 *
Platform_Chg 39 0.092 0.225 35 -0.212
35 0.210 -0.127 *** 21
Non-Adopters Full Adopters Partial Adopters
Value from having a shared body of
accounting standards
Platform 40 -0.187 -0.467
See Appendix B for variable definitions and Table 1 for a description of the sample. Throughout Table 2, ***, **, and * indicate statistical significance at the 99%, 95%, and 90% levels, respectively. In Panel A, ***, **, and * compare statistics of EU countries with those of Non-EU countries. In Panels B and C, ***, **, and * compare statistics of Full Adopter and Partial Adopter countries with those of Non-Adopter countries.
42
Table 3 Pearson (above the diagonal) and Spearman (below the diagonal) correlations among factors (p-values in italics)
See Appendix B for variable and factor definitions and Table 1 for a description of the sample.
43
Table 4 Panel A Association of a country’s IFRS adoption status in 2007 with the median adoption status of countries in its region
IFRS Adoption Status
Adopters Partial adopters
Non-adopters Total
Over 50% of region has adopted
No 25 17 35 77Yes 14 6 5 25
Total 39 23 40 102
Statistic p-valueChi-Square 5.8825 0.053
Panel B Association of a country’s IFRS adoption status in 2007 with the median GDP weighted adoption status of countries in its region
IFRS Adoption Status
Adopters Partial adopters
Non-adopters Total
Over 50% of region’s GDP has adopted
No 26 12 33 71Yes 13 11 7 31
Total 39 23 40 102
Statistic p-valueChi-Square 6.6065 0.037
44
Table 4 … Cont. Panel C Association of a country’s IFRS adoption status in 2007 with the median adoption status of its export destination countries
IFRS Adoption Status
Adopters Partial adopters
Non-adopters Total
Over 10% of export destinations have adopted
No 17 13 24 54Yes 22 10 16 48
Total 39 23 40 102
Statistic p-valueChi-Square 2.2873 0.319
The sample is based on the list of countries on Deloitte’s IASplus.com website; it excludes European Union (EU) member states and countries without GDP data on the World Bank’s WDI database. Partial adopters include those that permit (but do not require) IFRS, as well as those that require IFRS for only some companies. See Appendix A for a list of countries by region.
45
Table 5 Hazard analysis of adoption decisions among non-EU countries (Counting-process method)
See Appendix B for variable definitions, Table 1 for a description of the sample, and Section 5.1 for a description of the regression model. Throughout, ***, **, and * indicate statistical significance at the 99%, 95%, and 90% levels, respectively.
46
Table 6 Hazard analysis of adoption decisions among non-EU countries (Counting-process method) including IASB specific variables
See Appendix B for variable definitions, Table 1 for a description of the sample, and Section 5.1 for a description of the regression model. IASB_Trustees is the number of persons serving as IASB trustees for a given country in a given year. IASB_Donor is a dummy coded one if at least one organization from a given country in a given year contributed to the IASC Foundation. Throughout, ***, **, and * indicate statistical significance at the 99%, 95%, and 90% levels, respectively.