policy brief Low inflation despite economic recovery has given rise to the puzzle of “missing inflation”. Yet there would be no puzzle if the recovery is incomplete. While GDP is on the rise, some slack may still be present in some countries of the euro area. Against this backdrop, we investigate the empirical determinants of inflation and we investi- gate their relative contributions to actual inflation since 2000 to explain why inflation is currently low. Drawing on empirical estimations, we explain the dynamics of inflation since 2000 by different cyclical and structural factors. We also introduce an indicator of both conventional and unconventional monetary policies to assess the direct incidence of ECB's policies on actual inflation. All these factors explain the bulk of inflation variance since 2000. The most important determinants of inflation in the euro area are inflation expectations and wage growth. Both indicators have contributed negatively to infla- tion since 2014 but inflation expectations less so since 2015 whereas the contribution of wage growth has remained constant. Drawing on evidence of uneven recovery across euro area Member States, it shall be recommended to keep on pursuing the expansionary stance of monetary policy until the ECB achieves its inflation objective. Moreover, the evolution of inflation and its determinants do not meet the conditions that the ECB regarded as genuine progress towards its policy objective. Inflation has not yet happened and is not expected in the medium-run; moreover, without second-round effects on wages, it is not yet possible to expect that once inflation goes back to target, it will be self- sustained. The features of the ongoing developments in wage-price inflation suggest a decrease in the nominal anchor. The recent structural reforms may have put a drag on the ability of the ECB to reach its inflation target rapidly. The timing of structural reforms is important. They may be helpful at fostering innovation and productivity provided they are implemented after economic growth has been sustained and evenly distributed across the Member states, and after inflation has reached its medium-run objective. Keywords: ECB, QE, low inflation, inflation expectations, wage dynamics, output gap. 33 15 mars 2018 Christophe Blot*, Jérôme Creel**, Paul Hubert Sciences Po, OFCE, Paris France WHY DOES THE RECOVERY SHOW SO LITTLE INFLATION? 1 * & Université Paris Nanterre. ** & ESCP Europe. 1. This document has been pre- pared for the Monetary Dialogue of 26 February 2018 between the European Parliament Committee on Economic and Monetary Affairs and the ECB.
Transcript
policy brief33 15 mars 2018
Christophe Blot*, Jérôme Creel**, Paul HubertSciences Po, OFCE, Paris France
WHY DOES THE RECOVERY SHOW SO LITTLE INFLATION?1
* & Université Paris Nanterre.
** & ESCP Europe.
1.This document has been pre-pared for the Monetary Dialogue of 26 February 2018 between the European Parliament Committee on Economic and Monetary Affairs and the ECB.
Low inflation despite economic recovery has given rise to the puzzle of “missing inflation”. Yet there would be no puzzle if the recovery is incomplete. While GDP is on the rise, some slack may still be present in some countries of the euro area. Against this backdrop, we investigate the empirical determinants of inflation and we investi-gate their relative contributions to actual inflation since 2000 to explain why inflation is currently low.
Drawing on empirical estimations, we explain the dynamics of inflation since 2000 by different cyclical and structural factors. We also introduce an indicator of both conventional and unconventional monetary policies to assess the direct incidence of ECB's policies on actual inflation. All these factors explain the bulk of inflation variance since 2000. The most important determinants of inflation in the euro area are inflation expectations and wage growth. Both indicators have contributed negatively to infla-tion since 2014 but inflation expectations less so since 2015 whereas the contribution of wage growth has remained constant.
Drawing on evidence of uneven recovery across euro area Member States, it shall be recommended to keep on pursuing the expansionary stance of monetary policy until the ECB achieves its inflation objective. Moreover, the evolution of inflation and its determinants do not meet the conditions that the ECB regarded as genuine progress towards its policy objective. Inflation has not yet happened and is not expected in the medium-run; moreover, without second-round effects on wages, it is not yet possible to expect that once inflation goes back to target, it will be self-sustained.
The features of the ongoing developments in wage-price inflation suggest a decrease in the nominal anchor. The recent structural reforms may have put a drag on the ability of the ECB to reach its inflation target rapidly. The timing of structural reforms is important. They may be helpful at fostering innovation and productivity provided they are implemented after economic growth has been sustained and evenly distributed across the Member states, and after inflation has reached its medium-run objective.
The economic growth rate in the euro area accelerated between 2016 and 2017, hence showing signs of recovery, but consumer inflation remained subdued and unemployment rates declined only slowly. While real GDP has increased by 2.8% at the end of 2017, the EA headline inflation rate still evolves around 1.4% (see Figure 1). The question of why inflation does not increase together with the economic recovery becomes more and more topical. This question is even more acute for core inflation which measures the growth rate of prices when the most volatile components are excluded: it was still evolving below 1% at the end of 2017. It seemingly weakens one of the macroeconomic relationships which is at the foundations of (short-run) economic policies, the Phillips curve, which links inflation to output growth.
Questions about the reliability of the Phillips curve emerged during the crisis when despite economic slack, disinflation was “missing”. During the recovery, the puzzle seems to remain: though the unemployment rate has been declining, there are no signs of accelerating inflation, hence a situation of “missing inflation”.
Different factors have been invoked to explain the weakness in price dynamics. Some of them are related to cyclical economic factors whereas others are more struc-tural (e.g. Mojon and Ragot, 2018). In this policy brief, we assess the role of the main determinants of inflation to provide some insights on the current weakness of inflation. Besides, we also take into account the possibility that the structure of the economy and the way inflation is determined has changed, and also the fact that the effect of the current monetary stimulus on inflation is less strong than expected.
In the remainder of this policy brief, we give an answer to the three following ques-tions. First, how can we characterize the recent GDP growth: is it strong and evenly distributed across Member States, and what are the consequences on the unemploy-ment rate? Second, what are the key determinants of inflation in the euro area: are they cyclical, structural or related to monetary factors? Third, have they changed and if yes, how and when?
We are then able to shed some light on the effectiveness of ECB monetary policy at pushing up inflation and supporting economic activity.
Buoyant growth but subdued inflationRecent statistics on the economic situation in the euro area suggest that recovery is
now sustained. In 2017Q4, GDP growth in the euro area has reached 2.7% compared with the fourth quarter of 2016, a performance not observed since the second quarter of 2011. At this time, the recovery was short-lived and euro area then experienced the second dip of the Great recession. Forecasts for 2018 suggest that the recovery would continue. According to the latest IMF forecasts, GDP growth would reach 2.2%. More-over, the ongoing recovery is now generalized to all EMU countries. In 2017Q3, the year-on-year GDP growth has reached 2.8%, 2.3%, 1.7% and 3.1% in the four main euro area countries: Germany, France, Italy and Spain respectively. Even those coun-tries in which growth was lagging behind have now escaped from the recession and record a positive growth: 1.3% for Greece and 2.5% in Portugal.
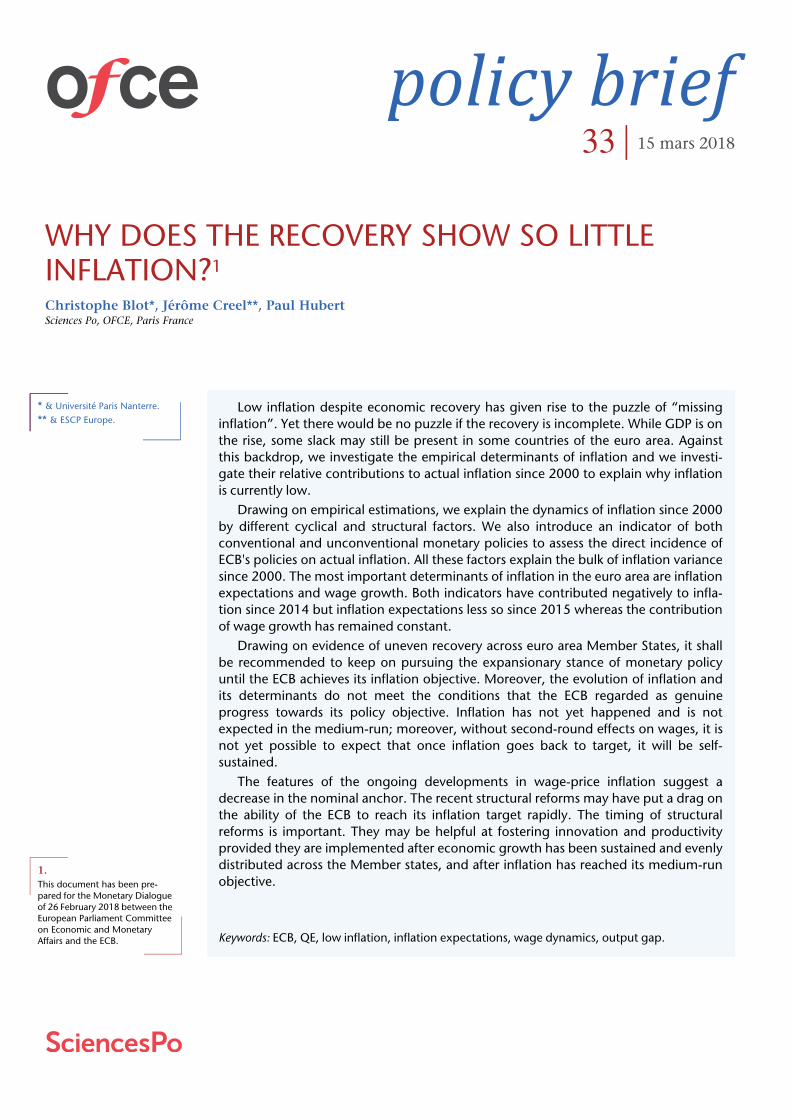
However, the economic slack remains significant in some countries as suggested by the OECD estimates for the output gap. Not all countries have fully recovered from the crisis. The output gap is still negative in Finland, France, Italy, Luxembourg, Portugal, Spain and especially in Greece where it is estimated at -11.1% (Figure 1). Besides, ten years after the outbreak of the crises, the euro area GDP is only 7% above its pre-crisis
OFCE policy brief | 3
2.The relationship between economic growth and the unemployment rate is called the Okun’s law.
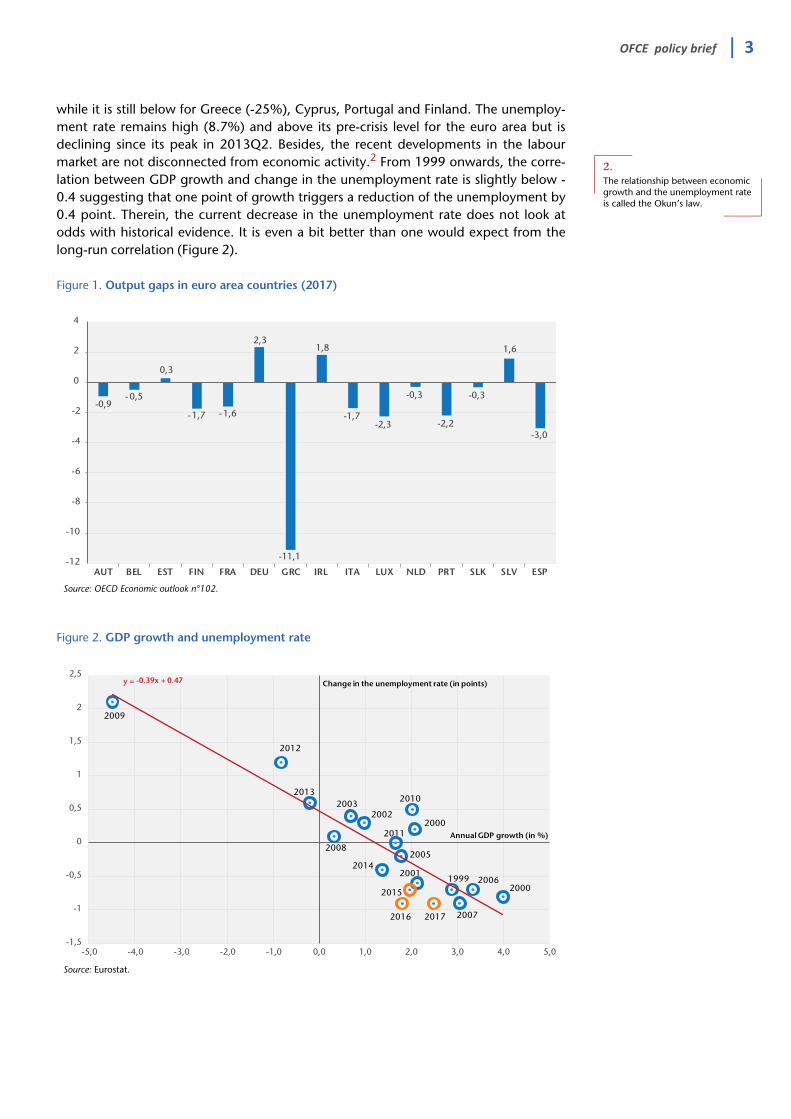
while it is still below for Greece (-25%), Cyprus, Portugal and Finland. The unemploy-ment rate remains high (8.7%) and above its pre-crisis level for the euro area but is declining since its peak in 2013Q2. Besides, the recent developments in the labour market are not disconnected from economic activity.2 From 1999 onwards, the corre-lation between GDP growth and change in the unemployment rate is slightly below -0.4 suggesting that one point of growth triggers a reduction of the unemployment by 0.4 point. Therein, the current decrease in the unemployment rate does not look at odds with historical evidence. It is even a bit better than one would expect from the long-run correlation (Figure 2).
Figure 1. Output gaps in euro area countries (2017)
Source: OECD Economic outlook n°102.
Figure 2. GDP growth and unemployment rate
Source: Eurostat.
-0,9 -0,5
0,3
-1,7 -1,6
2,3
-11,1
1,8
-1,7 -2,3
-0,3
-2,2
-0,3
1,6
-3,0
-12
-10
-8
-6
-4
-2
0
2
4
AUT BEL EST FIN FRA DEU GRC IRL ITA LUX NLD PRT SLK SLV ESP
y = -0.39x + 0.47
-1,5
-1
-0,5
0
0,5
1
1,5
2
2,5
-5,0 -4,0 -3,0 -2,0 -1,0 0,0 1,0 2,0 3,0 4,0 5,0
2009
2012
2013
2008
20032002
20002006
2007
1999
20172016
2014
20112000
2010
2001
2015
2005
Change in the unemployment rate (in points)
Annual GDP growth (in %)
4 | OFCE policy brief
3.More precisely, according to the Governing council, « Price stability is defined as a year-on-year increase in the Harmonised Index of Consumer Prices (HICP) for the euro area of be-low 2% ».
The euro area recovery is therefore still under way and is accompanied by a reduc-tion in the unemployment rate. At first sight, it comes yet as no surprise if inflation is still moderate.
Yet, one may wonder why inflation is not converging faster towards 2% – the ECB target3 – after the central bank has taken measures to increase inflation and boost economic activity. Since 2014, policy rates have been cut, and a negative interest rate policy for the interest rate on deposit facilities has been implemented. The ECB has also launched the asset purchase programme (APP) through which it notably purchases sovereign bonds on a large scale. Since the implementation of these policies, headline inflation has remained close to zero in 2014 and 2015, due notably to decreasing energy prices. Since the summer 2017, headline inflation has stood close or below 1.5% (1.3% in January 2018 according to the Eurostat flash estimate). The dynamics of headline inflation may be partly driven by energy prices but looking at core inflation, which excludes the volatile components – notably energy and food – gives more or less the same range. Since the end of 2013, core inflation has stalled around 1% (Figure 3). Consequently, and at first glance, it seems that neither the improvement of economic situation nor the monetary policy measures have been effective at driving inflation up to the 2% target.
Those hypotheses will be assessed in the following section by estimating equations relating inflation to cyclical and structural factors. Before providing in-depths analyses, we first propose a description of the main features of inflation in the euro area.
First, although inflation and notably core inflation are low with regard to past histor-ical experience, it is not the first episode of low inflation. Core inflation is generally decreasing when the unemployment rate increases. Moreover one episode during which core inflation has declined whereas economic activity was improving and the unemployment rate was decreasing occurred between January 1997 and May 2000 (Figure 4). The current situation is then very close to the situation of the beginning of the year 2000. The unemployment was close to 9% and core inflation close to 1%. The current situation is not that exceptional except that the stance of monetary policy was not as much expansionary in 2000 as in the late 2010s.
Figure 3. Headline and core inflation in the euro area
4.Figure A in the appendix shows the levels of headline and core inflation in 2017 for all euro area countries.
Looking at the situation country by country, most of euro area countries are charac-terized by low inflation. In 2017, Ireland recorded the lowest headline and core inflation rates: 0.3% and 0.2% respectively.4 In Germany, despite a low unemploy-ment rate, headline inflation reached 1.7% in 2017 while core inflation was at 1.3%. A simple cross-country analysis shows that countries with higher level of output gap record higher core inflation. The slope of the relationship is nevertheless weak (Figure 5). Almost all euro area countries are therefore characterized by this low infla-tion environment even if inflation is generally higher in countries where recovery has started earlier and has been stronger.
Figure 4. Core inflation and unemployment rate in the euro area
Source: Eurostat.
Figure 5. Output gap and core inflation in euro area countries (2017)
Finally, one might wonder whether low inflation stems from weak inflation in services and/or in (non-energy) industrial goods. As illustrated in Figure 6, inflation is always lower for goods than for services. In both cases, the level of inflation at the end of 2017 is below the historical average. For industrial goods, it has remained below but close to its average. For services, there is a downward trend since 2013. While prices of services grew above 3% until 2008, their growth has significantly declined since then. Recent figures indicate that prices of services grow at a rate close to 1% so that it seems to be the main factor driving inflation in the recent period.
Several issues arise from this descriptive analysis:
1. To what extent do cyclical factors and persistent economic slack explain lowinflation?
2. Has the relationship between economic activity and inflation changed recently?Inflation might be less responsive to activity, hence explaining why it has remainedsubdued despite the on-going recovery.
3. Has expansionary monetary policy been ineffective at stimulating inflation?
4. Has low inflation been related to structural factors?
How do we explain the weakness of inflation in the euro area?
The recent evaluation of the Phillips curve by Blanchard (2016) has shown high residuals which signal an omitted-variable bias. Consequently, we choose to enlarge the scope for macroeconomic determinants of inflation beyond the usual determinants of the Phillips curve. To assess the different hypotheses presented above, we therefore propose to estimate a model of inflation determination that includes variables capturing three different types of factors: cyclical, structural and monetary factors.
We estimate a simple linear model, using ordinary least squares (OLS), on euro area aggregate data from 2000 to 2017 at a monthly frequency. Data series are taken from the ECB database and Eurostat. These series are:
Figure 6. Industrial goods and services
Source: Eurostat.
-1,0
0,0
1,0
2,0
3,0
4,0
5,0
6,0
Non Energy industrial goods
Services
Non Energy industrial goods (avg)
Services (avg)
1997 2002 2007 2012 2017
OFCE policy brief | 7
5.Mojon and Ragot (2018) attribute re-cent weak inflation to an ongoing la-bor supply shock due to the participation rate of workers be-tween 55 and 64.
■ cyclical factors ❏ inflation expectations 1-year ahead ❏ oil prices ❏ wage growth ❏ the Euro/Dollar exchange rate ❏ the output growth gap
■ structural factors ❏ potential growth ❏ the natural interest rate ❏ the trend in the employment rate ❏ the overall stance of ECB monetary policies
The theoretical and empirical literature has shown that inflation expectations are supposed to have a positive effect on inflation. On the one hand, price setters would like to protect against increases in their costs. On the other hand, employees would seek to protect the purchasing power of their nominal wage and adjust them upward when they expect higher inflation. The importance attributed to the anchoring of expectations (e.g. Coibion and Gorodnichenko, 2015; Coibion, Gorodnichenko and Kamdar, 2017; Hubert and Le Moigne, 2016; Hasenzagl et al., 2018) contribute to resolving the so-called puzzles of “missing disinflation” and “missing inflation”. Oil prices are also expected to have a positive effect on inflation through the energy consumption bill for both households and firms. Wage growth and prices are also supposed to be positively linked as firms will want to protect their margins and will try to adjust their prices to the wage costs. An increase in the euro/dollar exchange should have a negative effect on prices as it reduces the price of imported goods. The variable measuring the slack of the economy in the inflation equation has taken many forms in the literature, from the mere difference between the unemployment rate and the natural rate of unemployment (Blanchard, 2016) to the labour’s share of income (Gali and Gertler, 1999). As a measure of slack, we use the output growth gap, which is the difference between actual GDP growth and potential growth. It indicates the degree of economic tensions and whether economy is under or over its natural rate of growth, so it is expected to be positively related to prices.
On the side of structural factors, potential growth measured as the long-term trend in growth is supposed to reduce inflation because a higher value for the natural rate of growth means that the equilibrium point of labour or goods and services markets is higher. The same reasoning applies to the long-term trend in the employment rate, which is the ratio of the employed workers to the working age population and meas-ures the degree of participation of the population to the labour force.5 Finally, the natural interest rate (here measured as the long-term trend in 10-year government bond yields), indicates the level of interest rate that supports the economy at full employment/maximum output while keeping inflation constant. So a higher natural interest rate should decrease inflation.
In a simple model like this, it is difficult to interpret the parameter between the monetary policy instrument and inflation. This coefficient measures both the reaction of policymakers to inflation (which should be positive) and the effect of monetary policy on inflation (which should be negative). However, we do include this variable in the model to capture the correlation (and double causality) between these two variables. The monetary policy stance is measured by the shadow rate estimated by Krippner (2013, 2014), which encompasses various monetary dimensions and represents the level of both conventional and unconventional monetary policy tools into a single vari-able expressed in interest rate space. This is equivalent to an implicit interest rate set by
8 | OFCE policy brief
6.A recent analysis from the Banque de France suggests that the slope of the Phillips curve – the effect of the out-put gap on the inflation rate – is weak but has not significantly declined over the recent period (see Banque de France, 2018).
the ECB and taking into account the unconventional monetary measures and the effect of central bank communication (the forward guidance policy for instance).
To account for a potential change in the parameters of the relationship between inflation and its determinants, we estimate the model over the full sample – from January 2000 to December 2017 – and over a shorter period starting in July 2012 after the “Whatever it takes” claimed by Mario Draghi. It signalled that the ECB stood ready to purchase assets issued by fragile countries if needed.
The first column of table shows the coefficients of the model estimated from 2000 to 2017. The model explains a large part (83%) of the inflation variance over the period, which suggests that the model and the variable included are relevant for this analysis. In addition, all variables are significant and have the expected signs. Inflation expectations, oil prices, wage growth, the output gap, and the shadow rate have posi-tive effects on inflation, while the euro/dollar exchange rate, the potential growth rate of the economy, the natural rate of interest and the trend in the employment rate have negative effects.
The second column of table shows the coefficients estimated on the most recent sample period. Results should be interpreted with caution because they rely on a small number of observations (63). The model explains 90% of the variance of inflation over this period. Though standard errors may differ (in part because of the smaller number of degrees of freedom), point estimates are qualitatively similar in most cases. This is especially true for cyclical factors.6 However, coefficients associated to structural factors, which effects were negative over the full sample, are muted over the most recent period or even positive in the case of the trend in the employment rate.
Table. Estimates of the model for CPI determination
(1) (2)
2000-2017 2012-2017
CPI CPI
exp1y 1.948*** 2.121***[0.18] [0.34]
oil 0.011*** 0,003[0.00] [0.00]
wages 0.908*** 1.503***[0.16] [0.47]
eurodol -1.318*** -1,522[0.34] [0.94]
gap 0.185*** 0,085[0.03] [0.17]
krippner 0.385*** 0.511***[0.13] [0.12]
potential -0.252*** 0,008[0.05] [0.20]
rstar -0.220*** 0,027[0.05] [0.23]
trend_emprate -0.087** 0.176*[0.04] [0.10]
constant 4.912** -13.993*[2.26] [7.05]
N 210 63R² 0,83 0,90
Standard errors in brackets. * p < 0.1, ** p < 0.05, *** p < 0.01.
OFCE policy brief | 9
Based on these parameter estimates, we compute the average contribution of each variable to CPI and the marginal contribution at each date during the sample in ques-tion. Figure 7 shows that, among the cyclical factors, inflation expectations and wage growth are the ones explaining most of the subdued dynamics of inflation over the most recent period. For instance, in 2015, inflation expectations pushed down inflation by almost 1.5%. Low inflation in the euro area would then mainly be explained by the weakness of wage growth and low inflation expectations. It might reflect the lack of a nominal anchor. It must be stressed though that the negative contribution of inflation expectations to actual inflation has declined since 2015 whereas the contribution of wage growth has increased in absolute value. This could highlight a lower pass-through from inflation expectations to wages.
Figure 7. Contribution of cyclical factors to CPI
Source: authors’ computations.
−1.5
0
1.5
2000 2002 2004 2006 2008 2010 2012 2014 2016 2018
Contribution to CPI − Euro/Dollar exchange rate
−1.5
0
1.5
2000 2002 2004 2006 2008 2010 2012 2014 2016 2018
Contribution to CPI − Expected inflation 1−year ahead
−1.5
0
1.5
2000 2002 2004 2006 2008 2010 2012 2014 2016 2018
Contribution to CPI − Output gap
−1.5
0
1.5
2000 2002 2004 2006 2008 2010 2012 2014 2016 2018
Contribution to CPI − Oil prices
−1.5
0
1.5
2000 2002 2004 2006 2008 2010 2012 2014 2016 2018
Contribution to CPI − Wage growth
10 | OFCE policy brief
Figure 8 shows the equivalent marginal contribution for structural factors. While the contribution of potential growth and employment rate are negative and small, the contribution of the natural rate of interest is positive. The latter therefore tends to push inflation up.
Finally, Figure 9 shows the contribution of ECB policies measured with the shadow rate. First, the order of magnitude of the contribution to inflation is small compared to inflation expectations or wage growth. Second, the contribution is positive but decreasing over the last year or so. The effect of monetary policies could also be seen through the effect of inflation expectations on inflation, but here again (as shown in Figure 6), the effect on inflation has been negative. Overall, the effectiveness of mone-tary policies in pushing inflation back to its target may be questioned.
Figure 8. Contribution of structural factors to CPI
Source: authors’ computations.
Figure 9. Contribution of ECB policies to CPI
Source: authors’ computations.
−1.5
0
1.5
2000 2002 2004 2006 2008 2010 2012 2014 2016 2018
Contribution to CPI − Potential growth
−1.5
0
1.5
2000 2002 2004 2006 2008 2010 2012 2014 2016 2018
Contribution to CPI − Trend in employment rate
−1.5
0
1.5
2000 2002 2004 2006 2008 2010 2012 2014 2016 2018
Contribution to CPI − Natural interest rate
−1.5
0
1.5
2000 2002 2004 2006 2008 2010 2012 2014 2016 2018
Contribution to CPI − ECB shadow rate (Krippner)
OFCE policy brief | 11
Conclusions and policy recommendationsThe euro area has entered a period of sustained recovery since 2015 which results in
higher GDP growth and declining unemployment rates. Meanwhile, monetary policy has been very expansionary since the ECB engaged in a quantitative easing. Although accelerating growth coincides with the measures taken by the central bank, inflation remains muted.
Empirical analysis suggests that though inflation is weak, it is not fully at odds with historical evidence on the relationship between economic activity and prices. Economic slack remains significant in some euro area countries and curbs the euro area inflation.
Drawing on evidence of uneven recovery across euro area Member States, it shall be recommended to keep on pursuing the expansionary stance of monetary policy until the ECB achieves its inflation objective. Though there is weak evidence of direct impact of monetary policy on inflation, indirect impact may be important via two channels: the anchoring of expectations and second-round effects.
Our analysis suggests that the weakness of inflation mainly stems from low expected inflation, notably from 2014 to 2016. It also suggests that wage growth has been too moderate to stimulate higher price inflation, hence monetary policy has not had second-round effects on wages. The evolution of inflation and its determinants do not meet the conditions that the ECB regarded as genuine progress towards its policy objective. Inflation has not yet happened and is not expected in the medium-run.
The features of the ongoing developments in wage-price inflation suggest a decrease in the nominal anchor. While it may seem that monetary policy has not had the expected effectiveness on the anchoring of inflation expectations, it may well be that its effects were offset by other policies. The recent push in favour of labour market deregulation and competitiveness policies may have contributed to lower wage growth and to the decline in the nominal anchor. Such a movement may put a drag on the ability of the ECB to reach its inflation target rapidly. An appropriate timing for reforms may be helpful at generating long-run growth (IMF, 2016, chapter 3) while delivering the inflation target: structural reforms in the euro area may be helpful at fostering innovation and productivity provided they are implemented after economic growth has been sustained and evenly distributed across the Member states, and after inflation has reached its medium-run objective.
References
Banque de France, 2018, “La courbe de Phillips existe-t-elle encore ?”, Rue de la Banque n° 56.
Blanchard Olivier, 2016, “The US Phillips Curve: back to the 1960s?”, Policy brief, Peterson Institute for International economics, PB16-1, January.
Coibion Olivier and Yuri Gorodnichenko, 2015, “Is the Phillips curve alive and well after all? Inflation expectations and the missing disinflation”, American Economic Journal: Macroe-conomics, 7, 197-232.
Coibion Olivier, Yuri Gorodnichenko and Rupal Kamdar, 2017, “The Formation of Expecta-tions, Inflation and the Phillips Curve”, NBER Working Papers 23304, National Bureau of Economic Research.
Gali Jordi and Mark Gertler, 1999, “Inflation dynamics: A structural econometric analysis”, Journal of Monetary Economics, 44(2): 195-222,
Hasenzagl Thomas, Filippo Pellegrino, Lucrezia Reichlin, and Giovanni Ricco, 2018, “A Model of the Fed’s View on Inflation”, Sciences Po OFCE Working Paper, 03, 2018-01-16.
Directeur de la publication Xavier RagotRédacteur en chef du blog et des Policy bRéalisation Najette Moummi (OFCE).
Hubert Paul and Mathilde Le Moigne, 2016, “La désinflation manquante: un phénomène américain uniquement?”, Manuscript OFCE, April.
IMF, 2016, World economic outlook, April.
Krippner Leo, 2013, “Measuring the stance of monetary policy in zero lower bound envi-ronments”, Economics Letters, 118(1): 135-138.
Krippner Leo, 2014, “Measuring the Stance of Monetary Policy in Conventional and Unconventional Environments”, Centre for Applied Macroeconomic Analysis Working Paper, 6/2014.
Mojon Benoit and Xavier Ragot, 2018, “The labor supply of baby?boomers and low-flation”, Sciences Po OFCE Working Paper, 09, 2018-01.
ANNEX
Figure A. Inflation in euro area countries
Source: Eurostat.
0
0,5
1
1,5
2
2,5
3
3,5
4
All-items HICP Overall index excluding energy, food, alcohol and tobacco ECB target
Pour citer ce document : Christophe Blot, Jérôme Creel, Paul Hubert, « Why does the recovery show so little inflation? »,
OFCE policy brief 33, 15 mars
riefs Guillaume Allègre
2271-359X. All Rights Reserved.
www.ofce.sciences-po.fr @ofceparis
Observatoire français des conjonctures économiques l Centre de recherche en économie de Sciences Po10, place de Catalogne l 75014 Paris l Tél/ 01 44 18 54 00