Why is voluntary financial education so unpopular? Experimental evidence from Mexico Miriam Bruhn, World Bank Gabriel Lara Ibarra, World Bank David McKenzie, World Bank Understanding Banks in Emerging Markets EBRD, September 5, 2013 All opinions expressed in this work are those of the authors alone and do not necessarily represent those of the World Bank or the partnering institutions.
Transcript
Why is voluntary financial education so unpopular?
Experimental evidence from Mexico
Miriam Bruhn, World Bank Gabriel Lara Ibarra, World Bank
David McKenzie, World Bank
Understanding Banks in Emerging Markets EBRD, September 5, 2013
All opinions expressed in this work are those of the authors alone and do not necessarily represent those of the World Bank or the partnering institutions.
Why care about financial education?
• Levels of financial literacy tend to be low in developed and developing countries (Xu and Zia, 2012)
• Lower financial literacy is associated with – Lower savings
• Lusardi and Mitchell (2009), Klapper and Panos (2011) – Less responsible borrowing behavior
• Lusardi and Tufano (2008) – Higher probability of mortgage delinquency and default during
the subprime mortgage crisis • Gerardi, Goette, and Meier (2010)
– Lower probability of strategic default post-crisis • Burke and Mihaly (2012)
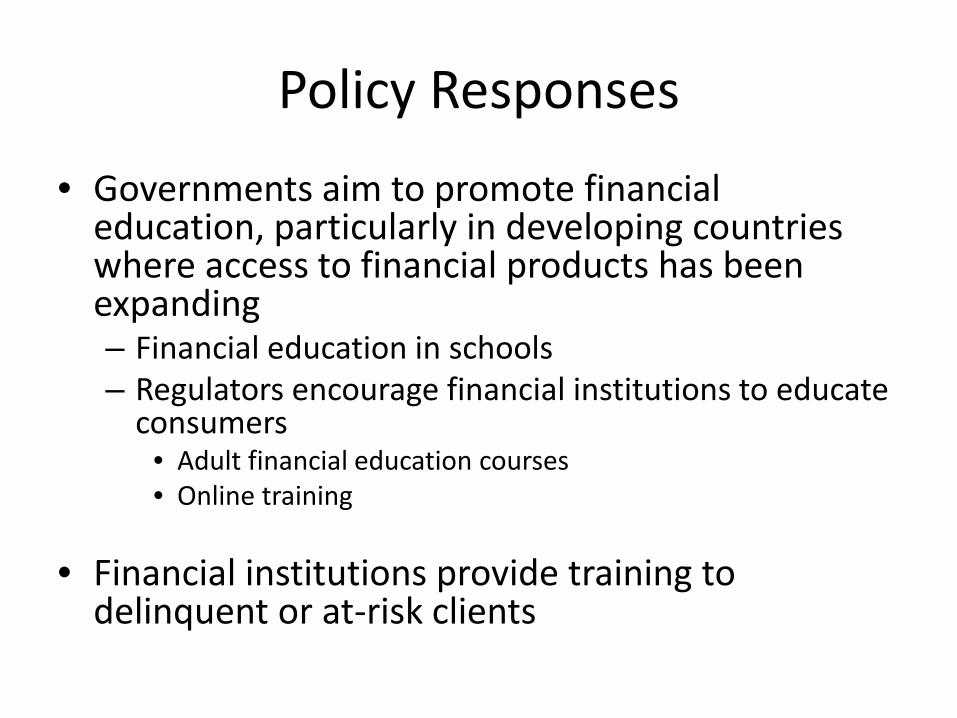
Policy Responses
• Governments aim to promote financial education, particularly in developing countries where access to financial products has been expanding – Financial education in schools – Regulators encourage financial institutions to educate
consumers • Adult financial education courses • Online training
• Financial institutions provide training to delinquent or at-risk clients
Impact of Financial Education
• School financial education seems to increase savings (to some extent) – Bernheim et al. (2001), Bruhn et al. (2013)
• General purpose adult training courses tend to
have only small effects on financial behavior – Effects are larger for subgroups (low ex-ante literacy)
or when training is provided “at a teachable moment” • Duflo and Saez (2011), Cole, Sampson, and Zia (2009),
Gibson, McKenzie, and Zia (2012), Doi, McKenzie, and Zia (2012), and Seshan and Yang (2012)
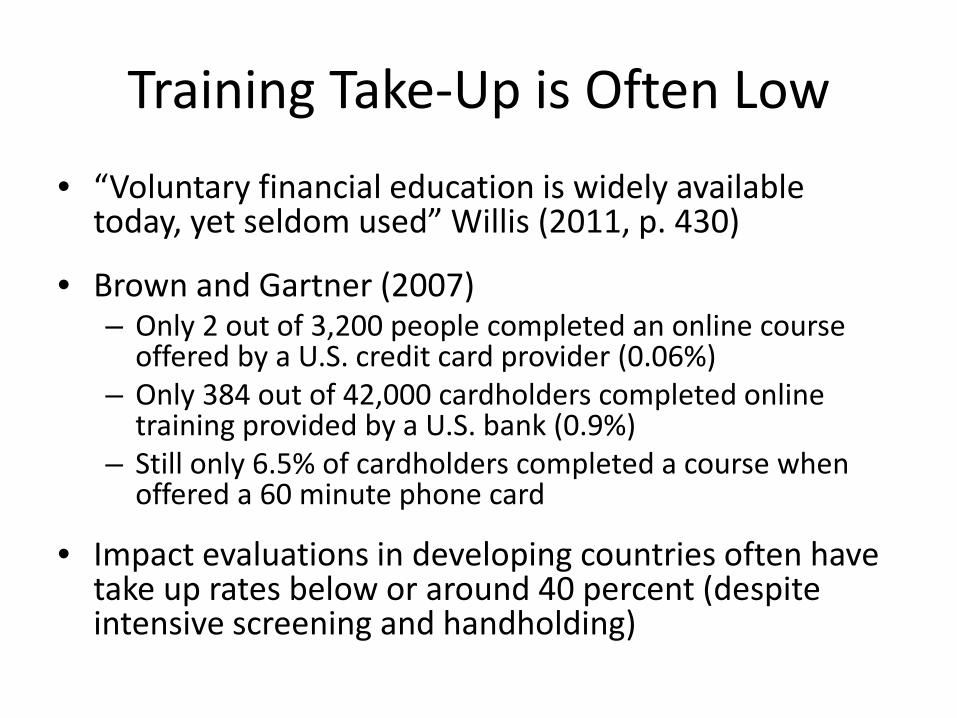
Training Take-Up is Often Low • “Voluntary financial education is widely available
today, yet seldom used” Willis (2011, p. 430)
• Brown and Gartner (2007) – Only 2 out of 3,200 people completed an online course
offered by a U.S. credit card provider (0.06%) – Only 384 out of 42,000 cardholders completed online
training provided by a U.S. bank (0.9%) – Still only 6.5% of cardholders completed a course when
offered a 60 minute phone card
• Impact evaluations in developing countries often have take up rates below or around 40 percent (despite intensive screening and handholding)
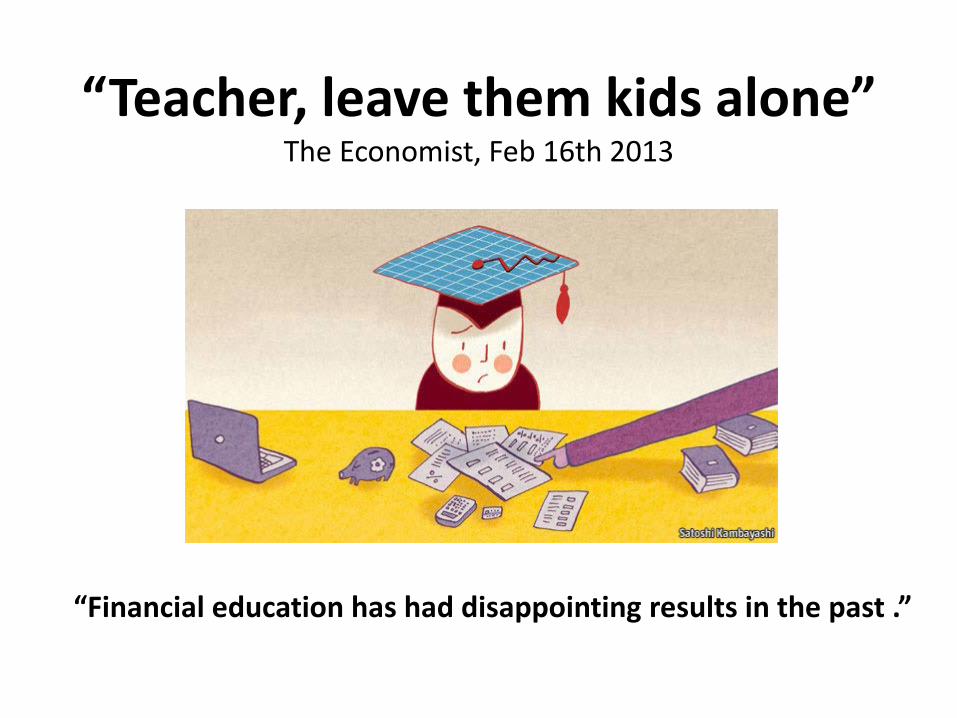
“Teacher, leave them kids alone” The Economist, Feb 16th 2013
“Financial education has had disappointing results in the past .”
Our Paper
• Collaborate with a financial institution that provides a widely accessible training course in Mexico City
• Conduct randomized experiments to investigate the following questions – Are there economic or behavioral constraints which
prevent more individuals from participating in financial education programs?
– Are there any benefits to these marginal individuals from doing so, or are they rationally choosing not to participate in such training?
Preview of Results
• Training take-up seems to be low due to low benefits
• Find no evidence that time-inconsistency, high discount rates, high transportation costs or uncertainty about benefits influence take-up
• The training increases financial knowledge, but has only a temporary effect on savings and no effect on borrowing behavior for individuals who need to be incentivized to attend the training
Outline
• Financial literacy training course
• Experimental design and study sample
• Take-up and reasons for low attendance
• Follow-up data collection
• Impact of training on financial knowledge, behavior, and outcomes
Financial Literacy Training Course
• Large-scale program offered free of charge – Several locations in Mexico City
• Classrooms with capacity for 20 participants
– Two sessions per day (Monday – Saturday)
• Sessions often not filled to capacity – About 0.6 percent of Mexico City’s adult
population takes the course each year
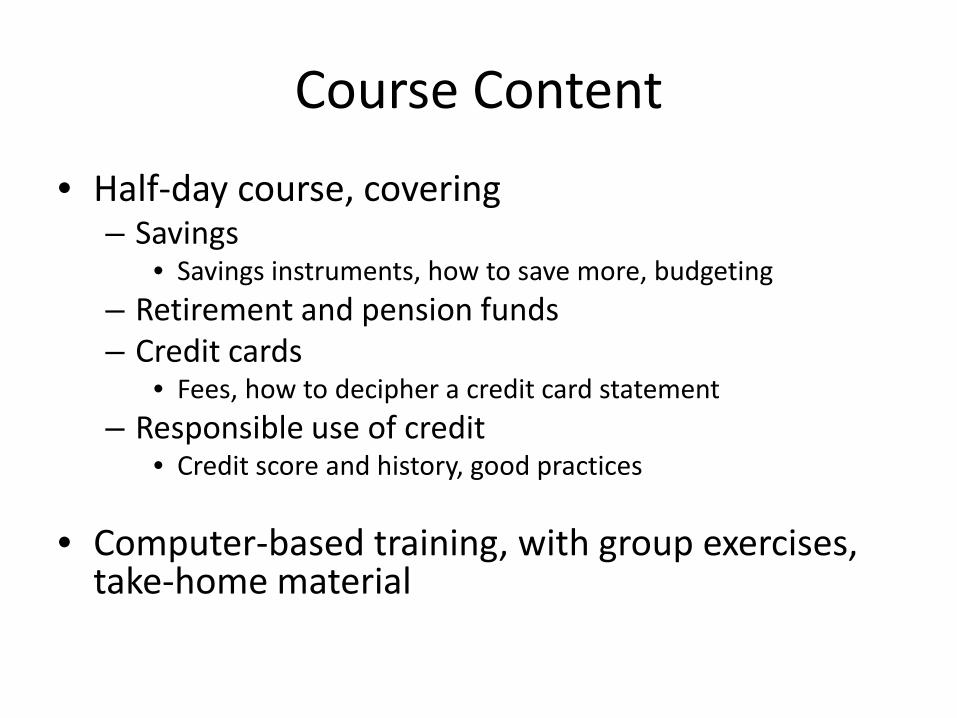
Course Content
• Half-day course, covering – Savings
• Savings instruments, how to save more, budgeting – Retirement and pension funds – Credit cards
• Fees, how to decipher a credit card statement – Responsible use of credit
• Credit score and history, good practices
• Computer-based training, with group exercises, take-home material
Outline
• Financial literacy training course
• Experimental design and study sample
• Take-up and reasons for low attendance
• Follow-up data collection
• Impact of training on financial knowledge, behavior, and outcomes
Experimental Design
• Randomized encouragement design
• First, screen study sample for interest in participating in a financial education course
• Randomly assign interested individuals to either – Treatment group: Receives phone-call, inviting them
to sign up for the specific financial education course, phone reminder for attendance (+ extra incentives)
– Control group: Receives no invitation to the course
Screener Survey I: Mailing Campaign
• Collaborated with a financial institution to send screener survey to 40,000 clients in Mexico City
• Letter + two-page survey with pre-paid return envelope (+ phone and online option) – Expected response: 800 – 1,200, based on typical
• Created Facebook page for financial literacy with link to an online survey
• Facebook ad pointing to this page was displayed 16 million times – 1,240 fans of the Facebook page – 119 survey responses
Screener Survey III: Street + Branch
• Face-to-face survey in public locations (one month) and outside branches of our partner financial institution (2 weeks)
• Completed questionnaires – 6,945 from street survey – 2,294 from branch survey – Only about 50 percent had valid contact
information (as verified by follow-up phone-calls)
Treatment Randomization
• Final sample includes 3,503 people – 1,752 treatment group – 1,751 control group
• Stratified randomization by type of screener survey, gender, education, financial institution client or not, financial behavior reported on screener survey
Outline
• Financial literacy training course
• Experimental design and study sample
• Take-up and reasons for low attendance
• Follow-up data collection
• Impact of training on financial knowledge, behavior, and outcomes
Initial Take-Up in Treatment Group
• About 60 percent of the treatment group signed up for a course session – Only 1/3 of these people actually attended,
despite phone reminders on the day before
• Overall take-up rate was 17.8 percent
Investigate reasons for low take-up
Potential Reason for Non-Attendance
• Course has no (or only small) benefits
• Assuming it has sizeable benefits, people may not attend if – Benefits accrue in the future (high discount rates) – Costs are too high (e.g. transportation) – They are uncertain about the benefits Randomly assign incentive treatments to address
and test these reasons
Experimental Interventions to Overcome Barriers to Attendance
1. US$72 gift card for completing the course
2. US$36 gift card for completing the course
3. US$36 gift card received one month after completing
the course
4. Free taxi ride to and from the course location
5. Video CD with positive testimonials from people who had attended the course
Take-Up Rates by Incentive Group
18
33
27 27
2119
21
39
32 32
2523
0
5
10
15
20
25
30
35
40
45
No extra incentive
$72 now $36 now $36 later Free transportation
Testimonials
%
Full treatment group Only individuals who could be reached
Low take-up seems to be due to low benefits, not high discount rates, high transportation costs, or uncertainty about benefits
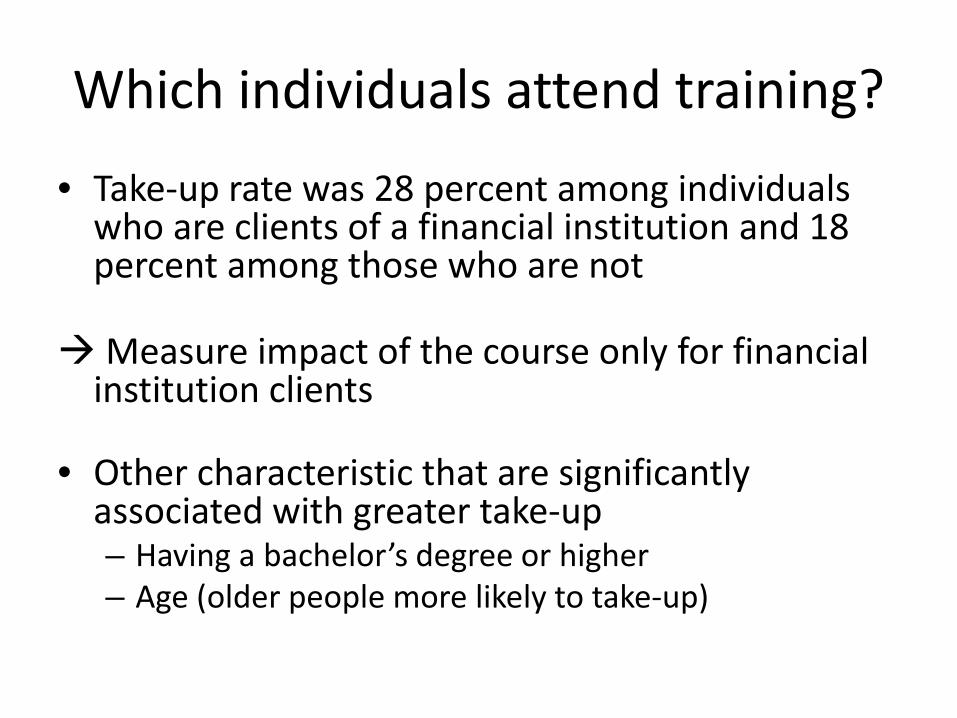
Which individuals attend training?
• Take-up rate was 28 percent among individuals who are clients of a financial institution and 18 percent among those who are not
Measure impact of the course only for financial institution clients
• Other characteristic that are significantly associated with greater take-up – Having a bachelor’s degree or higher – Age (older people more likely to take-up)
Outline
• Financial literacy training course
• Experimental design and study sample
• Take-up and reasons for low attendance
• Follow-up data collection
• Impact of training on financial knowledge, behavior, and outcomes
Follow-Up Data Collection
• 15 minute survey on financial knowledge, behavior, and outcomes – Conducted over the phone and in person if phone
interview was not possible – Attrition: 29 percent in treatment group, 25
percent in control group (sample size about 1,500) – Baseline characteristics are balanced across
treatment and control groups for people who replied
Administrative Data
• Our partner financial institution provided administrative data on their clients – 470 clients found in their database (matched by
name and address) – Due to confidentiality reasons, did not receive
individual data, but averages and medians for the treatment and control group
• Savings account balance, credit card balance, percentage of credit card debt paid off
Project Timeline
J F M A M J J A S O N D J F M A M J J
Mai l ing campaign
Facebook campaign
Street/Branch survey
Invi tation to course
Fol low-up survey
Adminis trative data
2011 2012
• Follow-up survey conducted 6-8 months after the course
• Admin data for 17 months throughout the project
Presenter
Presentation Notes
Follow-up survey conducted about 6-10 months after the workshop for most of the sample
Outline
• Financial literacy training course
• Experimental design and study sample
• Take-up and reasons for low attendance
• Follow-up data collection
• Impact of training on financial knowledge, behavior, and outcomes
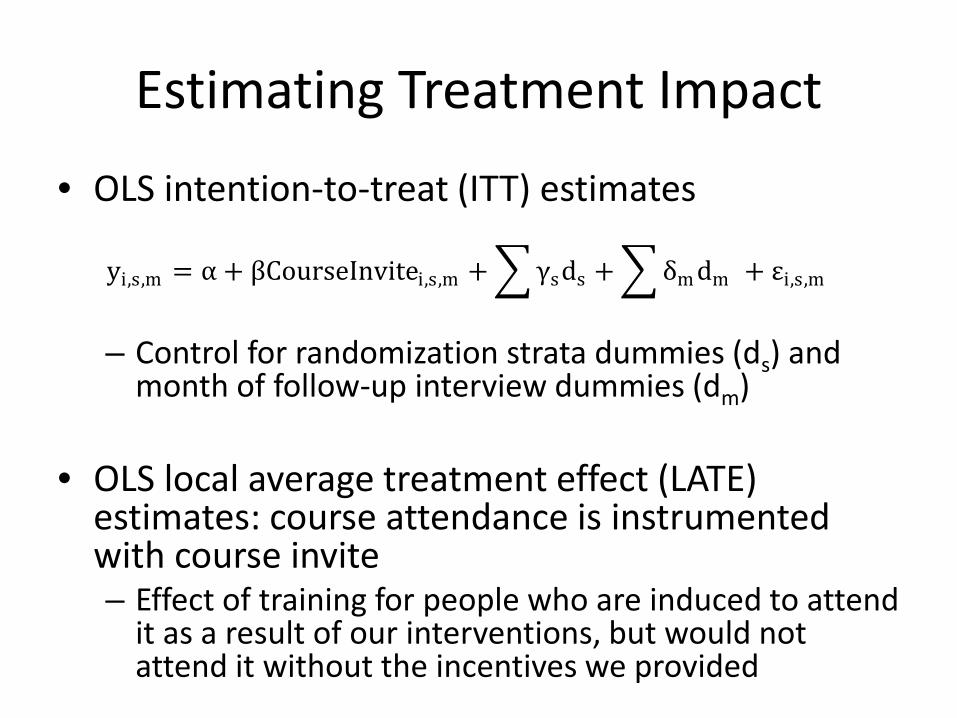
Estimating Treatment Impact
• OLS intention-to-treat (ITT) estimates
– Control for randomization strata dummies (ds) and
month of follow-up interview dummies (dm)
• OLS local average treatment effect (LATE) estimates: course attendance is instrumented with course invite – Effect of training for people who are induced to attend
it as a result of our interventions, but would not attend it without the incentives we provided
Control ITT Treatment LATE Treatment Mean Difference Difference
Knowledge index (average of 8 components below) 0.31 0.0307*** 0.0871***(0.0094) (0.0261)
(1) Knows what UDI is "Unidad de Inversion" 0.10 0.0044 0.0125(0.0150) (0.0426)
(2) Knows deposit insurance exists up to 400,000 UDIs 0.13 0.0732*** 0.2073***(0.0188) (0.0533)
(3) Knows what a credit report is 0.39 0.0518** 0.1464**(0.0245) (0.0684)
(4) Knows credit card cycle is 30 days 0.46 0.0190 0.0535(0.0251) (0.0701)
(5) Knows they have 20 days to pay credit card w/o interest 0.12 0.0143 0.0402(0.0168) (0.0472)
(6) Knows that what CAT is "Costo Anual Total" 0.24 0.0369* 0.1036*(0.0216) (0.0602)
(7) Knows what an AFORE (pension fund) is 0.72 0.0499** 0.1409**(0.0219) (0.0613)
(8) Knows retirement age is 65 0.29 0.0253 0.0714(0.0234) (0.0659)
Notes: Robust standard errors in parentheses. Statistical significance: * 10 percent, ** 5 percent, *** 1 percent.
Presenter
Presentation Notes
1 Unidad de Inversion (UDI) is an inflation adjusting currency unit. 2 Costo Annual Total (CAT) is total annual cost of credit, including all interest rates and fees
Impact on Savings Behavior Control ITT Treatment LATE Treatment Mean Difference Difference
Savings behavior index (avg.of 5 components) 0.68 0.0133 0.0376(0.0124) (0.0348)
(1) Checks bank transactions regularly 0.69 -0.0235 -0.0666(0.0226) (0.0644)
(2) Keeps track of expenses 0.79 0.0072 0.0204(0.0206) (0.0582)
(3) Makes a budget 0.77 0.0264 0.0748(0.0211) (0.0596)
(4) Has a savings goal 0.57 0.0130 0.0367(0.0250) (0.0705)
(5) Cut expenses in past 3 months 0.59 0.0428* 0.1212*(0.0247) (0.0698)
Notes: Robust standard errors in parentheses. Statistical significance: * 10 percent, ** 5 percent, *** 1 percent.
Impact on Savings Outcomes Control ITT Treatment LATE Treatment Mean Difference Difference
Savings outcomes index (avg. of 3 components) 0.65 0.0335** 0.0948**(0.0147) (0.0414)
(1) Has any type of savings1 0.80 0.0288 0.0814(0.0200) (0.0566)
(2) Saved more than zero during past 6 months 0.83 0.0293 0.0800(0.0192) (0.0524)
(3) Saves more each month than a year ago 0.36 0.0408 0.1151*
1Includes bank savings account, caja de ahorro, tanda and other non-retirement savings
Notes: Robust standard errors in parentheses. Statistical significance: * 10 percent, ** 5 percent, *** 1 percent.
Results are similar when controlling for whether the individual received a monetary incentive payment for participation in the financial literacy course
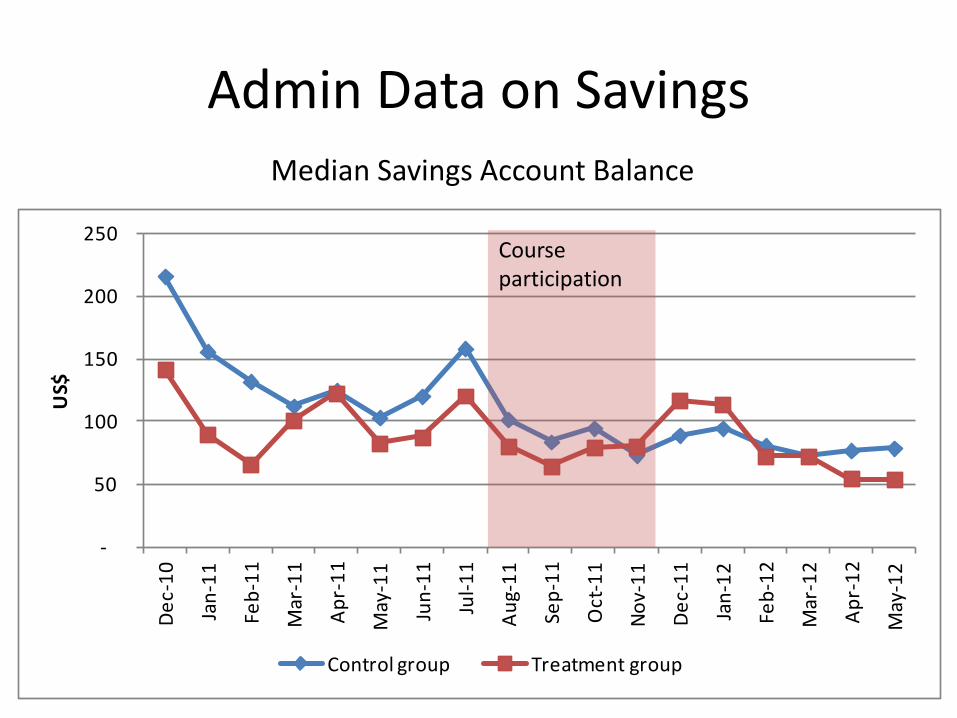
Admin Data on Savings Median Savings Account Balance
-
50
100
150
200
250
Dec-
10
Jan-
11
Feb -
11
Mar
-11
Apr-
11
May
-11
Jun-
11
Jul-1
1
Aug-
11
Sep-
11
Oct
-11
Nov-
11
Dec-
11
Jan-
12
Feb-
12
Mar
-12
Apr-
12
May
-12
US$
Control group Treatment group
Course participation
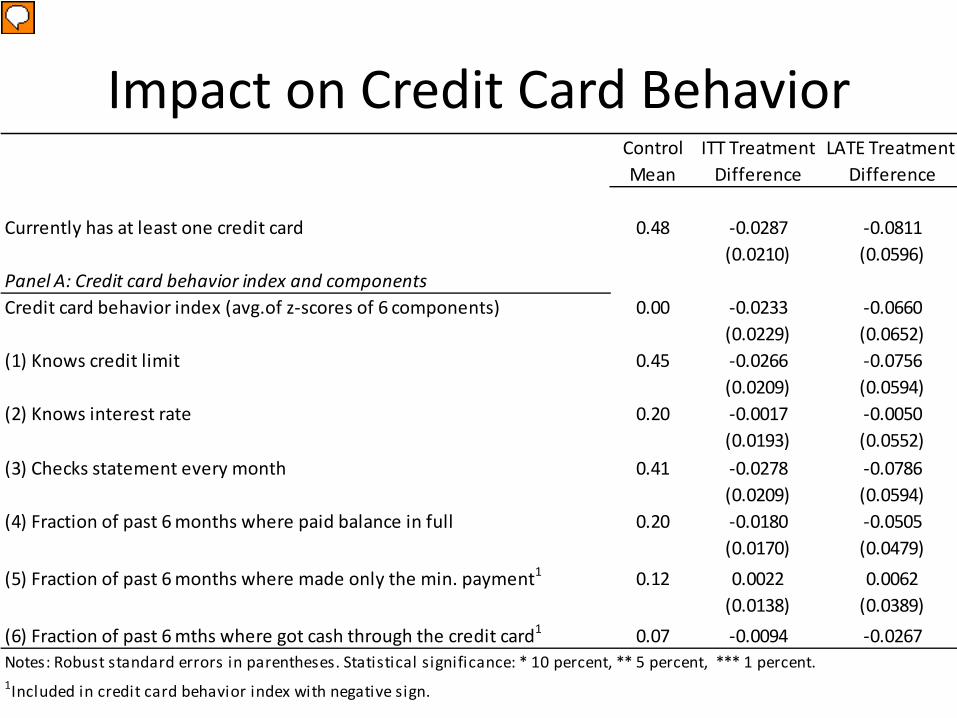
Impact on Credit Card Behavior Control ITT Treatment LATE Treatment Mean Difference Difference
Currently has at least one credit card 0.48 -0.0287 -0.0811(0.0210) (0.0596)
Panel A: Credit card behavior index and componentsCredit card behavior index (avg.of z-scores of 6 components) 0.00 -0.0233 -0.0660
(0.0193) (0.0552)(3) Checks statement every month 0.41 -0.0278 -0.0786
(0.0209) (0.0594)(4) Fraction of past 6 months where paid balance in full 0.20 -0.0180 -0.0505
(0.0170) (0.0479)(5) Fraction of past 6 months where made only the min. payment1 0.12 0.0022 0.0062
(0.0138) (0.0389)(6) Fraction of past 6 mths where got cash through the credit card1 0.07 -0.0094 -0.0267
1Included in credit card behavior index with negative sign.
Notes: Robust standard errors in parentheses. Statistical significance: * 10 percent, ** 5 percent, *** 1 percent.
Presenter
Presentation Notes
In Panel A, the variables are filled in with “0” for individuals who do not have a credit card to account for possible selection bias.
Impact on Credit Card Outcomes Control ITT Treatment LATE Treatment Mean Difference Difference
Panel B: Credit card outcomes index and componentsCredit card outcomes index (avg. of z-scores of 3 components) 0.00 0.0434 0.1228
(0.0416) (0.1184)(1) Issuer blocked credit card during past 6 months 0.04 0.0009 0.0026
(0.0096) (0.0270)(2) Fraction of past 6 mths where was charged late paymt fees 0.03 0.0102 0.0289
(0.0064) (0.0183)(3) Fraction of past 6 mths where was charged overdraft fees 0.01 0.0026 0.0075
(0.0034) (0.0098)Notes: Robust standard errors in parentheses. Statistical significance: * 10 percent, ** 5 percent, *** 1 percent.
Presenter
Presentation Notes
In Panel B, the variables are filled in with “0” for individuals who do not have a credit card to account for possible selection bias.
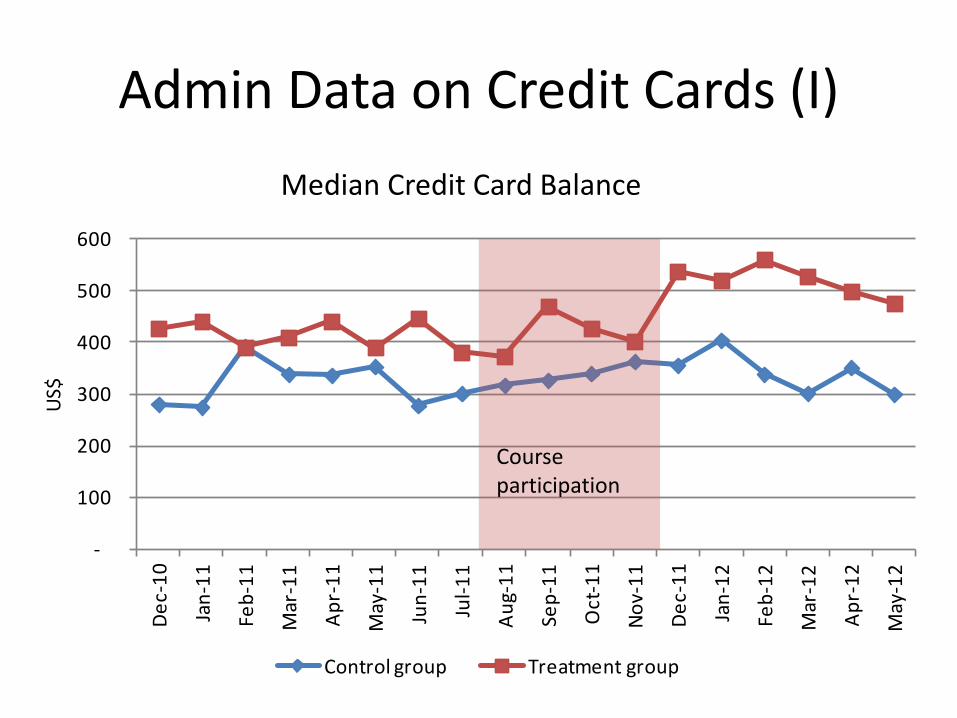
Admin Data on Credit Cards (I)
-
100
200
300
400
500
600
Dec-
10
Jan-
11
Feb-
11
Mar
-11
Apr-
11
May
-11
Jun-
11
Jul-1
1
Aug-
11
Sep-
11
Oct
-11
Nov-
11
Dec-
11
Jan-
12
Feb-
12
Mar
-12
Apr-
12
May
-12
US$
Control group Treatment group
Median Credit Card Balance
Course participation
Admin Data on Credit Cards (II)
0.0
5.0
10.0
15.0
20.0
25.0
30.0
35.0
Dec-
10
Jan-
11
Feb-
11
Mar
-11
Apr-
11
May
-11
Jun-
11
Jul-1
1
Aug-
11
Sep-
11
Oct
-11
Nov-
11
Dec-
11
Jan-
12
Feb-
12
Mar
-12
Apr-
12
May
-12
%
Control group Treatment group
Average Percentage of Credit Card Debt Paid Off Each Month
Course participation
Impact on Loan Behavior and Outcomes Control ITT Treatment LATE Treatment Mean Difference Difference
Panel A: Loan behavior index and componentsLoan behavior index (avg.of 3 components) 0.15 0.0075 0.0212
(0.0118) (0.0334)(1) Applied for a loan from any source during past 6 months 0.23 -0.0074 -0.0208
(0.0210) (0.0594)(2) Went to a pawn shop to get credit during past 6 months 0.10 0.0054 0.0152
(0.0152) (0.0429)(3) Stopped servicing outstanding debt during past 6 months 0.13 0.0205 0.0591
(0.0180) (0.0523)Panel B: Loan outcomes index and componentsLoan outcomes index (avg. of z-scores of 2 components) -0.01 -0.0132 -0.0372
(0.0427) (0.1206)(1) Currently has a loan (from any source) 0.33 -0.0058 -0.0165
(0.0234) (0.0660)(2) Total outstanding debt as percentage of annual income 15.38 -0.6563 -1.7753
(1.1899) (3.2220)Notes: Robust standard errors in parentheses. Statistical significance: * 10 percent, ** 5 percent, *** 1 percent.
Summary and Conclusion
• The financial literacy course increased financial knowledge
• Positive effect on savings is only temporary
• No effect on borrowing behavior
• Individuals who do not attend the course voluntarily seem to have little benefit from doing so
Alternative Ways of Providing Financial Education
• Course/classroom setting for the provision of financial education may not be appealing to the general public – Higher take-up for people with a bachelor’s degree
• Could provide financial education through alternative channels – Video games – Soap operas (Berg and Zia, 2013)
Baseline Data – Stratification Variables Control TreatmentMean Difference
Baseline survey conducted in branch 0.35 -0.0058Client of partner institution (vs. other institution) 0.48 -0.0010Made savings deposit during past month 0.64 0.0012Has credit card 0.41 -0.0039Paid more than credit card minimum in all past 6 months1 0.51 0.0172Has bachelor's degree or higher 0.40 0.0016Female 0.47 0.0064
Sample Size 1090 1088
Sample excludes individuals who are not clients of a financial institution 1 Conditional on having a credit card
Notes: *, **, and *** indicate statistically different from control mean at the 10, 5 and 1% levels respectively
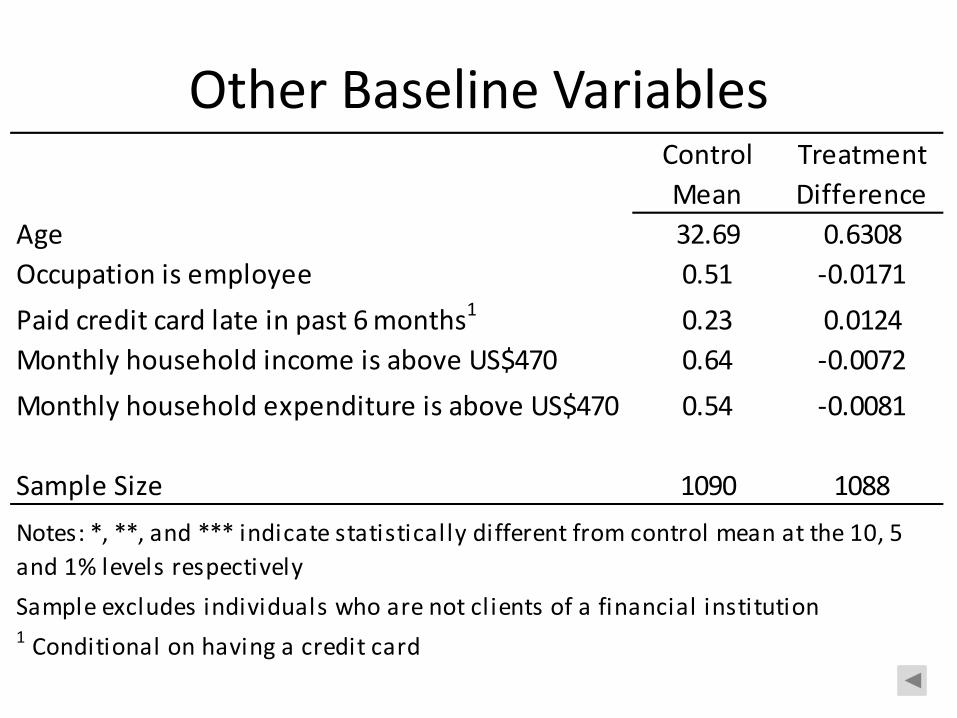
Other Baseline Variables
Control TreatmentMean Difference
Age 32.69 0.6308Occupation is employee 0.51 -0.0171Paid credit card late in past 6 months1 0.23 0.0124Monthly household income is above US$470 0.64 -0.0072Monthly household expenditure is above US$470 0.54 -0.0081
Sample Size 1090 1088
Sample excludes individuals who are not clients of a financial institution 1 Conditional on having a credit card
Notes: *, **, and *** indicate statistically different from control mean at the 10, 5 and 1% levels respectively


![Unpopular Wonders of Tea That You Should Know [Infographic]](https://static.documents.pub/doc/80x56/5a648bf17f8b9a94568b4ae7/unpopular-wonders-of-tea-that-you-should-know-infographic.jpg)


