1 Liquidity stress test and interbank contagion C. Conflitti, A. Foglia, S. Nobili (*) ECB worshop “Structural changes in money markets: Implications on monetary policy implementation” 30 September - 1 October 2013 (*) Views expressed in this presentation are those of the authors and do not necessarily reflect the opinions of the Bank of Italy
Transcript
1
Liquidity stress test and interbank contagion
C. Conflitti, A. Foglia, S. Nobili (*)
ECB worshop “Structural changes in money markets: Implications on monetary policy implementation”
30 September - 1 October 2013
(*) Views expressed in this presentation are those of the authors and do not necessarily reflect the opinions of the Bank of Italy
2
Interbank contagion studies
Interbank contagion studies ● role of direct interbank connections as a source of systemic risk ● how specific shocks are transmitted throughout the system to gauge the implications for the
overall resilience of the banking sector Traditional studies in interbank contagion
● typical shock: a given bank’s default on all of its interbank payments ● contagion mechanism: once an institution is insolvent, it fails to honor its commitments,
which in turn leads to write-offs at its counterparties (asset-driven contagion) a solvency stress test no role for liquidity effects in the contagion process (banks can face liquidity problems well before
insolvency) no contagion via funding markets and markets for liquid assets held in the counterbalancing capacity
Mixed approach (funding risk and solvency risk) ● initial shock: increased uncertainty over counterparty risk (solvency risk) ● contagion mechanism: via funding markets (counterparty risk leads banks and investors to
hoard liquidity and reduce funding in the interbank market)
“Modeling Correlated Systemic Liquidity and Solvency Risk in a Financial Environment with Incomplete Information”, Barnhill-Schumacher (2011), IMF WP/11/263
“Externalities in interbank network: results from a dynamic simulation model” Manna-Schiavone (2012), Banca d’Italia WP 893
3
Liquidity contagion models – key issues
liquidity shock: collateral depreciation loss in the market value of liquid assets affects the counterbalancing capacity (CBC)
- haircuts, market price - haircuts and market price should differentiate between asset categories
loss on CBC affects the ability to generate cash-inflows from unencumbered liquid assets and decrease the availability of funding due to an increase in collateral requirements for encumbered assets
propagation mechanism: hoarding
trigger event: liquidity hoarding propagation mechanism: through the funding network (liability-driven contagion)
banks are still solvent but are unwilling/unable to provide (further) lending to their counterparties
propagation channel: short-term funding network (liability-driven contagion) unsecured interbank relationships (deposits and certificates of deposits)
In a liquidity contagion model a liquidity shock triggers a liquidity hoarding process which propagates trough the short-term funding network
4
Liquidity contagion models – motivation/discussion “Complexity, Concentration and Contagion”, Gai-Haldane-Kapadia (2011), Journal of Monetary
Economics, 58:5, July Banks’ liquidity position and liquidity hoarding
● banks must maintain a positive liquidity position; if it becomes negative, banks react immediately to restore it
● liquidity hoarding a mitigating action: reducing unsecured interbank lending increases the bank’s liquidity
position a propagation factor: a bank calls in interbank loans and decreases other banks’ liquidity
position, causing other banks in turn to do the same (externality)
Why liquidity hoarding? ● raise interest rates on wholesale funding has negative signaling implications ● liquidating fixed assets likely to impose significant costs (fire sales) ● withdraw own lending to other banks less costly/chosen by banks during the crisis
Role of repo market activity and haircut shocks
● amplification role of collateral ● not a contagion factor (ECB full allotment policy; CCP)
5
The model – data, dynamics, vulnerability factors
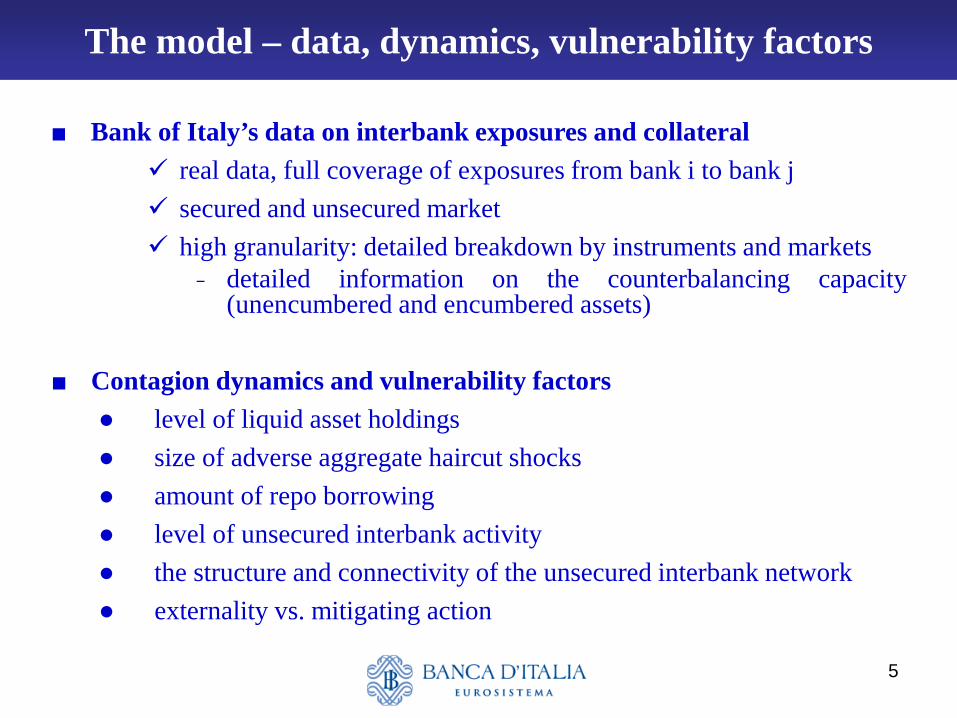
■ Bank of Italy’s data on interbank exposures and collateral real data, full coverage of exposures from bank i to bank j secured and unsecured market high granularity: detailed breakdown by instruments and markets
- detailed information on the counterbalancing capacity (unencumbered and encumbered assets)
■ Contagion dynamics and vulnerability factors
● level of liquid asset holdings ● size of adverse aggregate haircut shocks ● amount of repo borrowing ● level of unsecured interbank activity ● the structure and connectivity of the unsecured interbank network ● externality vs. mitigating action
6
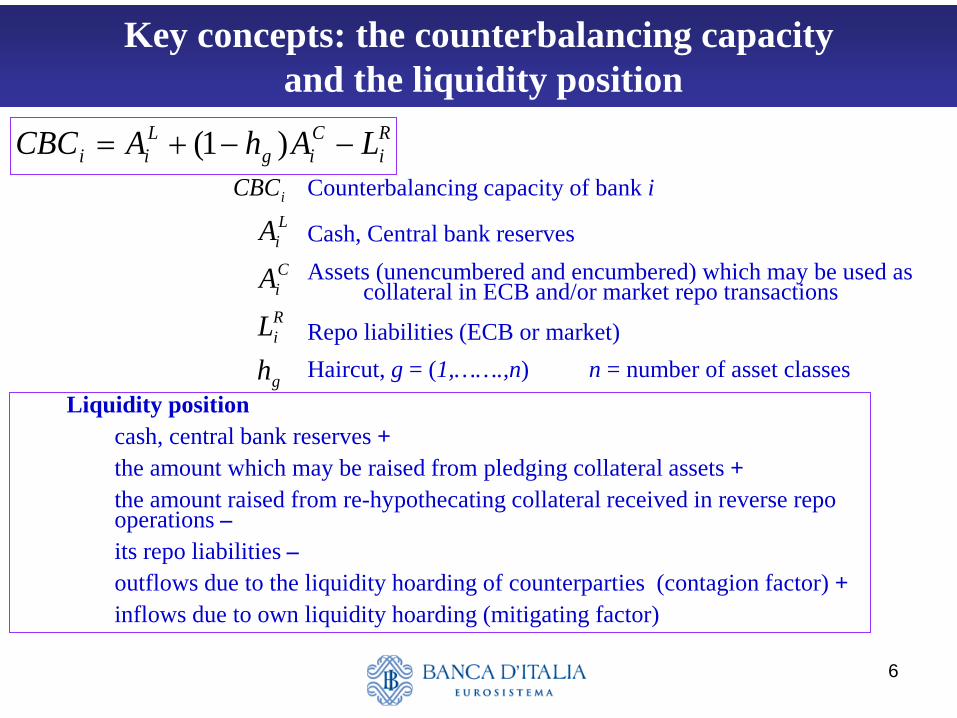
Key concepts: the counterbalancing capacity and the liquidity position
Ri
Cig
Lii LAhACBC −−+= )1(
g
Ri
Ci
Li
hLAA
Counterbalancing capacity of bank i
Cash, Central bank reserves Assets (unencumbered and encumbered) which may be used as
collateral in ECB and/or market repo transactions
Repo liabilities (ECB or market) Haircut, g = (1,…….,n) n = number of asset classes
iCBC
Liquidity position cash, central bank reserves + the amount which may be raised from pledging collateral assets + the amount raised from re-hypothecating collateral received in reverse repo
operations – its repo liabilities – outflows due to the liquidity hoarding of counterparties (contagion factor) + inflows due to own liquidity hoarding (mitigating factor)
7
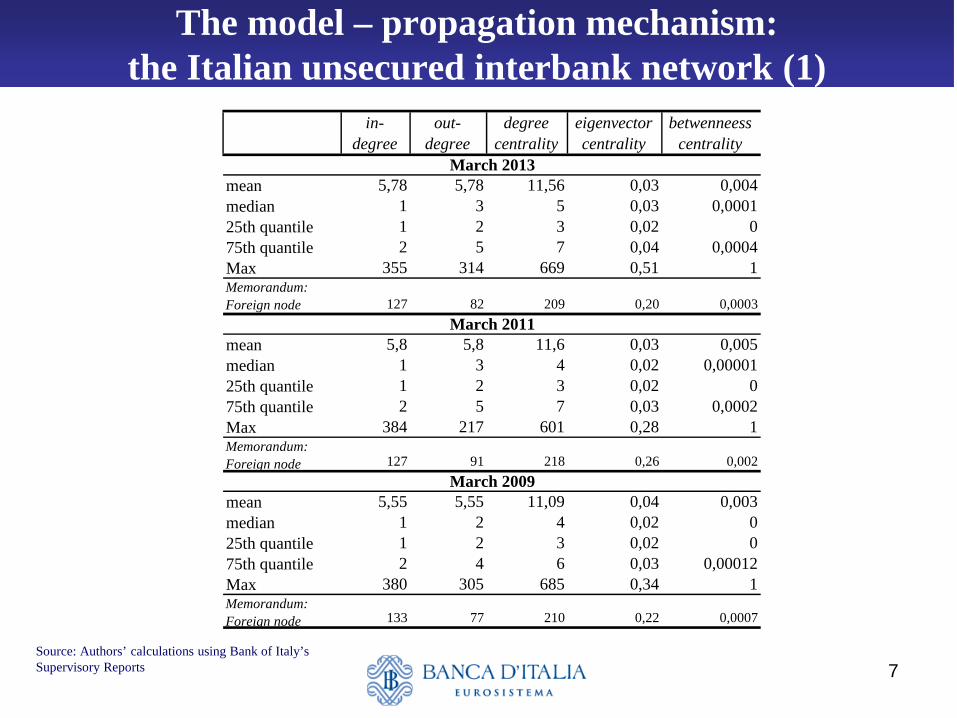
The model – propagation mechanism: the Italian unsecured interbank network (1)
Source: Authors’ calculations using Bank of Italy’s Supervisory Reports
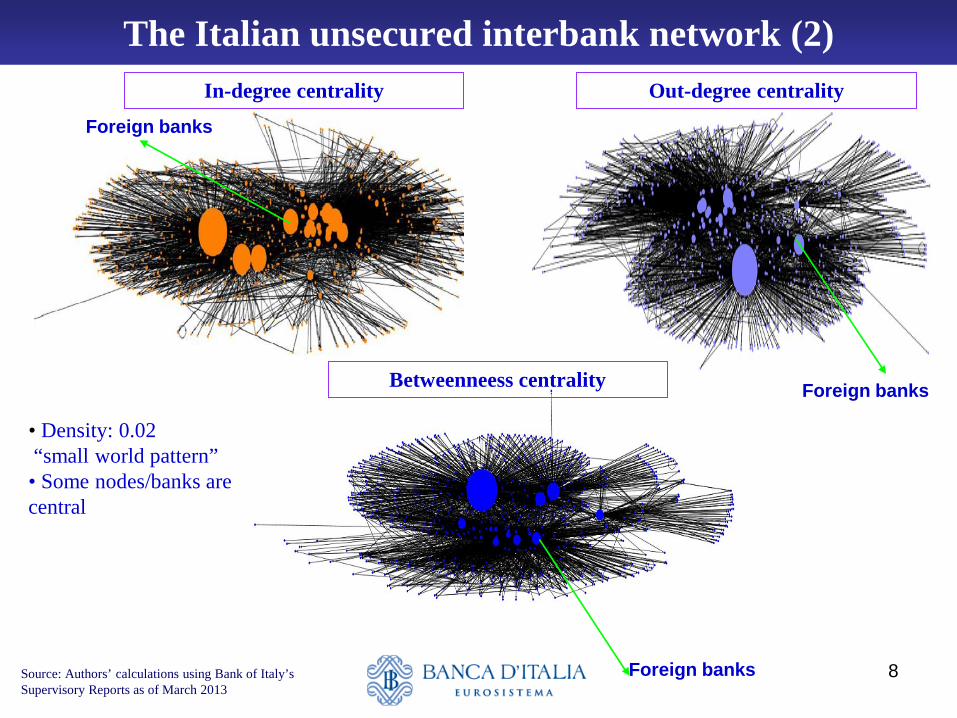
The Italian unsecured interbank network (2) In-degree centrality Out-degree centrality
Foreign banks
Foreign banks
Foreign banks Source: Authors’ calculations using Bank of Italy’s Supervisory Reports as of March 2013
• Density: 0.02 “small world pattern” • Some nodes/banks are central
Betweenneess centrality
9
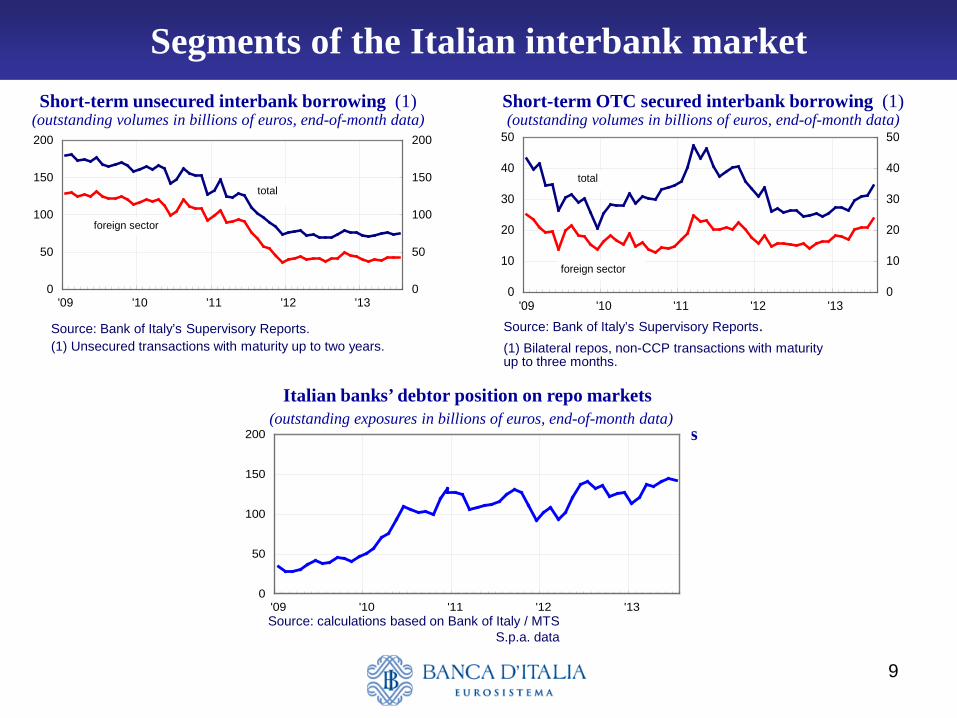
Segments of the Italian interbank market
Debtor position of Italian banks on MTS repo markets (billions of euros)
Short-term unsecured interbank borrowing (1) (outstanding volumes in billions of euros, end-of-month data)
0
50
100
150
200
'09 '10 '11 '12 '13
0
50
100
150
200
'09 '10 '11 '12 '130
50
100
150
200
total
foreign sector
0
10
20
30
40
50
'09 '10 '11 '12 '130
10
20
30
40
50
total
foreign sector
Source: Bank of Italy’s Supervisory Reports. (1) Unsecured transactions with maturity up to two years.
Source: calculations based on Bank of Italy / MTS S.p.a. data
Source: Bank of Italy’s Supervisory Reports. (1) Bilateral repos, non-CCP transactions with maturity up to three months.
Short-term OTC secured interbank borrowing (1) (outstanding volumes in billions of euros, end-of-month data)
Italian banks’ debtor position on repo markets (outstanding exposures in billions of euros, end-of-month data)
10
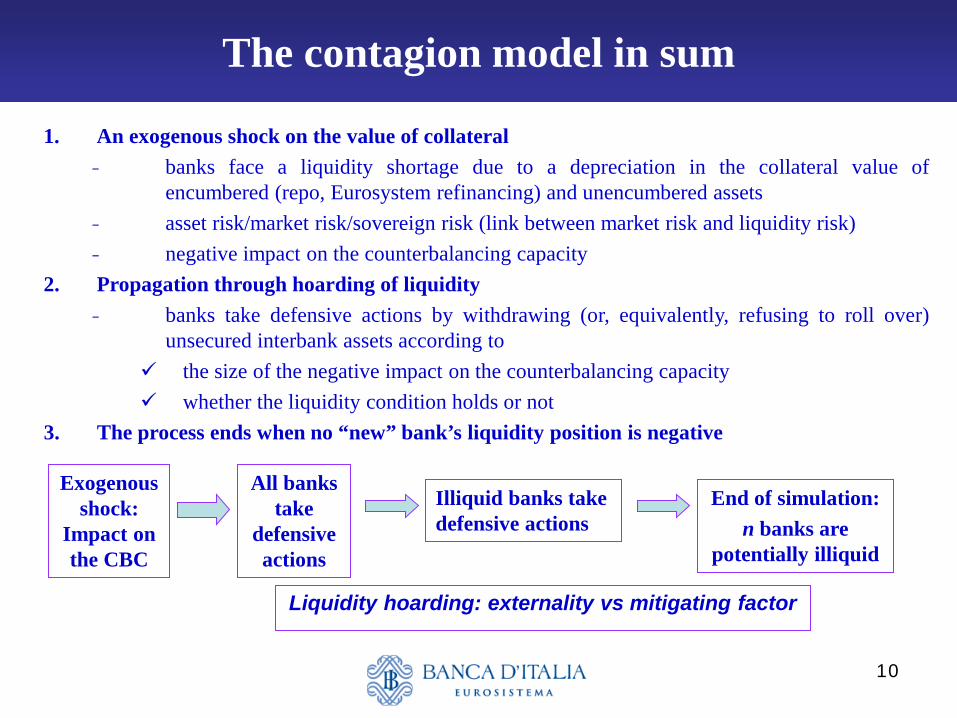
The contagion model in sum
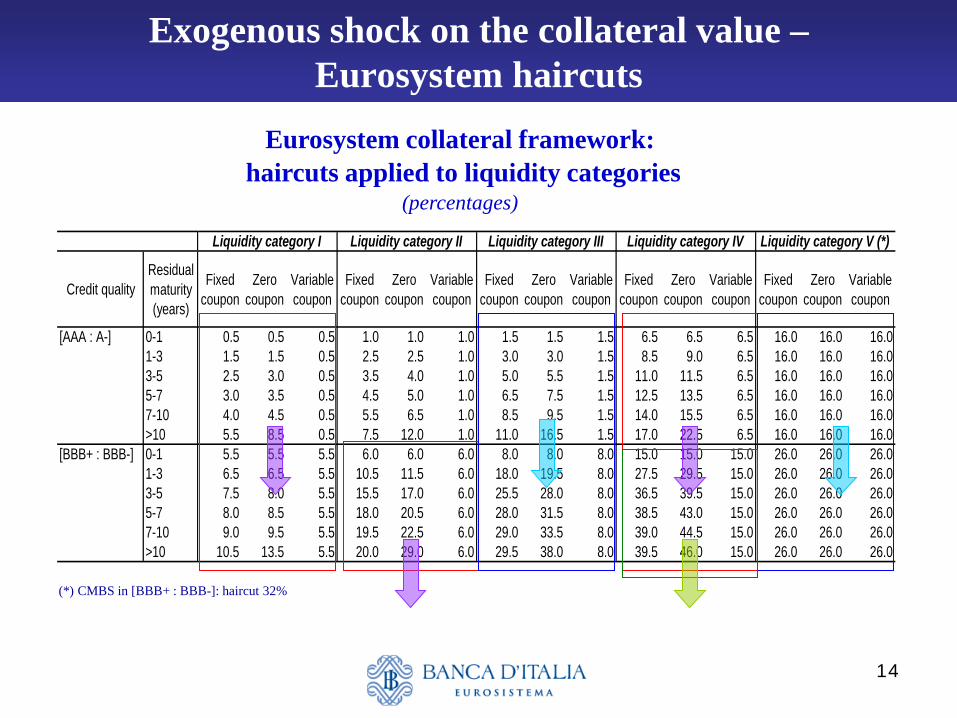
1. An exogenous shock on the value of collateral - banks face a liquidity shortage due to a depreciation in the collateral value of
encumbered (repo, Eurosystem refinancing) and unencumbered assets - asset risk/market risk/sovereign risk (link between market risk and liquidity risk) - negative impact on the counterbalancing capacity
2. Propagation through hoarding of liquidity - banks take defensive actions by withdrawing (or, equivalently, refusing to roll over)
unsecured interbank assets according to the size of the negative impact on the counterbalancing capacity whether the liquidity condition holds or not
3. The process ends when no “new” bank’s liquidity position is negative
Exogenous shock:
Impact on the CBC
All banks take
defensive actions
Illiquid banks take defensive actions
End of simulation: n banks are
potentially illiquid
Liquidity hoarding: externality vs mitigating factor
11
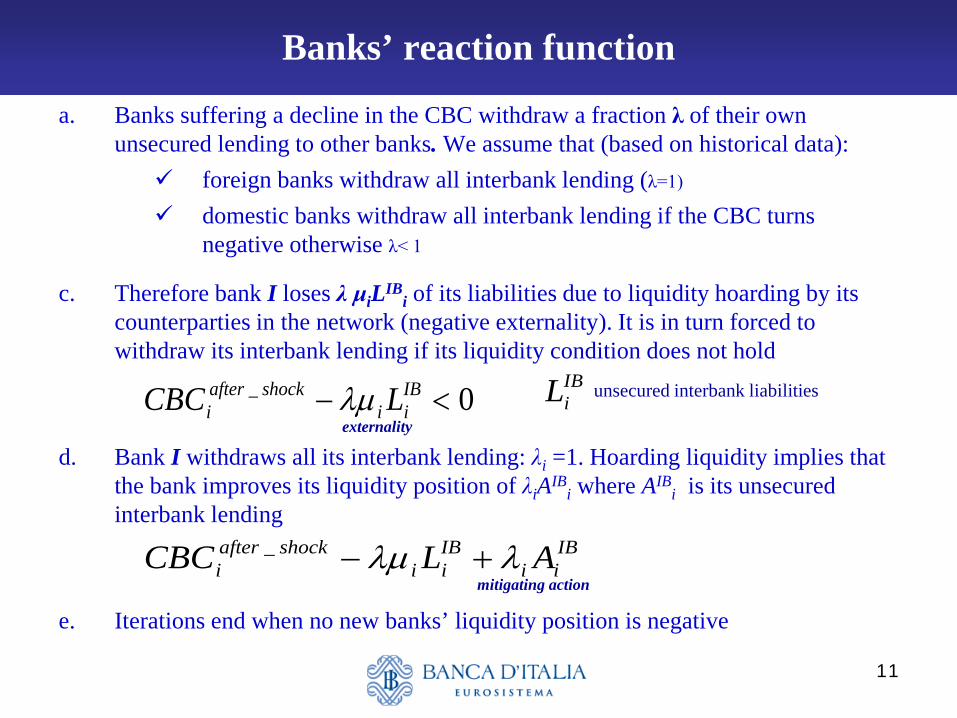
a. Banks suffering a decline in the CBC withdraw a fraction λ of their own unsecured lending to other banks. We assume that (based on historical data): foreign banks withdraw all interbank lending (λ=1)
domestic banks withdraw all interbank lending if the CBC turns negative otherwise λ< 1
c. Therefore bank I loses λ μiLIBi of its liabilities due to liquidity hoarding by its
counterparties in the network (negative externality). It is in turn forced to withdraw its interbank lending if its liquidity condition does not hold
d. Bank I withdraws all its interbank lending: λi =1. Hoarding liquidity implies that the bank improves its liquidity position of λiAIB
i where AIBi is its unsecured
interbank lending
e. Iterations end when no new banks’ liquidity position is negative
Banks’ reaction function
externality
0_ <− IBii
shockafteri LCBC λµ
IBiL
mitigating action
IBii
IBii
shockafteri ALCBC λλµ +−_
unsecured interbank liabilities
12
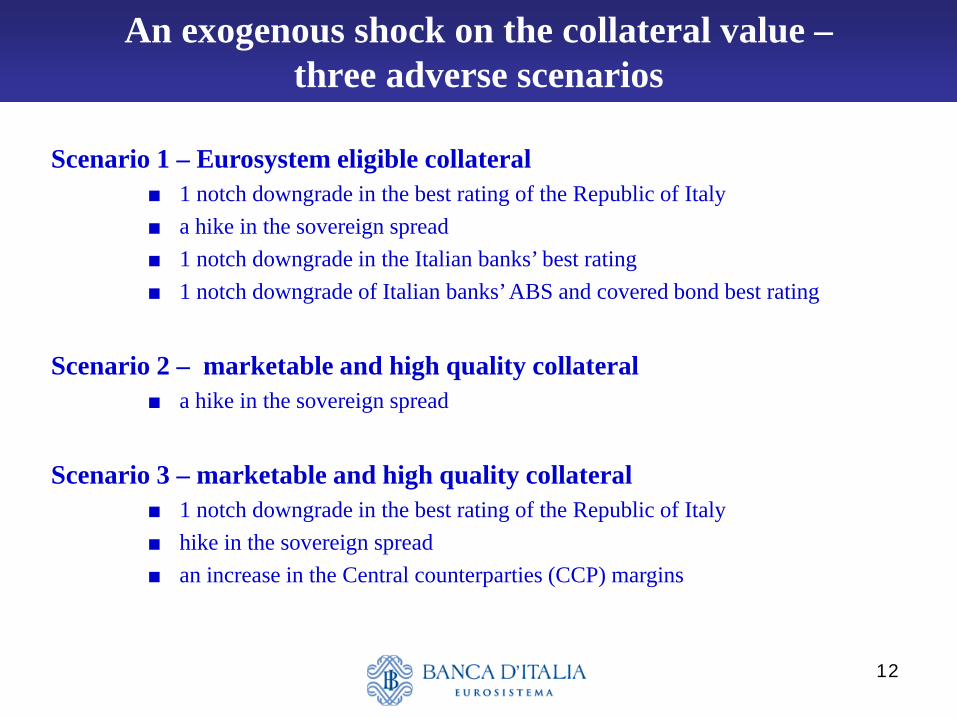
An exogenous shock on the collateral value – three adverse scenarios
Scenario 1 – Eurosystem eligible collateral ■ 1 notch downgrade in the best rating of the Republic of Italy ■ a hike in the sovereign spread ■ 1 notch downgrade in the Italian banks’ best rating ■ 1 notch downgrade of Italian banks’ ABS and covered bond best rating
Scenario 2 – marketable and high quality collateral
■ a hike in the sovereign spread
Scenario 3 – marketable and high quality collateral
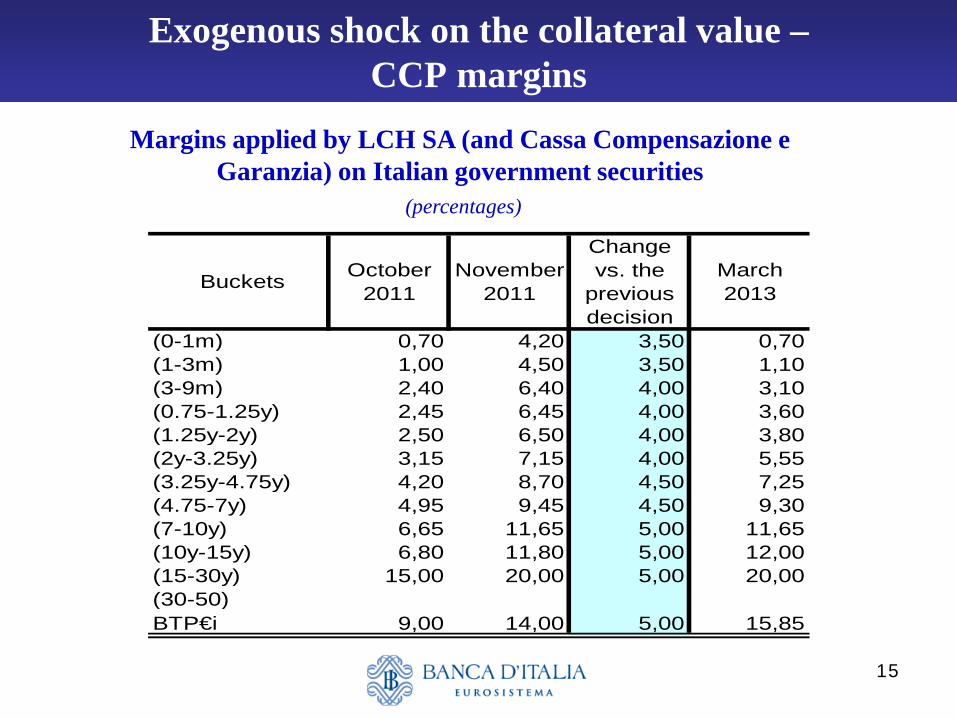
■ 1 notch downgrade in the best rating of the Republic of Italy ■ hike in the sovereign spread ■ an increase in the Central counterparties (CCP) margins
13
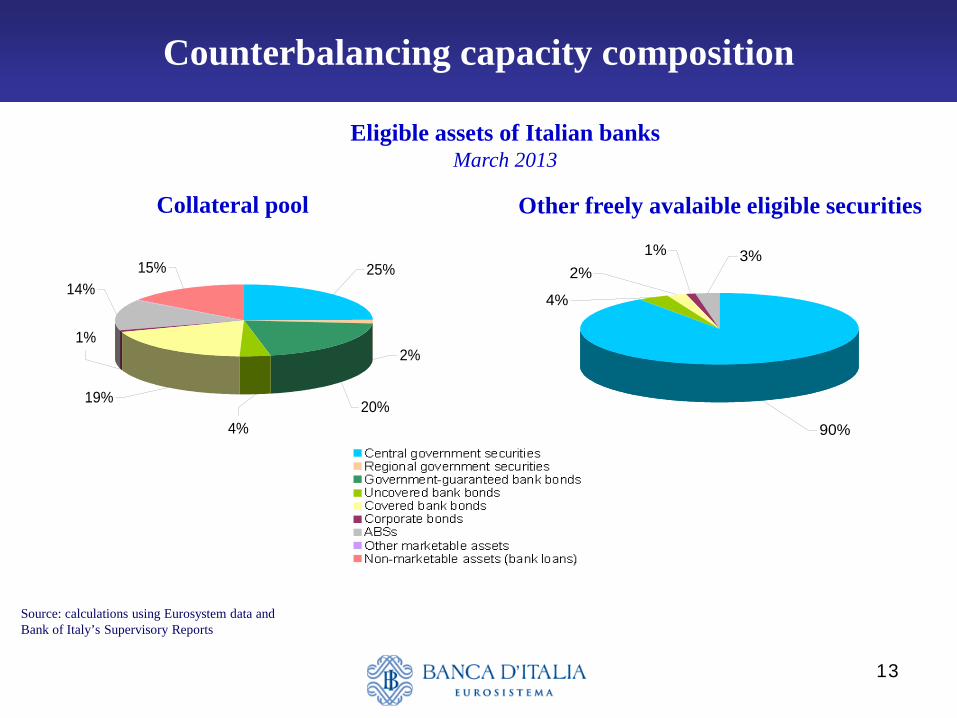
Other freely avalaible eligible securities
Counterbalancing capacity composition
Collateral pool
3%
90%
4%
2%1%
14%
20%
2%
25%
4%
19%
1%
15%
Eligible assets of Italian banks March 2013
Source: calculations using Eurosystem data and Bank of Italy’s Supervisory Reports
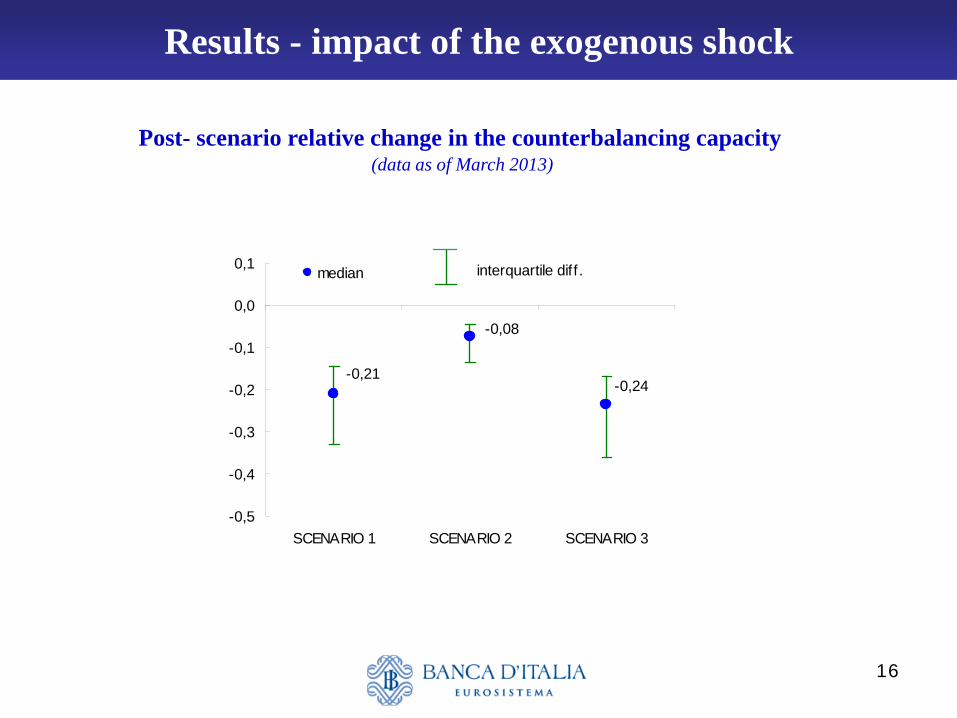
Post- scenario relative change in the counterbalancing capacity (data as of March 2013)
17
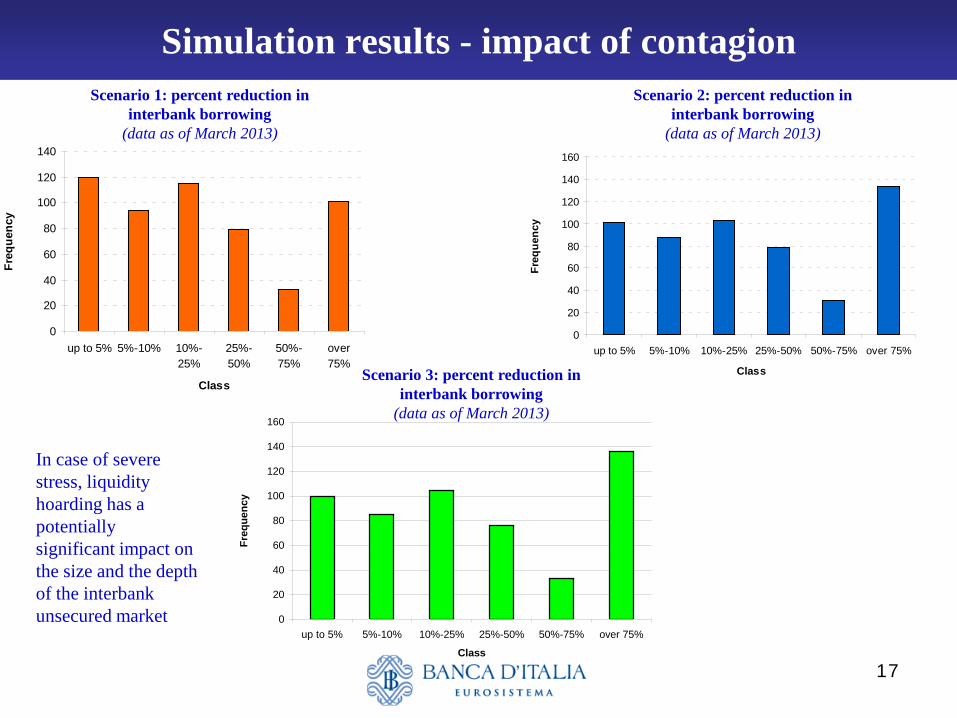
T Simulation results - impact of contagion
0
20
40
60
80
100
120
140
up to 5% 5%-10% 10%-25%
25%-50%
50%-75%
over75%
Class
Freq
uenc
y
0
20
40
60
80
100
120
140
160
up to 5% 5%-10% 10%-25% 25%-50% 50%-75% over 75%
Class
Freq
uenc
y
Scenario 1: percent reduction in interbank borrowing
(data as of March 2013)
Scenario 2: percent reduction in interbank borrowing
(data as of March 2013)
Scenario 3: percent reduction in interbank borrowing
(data as of March 2013)
0
20
40
60
80
100
120
140
160
up to 5% 5%-10% 10%-25% 25%-50% 50%-75% over 75%
Class
Freq
uenc
y
In case of severe stress, liquidity hoarding has a potentially significant impact on the size and the depth of the interbank unsecured market
18
T Simulation results – impact of the mitigating factor
Liquidity hoarding is an effective mitigating action for restoring a positive liquidity position for banks affected by a severe shock on the value of their assets
At the system level, the mitigating action outweighs the contagion factor A very small fraction of banks would end-up being potentially illiquid at the
end of the simulation runs; in most cases, hording liquidity turns after-shock potentially illiquid banks into liquid banks
At the end of the simulation runs, in no cases the contagion factor turns potentially liquid into potentially illiquid banks
A robust network: even under very adverse scenarios and a strict definition of liquid assets, the Italian interbank system would be resilient to the combination of market/sovereign risk and liquidity risk
19
T Conclusions
Gay-Kapadia (2010), Haldane (2009) highly interconnected financial networks may be “robust-yet-fragile” in the sense
that “within a certain range, connections serve as shock-absorbers and connectivity engenders robustness”
The combination of some crucial factors drives the result
the level of unsecured borrowing the structure and connectivity of the network assumptions about the banks’ reaction functions