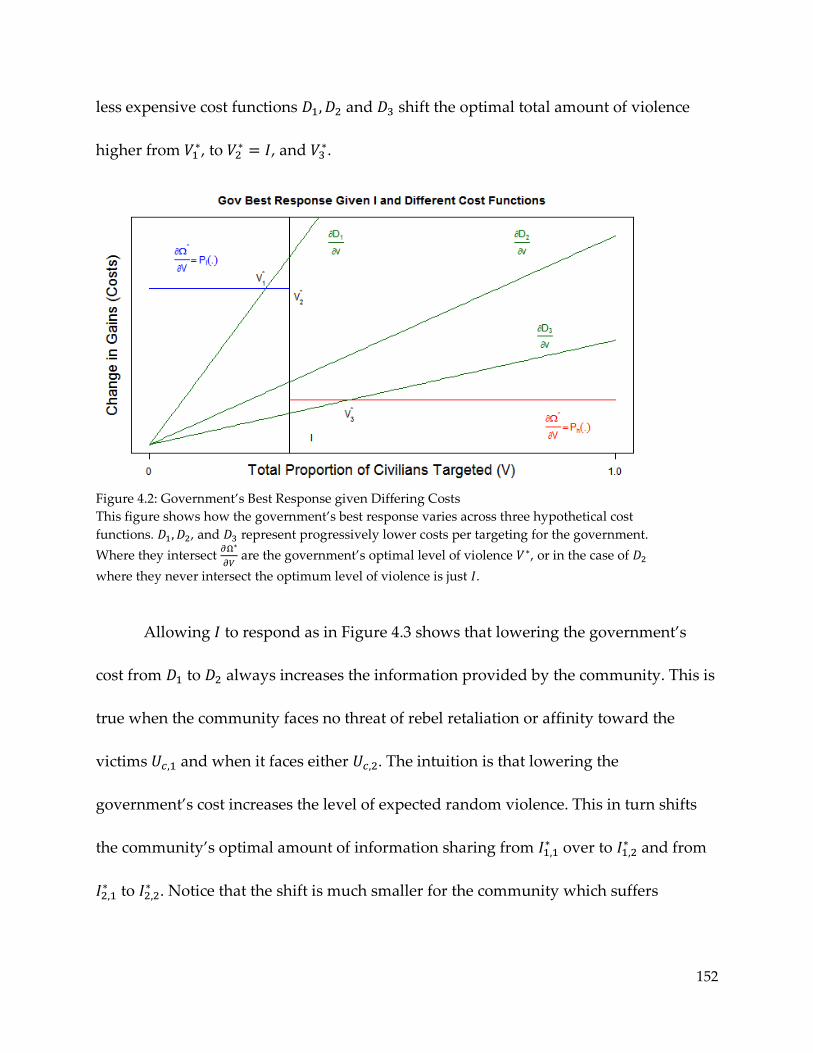
Why Not Divide and Conquer? Targeted Bargaining and Violence in Civil War Rex W. Douglass A DISSERTATION PRESENTED TO THE FACULTY OF PRINCETON UNVERSITY IN CANDIDACY FOR THE DEGREE OF DOCTOR OF PHILOSOPHY RECOMMENDED FOR ACCEPTANCE BY THE DEPARTMENT OF POLITICS Adviser: Joanne Gowa September 2012
6 Seeking to avoid casualties, military units will often restrict themselves to bases or routes intentionally
selected to avoid enemy contact. 7 An interesting reversal of this trend for military operations has resulted in the availability of effective
night vision equipment to government but not rebel forces.
21
Third, the government may simply be disinterested in entering or governing the
space. The government may have no interest in controlling an area that has little
resources, particularly if it has access to another concentrated resource like diamonds or
timber elsewhere (Weinstein 2007). Taxation is an important objective for governments,
and often the only experience ordinary civilians in rural areas will have with the
government is through brief visits by tax collectors accompanied by armed escort.
Fourth, the government may be physically prevented from entering the space by
violent enemy tactics. As a matter of strategy, rebel forces typically retreat when
government forces arrive in mass, but not always. Sunni insurgents along with foreign
fighters intermittently held the city of Fallujah against American and Iraqi forces over a
period of twenty months (West 2005).
Fifth, the presence of government forces is often not sufficient to prevent access
by rebel forces. The strategy of guerrilla warfare developed by Mao Tse-tung calls for
rebels to blend into the local population, making it impossible for government forces to
distinguish rebels from non-combatants with any degree of certainty.8 This both
complicates their goal of identifying rebel units for destruction while increasing the
odds that they will inadvertently strike the civilian targets, thereby further increasing
popular support for the insurgency. Without local support, it is often impossible to
8 Marine Brig. Gen. Samuel B. Griffith who traveled extensively in China during the Civil War provides
the best translation of “On Guerrilla Warfare” (Tse-tung 2000). For the Vietnamese take on Maoist
insurgency doctrine see Gen. Vo Nguyen Giap’s “People’s War, People’s Army” (Giap 1962).
22
identify rebel administrators and supporters living in the general population. In urban
and jungle environments, even relatively large armed rebel units have been able to
operate in close proximity to government forces without arousing suspicion.9
There are two implications of this line of argument. The first is that control is a
temporary outcome, predicated on the preferences and capabilities of the actors
involved. This is different from the conception of “pacification” where areas are
somehow made permanently aligned to one side or the other. Second, these complex
strategic interactions suggest that we should distinguish between the concept of
territorial control and the outbreak of violent events. Staniland (2012, 246) shows that
brutal conflict, limited norms governed clashes, and active collusion to maintain a
stream of rents from the population could all be consistent with an equal division of
territorial control. Selective violence against civilians is argued to vary nonlinearly,
peaking in areas of partial control (Kalyvas 2006). Logistical constraints suggest that
attacks on military targets should be nonlinear with control, peaking at the edge of the
government’s ability to easily project power into rebel areas (Hegre et al 2009). Properly
specifying this functional form is important for testing theories of civil war using events
(Signorino and Yilmax 2003). For this reason, efforts that focus specifically on patterns
of violent events alone find it difficult to infer underlying causes (Schroden 2009, Gons
et al. 2012).
9 There are multiple accounts of Viet Cong political and military operations in close proximity to
American units as large as a Marine Corps infantry battalion’s headquarters (Ahern 2010, 249–250).
23
2.3 Expert Surveys and Measuring Territorial Control in the Vietnam War
2.3.1 Background
The Vietnam War was an internationalized civil war with combat taking place in
North Vietnam, South Vietnam, Laos, and Cambodia. A number of countries committed
personnel, including the United States, South Korea, Australia, New Zealand, the
Philippines, China, and the Soviet Union. However, it was still a war fought primarily
by Vietnamese communists against Vietnamese nationalists. In the GVN’s fight against
the Viet Cong, over one million ethnic Vietnamese either joined or were drafted into the
various military and police forces. The same was true for the prior colonial conflict
between the Viet Minh and the French, where over 400,000 local Vietnamese were
recruited into the colonial army.
Strategically, both sides fought a defensive action intended to wait out the other.
The United States chose to intervene and designed a military strategy in order to buy
the GVN enough time to survive on its own (Kolko 1985, 177-80). How that strategy
was implemented changed over time. Thayer summarizes the shift: “the 1967-1972
pacification effort gradually built up the allied counterguerrilla and anti-Viet Cong
infrastructure effort. Meanwhile, gradual U.S. withdrawal reduced the allied main
forces. Hence the allied style and force structure were becoming somewhat less
conventional as the communists became notably more conventional” (Thayer 1985, 39).
In this period, there were two major rebel events. The first was the Tet Offensive in
24
January of 1968, which the Viet Cong led in an attempt to inspire an uprising and
takeover of urban areas. The second was the Easter Offensive, starting March of 1972,
which was primarily a conventional attempt by the North Vietnamese to gain as much
territory as possible prior to the conclusion of the Paris Peace Accords.
Geographically, South Vietnam was divided into four military regions, and the
nature of the conflict varied greatly between them and within them over time.10 Further
distinctions can be drawn between provinces and even between individual villages.
Only 10 of 44 provinces accounted for over half of all government or ally combat deaths
(Thayer 1985, 14-5).11 The type of warfare varied greatly, with five of the provinces
fighting a large-scale main force war, five fighting a primarily guerrilla war, and
another five exhibiting a hybrid of the two (Prince et al. 1972, I-3). Recent comparisons
of Viet Cong initiated incidents have found that the violence may have been even more
localized to specific districts and villages (Lohman 2010).
10 The southernmost region, III Corps and IV Corps were closest to a locally grown and operated
insurgency throughout the war. In the Viet Minh period, regional forces and local militia units were the
only significant PAVN units in the southern Mekong Delta region (Pike 1986, 39). At the end of the war in
South Vietnam, NVA units had largely taken over for Viet Cong forces everywhere except the Mekong
Delta (Clodfelter 1995). III Corps contained the capital which guaranteed both a larger government
presence as well as greater contestation by the Viet Cong. II Corps saw intense large-scale battles before
returning back to insurgency style fighting. I Corps was practically a conventional war toward the later
part of the war. 11 They were the northern provinces, Quang Tri, Thua Thien, Quang Nam, Quang Tin, Quang Ngai, Binh
Diny, and three province critical to control around the capital in MR3, Tan Ninh, Dinh Tuong, and Kien
Hoa.
25
2.3.2 Efforts to Measure Control
Both the GVN and the Viet Cong developed systems for reporting political and
military conditions at the hamlet level.12 GVN reporting began as early as 1964 and ran
into 1967.13 In April 1965, the government system began to rate some individual hamlets
in addition to province-wide measures.14 In October 1966, the Department of Defense
ordered the creation of an American system for measuring monthly progress. It was
designed to provide for the basic requirements of a counterinsurgency campaign
including census functions (tracking locations, names, demographics, and population of
administrative units) and basic military intelligence functions (documenting the
locations and activities of enemy and friendly forces). It also attempted to measure less
tangible aspects of war such as government control over territory, progress in economic
development and pacification, and progress in basic administration and governance.15
The first survey called HAMLA entered the field in January of 1967 and assigned
each hamlet a letter grade (from E to A, with A the best) on 18 main questions along
with a number of questions on specific problem areas.16 After a major review, the E to A
subjective scores were replaced with specific questions that could then be aggregated
12 For discussion of the Viet Cong’s interpretation of control see Race (1972, 138-140) and Hunt (1974). 13 Data from this system has not yet been located, but from May 1964 through September 1966 a system
called Population Control File (POPCA) recorded province-months estimates of the population living in
“Secure,” “Semi-Secure,” “Contested,” “Unknown,” and “VC Controlled” areas. 14 One indication of the poor quality of this earlier system is that it showed major improvements in
security during the near collapse of the government’s position in 1964 (Thayer 1975, 36). 15 For a recent review of the importance of a census to counterinsurgency operations see Shrout (2011). 16 The first few months of data from HES reported similar security conditions as the existing GVN system
(Thayer 1975, 14-5).
26
into a meaningful overall grade. The redesign led to a survey called HES70/71, which
ran from July 1969 and until the fall of Saigon in 1975.17 For the first year and a half, it
carried 139 hamlet and village level questions – a number that was later increased to
165.18 The designers used a number of forward thinking approaches. They included
overlap between the two systems to allow for calibration of responses. They allowed for
the addition of new questions over time as they became relevant, and they generated a
number of aggregation systems. The data analyzed here run from January 1967 to
December of 1972 when the system was almost entirely transferred to the South
Vietnamese.19 The temporal coverage of the two systems appears below in Table 2.1.20
Table 2.1: Temporal Overlap of the HES Surveys
1967 1968 1969 1970 1971 1972
First Half Second Half
Regime 1
HAMLA
Regime 2
HAMLA
overlapping
with
HES70/71
Regime 3
HES70/71
2.3.3 The Raters
A system like HES was only possible because of the significant advisory
infrastructure developed during the war. One remarkable agency, the Civil Operations
and Revolutionary Development Support (CORDS), consolidated disparate civilian and
17 The first incarnation was called HES70 and was replaced by HES71. These versions were largely
identical. 18 HES71 took away 3 questions, VQE6, HQE3, HQE5, and added another 29. 19 The actual rating of hamlets was transferred gradually, starting early in mid-1972. 20 Declassification requests of the original microfilm copies of HES were not addressed in time for this
analysis, but future work will be able to fill in and make available the full longitudinal series without
gaps.
27
military pacification efforts under a single roof (Scoville 1982). Importantly, the
advisory effort mirrored the federal structure of South Vietnam. An advisory team led
by a Province Senior Advisor (PSA) was assigned to each of the 44 provinces. Each of
the 240 districts had their own team of 5 to 13 persons headed by a District Senior
Advisor (DSA) who was typically an Army major.21 The advisory system benefited from
the continuity that resulted from repeated tours of advisors, the sometimes-extended
rotations, and the limited options for transferring to other jobs or more secure districts
(Osborne 2012,10).22 U.S. advisors were mirrored by their GVN counterparts, province
and district chiefs. Provincial leadership, for the most part, consisted of career service
officers who had a working knowledge of their province but were not typically from the
area or they lacked local popular support (Silverman 1970).
The HES survey was filled out by the District Senior Advisors. Province advisors
could provide accompanying comments but could not alter the scores provided by a
DSA. Each DSA was responsible for on average about 60 hamlets (and for some districts
over a 100). HES procedures required keeping a logbook of events during each month
that would then be used to update the HES scores at the end of the month.23 DSAs were
encouraged to accumulate as much information from as many sources as possible,
preferably from direct observation through hamlet visits. In practice, DSAs depended 21 A small subset of districts were headed by civilians, usually from USAID. 22 Positions were normally assigned, and were held consecutively for either a 12-month rotation or were
voluntarily extended to 18 to 24 months. 23 We would expect a strong temporal correlation because the DSAs were provided with last month’s
scores and only made changes when necessary.
28
heavily on their Vietnamese counterparts for the information they used to generate their
responses (de Sola Pool at al. 1968, 32).
2.3.4 Validity and the HES Questions
The major criticism of the validity of HES is that it was built to estimate
“pacification” in counterinsurgency for which there was not, and still is not, a clear
theoretical foundation. For some, HES focused too much on tangible security related
factors to the detriment of relevant social factors (Race 1972, 223). For others, using
security conditions in time as an indication for “pacification” in missed the
whole point of security being a conditional outcome on the forces present at the time
(Elliot 2003, 857; Race 1972, 223). Local security would naturally change when
government forces left and rebel forces came back. A broader review of the search for
metrics in Vietnam found that “Defining security, however, remained one of the more
complicated aspects of MACV’s measurement system. Indeed, imprecise definitions
plagued nearly all facets of U.S. reporting. How should “security” be defined?
Quantitative reports like the HES never really said” (Daddis 2011).
There is nothing in these criticisms that suggest that HES is incapable of the more
limited task of measuring territorial control and its change over time. There are two
aspects of control, monopoly presence and monopoly access. The HES designers were
very interested in both as metrics for counterinsurgency and included a number of
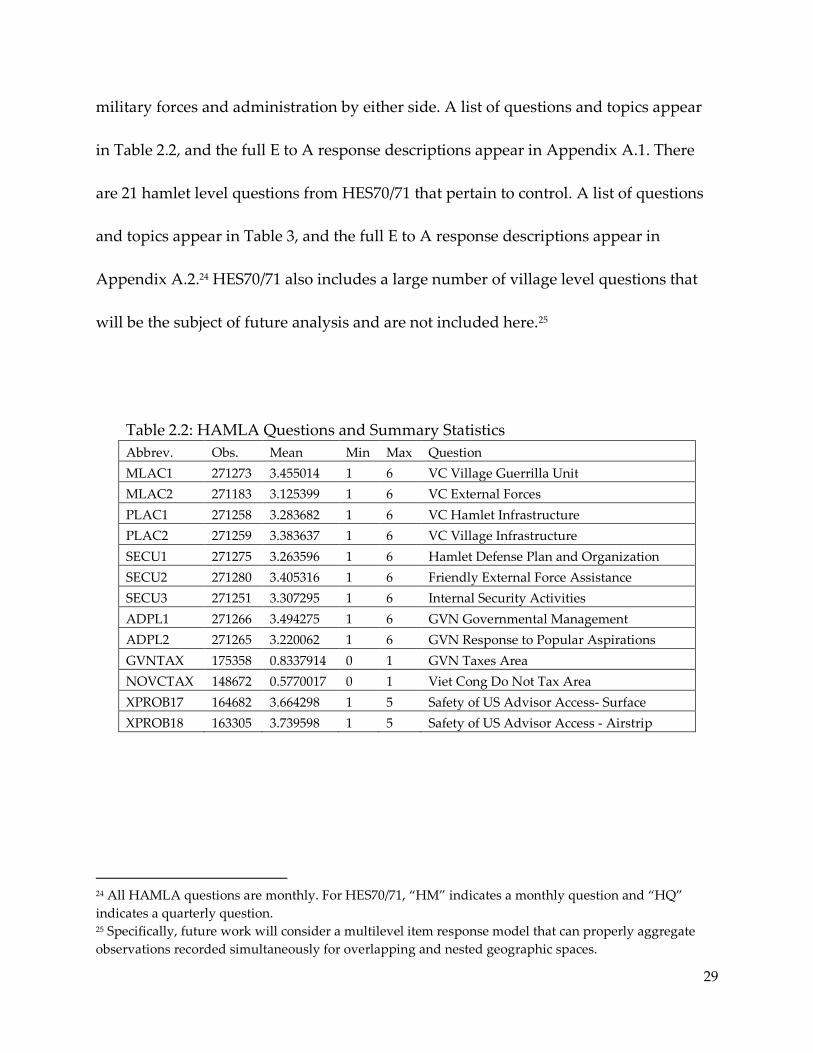
questions regarding each. There are 13 HAMLA questions pertaining to the presence of
29
military forces and administration by either side. A list of questions and topics appear
in Table 2.2, and the full E to A response descriptions appear in Appendix A.1. There
are 21 hamlet level questions from HES70/71 that pertain to control. A list of questions
and topics appear in Table 3, and the full E to A response descriptions appear in
Appendix A.2.24 HES70/71 also includes a large number of village level questions that
will be the subject of future analysis and are not included here.25
Table 2.2: HAMLA Questions and Summary Statistics
Abbrev. Obs. Mean Min Max Question
MLAC1 271273 3.455014 1 6 VC Village Guerrilla Unit
MLAC2 271183 3.125399 1 6 VC External Forces
PLAC1 271258 3.283682 1 6 VC Hamlet Infrastructure
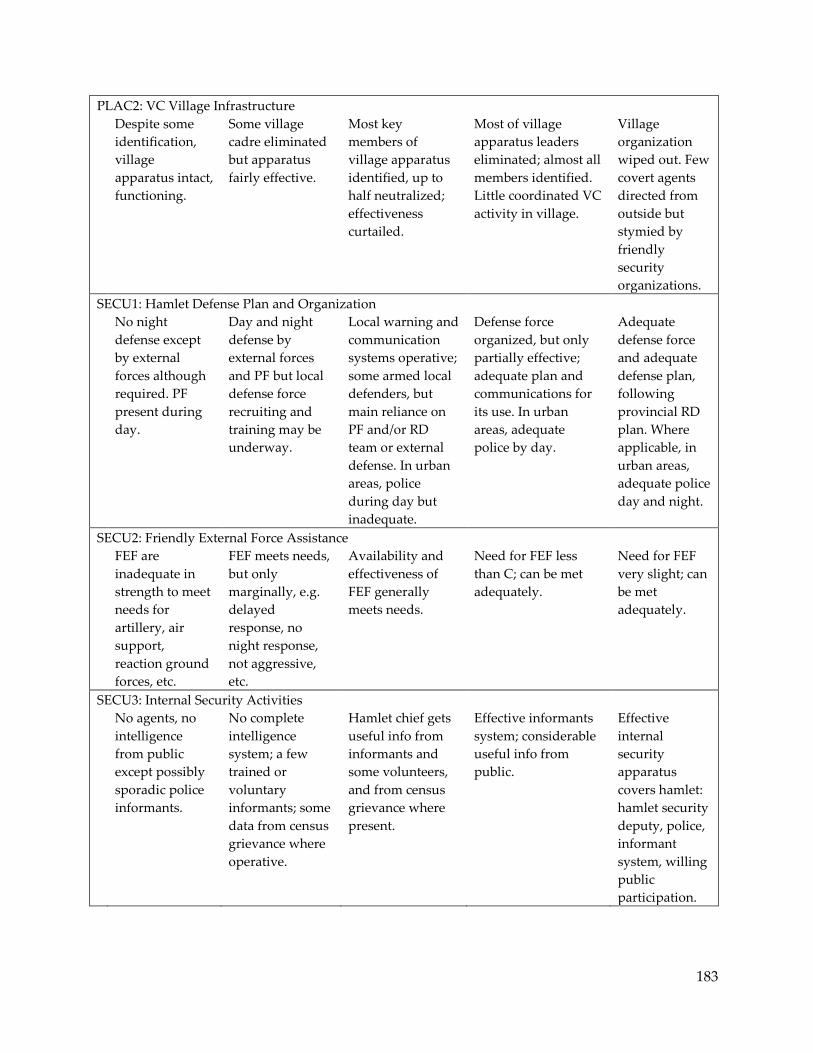
PLAC2 271259 3.383637 1 6 VC Village Infrastructure
SECU1 271275 3.263596 1 6 Hamlet Defense Plan and Organization
SECU2 271280 3.405316 1 6 Friendly External Force Assistance
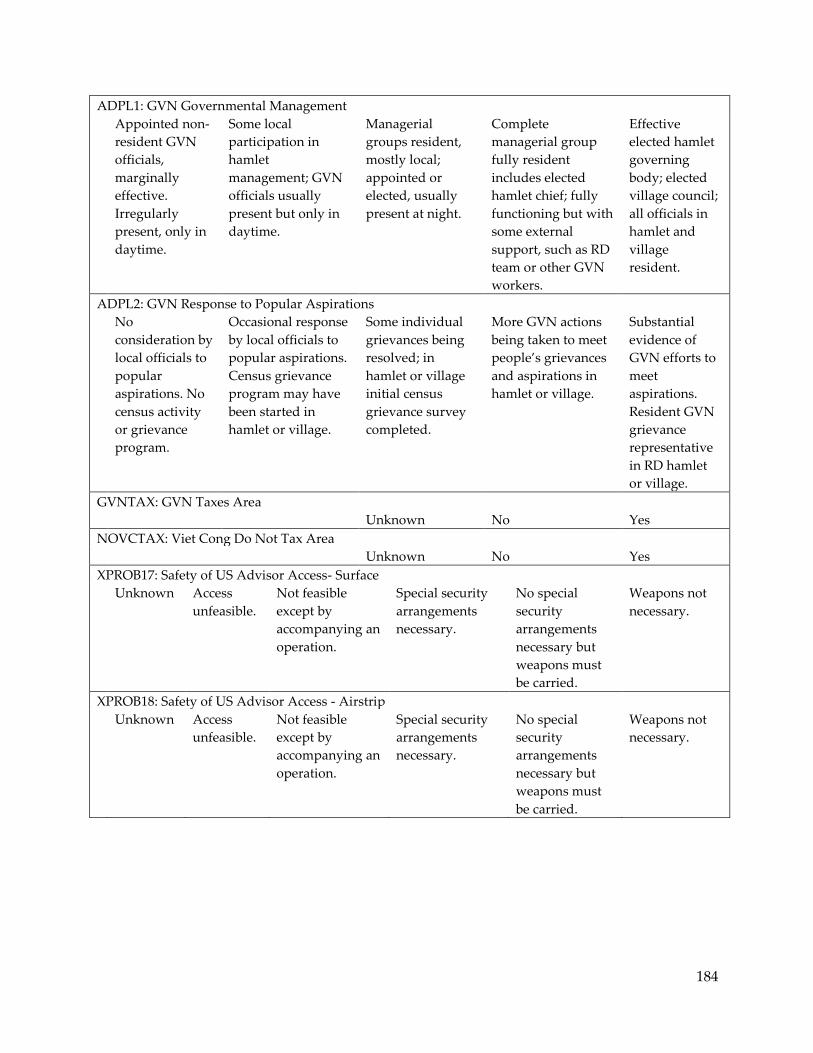
ADPL2 271265 3.220062 1 6 GVN Response to Popular Aspirations
GVNTAX 175358 0.8337914 0 1 GVN Taxes Area
NOVCTAX 148672 0.5770017 0 1 Viet Cong Do Not Tax Area
XPROB17 164682 3.664298 1 5 Safety of US Advisor Access- Surface
XPROB18 163305 3.739598 1 5 Safety of US Advisor Access - Airstrip
24 All HAMLA questions are monthly. For HES70/71, “HM” indicates a monthly question and “HQ”
indicates a quarterly question. 25 Specifically, future work will consider a multilevel item response model that can properly aggregate
observations recorded simultaneously for overlapping and nested geographic spaces.
30
Table 2.3: HES70/71 Question and Summary Statistics
Abbrev. Obs. Mean Min Max Question
HMA1 305,855 2.07 0 5
Did any US advisory personnel visit this hamlet
during the month?
HMA2 308,823 2.30 0 5
Did the GVN district chief visit this hamlet during
the month?
HMB4 311,257 2.60 0 3
Were armed enemy military forces present in
inhabited areas of this hamlet during the month?
HMB8 299,493 1.84 0 2
Were any enemy propaganda meetings held or was
printed propaganda distributed in this hamlet
during the month?
HQB1 312,728 2.96 0 4
Which of the following most closely reflects the
status of the enemy infrastructure in this hamlet?
HQB2 303,240 1.54 0 2
Does the enemy collect taxes from hamlet
households (in cash or in kind)?
HQB3 300,056 3.56 0 4
Do any hamlet households have a member or
members who participated, by coercion or
otherwise in enemy-organized non-military group
activities (public meetings, demonstrations, work
gangs, etc.) during the past quarter?
HQC2 308,954 1.947 0 3
During daylight hours, do friendly local security
forces conduct necessary security operations along
approaches to this hamlet? (e.g., patrols, ambushes,
listening posts, checkpoints, etc.)
HQC3 309,076 1.64 0 3
During hours of darkness, do friendly local security
forces conduct necessary security operations along
approaches to this hamlet? (e.g., patrols, ambushes,
listening posts, checkpoints, etc.)
HQC4 314,257 3.25 0 4
Are any hamlet households located in areas where
enemy agents, recruiters, tax collectors, and other
cadre move about with relative freedom during
hours of darkness?
HQC6 309,439 2.25 0 4
Do any hamlet households have a member or
members active in the PSDF?
HQC7 308,642 3.807 0 5 How active is the PSDF in this hamlet?
HQC8 130,462 4.12 0 5
Do local residents who are prime VC targets
(members of PSDF, RDC, local government
officials, young males, etc.) sleep in their homes at
night?
HQC5 314,037 3.57 0 4
Are any hamlet households located in areas where
GVN administrative personnel are unable to move
about with relative freedom during daylight hours?
HQD2 314,674 1.78 0 2
During daylight hours, do GVN authorities enforce
the laws in this hamlet?
HQD3 313,622 1.47 0 2
During hours of darkness, do GVN authorities
enforce the law in this hamlet?
31
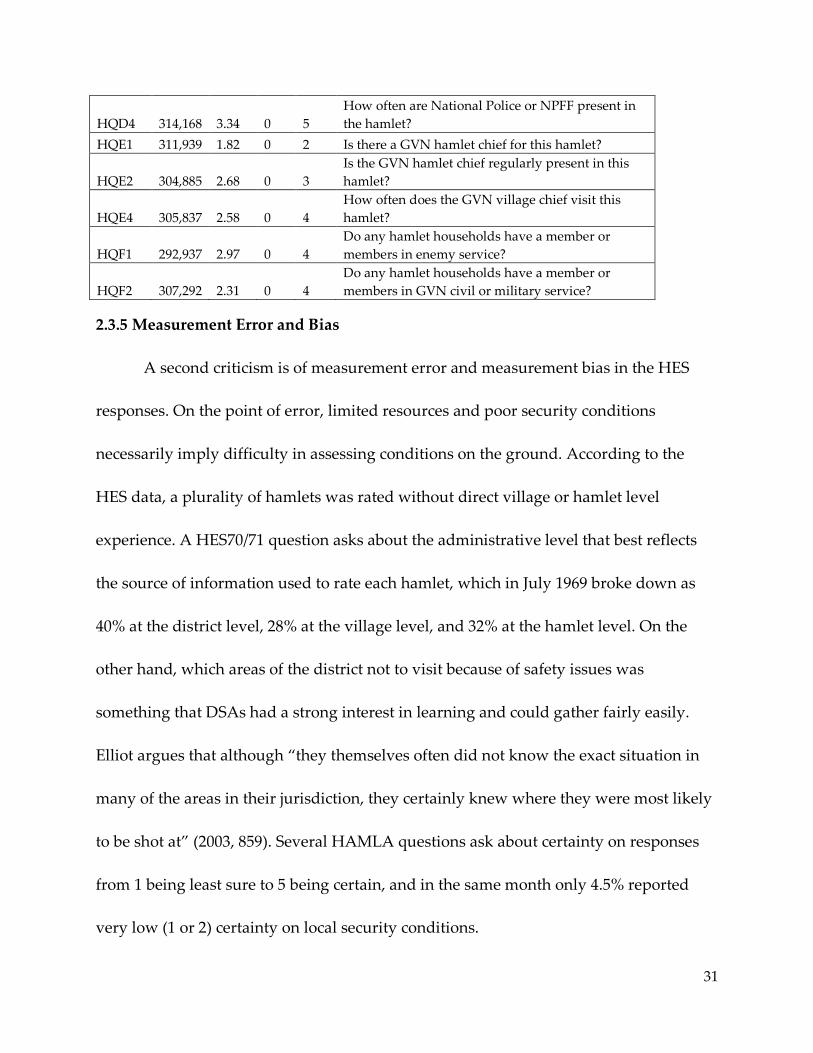
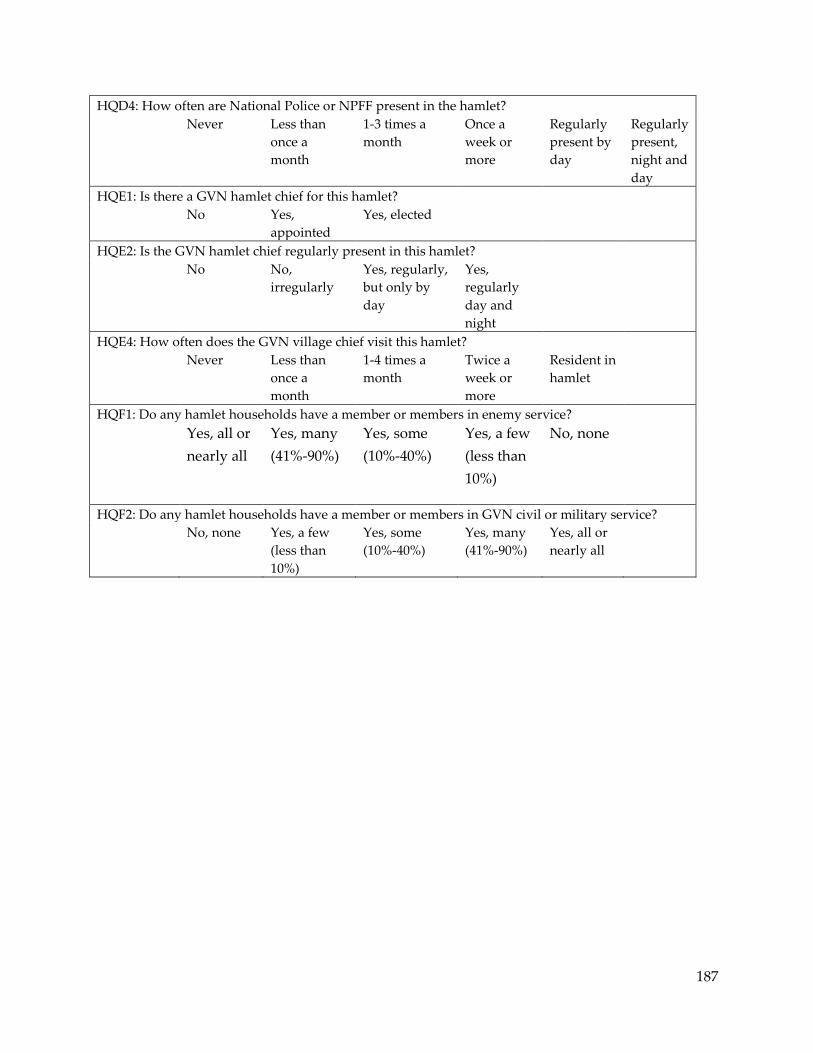
HQD4 314,168 3.34 0 5
How often are National Police or NPFF present in
the hamlet?
HQE1 311,939 1.82 0 2 Is there a GVN hamlet chief for this hamlet?
HQE2 304,885 2.68 0 3
Is the GVN hamlet chief regularly present in this
hamlet?
HQE4 305,837 2.58 0 4
How often does the GVN village chief visit this
hamlet?
HQF1 292,937 2.97 0 4
Do any hamlet households have a member or
members in enemy service?
HQF2 307,292 2.31 0 4
Do any hamlet households have a member or
members in GVN civil or military service?
2.3.5 Measurement Error and Bias
A second criticism is of measurement error and measurement bias in the HES
responses. On the point of error, limited resources and poor security conditions
necessarily imply difficulty in assessing conditions on the ground. According to the
HES data, a plurality of hamlets was rated without direct village or hamlet level
experience. A HES70/71 question asks about the administrative level that best reflects
the source of information used to rate each hamlet, which in July 1969 broke down as
40% at the district level, 28% at the village level, and 32% at the hamlet level. On the
other hand, which areas of the district not to visit because of safety issues was
something that DSAs had a strong interest in learning and could gather fairly easily.
Elliot argues that although “they themselves often did not know the exact situation in
many of the areas in their jurisdiction, they certainly knew where they were most likely
to be shot at” (2003, 859). Several HAMLA questions ask about certainty on responses
from 1 being least sure to 5 being certain, and in the same month only 4.5% reported
very low (1 or 2) certainty on local security conditions.
32
On the point of measurement bias, HES was validated in a number of ways
during the war. Concerned about inflated HES scores, the 9th Infantry Division G-2
undertook a conservative reassessment of every hamlet in Dinh Tuong province and
found that their scores differed by only 10% with the scores by the District Senior
Advisor (Hunt 2010, 82). Contemporary comparisons of HES scores to event data such
as military attacks, ambushes, anti-aircraft fire, and terrorism have also shown a strong
correlation (Thayer 1975, 61). An extensive review of combat data found HES responses
to be reasonable and informative (Prince and Adkins 1973). A Simulatics Corporation
study compared DSA responses to an original survey of hamlet chiefs and hamlet
citizens, and found a strong correlation between them (Pool et al. 1968). There is
anecdotal evidence that there was pressure to elevate scores (the mean may be biased
upward), but there are also accounts of scores being biased downward as well.
Bergerud (1993, 279) notes that despite significant pressure by the 25th Infantry Division
commander General Williamson to inflate HES scores, the advisor team in Hau Nghia
actually rated hamlets too pessimistically.
2.3.6 Contemporary Aggregations Used during the War
Before turning to a more complicated method of aggregation, it is worth
reviewing the picture of control provided by the three contemporary measures used
during the war: a dichotomous categorization of hamlets as fully rebel controlled and
33
thus un-ratable, a linear additive aggregation of V to A scores on each HAMLA
question, and a Bayesian aggregation of specific questions from HES70/71.
2.3.6.1 Dichotomous Measure of Viet Cong Control
The simplest metric of control is a dichotomous scoring of hamlets as ratable or
completely rebel controlled and thus unratable. The distribution of unratable hamlets
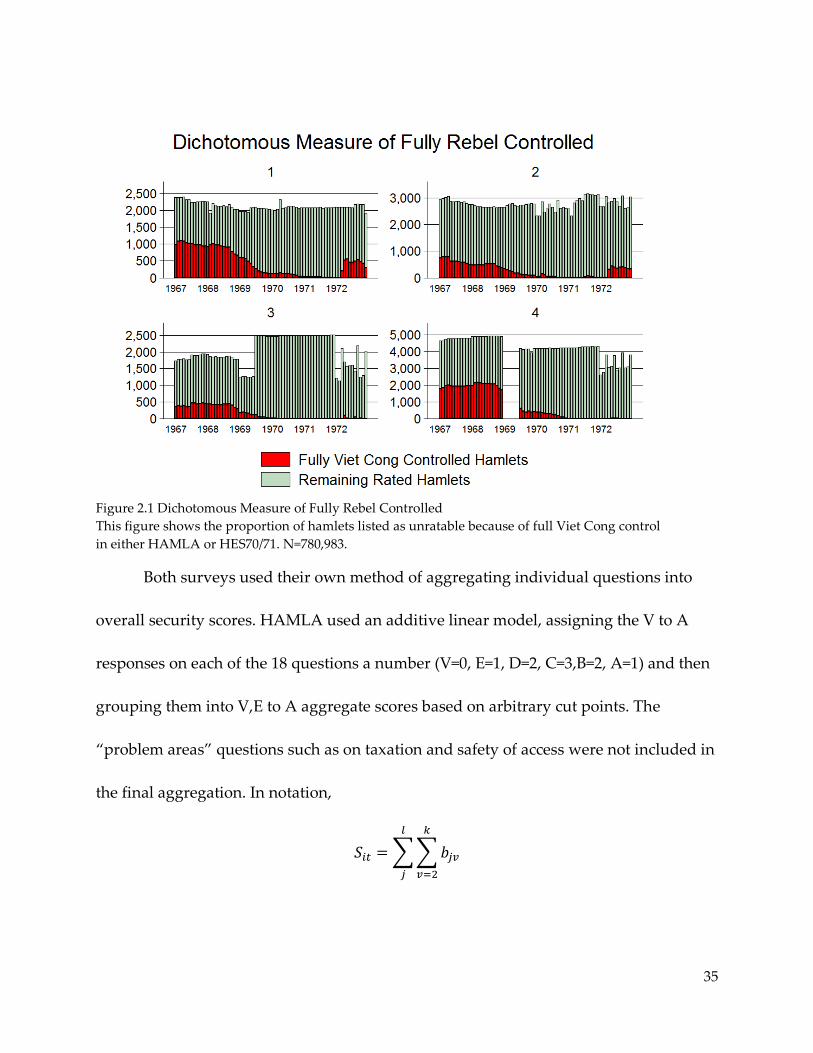
over time is presented in Figure 2.1. By this metric, about a third of hamlets were under
full Viet Cong control for 1967 and 1968. Starting in November 1968, the share began to
drop to only 10% by mid-1969, to under 5% by mid-1970, and to practically nonexistent
by 1971.26 The Northern-led and largely conventional Easter Offensive in 1972
temporarily reversed these trends bringing the share momentarily back up to 10%
primarily in Military Regions 1 and 2 where most of the fighting took place. The decline
coincides with the major losses suffered by the Viet Cong from the Tet Offensive and
the subsequent wave of defections in 1969. The decline also begins prior to the shift in
systems, so it is unlikely that the effect is solely because of the change in surveys.
There is further concern that fully rebel controlled hamlets may have simply left
the sample. They could leave in one of two ways, either by being destroyed/abandoned
or by simply disappearing off the roll. A relatively small share of hamlets, 1,375, exited
unexpectedly from the sample. The other 11,490 exited at expected times with 7,983
26 However, the dichotomous measure is crude and one can imagine a number of reasons for the decline
in 1969. Two years in, more resources might have meant an increased ability to rate hamlets that would
have been considered unratable before.
34
exiting due to missing data in December of 1971 and 3,507 lasting until the end of the
sample in December 1972. Of those premature exits, a disproportionate share were Viet
Cong hamlets, 610, and another 198 were listed as having been destroyed.27 This
accounts for some, but not the entire disappearance of the 2,357 hamlets that were rated
V in the first month of the survey.28
27 Data missingness in the latter half of 1969 and all of 1972 make it difficult to identify permanent exits
from destruction in those windows. 28 A more interesting possibility is that a V hamlet was temporarily closed and then reopened with some
degree of government control. There were 2,058 hamlets that were shown as destroyed at least at one
point.
35
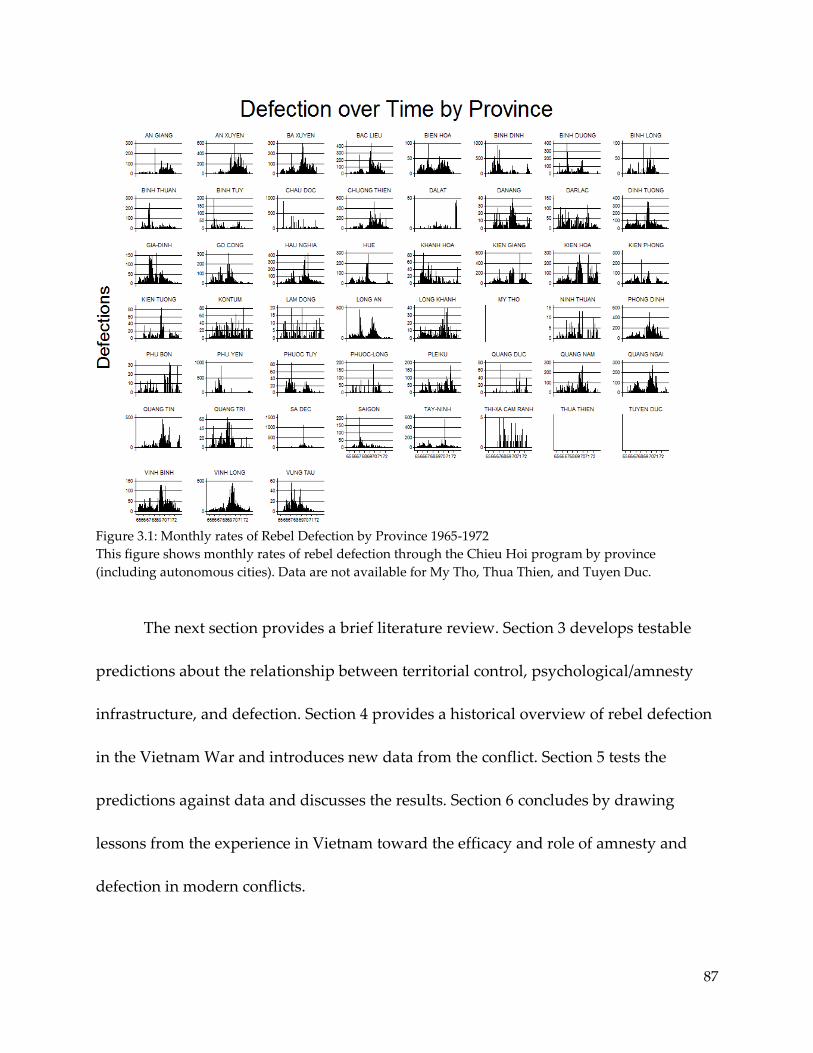
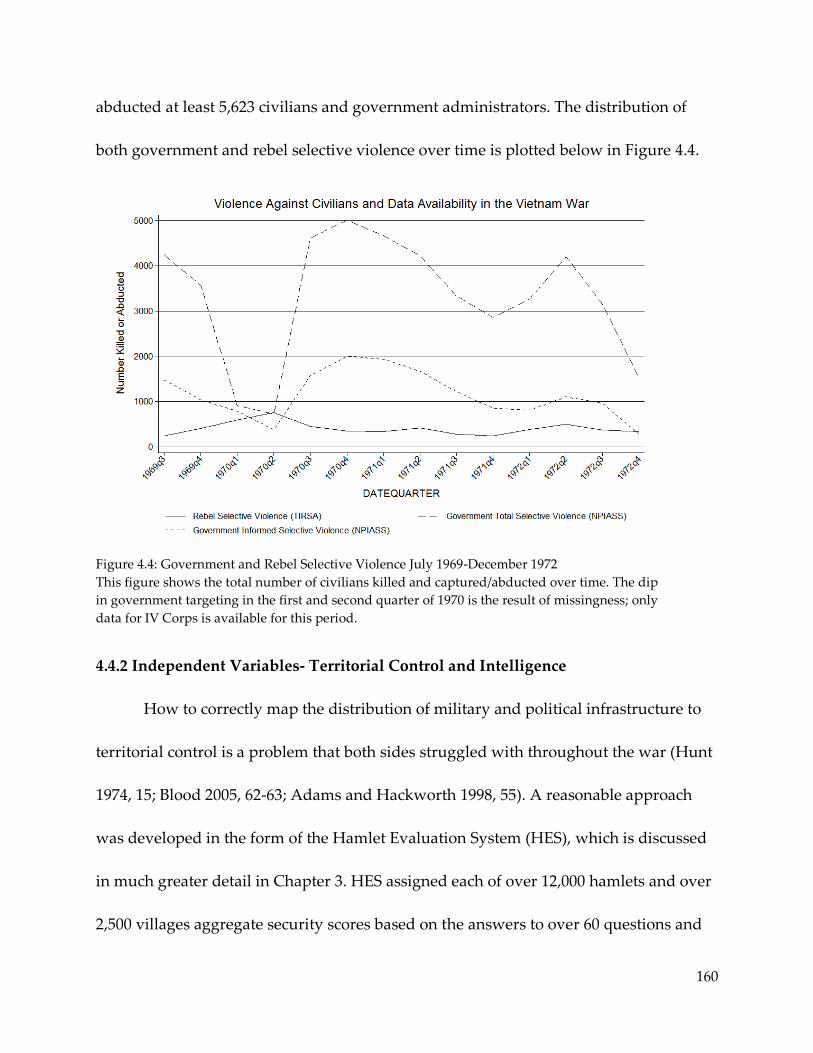
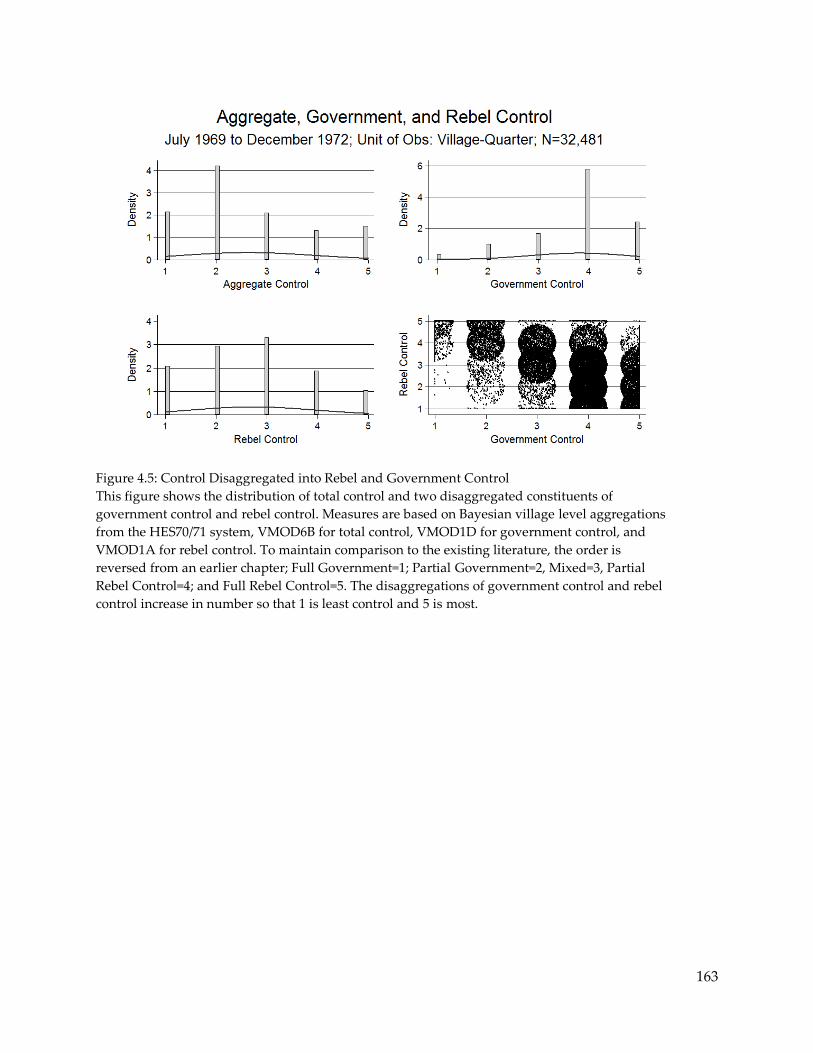
Figure 2.1 Dichotomous Measure of Fully Rebel Controlled
This figure shows the proportion of hamlets listed as unratable because of full Viet Cong control
in either HAMLA or HES70/71. N=780,983.
Both surveys used their own method of aggregating individual questions into
overall security scores. HAMLA used an additive linear model, assigning the V to A
responses on each of the 18 questions a number (V=0, E=1, D=2, C=3,B=2, A=1) and then
grouping them into V,E to A aggregate scores based on arbitrary cut points. The
“problem areas” questions such as on taxation and safety of access were not included in
the final aggregation. In notation,
∑∑
36
Where is the score for each hamlet-month, is the question out of questions, is the
step out of possible steps for that question, and is an indicator variable (0,1) for
whether the response reached that step. No points are awarded for reaching the lowest
step, a score of V, so summation begins starting at the second step.
Using the nine E to A HAMLA questions outlined in section 3, this method
produces the distribution of scores presented below in Figure 2.2. By this method,
security conditions also seem to have improved, at least in parts of the country.
Consistent with the historical record, I and IV Corps have the largest share of
completely Viet Cong controlled hamlets, and I Corps has the lowest starting median
security score. Over time there is a minor decline following the Tet Offensive, but there
appears to be a slight upward trend afterwards in each corps.
37
Figure 2.2: HAMLA Additive Aggregation 1967-1969
This figure shows an additive aggregation of responses to 9 main HAMLA questions relevant to
territorial control. N= 271,273.
2.3.6.3 Bayesian Aggregate HES70/71 Measure
The HES70/71 system used a Bayesian weighting scheme to produce aggregate
scores.29 At each month, each hamlet was considered to have equal probability of laying
in one of the five aggregate ratings (E to A). The designers handpicked the conditional
probabilities for several models that mapped each question answer to low potential
letter scores. The aggregation function and examples of conditional probability tables
are available in Appendix A.3. Village scores were composed of population-weighted 29 “Civil Operations and Rural Development Support Research and Analysis, Hamlet Evaluation System
(HES) Program R7105P, Bayesian Score Program,” no date, folder: Hamlet Evaluation System, RG 472,
National Archives at College Park.
38
hamlet scores. The assigned letter score on each aggregation was the category with the
highest probability as given by Bayes rule.
The E to A scores from one of the Bayesian aggregations, MOD3A, that comes
closest to the control related questions I have selected appears below in Figure 2.3. The
overall upward trend remains. From the beginning of 1969 onward, D and E hamlets
shrink as a proportion of all hamlets, while the share of B hamlets grows to become the
largest plurality. By this metric, the government made major security gains until the
1972 Easter Offensive. The increase in government controlled hamlets in 1971 resulted
from the inclusion of major cities for the first time, broken down into individual wards.
Again, the drops in total observations for 1970 in the II Corps and 1972 in the III and IV
Corps are due to data preservation problems unrelated to security conditions during
the war.
39
Figure 2.3: HES70/71 Bayesian Aggregation July 1969-1972
This figure shows scores on an original Bayesian aggregation from the HES70/71 survey called
MOD3A. N=319,148.
2.3.6.4 Problems with the Existing Aggregations
There are a number of problems with the contemporary aggregations that merit
an alternative approach. Linear aggregations that are not grounded in theory can mask
important causal effects (Signorino and Xiang 2011). In this case the linear aggregation
makes, by assumption, a shift on every question and every step within every question
exactly equivalent. For example, a shift on MLAC1 from B to A, indicating that a rebel
guerrilla unit in the village has been completely driven out of the village and adjacent
villages, is equivalent to moving on ADPL1 from E to D, indicating the inclusion of
40
some local participation in hamlet management. That equivalency would not be true if
we thought some aspects of control were necessary conditions for others, if some levels
of control were more difficult to reach than others, or if advisors defaulted to middling
responses when they lacked good information.
Similarly, the Bayesian aggregation depends on a priori decisions about the
relative importance of various question-answers. This is disadvantageous if we want to
test hypotheses about which questions should be most important. Also, the aggregation
is not replicable because, with few exceptions, the original conditional probability tables
have not been located. Finally, there is no easy means of matching aggregations from
each system against one another. Accordingly, the analysis is necessarily limited to
short periods rather than the full 72 month panel.
2.4 Item Response for Cross Sectional Comparison
Broadly, the item response modeling strategy is to treat answers to HES
questions as realizations of an underlying and unobserved latent trait. In almost every
case, HES questions on topics of local security can be treated as ordinal responses
ranging from least government control to most government control. In political science,
item response models have been used for estimating a wide range of important but
unobservable concepts like democracy (Treier and Jackman 2008; Pemstein et al. 2010),
legislative accomplishments (Clinton and Lapinski 2006), the ideology of legislators
41
(Poole and Rosenthal 2000), judges (Jesse and Tahk 2011), and agencies (Clinton and
Lewis 2007).
This approach is consistent with the view of territorial control as a relative
measure. Contemporary analysts suggested a similar interpretation of security as a
only two distinct underlying traits: security and development (Sweetland 1968). It also
directly addresses a concern that is repeatedly raised about HES—that subjective
classifications do not translate into real world measures of security. A recent review
goes so far as to argue that “this kind of dissociated quantitative response would make
the aggregated data all but meaningless because there would be no standard associated
with the numbers…The kinds of quantitative and graphic reports produced from the
data would be meaningless” (Connable 2012, 118).
The item response theory approach allows for subjective questions to map into
an unobserved objective measure. We do not have to know beforehand which values on
which questions distinguish the most difficult to achieve levels of control; the responses
themselves will provide that ordering. To the degree that we are concerned with this
process varying substantially from rater to rater, we can check for differences in the
structure of this mapping from region to region.30 It places both surveys (and their
30 Another concern is of inter-rater reliability. Without information on the raters, or preferably multiple
raters, there is not much that can be done for controlling for individual raters proclivities. Future research
will tackle this question specifically.
42
changes over time) onto a single consistent scale. The IRT model also produces
estimates of uncertainty that can then be taken into account in other analyses.
2.4.1 Question Selection and Screening
2.4.1.1 Dimensionality
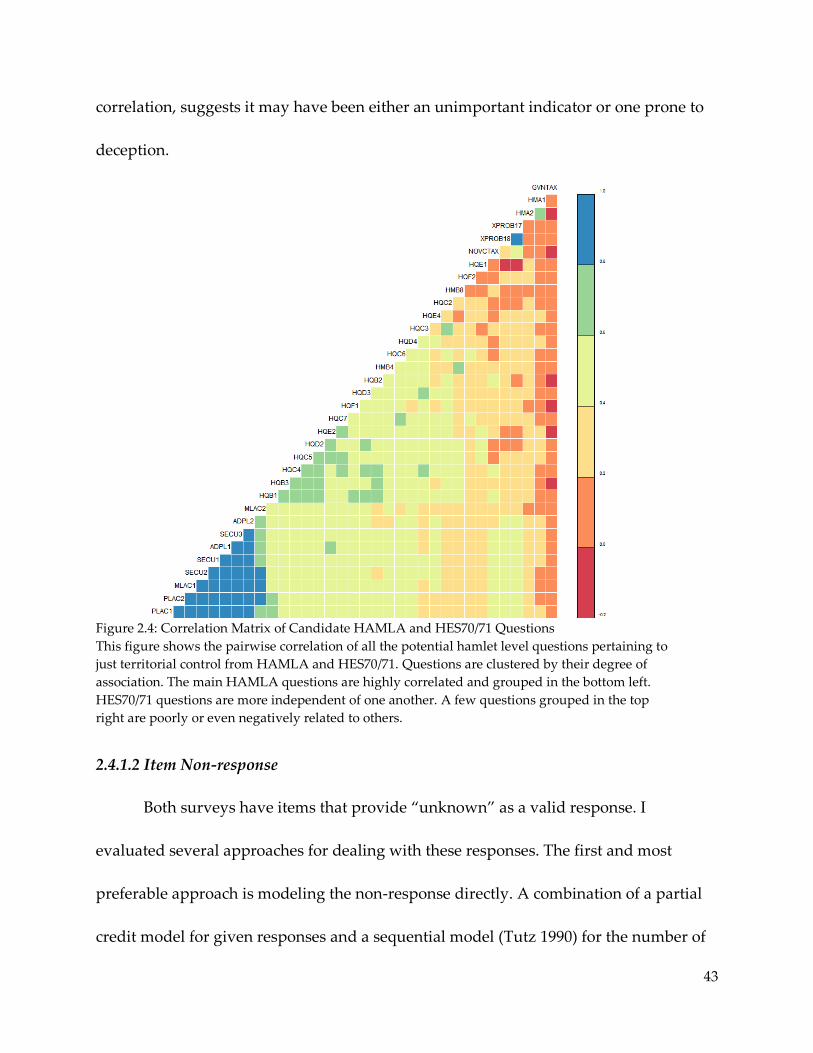
Below in Figure 2.4 is a plot of the pairwise correlation between all of the
candidate HES questions related to control. Questions are clustered by their degree of
association using a seriation algorithm suggested by Kastellec and Leoni (2007). Two
points are of note. First, the HAMLA questions are highly clustered relative to
HES70/71 questions. This observation suggests there may be less information available
in the HAMLA survey than the HES70/71 survey overall. Second, after reordering the
responses to point substantively in the same direction, the correlation is positive for
almost every question. There are two exceptions that are candidates for removal,
government taxation (GVNTAX) and visitation by U.S. personnel (HMA1), which is
actually positively correlated with Viet Cong taxation (or in this case negatively
correlated with “not taxing”), and negatively correlated with several other questions.
Further investigation shows that hamlets were almost always recorded as having
government taxation, 146,212 (83.38%) to 29,146 (16.62%). Responses about visitation by
U.S. personnel were more evenly divided across possible answers, but the weak
43
correlation, suggests it may have been either an unimportant indicator or one prone to
deception.
Figure 2.4: Correlation Matrix of Candidate HAMLA and HES70/71 Questions
This figure shows the pairwise correlation of all the potential hamlet level questions pertaining to
just territorial control from HAMLA and HES70/71. Questions are clustered by their degree of
association. The main HAMLA questions are highly correlated and grouped in the bottom left.
HES70/71 questions are more independent of one another. A few questions grouped in the top
right are poorly or even negatively related to others.
2.4.1.2 Item Non-response
Both surveys have items that provide “unknown” as a valid response. I
evaluated several approaches for dealing with these responses. The first and most
preferable approach is modeling the non-response directly. A combination of a partial
credit model for given responses and a sequential model (Tutz 1990) for the number of
44
missing responses would properly attribute both answer and missingness to the
underlying latent trait (Glas and Pimentel 2008). I attempted a version of the sequential
model and latent tree framework (De Boeck and Partchev 2012) and found it to be
computationally infeasible given the number of questions and time periods.31 A second
approach is to simply score the missing questions as the lowest possible category,
equating unknown with fully rebel controlled. However this approach is known to
produce biased estimates (Rose et al. 2010). A third approach is to consider each non-
response as missing at random. The Generalized Partial Credit Models (GPCM) handles
these missing observations by giving them a weight of zero in the conditional likelihood
(Fischer 1994, 181). In this application, this option is not unrealistic given that often only
one or two questions were marked unknown and overall missingness was very low.
Usually, only a few percent of responses were missing except for two questions that
have a missing rate of just over 5%.
2.4.2 Partial Credit Item Response Models
Many HES questions are categorical, ordered along the same latent dimension of
control. The partial credit model allows each question and each step within each
question to have varying difficulties (Andersen 1983, Masters 1982).32 Assume that each
31 Specifically, even with subsampling the number of hamlets the memory requirements rise nonlinearly
with the number of time periods. The approach failed on a server with 128gigs of ram using the lme4 R
package (Bates and Sarkar 2007). 32 An alternative for polytomous items is the Graded Response Model. I prefer the partial credit model
because it allows the ordering of difficulty of the responses to vary if that is reflected in the data. This is
45
HES question can be broken into steps such that each step represents a greater degree of
government control than the prior step. For example, question HQB2 asks “Does the
enemy collect taxes from hamlet households (in cash or in kind)?” and has three
ordered responses: “No,” “Yes, sporadically,” and “Yes, regularly and systematically.”
From the government’s perspective, an answer of No indicates greater control than
sporadically, which is also better than regularly and systematically. In notation, let
represent the number of correct steps by respondent on question out of possible
steps for that question. The partial credit model takes the following form:
( | ) [∑ ( )
]
∑ [∑ ( ) ]
Where the parameter represents the individual’s ability on a single underlying latent
trait. The parameter is a step parameter, the item’s difficulty (how hard it is for the
whole group). The item’s discrimination parameter represents how much harder it is
for individuals of low ability compared to individuals of high ability and is represented
by (Baker 2001). The parameter is a scaling constant. In terms of HES, we would
consider to be the degree of the unobserved control by the government; how
common it is to have positive reports on that particular security question; and how
common it is to have positive reports on that particular security question for
communities with very poor security relative to communities of generally high security.
particularly important for HES questions because responses to rebel presence and government presence
could interact in unpredictable ways.
46
Probabilities are expressed in terms of the base category, for which I have reordered
responses so that the base category always represents the most Viet Cong controlled. I
estimate the model using marginal maximum likelihood with the Gauss-Hermite
quadrature rule implemented in the R package ltm (Rizopoulos 2006).
For each month, there are three estimated parameters, a discrimination
parameter for each question, , a difficulty parameter for each step within each
question, , and a person parameter for each hamlet, . I have included 13 HAMLA
questions and 22 HES70/71 questions, which means there are 79 question parameters
per month for HAMLA alone. Rather than present 72 models and a few thousand
parameters, I instead organize the results around three questions. First, how did the
HES questions map into control? Second, how did control vary across space in South
Vietnam? Third, how did control vary across groups within South Vietnam?
2.4.3 How Did Different Questions Map onto Control?
Control Estimates
One way of examining relative control between areas is to compare the estimates
of , representing the underlying latent degree of government territorial control. In the
IRT literature these are called person parameters or factor scores. The scale itself is
determined by the chosen functional form and does not have inherent theoretical
properties (Reckase 2009, 17). Each unadjusted estimate of reflects the relative degree
47
of control between hamlets in that given month. This estimate of latent control is on an
interval scale which could in principal run from negative infinity to positive infinity but
for this sample ranges from -4.65 to 3.07, see Figure 2.5. Figure 2.6 shows that the
estimated measure of control varies nonlinearly with the additive aggregation, and that
there is a great deal of overlap in the distribution of theta for different final letter
scores from the Bayesian aggregation.
48
Figure 2.5: Distribution of Estimated Latent Control
This figure shows the distribution of latent control, the person parameter estimates , across
every model. By assumption, the distribution should be normally distributed around zero with
variance 1. Here, the mean is -.03282, standard error .9626822, min -4.580942, and max 3.079416.
Figure 2.6: Contemporary Measures Compared to the New Estimate
This figure shows how contemporary aggregations used during the war compar to estimates of
latent control from the partial credit model. The HAMLA additive aggregation is the sum of the 9
main questions. The HES70/71 Bayesian aggregation is MOD3A. The additive measure misses the
nonlinear distribution of responses and control, particularly for hamlets that are more rebel
controlled. The Bayesian aggregation does vary linearly with the new measure, but it has a great
deal of unecessary overlap between neighboring categories.
49
Item Difficulties
Each step of each question has an estimated difficulty parameter , which is the
point on the latent scale where reaching a given category is equally likely as staying at
the previous category. There are then difficulty parameters for levels of answer
for each question. In every case the base category is the lowest category, , for the
answer signifying the most Viet Cong control. A person item map is a convenient way
of graphically representing difficulty parameters against the distribution of the latent
trait.33 I provide person item maps for two cross-sections: October 1967 and its HAMLA
based questions, and October 1970 and its HES70/71 based questions. Along the top is a
histogram of estimated hamlet control levels. Below, each question’s difficulty
parameters are represented by numbered open circles arranged in order of increasing
difficulty. A solid black circle indicates the item’s threshold difficulty, which is an
average of all of the individual item difficulty parameters.
Figure 2.7 summarizes item difficulty for HAMLA questions asked in October
1967.34 Overall the polytomous responses do a good job of distinguishing shades of
control along the whole latent dimension, with a bit more information provided at the
higher end of government control. The model captures the way that some letter grades
on some questions are very different from one another while others are for all practical
33 The person-item maps were generated using a modified version of the plot functions in the R package
eRm (Mair and Hatzinger 2007). 34 Recall that being fully Viet Cong controlled serves as a type of left censoring, where no information is
available and thus further variation in control is impossible to determine.
50
purposes interchangeable. It also captures how responses are sometimes not strictly
ordered along the dimension of control. Consider the two questions on US Advisor
access to the hamlet, XPROB17 and XPROB18. A second level response states “not
feasible except by accompanying an operation,” which scores higher on government
control than the third level, “special security arrangements necessary.” In this case, the
ambiguity of the responses and the likely extra dimension of where “operations” are
conducted overrode the intended ordering on the form. The partial credit model is
specifically designed to catch these types of unordered responses.
51
Figure 2.7: Person Item Map for HAMLA Questions in Oct. 1967
This figure summarizes difficulty parameters for HAMLA questions asked in October of 1967.
The top portion is a histogram of hamlet control estimates. The bottom portion shows the
difficulty parameter of each answer of each question, with the lowest base answer ommitted. The
solid circle is the average of a question’s difficulty paramaters. The model is a generalized partial
credit model with Log likelihood -89085.95, AIC 178285.9, and BIC 178672.7.
52
Given that a hamlet was rated, hamlets with the least government control were
distinguished by a score of E on MLAC1 and SECU2, and the lowest category on
XPROB17 and XPROB18. These were hamlets where the village guerrilla unit was
effective with village defenses intact, the clandestine village political infrastructure was
intact and functioning, and where U.S. Advisor access to the hamlet was unfeasible by
either surface road from the district headquarters or by airstrip/helicopter. Conversely,
hamlets that were strongly government controlled were distinguished by a score of A
on SECU1 and ADPL2, as well as the highest category on the two travel questions
XPROB17 and XPROB18. In these hamlets weapons were unnecessary for travel by air
or surface, there were adequate local defense forces with police day and night in urban
areas, and there was a resident GVN grievance representative living in the hamlet.
Rebel rent collection in the form of Viet Cong taxation lands squarely in the middle of
the distribution.
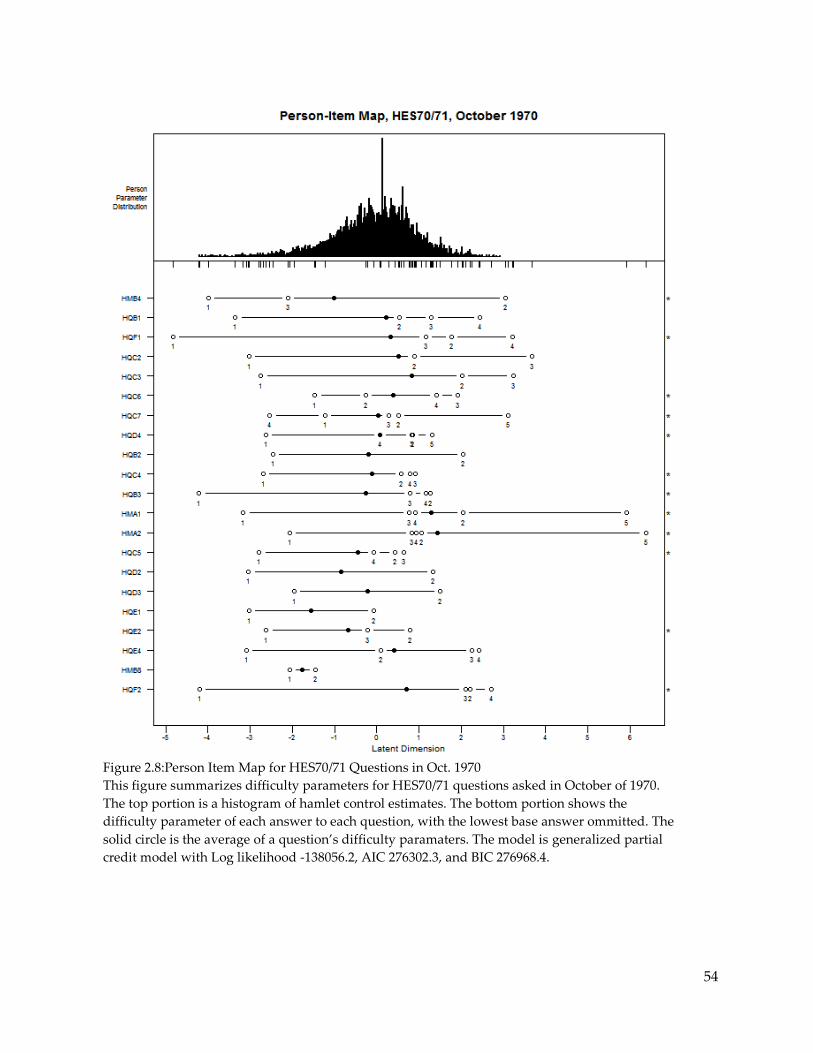
Figure 2.8 summarizes item difficulty for HES70/71 questions asked in October
1970. Again the questions do a good job of distinguishing across the full range of the
latent measure. The most strongly Viet Cong controlled hamlets are distinguished by
the lowest category on HQF1, HQF2, HMB4, and HQB1. These are hamlets in which
nearly all of the households have members in the rebel group, where no households
have members in government civil or military service, where armed rebel military
forces were present regularly, and rebel forces were the primary authority day and
53
night. The most highly government controlled hamlets were distinguished by the
highest category on HQC2, HMA1, HMA2, and HQF1. These were hamlets in which
local security patrols were not needed at night because there was no rebel threat, US
advisory personnel were resident in the hamlets, and no households had members in
the rebel organization.
54
Figure 2.8:Person Item Map for HES70/71 Questions in Oct. 1970
This figure summarizes difficulty parameters for HES70/71 questions asked in October of 1970.
The top portion is a histogram of hamlet control estimates. The bottom portion shows the
difficulty parameter of each answer to each question, with the lowest base answer ommitted. The
solid circle is the average of a question’s difficulty paramaters. The model is generalized partial
credit model with Log likelihood -138056.2, AIC 276302.3, and BIC 276968.4.
55
Item Discrimination
In addition to item difficulty, there is the question of how well an item
discriminates between hamlets on low and high levels of control. Ideally, a question
would be perfectly discriminating such that every hamlet that scored positive on that
question was, for certain, above a particular level of control and a negative response
would indicate control was, for certain, below a particular level. In practice, items will
not perfectly discriminate but instead will have a slope for which steeper is more
informative.
Figure 2.9 presents discrimination parameters for HAMLA questions from
October 1967, where higher values imply greater ability to discriminate Viet Cong
controlled hamlets from government-controlled hamlets. The results are what we
would expect based on the wording of the questions and responses, and are strong
evidence for the internal validity of HES. For example, the discrimination of questions
varies directly with the specificity of the question wording. The most discriminating
question, PLAC1, asks about Viet Cong political infrastructure stationed directly in that
hamlet, while most other questions refer to the village overall. The least discriminating
question, MLAC2, refers to the broadest area, general military capabilities across an
entire district, “within a few hours travel to the hamlet.” Another interesting pattern is
that questions on security factors trump questions on political factors, with both
administration questions ADPL2 and ADPL1 ranking next to lowest in discrimination.
56
Security could be a pre-requisite for political infrastructure, or raters completing the
survey could have been more familiar with military matters in each hamlet.
Interestingly, no Viet Cong taxation places highly in discrimination, up with guerrilla
and political infrastructure presence, suggesting that lack of rent collection in an area is
a strong indicator of no rebel presence.
Figure 2.9: Discrimination Parameters for HAMLA Questions Oct. 1967
This figure shows the item discrimination paramaters for the 12 HAMLA questions available
in October 1967. Item discrimination is the slope of the item’s response function. Highly
discriminating questions are more difficult for hamlets with lower government control than
hamlets with high government control.
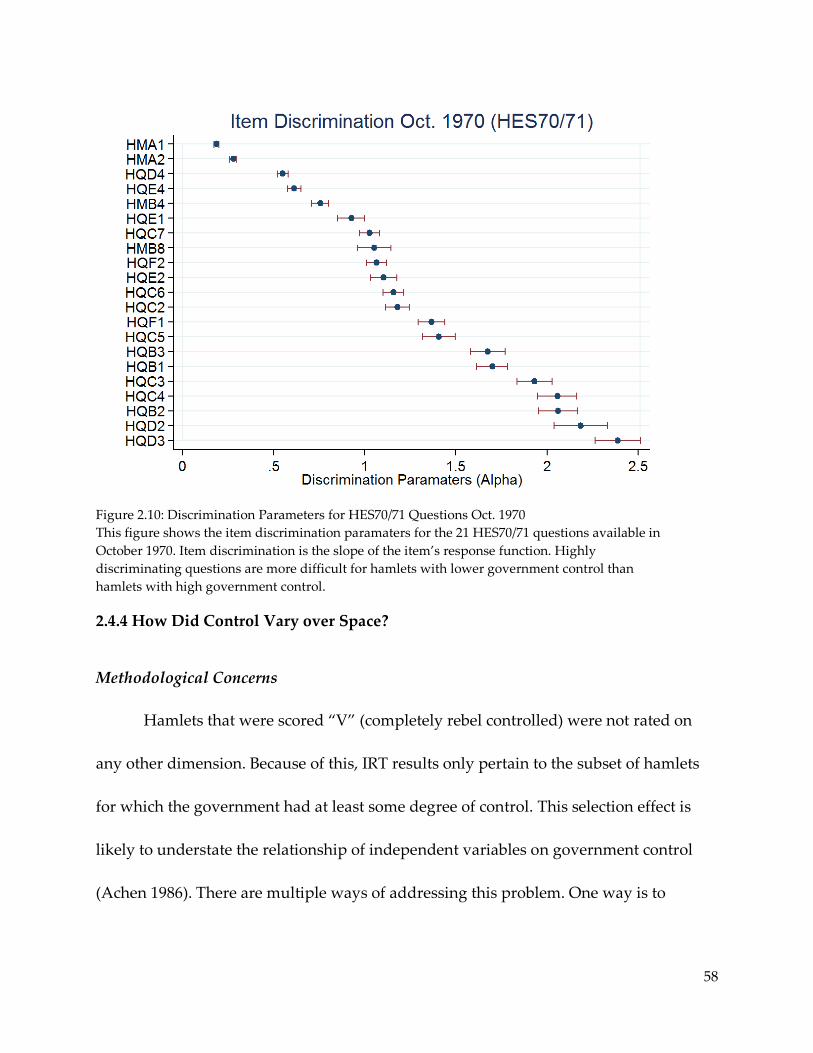
Figure 2.10 presents discrimination parameters for HES70/71 questions from
October 1970. The four least discriminating questions, HMA1 and HMA2, HQD4, and
HQE4 all pertain to the frequency of visits by U.S. and GVN personnel to the hamlet.
57
This could either mean that security conditions did not greatly influence the likelihood
of visiting, which is unlikely, or there was a tendency to exaggerate the frequency or
importance of visits. In contrast, the most discriminating questions are directly in line
with the theoretical understanding of control proposed in section 2. HQD2 and HQD3
ask about the government’s ability to actually enforce law in the hamlet. This is nice
confirmation of the view that there is a tendency for governments to claim security in
areas if a few administrators visit in day time while accompanied by guards, but in
reality these areas are either ungoverned or rebel governed. As it was before, Viet Cong
taxation, HQB2, is a highly revealing question.
58
Figure 2.10: Discrimination Parameters for HES70/71 Questions Oct. 1970
This figure shows the item discrimination paramaters for the 21 HES70/71 questions available in
October 1970. Item discrimination is the slope of the item’s response function. Highly
discriminating questions are more difficult for hamlets with lower government control than
hamlets with high government control.
2.4.4 How Did Control Vary over Space?
Methodological Concerns
Hamlets that were scored “V” (completely rebel controlled) were not rated on
any other dimension. Because of this, IRT results only pertain to the subset of hamlets
for which the government had at least some degree of control. This selection effect is
likely to understate the relationship of independent variables on government control
(Achen 1986). There are multiple ways of addressing this problem. One way is to
59
impute an IRT score for hamlets under rebel control, setting it to ( ) in each
month.
Additionally, special care has to be taken when using an estimate of a latent trait
as a dependent variable instead of a directly observed trait.35 In the latter, uncertainty is
rooted in measurement error and sampling. In the former both of those are present as
well as uncertainty from the estimation process. Variation in the estimation uncertainty
acts as a type of heterosketasticity in ordinary least squares (OLS). This will not bias the
OLS estimates, but it will affect the standard errors. Employing White (1980) or Efron
(1982) heteroscedastic consistent standard error estimators will address this
heterosketasticity, but we can do better by directly incorporating the information we
have on the uncertainty of the estimates as reported alongside the IRT estimates. I use
the two-step procedure implemented by Lewis and Linzer (2005) and first described by
Hanushek (1974). In that procedure, a set of weights for observations are
constructed such that:
√
35 See Borjas and Sueyoshi (1994), Lewis and Linzer (2005), and Huber and Kernell (2005).
60
Where, is the known variance of the sampling error and is the usual variance
from the OLS procedure. Those weights are then fed into Feasible Generalized Least
Squares.36
Variation in Control by Province
To gauge relative control across provinces for the entire period, I estimate a
FGLS model with the following form,
where is the estimate of latent control generated by the GPCM, is an intercept
term, is a month fixed effect, is a province fixed effect, and is hamlet-
month error term.37 I estimate 95% confidence intervals using robust standard errors
clustered on each hamlet and the two-step correction described in the previous section.
I estimate the model twice, setting the base province the second time to the one with the
mean estimate on the province fixed effect, which in this case was Ba Xuyen. The
province fixed effects can then be interpreted as the relative change in latent
government control averaged across hamlets within a province and across time periods
for which data are available.
36 The procedure is implemented in Stata as edvreg 1.1, http://svn.cluelessresearch.com/twostep/trunk/ 37 The control estimates used here are not linked, as described in the next section. How then can we
compare estimates from different models? The estimates of control are relative to one another, and the
distribution is imposed by the IRT process, mean zero and variance one. We are then effectively only
asking whether a particular province was above or below average in each individual period.
61
The province estimates are below in Figure 2.11. Even at this level of aggregation,
many provinces are statistically distinguishable from one another in control and the
results compare favorably to historical accounts of the conflict. The cities, Da Nang,
Hue, Saigon, Vung Tau, all appear toward the top end of government control. An Giang
which was home to the strongly anti-communist Hoa Hao sect is the second most
government controlled province (Kalyvas and Kocher 2007). Provinces that ranked
lowest in government control are not surprising either. Hau Nghia, Dinh Tuong, and
Long An were all selected for detailed historical case studies based on their centrality to
the conflict in III Corps near Saigon (Bergerud 1993, Race 1972, Elliot 2003).
62
Figure 2.11: Average Relative Control by Province 1967-1972
This figure shows the difference in relative control of each province (and autonomous city) for
the whole period from 1967-1972. The mean province, Quang Tri, serves as a base category. Point
estimates are from a Feasible Generalized Least Squares regression with month fixed effects, and
confidence intervals are calculated from robust standard errors clustered on hamlet and weighted
by the IRT sampling error as discussed in the text. N= 485,505, and = 0.184.
KIEN HOAHAU NGHIA
PHONG DINH
AN XUYENVINH BINH
DINH TUONG
VINH LONGPHU YEN
BINH DINH
LONG ANBAC LIEU
CHUONG THIENQUANG NGAIQUANG NAM
PHUOC TUYKIEN GIANG
PLEIKU
TUYEN DUCBINH LONG
KIEN PHONGDARLAC
QUANG TIN
SA DECQUANG TRI
BA XUYEN
GIA-DINHBIEN HOA
BINH DUONG
BINH THUANKONTUM
DALATCHAU DOC
KHANH HOA
THUA THIENLAM DONG
LONG KHANH
QUANG DUCPHUOC-LONG
BINH TUYNINH THUANKIEN TUONG
PHU BONGO CONG
TAY-NINH
THI-XA CAM RANHDANANG
SAIGONAN GIANG
HUE
VUNG TAU
-1 0 1 2Difference in Mean Control from Average Province (Quang Tri)
Average Relative Government Control by Province 1967-1972
63
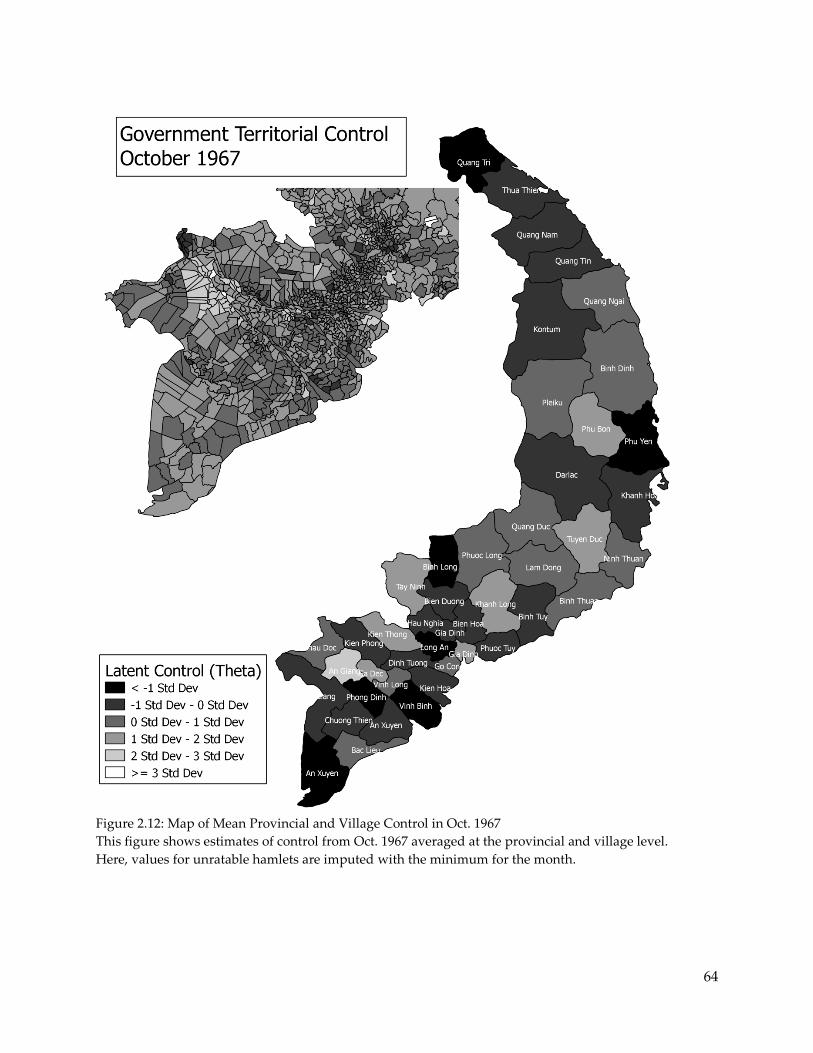
A more focused comparison over space is provided in Figure 2.12 which plots
average latent control (imputed for fully rebel control) for a single cross section of
October 1967. Quang Tri which directly faced North Vietnam, Binh Long which was a
major jumping off point for the Hoi Chi Minh Trail, An Xuyen which was extremely
rural and remote from the government’s perspective, all have the lowest levels of
government control. The inset displays variation in control by village that picks up the
spatial clustering of control. One can see both the pro government areas, like the Hoa
Hao villages which are white in the upper left, as well as fully Viet Cong controlled
villages which are black, particularly along the border with Cambodia.
64
Figure 2.12: Map of Mean Provincial and Village Control in Oct. 1967
This figure shows estimates of control from Oct. 1967 averaged at the provincial and village level.
Here, values for unratable hamlets are imputed with the minimum for the month.
65
2.4.5 How Did Control Vary by Local Conditions/Demographics?
Without a strong theoretical reason for why some hamlets are considered fully
Viet Cong controlled and unratable while others are not, it is important to consider the
effects of a regressor on both the probability of being rated and the degree of control if
rated. In comparing variation in control across subgroups, I estimate two models. The
first is, as before, an estimate of latent control in a linear framework with a global
intercept, month fixed effects, and a series of dummy variables for each nominal
category of the variable of interest. The second uses a logistic regression to estimate the
probability of being rated, with robust standard errors clustered on hamlet. For both
models, I include the log population of the hamlet.
Variation in Control by Demographics and Economic Conditions
Territorial control varied widely. Both sides invented terms to describe their hold
over territory, including “oil spots,” “iron bands,” “security belts,” etc. Both sides
attempted to employ fortifications to move hamlets from contested or partially
controlled into fully controlled. The Viet Cong built “combat hamlets” and the GVN
attempted a failed program to relocate civilians to new fortified communities closer to
the main roads called “New Life Hamlets.” Urban areas contained communist
infiltrators and sympathizers yet communists were rarely able to raise or maneuver
large units in those areas. In repeated attempts from 1951 to 1968, both the Viet Minh
and Viet Cong repeatedly failed to seize control over urban areas. Despite its dominant
66
advantages in manpower and firepower, the government similarly found it difficult to
take and hold territory outside urban areas. At the tactical level, the modal strategy was
to deliver forces into an area, establish a defensive position, and then to rely on air and
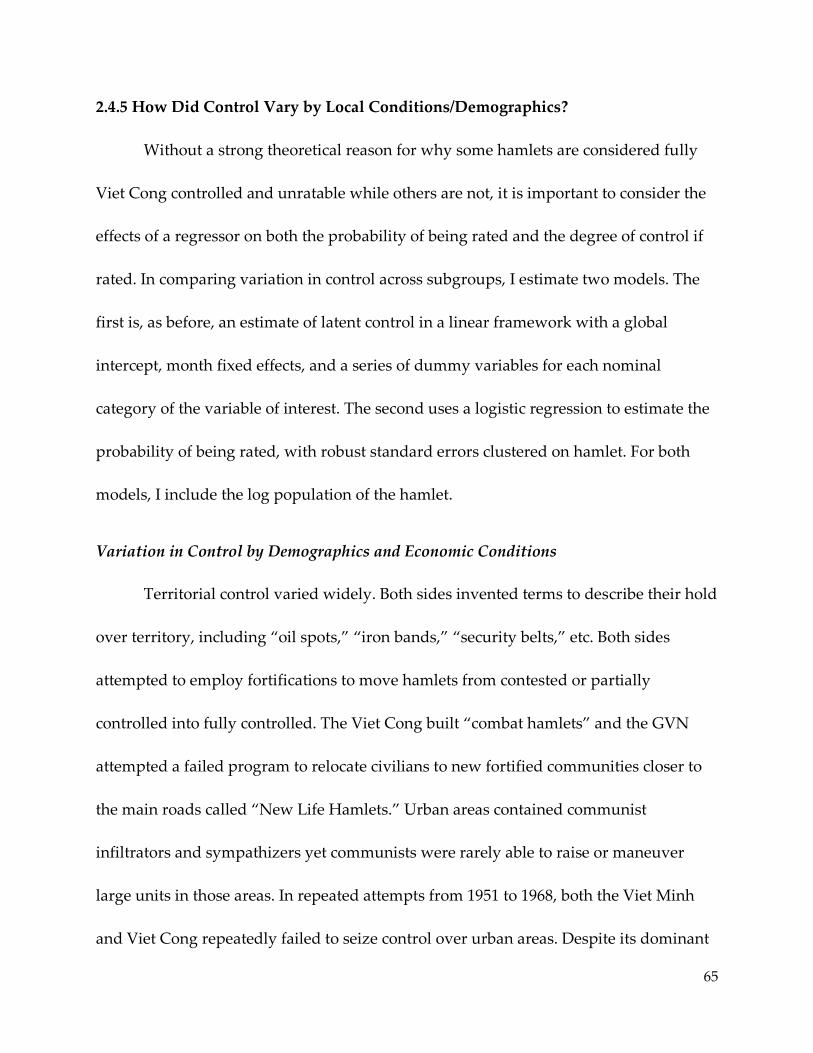
artillery fire if the rebels chose to engage (Clodfelter 1995,72).38 Figure 2.13 shows
differences in ratability and control by the type of hamlet, its prominence as an
administrative center, and its urban or rural status. As expected, urban status and status
as an administrative center have strong positive relationship with government control,
even while controlling for population size. Refugee camps appear slightly more
government controlled than others, but older hamlets, recently built hamlets, and
refugee camps were not statistically distinguishable from one another.
38 The Viet Cong were aided by a number of geographic features. Dense jungles provided concealment,
allowing rebels to close with government forces unnoticed. In other parts of the country, the soil was
amenable to tunneling, and the Viet Cong dug an estimated 30,000km of tunnels including some under
U.S. bases. (Clodfelter 1995,77).
67
Figure 2.13: Control and Hamlet History, Administrative Role, and Urbanity
This figure shows variation in control and ratability as a function of recent hamlet history, status
as an aministrative center, and urbanity. Parameter estimates are from logit, N=544,968 and
Pseudo = 0.2374, and FGLS, N= 481,167 and = 0.2531. Administrative center and hamlet
history are imputed for HAMLA observations based on the first recorded value in HES70/71.
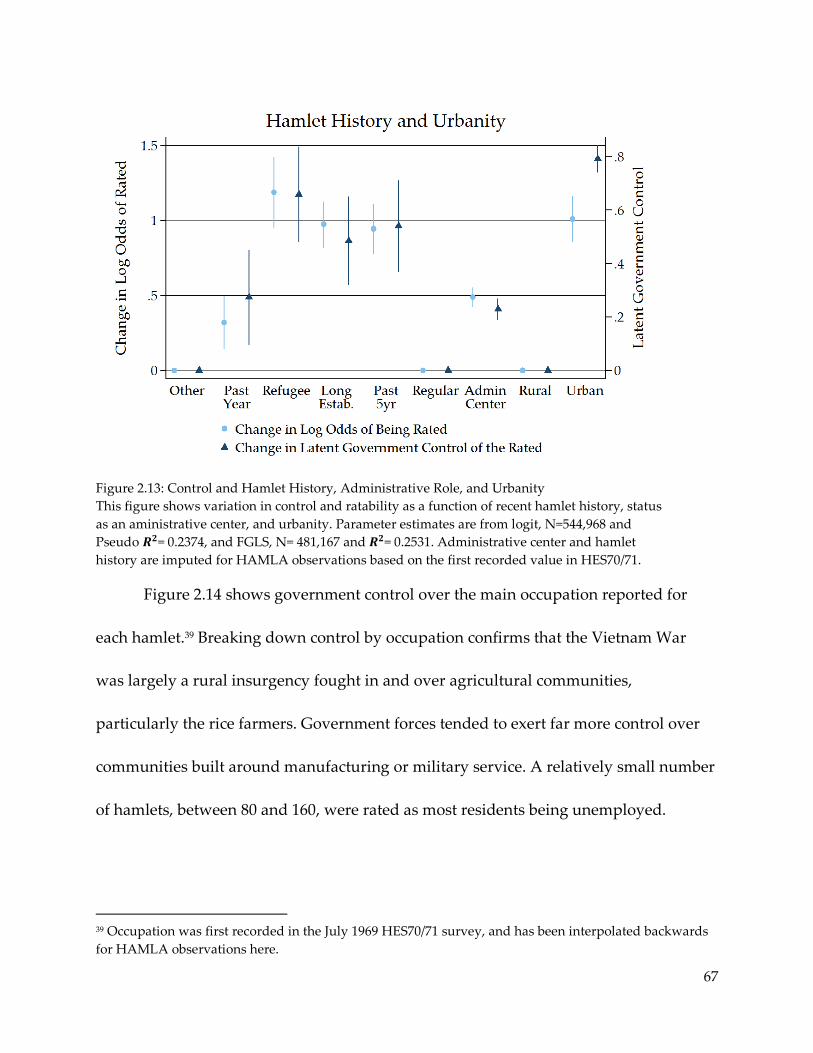
Figure 2.14 shows government control over the main occupation reported for
each hamlet.39 Breaking down control by occupation confirms that the Vietnam War
was largely a rural insurgency fought in and over agricultural communities,
particularly the rice farmers. Government forces tended to exert far more control over
communities built around manufacturing or military service. A relatively small number
of hamlets, between 80 and 160, were rated as most residents being unemployed.
39 Occupation was first recorded in the July 1969 HES70/71 survey, and has been interpolated backwards
for HAMLA observations here.
68
Hamlets with high unemployment were middling in government control. This is
neither strong support for or against the economic deprivation theory of rebellion.40
Figure 2.14: Control and Hamlet Primary Occupation
This figure shows variation in control and ratability as a function of the hamlet’s primary
occupation. Parameter estimates are from logit, N= 557,021 and Pseudo = 0.2363, and FGLS, N=
484,523and = 0.1496. Occupation is imputed for HAMLA observations based on the first
recorded value in HES70/71.
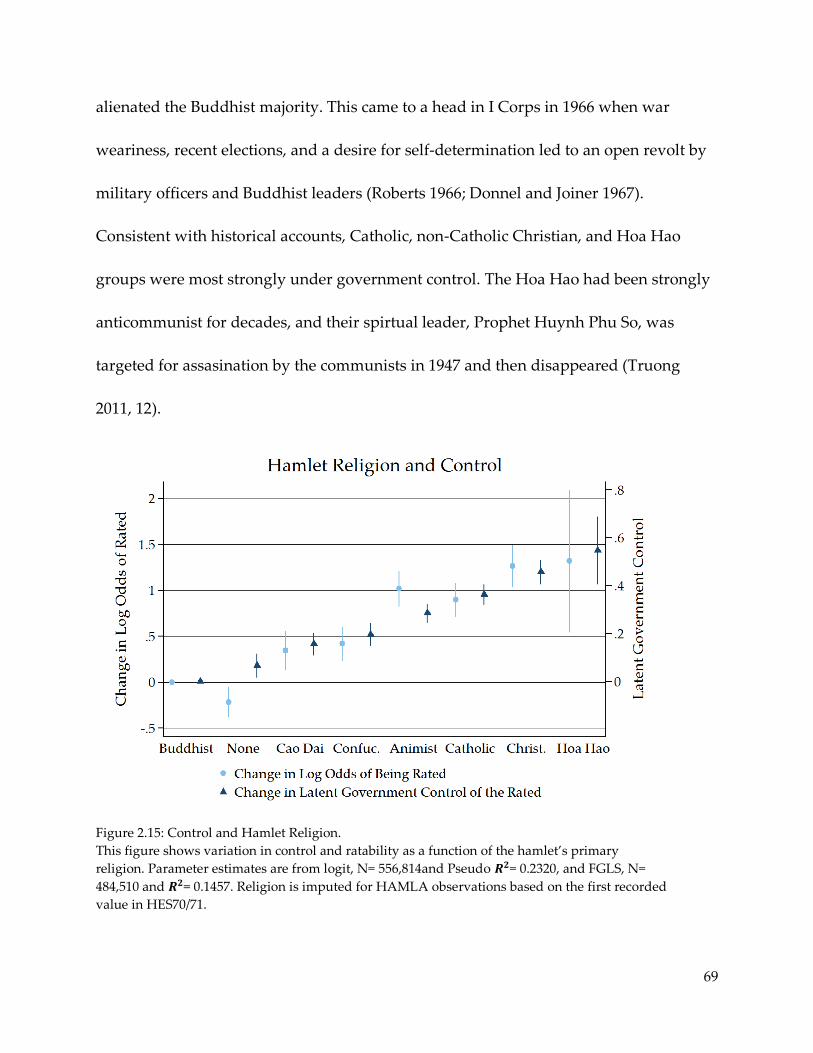
Figure 2.15 confirms that there were clear distinctions in control between hamlets
with different religious compositions (Kalyvas and Kocher 2007). 90% of the population
was Buddhist, and their areas were less likely to be rated and less government
controlled than any of the minority religions. Beginning with President Hgo Dinh Diem,
the government of South Vietnam built institutions around the Catholic minority which
40 See Blattman and Miguel (2010) for a general survey of this literature. Other measures of economic
development in South Vietnam, including some recorded by HES, may provide a more definitive test.
69
alienated the Buddhist majority. This came to a head in I Corps in 1966 when war
weariness, recent elections, and a desire for self-determination led to an open revolt by
military officers and Buddhist leaders (Roberts 1966; Donnel and Joiner 1967).
Consistent with historical accounts, Catholic, non-Catholic Christian, and Hoa Hao
groups were most strongly under government control. The Hoa Hao had been strongly
anticommunist for decades, and their spirtual leader, Prophet Huynh Phu So, was
targeted for assasination by the communists in 1947 and then disappeared (Truong
2011, 12).
Figure 2.15: Control and Hamlet Religion.
This figure shows variation in control and ratability as a function of the hamlet’s primary
religion. Parameter estimates are from logit, N= 556,814and Pseudo = 0.2320, and FGLS, N=
484,510 and = 0.1457. Religion is imputed for HAMLA observations based on the first recorded
value in HES70/71.
70
Finally, Figure 2.16 shows that patterns of control in South Vietnam followed a
clear ordering along the type of units that were tasked with maintaining security. The
ordering supports a theoretical conception of pacification sometimes called “clear,
build, hold,” where big units engage and remove rebel units and then transfer
responsibility of security to regional forces, then local militias, and eventually
professional police forces (Pirnie and O’Connell 2008). Large regular combat units from
the U.S., RVN, or allied nations operated in the most dangerous rebel controlled areas.
Behind them were irregular regional forces, including the Rural Forces and the Civilian
Irregular Defense Group (locally raised militias which were eventually converted to
forward operating Vietnam Army Ranger units). Popular Forces were militias raised
and stationed at the village level. National police field forces traveled out of the cities at
the district level. The People’s Self Defense Forces were members of the local
community provided with light arms. Finally, National Police were what we would
recognize today as professional law enforcement rather than a military agency.
71
Figure 2.16: Control and Primary Government Security Force
This figure shows variation in control and ratability as a function of the hamlet’s primary source
of security by the government. The categories from left to right are: no primary security force,
conventional mainforce units from the South Vietnamese, American and/or allied militaries, the
Rural Forces, the Civilian Irregular Defense Group, the Popular Force, the National Police Field
Force, the People’s Self Defense Force, and the National Police. Parameter estimates are from
logit, N= 315,341 and Pseudo = 0.5778, and FGLS, N= 304,609 and = 0. 3005. Because the
primary type of security force does change over time it was not imputed, and observations are
only available for the HES70/71 period.
2.5 Measuring Control over Time
2.5.1 IRT Linking Methods
To measure change in control over time, estimates from one period have to be
placed on the same scale as estimates from another period. The IRT parameters are scale
invariant; the ordering is unique but the distribution is imposed by the model. Because
of this, estimates from one model can be placed on the same scale as any other through
a linear transformation. The process is known as equating, and the equated estimates,
72
, can then be compared month to month in the same way as relative degrees of
government control. There are at a minimum 9 common questions asked between any
two months and a maximum of 34 because of the six-month overlap in the two surveys.
This is known as a common-item nonequivalent groups design (Kolen and Brennan
2004).
There are two general methods of equating scores from multiple surveys,
concurrent calibration and separate calibration (Hanson and Béguin, 2002).41 The size of
HES precludes concurrent calibration that involves estimating all of the parameters
using all of the data simultaneously. Instead, separate calibration is used to estimate
item parameters for each month. Then, using a linear relationship of the parameter
estimates, parameters are made comparable from month to month and between the
different HES systems.42 There are several linking procedures, but the Stocking-Lord
method is preferred (Kolen and Brennan, 2004; Hanson and Béguin, 2002; Kim and
Kolen, 2006). The procedure is as follows: (1) Estimate the IRT model of choice on each
test separately; (2) Identify common or similarly discriminating questions on both tests;
(3) Using those questions as anchors, find the linear transformation which minimizes
the sum of squared differences between the test characteristic curves on those questions
41 For a review of the distinction between prediction, scaling, linking, and the stronger method of
equating, see (Dorans et al. 2011) 42 For a review of the literature on linking methods, see (Holland and Rubin 1982; Kolen & Brennan, 2004;
von Davier 2011)
73
(Stocking and Lord 1983). The Stocking-Lord method is implemented in the R package
Plink (Weeks 2010).
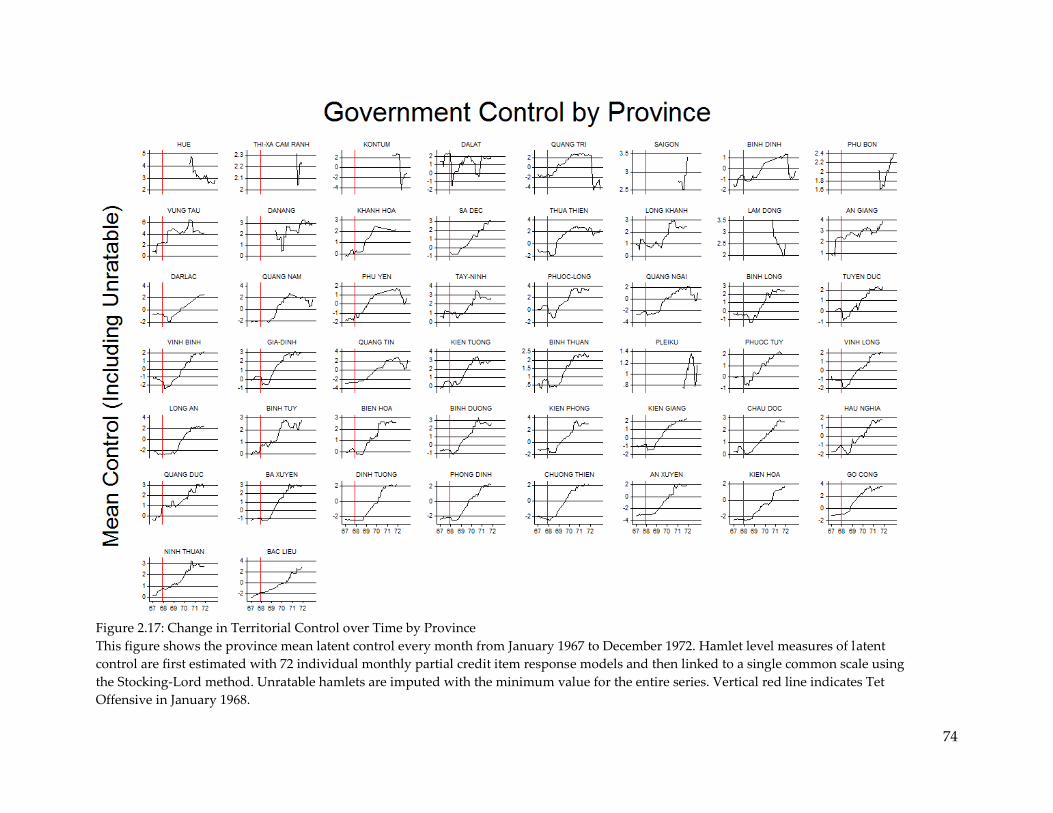
2.5.2 How Did Control Vary over Time?
Figure 2.17 presents the monthly mean linked estimate of latent control over time
and by province. Plots are ordered from top left to bottom right by increasing steepness
of the time trend in control. Even at this level of aggregation, several clear temporal
patterns are discernable. First, HES was not a constantly improving metric as one would
expect if raters were trying to create a false impression of progress.43 Second, overall
trends reflect major events, particularly the Tet Offensive which occurred in January of
1968. Thirty of the provinces exhibited at least a minor decline in ratings of control
following Tet. Tet also reduced both scores on hamlets and also the number of hamlets
being scored (Kamras 1969, 38). Tantalizingly, eight of those provinces show at least a
slight decline in security prior to Tet. Gayver (2010, 7) notes that early indications of Tet
appear in several of the HES indicators in the months leading up to the event.44
43 A more difficult problem would be a cyclical reporting style, with raters dropping scores at the
beginning of their tour in order to raise them by the time they leave (Connable 2012, 224). Coding of the
accompanying advisor reports will allow a comparison of an expert survey to qualitative narrative
reports in the same environment. I am in the process of gathering information on the rotation of district
senior advisors so that observations can be further clustered on the specific individual filling out the
form. 44 Future analysis could retroactively compare shifts in latent control leading up to Tet in areas where
rebel forces were staging to control areas matched on a number of criteria.
74
Figure 2.17: Change in Territorial Control over Time by Province
This figure shows the province mean latent control every month from January 1967 to December 1972. Hamlet level measures of latent
control are first estimated with 72 individual monthly partial credit item response models and then linked to a single common scale using
the Stocking-Lord method. Unratable hamlets are imputed with the minimum value for the entire series. Vertical red line indicates Tet
Offensive in January 1968.
75
2.5.3 Robustness and Item Parameter Drift
Unfortunately, there are two different states of the world that are observationally
equivalent.45 The first is that the common anchor items function the same way across
every group and every time point, and differences in the scores are completely due to
differences in the underlying trait of interest. The second is that the groups actually
have the same measure on the latent trait, and the difference in score is completely
attributable to differences in the way the test behaves for each group.46 The degree to
which this occurs is called differential item functioning (DIF) or the case of multiple
time points parameter drift/longitudinal invariance (Goldstein 1983). The absence of
DIF is formally defined as (Osterlind and Everson 2009):
( | ) ( | )
where is the response to particular test item, the latent trait is , ( ) is the probability
distribution of responses given the trait, and is either the focal group or the
reference group . For a test to have zero differential item functioning, the probability
of a correct response must be equal for two individuals from different groups that share
the same level of that trait.
45 For a practical guide to checking measurement invariance in longitudinal IRT models see Millsap
(2010). 46 Items can vary in difficulty, discrimination, or both and even when close to one another from one
month to the next they can still exhibit a long term linear shift across the whole sample (Demars 2004).
Another case is when items shift in opposing directions over time (Han et al. 2012).
76
Analysis of the parameter estimates show differential item functioning both
across months and between groups within months. Items with DIF can be flagged
automatically using a logistic regression method of detecting differential item
functioning proposed by Swaminathan and Rogers (1990), extended to polytomous
items (French and Miller 1996; Miller and Spray 1993; Zumbo 1999), and implemented
as in R package lordif (Choi et al. 2011). For several months and several different
subsets of the data, many if not every item was flagged for DIF. Consider a visual
comparison of discrimination parameter for each question over time, shown below in
Figure 2.18. The ordering of questions remains relatively constant, but items tend to
become more discriminating over time. The estimates also become more noisy month to
month in periods where missingness reduces the sample size, in 1969 and again in 1972.
77
Figure 2.18: Unlinked Item Discrimination Parameters Across All Months
This figure shows the item discrimination parameter of each question for each of the 72 monthly
partial credit item response models. Ideally, a question will perform roughly the same across
months but in practice will vary for a number of reasons. In this case, estimates become much
noisier in 1969 and 1972 when the sample size is cut in half due to missingness. Many items also
become more discriminating over time as previously unratable hamlets are included in the pool.
It is difficult to say how much of the temporal pattern is driven by changes in the
underlying distribution of control versus shifts in the functioning of the survey. The
existing research on the actual impact of item drift on estimates of the latent trait
suggests that the effect may be small. Studies of unidirectional item drift over time have
found a small impact (Wells et al. 2002; Witt et al. 2003; Kim and Cohen 1992; Rupp and
Zumbow 2003, 2006; Stahl, Bergstrom, and Shneyderman 2002; Takala and Kaftandjieva
2000). Puhan (2009) studied equating across long chains of test forms and found a
relatively small impact of drift. A review of recent studies on the relationship between
78
DIF and item parameters suggests that there is only a small effect on estimates of the
latent trait (Li 2009).
Item drift in this case likely results from a number of sources. First, the sample
changes over time in a number of ways. Previously unratable hamlets gradual begin
entering the full sample as strongly rebel controlled. III and IV Corps are missing data
in 1969 and again in 1972. A large group of urban hamlets representing wards of the
major cities are first included in 1971. Second, this analysis has assumed a single
underlying dimension of control when there may in fact be several underlying
dimensions to this data related to control, reporting, or other aspects of the war.
Chapter 4 capitalizes on this fact by disaggregating control into rebel and government
control using the original HES70/71 Bayesian aggregations. Future work should
specifically investigate these sources of parameter drift in HES and similar surveys of
security conditions.
2.6 Conclusion
For the task of gauging relative government control in a given cross-section of
time, HES exhibited several desirable properties. HES included many questions directly
pertaining to control, both the physical presence of competing forces and their
monopoly access. Those questions and answers ranged in difficulty along the entire
latent dimension, allowing hamlets to be distinguished from one another at both the
79
high and low ends of government control. Question difficulty varied in ways expected
by the theoretical conception of territorial control. Question discrimination varied in
clear predictable ways with the specificity of the questions asked and the theory of
control. Cross-sectional comparisons of territorial control show variation between areas
that conform to the existing historical narratives. Cross-sectional variation in control
also varies in the expected ways when compared across the types of security forces
present, the demographic characteristics of the communities, and their occupation. The
temporal variation in control also reflected contemporaneous real world events. In sum,
the understandable pessimism with which scholars and policy makers have levied
toward the HES experiment would appear far overstated.
By the single metric of territorial control, the government of South Vietnam and
its allies did manage to expand control into a great deal of rural country side from 1969
onward. This supports the historical hypothesis that the Viet Cong were largely
decimated by the Tet Offensive and the following government counterattack
The rapid expansion of militia and police forces provided the manpower to reoccupy
areas not held by the government in years. This result is important to the historical
debate over the degree to which the United States “won” or “lost” the
counterinsurgency campaign in the rural areas of South Vietnam. There is an argument
that pacification was ultimately doomed, and American efforts were too little too late to
80
make a difference (Sorely 2011, Hunt 1998). This finding would support an alternate
conclusion that the focus on pacification, development, and regional security forces
resulted in a genuine counterinsurgency victory that was later undone by a
conventional invasion by the North. Chapter 3 investigates this finding more closely in
terms of rates of rebel defection during this period of government expansion in
territorial control.
The modeling approach could be strengthened in a number of ways. The
multilevel nature of the data, responses nested within questions, which are nested
within hamlets, in villages, in districts, etc. can be handled by estimating the Rasch
model in a mixed effects GLM framework (Doran et al. 2007). Further, the ordered
categorical nature of the response, nonrandom missingness, and autocorrelation
structure can be handled through an IRTree model proposed by De Boeck and Partchev
(2012). The missingness of data should also be modeled explicitly as a function of
control. This too can be handled directly within the IRT framework (Rosas and Shomer
2008; Wahab 2012).
Ultimately, HES did more in Vietnam with punch cards than is typical in modern
wars because the need for accurate metrics and institutional resources came together at
the right time. Despite relatively primitive technology, the HES system did well because
of the remarkable resources that were made available. Even at peak deployments in Iraq
and Afghanistan, the U.S. committed only a fraction of the resources that were made
81
available to the metrics program in Vietnam. With the drawdown in forces in those
conflicts, and the coming shift in resources away from irregular war fighting, it is
unlikely that the United States or others will be able to replicate the HES experiment.
How should we measure territorial control in future conflicts? HES provides
several important lessons that inform a potential solution. First, even abstract concepts
like territorial control in an irregular conflict can be approximated with a level of
accuracy that is useful for many policy and academic questions. Second, expert surveys
require direct local experience, which in this case meant relatively educated personnel
working directly in the areas for which they were responsible for measuring. If nothing
else, they learned which areas not to travel to for their own personal safety which is a
key equilibrium outcome in irregular war. Third, determining where information is
lacking is just as important as correctly measuring an important concept. Drawing
confidence intervals and highlighting areas on the map where nothing is known are key
pieces of information for policy makers. The approach taken here does this in only one
limited sense by showing just how differentiated two hamlets can be given the
similarity in answer on the same underlying survey. Future work will look specifically
at modeling uncertainty as an outcome of interest.
I propose a modern version of HES grounded in the idea that individual soldiers,
aid workers, journalists, contractors, and civilians, are the key sources of real time
information about the economic, political, and military conditions in different areas.
82
Ad-hoc grassroots intelligence collection has already been suggested as a replacement
for the rigid command centered structure in Afghanistan (Flynn et al. 2010). Methods
are available today that can aggregate disparate reports over time and location from
multiple individuals into a coherent picture of at least some measures of civil war, such
as territorial control. The application would be very straightforward. The individual
would be presented with a basic web-applet where they would select their geographic
boundary of experience, perhaps their hometown or their area of operation. They
would be given a survey of a few important questions about that area within a given
timeframe. In a Bayesian framework, that individual’s responses would be combined
with other raters to form a sparse network of estimates on key metrics. The end user
could weight those responses however they saw fit, comparing civilian to military
sources, down weighting older information, etc. The system could identify in real time
areas where information has become outdated or where there is no consensus among
raters. With ubiquitous access to cell phones and PDAs, policy makers could request
new information with one or two questions through an SMS message to those trouble
areas. A system like this would have wide application, not just in warzones, but also in
nation building, humanitarian disaster operations, and in law enforcement.
83
Chapter 3 Why Not Just Bribe the Rebels? The Determinants of
Rebel Defection in the Vietnam War
Abstract
Because incentives to free ride and defect make rebellion difficult, existing work on the
causes of civil war focuses primarily on pre-conflict factors conducive to collective
action like shared ethnicity, ideology, or class. However, rebel cohesion varies wildly
within conflicts over time and therefore cannot be explained by initial conditions alone.
I investigate two important factors which vary during a conflict: (1) the taking and
holding of previously controlled rebel territory by the government and (2) the roll out
of propaganda and amnesty-related political infrastructure at the community level. In
the Vietnam War, over 200,000 Viet Cong fighters formally defected to the government
side at varying rates across time and space. Using data on Viet Cong defections at the
province-month level for over eight years, I show that the government induced
defection by expanding into previously rebel held areas with military and political
infrastructure. The point is subtle, but important: conquest and territorial expansion led
to greater political realignment than did consolidation and pacification of existing
government areas.
84
3.1 Introduction
Why in civil wars do rebel groups sometimes retain their ranks and other times
shed members in droves? All organizations, including corporations, universities, sports
teams, and street gangs, face the same problems of recruitment and retention. When a
member leaves for a rival with military or trade secrets, the cost to the organization can
be immense. In civil wars, both government and rebel group’s ability to recruit and
retain members varies widely across time and location. We do not yet have well-
developed theories for addressing this ebb and flow over time, nor do we have much in
the way of empirical evidence.
We should care a great deal about rebel defection because it bears directly on the
conduct and outcome of civil wars.47 Rebel inability to retain recruits has led to
disastrous manpower shortages. For example, General Robert E. Lee reported that a
high desertion rate was what forced him to retreat from Maryland (Martin 1932, 235),
and desertion may have doomed the entire Confederate war effort overall (Weitz 2005).
Moreover, inducing rebel desertion through political bargains could make peaceful
outcomes more likely by fracturing the rebel movement. Indeed, research suggests that
in the context of self-determination movements, internal divisions are more likely to
generate peaceful war ending concessions from the government (Cunningham 2011). 47 There is also growing interest in the effect of desertion and military cohesion on the outcome of
international conflicts. The participatory effects of democracy are seen as one of the major sources of
Western military power (Biddle and Long 2004). Similarly, it is seen as one of the major weaknesses of
corrupt and autocratic government. Both Jason Lyall and Allan C. Stam have major ongoing projects on
the role of military cohesion and desertion in world politics.
85
Further, the risk of defection hinders command and control. A government officer
complained that he could not discipline his troops for human rights abuses for fear that
they would defect to the Khmer Rouge (Pokempner et al. 1995, 47).
In irregular civil wars where cover and concealment are key to survival,
defections leak critical intelligence information to government forces. Interrogations of
captured rebel fighters and intelligence provided by defectors provided crucial
targeting information in the Malayan Emergency (Comber 2008, 82) and the Vietnam
War (Moyar 2007, 86-107). In 1951, rebel leaders during the Malayan Emergency
expressed concern about the increase in government reward offers (Ramakrishna 2002,
341), and the Viet Cong repeatedly attacked government defection centers and
personnel (Koch 1973, 57). The defection of even a few members can be devastating to
organizations that rely on secrecy for survival, like insurgent groups, terrorist
organizations, and criminal gangs (Berman 2009). Captured members of the Irish
Republican Army provided the best source of operational intelligence during The
Troubles in Northern Ireland (Jeffery 1987). The defection of mob underboss Salvatore
“Sammy the Bull” Gravano led to testimony that took down the Gambino crime family
(Davis 1994).
This study investigates patterns of defection during one of the largest and
longest wartime defection program ever carried out, the Chieu Hoi program of the
Vietnam War. A recent review notes that despite the direct relevance of the American
86
experience in Vietnam with Chieu Hoi to present conflicts, “there is still no
comprehensive research on this program” (Tovy 2012, 142). The Vietnam case is
interesting for a number of reasons. First, unlike many conflicts, there was a standing
amnesty offer implemented early in the war. Observers have noted that in other
conflicts such as Iraq, the incumbent has suffered from a lack of a broad amnesty offer
that could have provided badly needed human source intelligence (Pirnie and
O’Connell 2008). Second, for much of the war the rebel group’s agricultural resource
base made them dependent on broad popular support for recruitment and resources
(Weinstein 2007).48 Third, the government of South Vietnam had the financial and
bureaucratic resources to implement a national amnesty program with offices in each
province. Finally, rates of defection varied wildly across location and time. Figure 3.1
presents that variation in the monthly rate of defection across the 44 provinces of South
Vietnam.
48 It is estimated that 80 to 90 percent of rebel finances were obtained from rice taxes (McChristian 1994,
167).
87
Figure 3.1: Monthly rates of Rebel Defection by Province 1965-1972
This figure shows monthly rates of rebel defection through the Chieu Hoi program by province
(including autonomous cities). Data are not available for My Tho, Thua Thien, and Tuyen Duc.
The next section provides a brief literature review. Section 3 develops testable
predictions about the relationship between territorial control, psychological/amnesty
infrastructure, and defection. Section 4 provides a historical overview of rebel defection
in the Vietnam War and introduces new data from the conflict. Section 5 tests the
predictions against data and discusses the results. Section 6 concludes by drawing
lessons from the experience in Vietnam toward the efficacy and role of amnesty and
defection in modern conflicts.
88
3.2 Literature
There are three interrelated strands of literature related to rebel defection—
individual motivation, outside options in the legal labor market, and organizational
design. 49 This section briefly reviews these three strands and highlights several stylized
facts about defection in civil war which should inform theoretical expectations about
patterns of defection over time.
3.2.1 Individual Motivation
A number of studies emphasize the role of ideas and grievances amongst
members of the rebel organization and the communities from which they recruit. Early
sociological research dating back to World War II emphasized the bond between
individuals in the same unit as the primary reason for continued participation
(McPherson 1997, 86; Stouffer et al. 1949, 109). Government brutality and violence
generates collective anger and grievance which provides individual moral rewards to
participating (Wood 2003), and rebel indiscriminate violence similarly provides
incentives to join the government (Kalyvas 2008).50 In Algeria, for example, the
increased use of violence by the FLN in civilian areas reportedly caused, at least in part,
large numbers of civilians to defect to the government’s side, particularly ethnic
Muslims (Hamoumou 1993, 157). A survey of American volunteers in the Spanish Civil
49 The wider literature on violent organizations, rebellion, and civil war is massive (Lichbach 1995,
Blattman and Miguel 2010). 50 The Revolutionary Armed Forces of Colombia (FARC), for example, does not pay its members
(Gutiérrez Sanín 2008, 14).
89
War found ideology to be an important correlate of fear in battle (Dollard 1943, 555).
Records of desertion from the American Civil War suggest that soldiers recruited from
pro-war communities were less likely to desert (Costa and Kahn 2008). Others
emphasize how strong leadership provides an important and compelling justification
for continued participation (Hanson 1999).
However, a growing number of surveys of captured, defecting, and retired rebels
suggests that changes in ideology or grievances do not explain the decision to join or
leave rebel groups (Scaff 1955, 116-129; de Posada 2009; Arjona and S. N Kalyvas;
Exposure to extreme violence and personal setbacks are argued to impose
important psychological costs and to cause individuals to reevaluate the expected
utility of continued participation. For example, in World War I, soldiers rebelled when
casualty figures became too high (Keegan 1976, 276). Desertion was higher in Union
units of the American Civil War that had suffered the greater casualties (Costa and
Kahn 2008). Additionally, protection from violence can be a primary motivation for
joining an organization in the first place (Goodwin 2001; Kalyvas and Kocher 2007).
Similarly, in cases like the Nepalese Civil War, where rebel groups had to resort to
coerced recruitment during periods of combat but otherwise could rely on ideological
appeals, the risks of military combat influenced the propensity to join (Eck 2010).
3.2.2 Outside Options
Determining what type of life might be waiting for defecting rebels in the legal
labor market is central to the question of why rebels might leave or stay with an
organization. Those that have couched rebellion in terms of a collective action problem
(Olson 1965), point to the importance of short and long term material incentives (Popkin
1979; Collier and Hoeffler 1998; Weinstein 2007) and the many available strategies for
delivering selective rewards and punishments (Lichbach 1995). The literature on
disarmament, demobilization, and reintegration (DDR) following the end of a conflict
(Colletta, Kostner, and Wiederhofer 1996; Humphreys and J Weinstein 2005; Muggah
91
2009) focuses largely on the availability of jobs in the private market and on providing
vocational training to soldiers in order to ease the transition to a new career.
The importance of short term economic conditions on participation during war
has been studied indirectly with participation serving as an intervening variable for
aggregate levels of violence. In Columbia, a decline in coffee prices depressed wages
and was associated with an increase in violence in coffee growing regions (Dube and
Vargas 2008). Higher spending on aid projects through the Commander's Emergency
Response Program in Iraq is associated with lower levels of subsequent violence
(Berman et al. 2011), and the effect is greater for more labor intensive projects (Lyengar
et al. 2011). There is conflicting evidence on the relationship between unemployment
and violence, with higher levels of unemployment related to lower levels of violence in
Afghanistan, Iraq, and the Philippines (Berman et al. 2011), but higher levels of violence
in Indonesia (Barron et al. 2004) and Nepal (Do and Lyer 2007).
Evidence on the relationship between economic conditions and recruitment has
come primarily from field surveys. A survey in Burundi finds a positive correlation
between civilian reporting of rebel recruitment in the past year and reporting of
negative crop conditions (Nillesen and Verwimp 2009). A survey in Sierra Leone finds
that poverty predicts joining fighting groups, but poor civilians were equally likely to
join either rebel or government forces (Humphreys and Weinstein 2008). Field work in
Uganda, Mozambique, and Peru suggests that the type of civilians who join rebel
92
groups suggest that conflicts with concentrated lootable resources attract more
opportunistic joiners with weaker ties to the local community (Weinstein 2007).
3.2.3 Organizational Design
Arguably, every problem faced by rebel groups entails an organizational
tradeoff.52 Decentralization and insurgent tactics are themselves an organizational
innovation which trades the ability to mass force for increased concealment and safety
from the government’s forces (Buhaug et al. 2009).53 Importantly for theories of
defection, the size of a violent organization is limited by the kinds of resources which
can be mustered. Mafias, for example, raise resources by inventing a market for
protection in individual communities (Gambetta 1996). Rebel groups, on the other
hand, sometimes raise revenues through lootable resources such as primary
commodities (Collier 2006). As a country grows in wealth, the size of the prize grows
but so does the difficulty in capturing that prize from a stronger more capable
government (Sánchez-Cuenca and Luis de la Calle 2009). Because rebel groups acquire
resources through looting and the government acquires resources through regular
52 In contrast, many of the interesting dynamic models of civil war assume that the organizations are
unitary actors (Fortna 2008; Walter 2011; Glassmyer and Sambanis 2008; Walter 1997). 53 A larger, centralized, conventional rebel force is preferable when safe havens are available, but is
suicide when there is no place to escape larger concentrated government forces (Sinno 2008).
93
taxation, the cost of fighting against the government tends to grow faster than the
potential spoils from war as the economy improves (Fearon 2008).54
Defection should also vary with the types of people who are recruited, which
vary depending on the available resources. When resources are concentrated, rebel
groups tend to attract opportunistic joiners looking for short term material benefits
(Weinstein 2007). Diffuse resources, such as agricultural commodities spread across a
large rural population, require a recruitment strategy of long-term career rebels
typically with stronger ties to the population. For smaller organizations, such as
terrorist groups, resource requirements are less of a problem than the risk of defectors
providing key intelligence to the government. For such organizations, religious or
ideological appeals that require severe hardships serve to screen out opportunistic
joiners that might be easily bribed (Berman and Laitin 2008).
There are still a number of cases, however, in which both large rebel groups and
governments have substantial resources (or at least the backing of a wealthy patron). It
is unlikely that rebel groups are simply outspending governments in terms of salary
and material rewards.55 How, then, do large rebel organizations persist even when
governments have sufficient resources to bribe their members? One possible answer is
54 The growth in the Iraqi economy, for example, greatly increased the operating costs of foreign
insurgents. The result was greater predation on civilians, alienating many of them (Berck and Lipow
2010). 55 In the American Civil War, Confederate Major General Patrick R. Cleburne found that his soldiers were
actually more likely to defect after having been paid than in periods with late and missing pay (Sears
1998).
94
that rebel groups maintain cohesion through the threat of selective punishment
strategies. The penalty for defection is often elevated to death in the course of a conflict.
Punishment strategies, however, are incredibly hard to implement in an ongoing
war. To understand why this is the case, consider the recent principal-agent approach to
rebel recruitment and command. Effective control requires both the ability to detect
deviations from desired behavior and the ability to sanction deviations. Conditions in
civil war rarely provide either opportunity (Gates 2002). Empirically, punishment is
ineffective. British executions for desertion in World War I were often commuted. They
had no deterrent effect when there were randomly carried out, and actually led to an
increase in desertion when the victim was falsely accused (Chen and Horton 2011). The
Viet Cong threatened execution of defectors, but in practice there were too many
defectors to do more than to try to selectively and arbitrarily punish some for egregious
defection (surrendering a weapon or providing intelligence) and momentary lapses in
heart (Carrier 1968).
Instead of punishment schemes, rebel groups are most likely to deter defection
through the physical separation of the individual and his family from government
control. Defectors are almost always from the local area, and rarely do soldiers defect
when fighting overseas. In his study of the Russian Civil War, Landis concludes that “it
was pointless to expect results when the principal areas targeted by the amnesty were
effectively outside government control” (2008, 107). Stathis Kalyvas (2008) examines
95
willingness for civilians to join pro-government militias and finds that government
units in the Greek Civil War were better able to recruit civilians for the local militia in
areas where they had greater territorial control and where there had been greater levels
of rebel indiscriminate violence. Holding and recruiting from areas that are primarily
supporters of the rebel group provides further benefits for the organization in the form
of unit homogeneity. Desertion rates from the American Civil War suggest that unit
homogeneity was actually more important than either unit casualty rates or proxy
measures of ideological commitment (Costa and Kahn 2008, 98-112)
Another possible answer is that amnesty offers are difficult for governments to
carry out in practice.56 On the one hand, there is evidence to support claims that
amnesty offers are effective. The British enjoyed much success with amnesty program in
the Malayan Emergency (Ramakrishna 2002) and the Dhofar Rebellion (Mockaitis 1995,
90). In the Soviet experience in Afghanistan, tribal allegiance often shifted toward the
best offer (Lynch 2010). The U.S. EDCOR defector program in the Huk rebellion
provided important intelligence toward the end of the war (Scaff 1955, McCormick et al.
2007, 340), and the Chieu Hoi program accepted over 200,000 defectors in the Vietnam
War. On the other hand, it is difficult to know whether the amnesty programs and their
financial and political concessions led to military success or whether they simply
56 Amnesty is derived from a Greek term amnestia which means forgetfulness or oblivion. It is “an act of
the legal sovereign conceding, from grace, a voluntary extinction from memory of certain crimes
committed against the state” (Seligman 1937, 36).
96
exploited existing success. Anecdotally, many of these programs picked up only after
major military progress on the battlefield. In other cases, amnesty programs have
floundered. In Afghanistan, there are at least eight formal and informal paths for
Taliban fighters and tribal leaders to reconcile with the government, but relatively few
lower the cost of joining in the first place. Civilians who might not have otherwise
joined will now do so because they can always defect. Second, civilians might actually
join in order to defect and claim the material rewards, education, and employment
offered by the government. Third, because militarily strong governments do not need to
offer amnesty, the offer might inadvertently embolden the rebel group by signaling
weakness or desperation. The same mechanisms partly explain why governments are
hesitant to negotiate with insurgent groups at all (Babat 2005).58
57 Both the empirical and theoretical literatures on tax amnesties suggest pessimism. First, tax amnesties
have at most only a limited effect on compliance. Second, the effect of amnesties on compliance cut in
both directions, potentially driving compliance up or down in both the short and long run. 58 These concerns often lead to weak amnesties that exclude senior leadership or condition on the
individual having never committed a serious offense. On August 7, 2004, the Iraqi interim Prime Minister
Iyad Allawi made the first amnesty of the Iraq war. It excluded anyone who had committed murder
(Napoleoni 2005, 163). A second attempt at a more comprehensive amnesty in 2006 was brought down by
Shi'ites who had suffered attacks by Sunnis and by American politicians opposed to pardoning anyone
who had killed American soldiers (Cordesman et al. 2008, 320). The Malayan Emergency also began with
a weak offer in 1949 to the rebel Malayan Communist Party (MCP) that excluded anyone with "blood on
their hands" (Ramakrishna 1999, 246).
97
3.2.4 Major Takeaways
In sum, existing research on rebel participation suggest several stylized facts
about the decision to defect. First, the security conditions and opportunities for
advancement play a larger role than changes in ideology or grievances. Those rebels
that are initially more ideologically committed, however, may be less likely to defect
overall. Second, exposure to violence may have countervailing effects. It may increase
the risk of defection by accumulating psychological costs and reducing the future
expected utility of participating. However, it may also reduce the risk of defection by
sinking costs and generating grievances. Third, the relationship between defection and
outside economic options is ambiguous; poverty can drive civilians into either the
hands of the rebels or the government. Fourth, problems of monitoring and punishment
mean that rebel groups are more likely to maintain cohesion through physical
separation provided by territorial control rather than selective punishment schemes.
Fifth, because positive inducements suffer from moral hazard problems, governments
have greater latitude in manipulating defection by varying the level of negative
sanctions.
98
3.3 Theory and Empirical Predictions
3.3.1 Shifts in Territorial Control
Under the territorial control thesis, defection varies with the government’s ability
to directly gain access to the communities from which the rebels were recruited. Shifts
in territorial control could influence defection through several mechanisms. First,
maintaining command and control through punishment and reward schemes is difficult
in wartime conditions. Rebel groups may prevent defection primarily by limiting
opportunities to defect, which they do by maintaining control over territory. Second,
civilians often join rebel groups to maintain security and so switch sides to whomever
better provides protection of their home area. Komer, reflecting on the amnesty
program in Malaya, argued that, above a certain level of reward money, defectors cared
most about which side was best able to protect them from violence by the other side
(1972, 74). Third, family ties serve both as collateral that can be threated over defection
and as a sociological motivation for participation. If the family changes hands, the
individual may switch in order to stay with them. Fourth, physical access reduces the
transaction costs of defecting by collocating defector offices with the defectors.
However, the relationship between territorial control and defection is not
obvious. Areas already under government control should have relatively few rebels,
and thus fewer defections. A related literature on violence toward civilians suggests
that most of the realignment in collaboration should occur during the shift in territorial
99
control rather than before or after (Metelitis 2010; Ziemke 2008; Eck and Hultman 2007).
Local defections should then increase in times of shifts in relative control toward the
government and away from the rebel group. I cast these predictions as Hypothesis 1A
and 1B.
H1A: Local levels of defection will be higher in times of government expansion of territorial
control into previously rebel held areas.
H1B: Local levels of defection will be lower for areas with strong government control, all else
being equal.
3.3.2 Propaganda, Chieu Hoi Centers, and Political Persuasion
Given the focus on security and control, what is the role of the infrastructure of
persuasion such as local amnesty offices, propaganda, and political cadre? The existing
literature suggests that changes in ideology are a relatively rare trigger for defection.
However, there is a wide range of alternative mechanisms related to what are termed
“psychological” operations. In his thorough study of the evolution of the Malayan and
British amnesty program, Ramakrishna (1999) points to the content of the offer, the
credibility of the offer, and the military context as the three key factors in rate of
defection. In many cases, psychological operations provide real information on the state
100
of the war and events on the ground. Rebel fighters may then use this information,
weighted for likely bias, to update their beliefs about the likelihood of victory
(Battaglini 2002). The diversion of resources to the infrastructure around an amnesty
program is a sunk cost which could signal the credibility of an amnesty offer to a
potential defector (Schelling 1960; Fearon 1997). The institutions themselves may
increase defection simply by lowering the transaction cost of defecting. The number of
defections should increase as the political and propaganda infrastructure rolls out into
formerly rebel areas, a prediction I frame as Hypothesis 2A.
H2A: Local levels of defection will be higher in times of government expansion of
propaganda/defection infrastructure
Alternatively, critics suggest that governments in civil conflicts are generally
incapable of executing an amnesty program. Institutions like Chieu Hoi offices falsified
defections by recruiting civilians in order to pad their numbers. Many of the Taliban
defections in Afghanistan, for example, are attributed to the personnel in provincial
reconciliation offices recruiting friends and family to pose as defecting rebels (Semple
2009). There are observable implications that delineate the world in which amnesty
infrastructure cause real defections and the world in which they merely reflect the
extension of corrupt government bureaucracy to a new area. As suggested above,
101
defections should increase in times of expansion of infrastructure to new areas as the
local rebel population switches sides. As the rebel population declines, defections
should also decline and Chieu Hoi offices should effectively “put themselves out of
business.” However, if even after controlling for territorial control, defection rates
remained constant or continued to increase then that would be strong evidence that
offices produced “defections” regardless of changes in the underlying distribution of
rebels in the population. I frame this test as Hypothesis 2B.
H2B: Local levels of defection will be lower for areas with more sustained propaganda/defection
infrastructure, all else being equal.
A final concern is that amnesty infrastructure does not have any direct causal
impact. Instead, it might proxy for increased government control over an area in
general. In order to operate, amnesty personnel need a degree of safety. The decision to
allocate bureaucratic resources to an area is often a sign of consolidation, unrelated to
the preferences of the rebel population. This observation suggests that a placebo test
should be undertaken to differentiate the effect of amnesty related infrastructure from
other infrastructure tied to territorial control and consolidation but not directly to
defection. I cast this test as Hypothesis 3.
102
H3: After controlling for changes in territorial control, other types of village or hamlet
infrastructure will have either no effect or a smaller effect on defections compared to
propaganda/defection infrastructure.
3.4 The Vietnam War, the Chieu Hoi Program, and Data
3.4.1 Background on the Program
The period between partition in 1955 and the start of open revolution in 1958-9
was one of violent political consolidation by the Ngo Dinh Diem government (Race
1972). Upwards of 12,000 individuals were killed and another 40,000 were arrested
based on ties to the Viet Minh, membership in opposition parties or criminal groups,
and actual or suspected membership in the communist party (Kolko 1994, 89). Political
accommodation was not national policy.
From 1959 onwards, rebel activity escalated to the point where the government’s
position became threatened. Individual provinces began experimenting with returnee
programs (Swift 1999, 15). Modeled after the EDCOR program in the Philippines and
the British amnesty program in Malaya, rebel deserters were offered food, shelter,
clothing, and a position in some of the early strategic hamlets.59 In January 1963, the
59 In 1962, outside advisors such as Sir Robert Thompson from the British Advisory Mission and Rufus
Phillips from the U.S. Rural Affairs Office lobbied members of the executive for an amnesty program
(Koch 1973, 20).
103
Chieu Hoi, or "Open Arms", program rolled out nationally.60 Over time, government
forces established Chieu Hoi centers in every province and even in some individual
villages. Conditions varied across Chieu Hoi centers, but the modal defector experience
included: (1) an initial intelligence gathering interview; (2) processing; (3) a 60-day stay
at the center with indoctrination and training courses; (4) provision of a small stipend;
(5) and resettlement in a strategic hamlet or their home village. Importantly, defectors
were exempt from government draft for only 6 months and could secure a position
closer to home by volunteering immediately for a local militia.61 Organizational control
over and support for the program fluctuated over time, but the program continued until
the fall of South Vietnam in 1975.
3.4.2 The Rebel Group
The organizations that the Government of South Vietnam and its allies faced in
the early 1960s had been in development since 1930 with the formal founding of the
Communist Party of Vietnam, or the Party. In Mao Tse-tung’s strategy of guerrilla
warfare, as adapted by the Party, political and military strategy is directly linked at
multiple levels (dau tranh). Rebellion is developed in stages beginning with an emphasis
on political recruitment and party building, a transition to open irregular warfare, and
60 The programs original full name was “Phong-Trao Chieu-Tap Khang-Chien Lam Duong” or “The
Movement to Regroup Misled Members of the Resistance” (Swift 1999). It was later shortened to “Chieu
Hoi” or “call to return.” Those that defected through the program are said to have “rallied.” 61 The options available included the Regional Forces, Provincial Forces, Armed Propaganda Teams, Kit
Carson Scouts, and later Provincial Reconnaissance Units. Otherwise, they could join the Army of
Vietnam (RVN).
104
finally a consolidation period and takeover of urban areas. By 1960, the Party had
cycled between political development and open warfare no less than three times: the
failed Nghe-Tinh revolt in 1930-31 against the French, the resistance against the
Japanese occupation loosely allied with French administration in 1940-1945 followed by
all out warfare against the French from 1946-1954, and then again in South Vietnam
from 1959.
Vietnamese civilians were astute at avoiding commitment to just one side.
However, a number of events made nonalignment more difficult. The first was the
government’s use of repression to eliminate political opposition. Between 1956 and
1959, government crackdowns created an environment of terror and allowed for abuse
and corruption at very low levels of government. In May 1959, the proclamation of Law
10/59 broadened crimes of treason to include not just affiliation with communism or
past ties to the Viet Minh but any and all political opposition (Elliott 2003, 198; Race
1972, 183). Arrests and assassinations were often arbitrary among the civilian
population, reducing the difference between remaining neutral and actually joining the
rebel group (Kalyvas and Kocher 2007).
The Viet Cong Liberation Army (Quan Doi Giai Phong) consisted of both
conventional and irregular forces. The lowest levels of irregular forces were self-defense
forces (tu ve) consisting of persons not fit for guerrilla forces yet able to train recruits,
construct booby traps, and collect intelligence. Guerrilla forces were organized both at
105
the hamlet level (du kich ap) – in anywhere between 3-man and full 12-man squads -
and at the village level (du kich xa) - one or more platoons of about 36 to 48 men (Blood
2005, 62-63, Adams 1995, 55). Long An District Advisor Robert Black referred the
guerrilla forces at this level as the “goons who collected taxes, spread terror or sabotage,
and served as bodyguards” (Black 2003, 176). The lowest level conventional force was
the regional/territorial forces (dai doi doc lop) or Viet Cong (VC) Local Force (LF),
which was subordinate to a provincial or district party committee and normally
operated only within a province or district (MACV Order of Battle Reference Manual
1967, 2). Local forces were organized into companies of 3 or 4 platoons, and were
normally based in a safe haven in the district from which they could launch attacks. LF
were tasked with launching raids into incumbent areas for both propaganda and
assassination. In addition to the district level forces, each Vietcong Province
Headquarters typically had one or two battalions of 300 to 700 men each (Blood
2005,63). Even larger, the main forces (Quan Doi Chu Luc) were organized into larger
regiments and divisions at the regional level. The largest forces, and the ones that took
most responsibility for the fighting after 1968, were provided by People's Army of
Vietnam (PAVN) which were also referred to as the North Vietnamese Army (NVA).
3.4.3 Who Defected and Why?
We know a great deal about those rebels that defected, at least from the 1965-
1968 period, thanks to a number of interview studies carried out by the Rand
106
Corporation (Davison 1972).62 The interviews include both thousands of captured rebel
fighters that did not choose to leave their units and twenty thousand defectors that
opted to formally defect through the government program (Goure 1968; Kellen et al.
1969). More directly and equally impressive is the work done by Rand researcher
Joseph Carrier and his team. They translated and coded tens of thousands of defector
entrance interview cards (Carrier 1966). The interviews are analyzed in a number of
technical reports. These reports highlight patterns and cross-reference oral evidence
with captured documents, interrogation reports, and intelligence coming in from the
field (Gurtov and Kellen 1969; Benoit 1970; Chandler 1981).
In total, over 200,000 individuals officially defected through the government
program. Some portion of those counted were not actual rebels but rather ordinary
civilians.63 North Vietnamese troops rarely defected, even as they took on a greater
share of combat operations towards the end of the war. Defectors were less likely to be
full party members than Viet Cong that were captured in battle (Berman 1974, 93).
Coercive recruiting was actually more prominent in Viet Cong controlled areas than in
contested or government areas (Berman 1974, 69), and conscripts were particularly
likely to defect (Koch 1973, 6). Desertion was much more common than defection, with
62 For recent reviews of this literature see Tovy (2010) 63 Advisors estimated that of the first 16,000 ralliers, probably 50-60% were genuine rebels (Koch 1973,
22).
107
RAND and CIA analysts estimating about seven deserters for every defector (Adams
1994, 46, 63).
3.4.4 The Data
This paper uses two kinds of data. The first set of data tracks rates of defection as
measured at the province-month level through the Chieu Hoi reports. Defection reports
were then aggregated at the province level and then forwarded to Saigon. The second
set consists of responses from a longitudinal expert survey called the Hamlet Evaluation
System (HES). Responses are used to measure province level government control as
well as the diffusion of Chieu Hoi centers. This paper focuses on the period from 1967
to 1972, starting where data at the hamlet level first began to be collected. The unit of
analysis for this study is the province-month. Civilians lived 44 provinces and five
autonomous cities. The U.S. military further divided the country into four Corps
Tactical Areas.
3.4.5 Dependent Variable - Defection
Defection is measured at the province-month level through archived Chieu Hoi
records.64 The data from Chieu Hoi show 172,326 defections over eight years, which is
about 86% of the 200,000 defections typically attributed to the entire program. Only 400
province-months of 4,380 with data show zero defections, or 9%. The number of
64 “Returnee Statistics, compiled 1967-1973, documenting the period 1963-1973,” no date, Record Group
472, Records of the U.S. Forces in Southeast Asia, 1950-1976, Archives II Reference Section (Military),
Textual Archives Services Division (NWCT2R[M]), National Archives at College Park.
108
defections range from 0 to 1,136 with an average of 39.34 per province-month and a
median of 16. Figure 3.2 shows the broad pattern of defection for the entire country.
This countrywide pattern is evidence against defection being driven
mechanically by the number of rebels under arms or the intensity of combat. Defections
climb every year of American intervention but fall in anticipation of American
withdrawal and bottom out around January 1968 when the Viet Cong launched a
country-wide attack called the Tet Offensive. In no other period was irregular, hamlet-
to-hamlet fighting as intense. Nor were rebel casualties as high as they were in 1968.
However, defection rates climb with the governments counter offensive in the latter half
of 1968 and accelerate even more during the pacification campaign of 1969.
109
Figure 3.2: Monthly Rebel Defections in South Vietnam 1965-1972
This figure shows monthly total defections across all of South Vietnam from January 1965 to
December 1972. The black line shows the 9 month running average.
Defections broken down by individual corps tell a similar story, presented in
Figure 3.3. III and IV Corps were primarily embroiled in insurgent conflict against
locally raised forces. Both exhibit the sharp drop in defections around the Tet Offensive
and then a large spike during the period of government pacification in 1969. The big
conventional unit war fought by II Corps was over before Tet, and the pattern of
defection remains fairly constant afterward. I Corps saw some of the worst of both
types of fighting, but was almost entirely a conventional war fought by North
Vietnamese regular units in the 1971 and 1972 years. The complete drop in defections
reflects both the conventional nature of the fighting and that the burden had been
110
shifted almost entirely to foreign forces. The only other uptick took place in 1972 with
the massive Easter Offensive.
Figure 3.3: Monthly Rebel Defections by Corps 1965-1972
This figure shows monthly total defections broken down by Corps from January 1965 to
December 1972. The black line shows the 9 month running average.
3.4.6 Independent Variables
3.4.6.1 Territorial Control
As described in Chapter 2, government control in Vietnam means the degree to
which government military and administrative personnel had monopoly presence and
access to a community. Each hamlet lies on a continuum from completely rebel
controlled to completely government controlled. Because maintaining a perfect
monopoly over a community is impossible, control in practice represents the degree to
which either combatant has an advantage or parity in a particular community. Using
111
the approach described in Chapter 2, I measure government control as an unobserved
latent trait realized through answers on the longitudinal expert survey called the
Hamlet Evaluation System (HES). The Military Assistance Command Vietnam, Civil
Operations and Rural Development Support created HES in 1967 in order to gauge
pacification efforts of hamlets in villages and to help in the allocation of men and
resources. U.S. District Advisers filled it out in collaboration with their South
Vietnamese counterparts. There were three versions of the HES survey. From 1967 to
1969, they used a system called HAMLA which had the responding officer subjectively
rank the hamlet along an E to A scale (worse to better) on several military, political, and
economic dimensions. In 1969 the system was replaced by the HES7 questionnaire and
then again in 1971 by the HES71 questionnaire, both of which moved in the direction of
objective ‘yes’ or ‘no’ questions.
Filled out monthly for over 12,000 hamlets, HES asked high ranking American
military officers and civilians to rate conditions on dozens of specific questions. There
are at a minimum 9 and as many as 31 questions per month that bear directly on
presence of rebel forces, government forces, safety of access to administrators, and
more. I use a partial credit item response model which provides an estimate of difficulty
for each question-response, the discrimination of each question, and a latent estimate of
112
control for each community (Andersen 1983, Masters 1982).65 Estimates are generated
for all the available questions for each month separately, and then a linear
transformation is used to place estimates from every month on a single comparable
scale (Stocking and Lord 1983).
As shown in Figure 2.17 of Chapter 2, there is a great deal of variation in
territorial control month-to-month and across provinces. Overall, and consistent with
historical accounts, government control suffered a major setback immediately before
and after the Tet Offensive, which it recovered from in the following year. The climb in
government control was steeper for some province than others, but there was a
countrywide positive trend from 1969 to 1970. This trend then flattened out in 1971 and
actually declined in 1972.
3.4.6.2 Chieu Hoi Infrastructure
A major aspect of the government’s push for pacification in 1969 onward was the
expansion of the Chieu Hoi program. The Chieu Hoi program utilized a wide range of
psychological warfare tactics including messages in leaflets, radio, and television, direct
appeals by family and friends, and financial inducements (Bairdain and Bairdain 1971).
An important component of this expansion of Chieu Hoi was an investment in
65 An alternative for polytomous items is the Graded Response Model. I prefer the Partial Credit Model
because it allows the ordering of difficulty of the responses to vary if that is reflected in the data. This is
particularly important for HES questions because responses to rebel presence and government presence
could interact in unpredictable ways.
113
infrastructure to provide Chieu Hoi cadres not just at the province level but also down
to the village and even individual hamlet levels. Rebels could surrender at these local
offices, and then be transferred to the province office for housing, reeducation, and
stipend (Tho 1977). If weapons or documents were confiscated, it would be done at this
initial level and receipt would be issued for possible reward or compensation at the
main center (Prugh 1975, 127). After transfer to the main center, defectors were
provided food, medical care, and were immediately fingerprinted and photographed to
establish their identity and compromise them with the Viet Cong (Grinter 1967).
HES documents the rise of Chieu Hoi centers across South Vietnam at both the
village and hamlet level from July 1969 to December 1972. In January of 1970, almost
fifty percent of hamlets had no trained Chieu Hoi cadre, and only 37% had cadre living
directly in the community. The picture at the village level was somewhat better with
60% of villages in January 1970 having a Chieu Hoi cadre living directly in the
community. Figures 3.4 and 3.5 show the growth of the Chieu Hoi offices over time. The
rate of expansion varied by region, with III Corps seeing the greatest gains in the first
part of 1970, II Corps remaining stagnate, and I and IV Corps gradually improving
throughout the period before leveling off at the end of 1971 through 1972.
114
Figure 3.4: Availability of Chieu Hoi cadre across Hamlets by Corps.
This figure shows the quarterly status of Chieu Hoi cadre in each hamlet from July 1969 to December
1972. Data are reported in HES70/71 (question HQG1). Data are unavailable in III and IV Corps for 1972
and for part of II Corps in 1970 and 1971.
115
Figure 3.5: Availability of Chieu Hoi cadre across Villages by Corps.
This figure shows the quarterly status of Chieu Hoi cadre in each hamlet from July 1969 to
December 1972. Data are reported in HES70/71 (question VG1). Data are unavailable for part
of II Corps in 1970.
3.5 Results
3.5.1 Territorial Control
Figure 3.6 shows the pattern of defection and shifts in territorial control at the
corps level. Shifts in territorial control tend to coincide with major upticks in defection,
lagging behind by a couple of months. The pattern holds surprisingly well for the
realignments in I, III, and IV Corps, but there is no clear uptick in II Corps to coincide
with the improvements in the government’s ratings of control. At this level of
116
aggregation, it appears to be relative changes in control that are associated with
increased defections and not the overall level.
Figure 3.6: Defections and Shifts in Territorial Control by Corps
This figure shows monthly rebel defections over time as a 9 month running average and the
monthly mean of latent government control in each Corps. Latent control is based on the linked
parameter estimates from the generalized partial credited item response model introduced in
Chapter 2. Values for unratable hamlets are imputed with the minimum estimate for the whole
sample.
I test the relationship between control and defection in a fixed effects regression
framework where
117
The unit of observation is the province-month and is a province fixed effect.
Coefficients on the independent variables reflect changes in the within-province level of
defection as a one unit change in the regressor. I estimate robust standard errors
clustered on the province. Models 1 and 2 in Table 1 show that absolute levels of control
do not predict within-province levels of defection. The inclusion of the time and time
squared trends, show that defection varies quadratically with time, as was evident the
plots above. Models 3 and 4 show that shifts in territorial control over time do predict an
increased number of defections, and that this effect is in addition to the general time
trend. Model 5 shows that changes in government control predict defection even when
controlling for the current level of control, though the effect attenuates slightly. The
immediate question to ask is whether the effect is being driven only by the major
pacification campaign in 1969, when both control and defections spike. Model 6 shows
that the relationship still holds even when observations from 1969 are omitted. The next
question is whether the pattern holds for all of South Vietnam. Model 7 is restricted to
just observations from II Corps where the pattern was visually weakest. The coefficients
point in the expected directions, but become insignificant. This is largely due to the
reduced power from a quarter of the sample, and the coefficients on changes in control
become significant again if the time trend is dropped.
118
Table 3.1: Shifts in Territorial Control and Defection
demolitions, kill and capture raids, drone strikes, and other acts typically described as
selective violence generally fall within the norms of violence typical of law enforcement
or special operations.
Severity describes the means but not the motivations that direct violence toward
a particular individual or community. 67 Informed violence sets out to punish an
individual or community based on their specific behavior. Executing a warrant for a
specific individual who has been denounced as a rebel agent is an example of informed
violence. Another example is burning a community’s crops as collective punishment for
refusing to pay taxes. In contrast, random violence targets an individual or community
not because of their behavior but because of their guilt by association.
Actionable intelligence serves as a hard constraint on the amount of informed
violence that combatants can direct toward civilians. In civil wars fought by irregular
forces, the key pieces of intelligence pertain to the identities and location of enemy
forces and their supporters. Because rebels hide in or near populated areas, civilians are
the most abundant agents for monitoring and providing this kind of intelligence. 68
Counterinsurgency theory and doctrine place significant emphasis on providing public
goods and security to civilians in order to elicit information against rebels (Trinquier
67 I thank David Laitin for this framing of the definitional issues of political violence. 68 There are alternative sources, including denunciations by prisoners or defectors, material evidence such
as captured documents, confessions by the accused, and paid tips by informants. Principal agent
problems make purchasing information particularly difficult in a wartime environment, and according to
at least one Phoenix program advisor the flood of paid tips were only sources that were “uniformly
inaccurate” (Finlayson 2007).
136
1964; Army 2007). An increasing number of studies use civilian willingness to provide
information as an intervening variable in explaining changes in levels of violence
resulting from aid provision (Berman et al. 2010), civilian casualties (Condra et al. 2010),
access to communications technology (Shapiro and Nils B. Weidmann 2011), and co-
ethnic military sweeps (Lyall 2010). Others have pointed out that police efforts against
criminal gangs similarly depend on civilian willingness to provide information against
their neighbors (Akerlof and Yellen 1994).
Civilians both volunteer information and provide it under duress. Recent studies
point to political motivations (Balcells 2011) and narrow personal gains (Kalyvas 2006)
as possible motivations for civilian denunciations. Alternatively, the threat of collective
punishment provides a powerful incentive for self-policing and cooperation by
communities (Hechter 1988, 153; Lichbach 1998, 215). The degree to which information
can be solicited or coerced with violence or repression depends on the ability to couple
threats with credible assurances to withhold that violence given a change in behavior
(Schelling 1960; Machain et al. 2011).
Coercive approaches to eliciting information have a long track record in civil
conflict. Galula describes this strategy, as employed in the Algerian War: “...every
villager normally knows who the cell members are...This suggests that the indirect
approach could be easier and more certain than the direct one. The procedure would be:
1) To arrest simultaneously a large group of minor suspects. 2) On the basis of their
137
disclosures, to arrest the cell members” (1964, 91). A more sophisticated version of this
procedure, the French Dispositif de Protection Urbaine (DPU) relied on a formal
network of Muslims who were responsible for providing names in their given sector,
and those named suspects were arrested at night and tortured in order to provide more
names for another round of arrests in the morning (Porch 2003, 383). Likewise, in
Vietnam, police or military forces would capture and interrogate a large number of
relatively unimportant Viet Cong “sympathizers,” from whom they would acquire
information about high-level rebel members (Valentine 1990, 287). In Colombia,
communities developed institutions specifically designed to limit random violence by
investigating suspects for the combatants (Kaplan 2009).
Why would civilians succumb to the pressure of these tactics? More precisely,
why do rebels not raise the costs of retaliation to the point necessary to fully deter
cooperation? First, the government may have a preponderance of power such that it can
threaten greater violence than the rebels can promise in retaliation.69 Second, the
quantity of information required to appease the government might elicit sufficiently
few rebel retaliations that the community suffers a net decrease in violence. Third,
retaliation is difficult. In Vietnam, Census Grievance Teams and later Rural
Development Teams met one-on-one with every resident of a village in order to
anonymously collect intelligence on Viet Cong forces (Moyar 2007, 74). This innovation
69 Random violence might also create a space for informed violence by decreasing rebel access to civilians
(Lyall 2009, Toft and Zhukov 2012).
138
was so effective that it became one of the primary means of clandestinely contacting
paid agents. Finally, rebels may have few local allies to facilitate retaliation for
denunciations against them — or the government may have sufficient local allies to
suppress counterdenunciation.70
The constraints posed by the government’s ability to project threats of random
violence and its ability to protect informants from rebel retaliation, suggest that the
state’s capacity and territorial control play a strong role in the distribution of violence
(Fearon and Laitin 2003). In a study of the Spanish Civil War, Balcells (2010, 2011)
examines a conventional civil war in which territorial control was close to absolute,
making the risks of retaliation for providing tips low. She finds that civilians were
willing to use denunciations to eliminate local political opponents. Kalyvas and Kocher
(2009) examine rebel violence in the Vietnam War when the Viet Cong were relatively
weak and find that they had limited ability to project targeted assassinations and
kidnappings outside of their areas of control.71 Kalyvas (2006) examines violence in the
Greek Civil War where the actors were near parity and found symmetrical distributions
of selective violence, each limited to their own area. Bhavnani et al. (2011) examine a
case of an asymmetrical distribution of power in favor of the government and find that
70 The III Corps Provincial Reconnaissance Unit (PRU) Director Col. Viet Lang noted that his forces
operated effectively in contested and rebel areas using family connections and avoided intelligence
coming in from the central government (Moyar 2007, 82). 71 I confirm this finding below with new data on Viet Cong violence provided over a longer period.
139
Israeli selective violence was used much more frequently than random violence in areas
controlled by the opposition.
In sum, the strategic interaction surrounding selective violence is characterized
by: (1) A government interested in finding and eliminating rebels from a larger
population; (2) An improvement in targeting capability with the aid of local intelligence
over random targeting without information; (3) A threat to communities from both
rebel retaliation for providing information and government random violence; (4) The
need for both credible threats and promises from the government in order to elicit
information; (5) A strong influence of control in shaping the cost of targeting and the
potential for retaliation; and (6) A strong influence of control in shaping the returns to
random violence for the government. The next section develops a model based on these
characteristics and uses it to determine the relationship between informed targeting,
random targeting, and the provision of information by communities.
4.3 A Model of Civilian Targeting in Civil War
Consider an interaction between two actors, a community and a government
The community contains a subset of the population of size , normalized to 1, who
could reasonably be suspected of being rebels.72 The subset of the population, , are
72 The pool could either be the entire population of the community or a particular demographic such as
military age males.
140
actually rebels or rebel collaborators, and . is common knowledge, though
only the community knows which suspects are actually rebels.73
The community makes one decision: the number of rebel identities to reveal to
the government, where . The government makes two decisions: the amount of
informed targeting to commit against the community, , and the amount of random
targeting to commit against the community . At the most, , , and
.
In the interaction, the community moves first, selecting a value to reveal to the
government.74 The government moves second, selecting an amount of informed and
random targeting to commit against the community. Finally, outcomes are realized and
payoffs are provided.
Define the expected amount of rebels correctly targeted (arrested or killed) by the
government as ( ), where
( ) (
) (
( )
)
73 The assumption of a known R follows from three observations. First, in practice the government knows
the rebel organizational structure of a typical village and even used it to estimate the number of rebels
based on the number of villages that were out of government control. Second, profiling is a strong
component of civil war where some communities are thought to harbor a greater number than others
based on their proximity to rebel areas, the number of attacks against military targets, etc. Finally, a
system of quotas used in Vietnam in many ways provided the answer of how many rebels there were
which security forces then had to produce. An extension could relax this assumption so that R is an
unknown random variable drawn from a known distribution that varies with rebel control. 74 Informed targeting suggests that information was provided prior to the operation or while forces were
on location.
141
Assume 0. The function ( ) is twice continuously differentiable, strictly
convex, and strictly increasing in . The probability of catching a rebel with
information is (
) where ( ) , and ( ) is both strictly increasing and
twice differentiable. Even with full revelation of information by the community, not all
rebels may be caught because of poor targeting technology or false denunciations.75 The
probability of catching a rebel with random targeting is ( (
)
) where
( ) , ( (
)
) as
(
)
, and ( ) is both strictly increasing and
twice differentiable. Every real rebel caught with informed targeting decreases the
usefulness of random targeting because there is one less rebel available in the suspect
population. Further, make the weak assumption that informed violence has a strictly
higher probability of catching a real rebel than random violence, (
) (
(
)
)
for all , , and . Substantively, this means that information can be relatively unhelpful
to government forces, but it cannot lead them to worse outcomes than if they had just
selected randomly from the population.
There are two key points to the model. Random targeting generates at least some
returns as long as there are some rebels but informed targeting always generates greater
returns. Second, informed and random targeting are substitutes rather than
75 For the U.S. Military in Iraq or Afghanistan the technology of targeting might be very good such that
(
) as , while for the Uganda People’s Defense Force it could be the case that (
) as
.
142
complements. Increasing the amount of informed targeting reduces the number of real
rebels left in the population thereby decreasing the returns on random targeting.76
The expected number of rebels caught under two different information regimes
and a higher are plotted in Figure 4.1. In the solution constructed below, the
government increases informed violence before random violence, and therefore the
effect of increased information is an increase in the number of correctly targeted rebels
(shown on the 45 degree slope and ) and a reduction of the returns of randomly
targeting the remaining suspects (shown in the difference in slopes between and ).
76 One can imagine cases where this would not be true. If the government was very uncertain about rebel
presence in a community, R, then tips might bring undue attention on the community that it might not
have otherwise received. Here, I consider differences in violence between communities where the
government has established clear scores of rebel control and thus where doubt over R is unlikely.
143
Figure 4.1: Expected Returns from Government Violence
This figure shows the number of genuine rebels that would be expected to be killed or captured
given some information sharing and a higher level of information sharing . The number of
genuine rebels killed or captured increases when more information is provided, but the rate of
return for additional random searches declines shown here by the change in slopes between
and .
4.3.1 Utilities
The government’s utility is given by
(1) ( ) ( ) ( )
is the government’s utility for committing violence against a community.
( ) is the number of genuine rebels expected to be targeted based on prior
intelligence and targeting not based on prior intelligence .77
77 For simplicity, I normalize the utility of eliminating real rebels to just the likelihood of eliminating them
(effectively weighted by 1). The results will hold under any monotonic transformation.
144
( ) is the disutility or cost of each additional act of violence. It is assumed that
( ) , that it is strictly convex, and that it is twice differentiable.78 The
cost for both types of violence are assumed to be the same.79
The government gains utility in the first term from the number of genuine rebels it
expects to target and suffers a disutility for each additional act of violence it commits.
The community’s utility is given by
(2) ( )
is the utility of a representative community member resulting from violence
and sharing information with the government.
is a positive or negative constant representing the community’s affinity to
those targeted with names provided to the government (potentially rebels
or innocent persons).80
is the number of suspects targeted based on names provided by the
community.
78 The assumption of escalating cost for each additional civilian targeted is consistent with the manpower
requirements in Vietnam. Small Special Forces units could target specific individuals and medium sized
police or militia forces were required for questioning and detaining a large number of people, while an
entire division could be required for a large cordon and search missions that resulted in the destruction
and relocation of an entire village. Further, legal and detention resources were a major constraint in
Vietnam (Lewy 1980, 288-9). 79 Relaxing this assumption changes Lemma 1 below such that the government prefers informed to
random violence only when the difference in the marginal gains to informed violence are proportional to
the difference in costs of random violence. This is unlikely to hold only when informed violence is not
particularly useful in general, where the technology of informed violence is very poor, or when the
population is almost exclusively made up of rebels. I propose this as a constraint/scope condition below. 80 Downes (2007) finds evidence in the Second Anglo-Boer War that selective violence is insufficient to
induce collaboration when civilian loyalties are inflexible.
145
is the number of suspects targeted randomly without community information.
( ) is a function representing the probability of rebel retaliation for an act of
information sharing.81 It is differentiable and strictly increasing in the
share of rebels in the population
.82
is the amount of information shared with the government and falls between
and .
The community suffers disutility from two sources, government violence and rebel
retaliation, for sharing information. Rebel control in a community is represented in two
places, the share of rebels to the suspect population and the rebel’s technology of
retaliation in that community ( ).
4.3.2 Equilibrium
The solution will be a subgame perfect Nash equilibrium in pure strategies,
solved through backwards induction starting first at the government’s selection of
violence given a level of community-provided information.
The Government’s Best Response
The government selects nonnegative levels of targeting and to
maximize utility,
( ) ( ) ( )
81 Retaliation could come either from rebels upset at losing one of their own, or from a counter-
denunciation by the friends of the innocent victim. 82 To see how the shape might vary, consider varying technologies for monitoring and retaliation.
Anonymizing tips was made possible through mass interviews, anonymous drop points, etc.
146
An interior solution for
equates the marginal benefit of an additional
targeting to the marginal cost of that targeting. A single optima is guaranteed by the
strict convexity of ( ) and ( ). The following lemma that governments will always
prefer to shift indiscriminate targeting to informed targeting when information is
available guarantees that optima is achieved through a unique pair of and
. The
intuition is that informed violence provides greater returns but costs the same as
random violence.
Lemma 1: The government will never choose to allocate resources to indiscriminate targeting,
, when there are still targets available with specific information, . See Appendix A.3 for a
formal proof.
Substituting in the function for the expected number of rebels captured and
taking the derivatives with respect and provide the following first order
conditions,
(
)
( (
)
)
( )
( ) ( )
(
( )
) ( )
and
147
Using Lemma 1, there are two conditions either and or and .
In the first case, substituting into the first order conditions ensures that the following is
true.
(
) (
)
In the second case, substituting into the first order conditions ensures that the following
is true.
(
) ( (
)
)
We can quickly verify whether the community falls under the first case by
comparing the derivative of the cost function at to the marginal returns for more
violence. When the rate of change in the cost function is at or above marginal return for
informed targeting, the optimum is guaranteed to only include informed violence,
(
) ( ). When the rate of change in the cost function is below this and above or
equal to the marginal gains from any random targeting, then the optimal allocation is to
use all of the informed violence possible, (
) ( ) (
(
)
). When the rate
of change in the cost function is below the marginal gains of even random targeting,
then the optimum includes at least some random violence, ( ) (
(
)
).
148
( )
{
{
} (
)
( ) (
) (
)
{
} (
) ( ) (
( )
)
{
} ( ) (
( )
)
( ) (
( )
)
There are two corner solutions as well. One occurs when the cost of violence is so
high that no targeting is ever worthwhile, ( ) (
(
)
) . The other is when the
costs are so low that there is no reason not to target the entire community regardless of
, ( ) . That the government’s cost lie between these extremes is the targeting
constraint, and I assume that it holds throughout.
How do and
vary with By Lemma 1, is weakly increasing in , and
is weakly decreasing in . Interestingly the effect of on the total level of targeting is
ambiguous. The basic intuition is that when the community provides information it
creates a tradeoff. Call the mix of informed and random targeting for a given level of
total targeting, the governments portfolio of targeting. On the one hand, it allows more
informed targeting than there could have been otherwise. On the other hand, the
increase in informed violence makes random violence less useful, so it can drive down
random targeting. Information then should shift the portfolio of targeting toward
informed and away from random, and the net total amount of targeting could go up or
down.
149
The Community’s Best Response
Information sharing affects the community’s utility in two ways, through the
amount of violence selected by the government and through the degree of retaliation by
the rebel group. The community selects a nonnegative level of information to share
that maximizes
( ( )) ( )
Given the targeting constraint holds, the first order condition given the government’s
and
is
( )
An interior solution equates the marginal losses from rebel retaliation and affection
toward the denounced to the marginal gains from less government violence,
( )
.
How does the optimal vary with and
? Anticipating the portfolio of
targeting that the government will use given a level of information, the community
selects so as to shape that portfolio to best suit its preferences. Three interesting cases
merit consideration. In the first case, the community suffers no rebel retaliation and has
no additional affinity or hatred of the denounced victims, and ( ) . The
community selects the minimum that makes the government indifferent between
using informed targeting and switching to additional random targeting, ( )
150
( (
)
). Interestingly, the number of denounced victims falls short of the number
of real rebels since the community is providing just enough information to appease the
government. In the second case, the community has affinity toward the victims or faces
positive risk of retaliation by the rebel group, or ( ) . Here, the community is
willing to absorb some government random targeting and provides even less
information. In a third case, the community dislikes the potential victims , and
provides as much information against them as is practicable given rebel retaliation.
There are values of the parameters for which cooperation is never in the
community’s interest. The cost of targeting for the government might be so high that it
would do no random targeting at all in the absence of information, ( ) ( ).
There might be so many rebels that every random targeting guarantees a real rebel,
, so that providing information has no positive effect. For at least some
cooperation then, ( ) ( ) and , which is the targeting constraint
constructed above. The extreme case when both R and the cost of targeting are high is
exactly when we see combatants use technological substitutions like aerial
bombardment and free fire zones, tactics which are typically referred to as
indiscriminate violence.
4.3.3 Comparative Statistics and Hypotheses
When looking at conflict data, how should informed violence, random violence,
and the flow of information from the community,
and , co-vary? How should
151
they vary with the government’s influence over territory, ( ) and the presence of and
influence over territory by rebels, and ( )? How should they vary with the
community’s affinity toward the victims,
Community Provision of Information
Information influences the government’s optimal level of violence in two places,
the hard constraint that and the probability of catching a genuine rebel with
informed violence (
). Following from Lemma 1, informed and random violence are
substitutes such that more information drives up informed violence and drives down
random violence. Because the total amount of violence is driven by other factors such as
the cost of violence and rebel presence, the model suggests that information provision
will have an ambiguous effect on the total amount of violence. Instead, more
information shifts the portfolio of violence toward informed and away from random. I
cast this prediction as Hypothesis 1.
Hypothesis 1: The share of informed to total government violence will be higher in communities
that provide more information, all else being equal.
Government’s Cost of Targeting
Consider the effect of a decrease in the marginal cost of violence function for the
government, ( ) . Holding constant, lower costs drive up all types of
government violence. The effects appear graphically in Figure 4.2. Three progressively
152
less expensive cost functions and shift the optimal total amount of violence
higher from , to
, and .
Figure 4.2: Government’s Best Response given Differing Costs
This figure shows how the government’s best response varies across three hypothetical cost
functions. , and represent progressively lower costs per targeting for the government.
Where they intersect
are the government’s optimal level of violence , or in the case of
where they never intersect the optimum level of violence is just .
Allowing to respond as in Figure 4.3 shows that lowering the government’s
cost from to always increases the information provided by the community. This is
true when the community faces no threat of rebel retaliation or affinity toward the
victims and when it faces either . The intuition is that lowering the
government’s cost increases the level of expected random violence. This in turn shifts
the community’s optimal amount of information sharing from over to
and from
to
. Notice that the shift is much smaller for the community which suffers
153
retaliation and loss from affinity toward victims than it does for the community that
does not. I cast these predictions as Hypothesis 2A and 2B.
Hypothesis 2A: Government informed targeting, random targeting, and total targeting should
be higher in communities with greater government control, all else being equal.
Hypothesis 2B: Provision of information should be higher in communities with greater
government control, all else being equal.
154
Figure 4.3: The Community’s Best Response
This figure shows how the community’s best response varies with varying affinity, risk of rebel
retaliation, and government cost. ( ) is the baseline return to the government for randomly
targeting when no information is provided. The derivatives of and represent two
progressively less expensive cost functions. Where and intersect the baseline return is the
level of random violence the government would set in equilibrium. The derivatives of and
represent two communities where sharing is progressively more painful (because of affinity to the
victims). Where the derivatives of and intersect the derivatives of the government’s cost
and will be the optimal level of information sharing for the community. When it is more
costly to the community to share information (because of say high affinity to the targets) their
optimal level of information sharing drops.
Rebel Control in a Community
Rebel control over a community has multiple countervailing effects on patterns
of government violence. Rebel control is represented in the model in two places, the
number of rebels and the technology used in rebel retaliation for cooperating with the
government ( ) which is also increasing in . Consider the effect of an increase in the
marginal cost of rebel retaliatory violence, ( ) . In Figure 4.3 above, the effect
would be to shift from a baseline utility curve for the community to a lower one
155
where it is less beneficial to provide information. Information provision will decline,
resulting in a shift in the portfolio of violence from informed targeting to random
targeting. Ceteris paribus, the total amount of violence, would also weakly decrease
since some violence that information made affordable is now converted to less
worthwhile random targeting.
However, increasing the number of rebels in the population , also increases the
marginal returns for random violence because every chance encounter has a higher
probability of finding a genuine rebel. Thus random targeting should be increasing with
rebel control. Surprisingly, this should also drive up informed violence because a
community’s incentives for cooperating with the government depend on the credible
threat of random violence. The more rebels per capita, the more credible a threat of
abuse the government can hold over the community’s head when soliciting
information. The net effect then is an increase in both informed and random targeting,
but a shift in portfolio toward informed and away from random. I cast these predictions
as hypothesis 3A and 3B.
Hypothesis 3A: Government informed targeting, random targeting, and total targeting should
be higher in communities with greater rebel control, all else being equal.
156
Hypothesis 3B: Provision of information should be lower in communities with greater rebel
control, all else being equal.
Affinity
Finally, communities have a wide range of motivations to denounce or protect
certain individuals that the model captures as a measure of affinity, . A strong affinity
for the victims drives down the amount of information shared with the
government and a strong dislike drives up the amount of information shared. An
implication is that when comparing communities, there will be a drop in intelligence in
one community and a windfall in another due to affinity even when conditioning on
rebel control and government control. This result suggests that measures of popular
attitudes and affiliation are important for predicting patterns of selective targeting or at
a minimum we should include community level fixed effects in an empirical model.
4.4 The Empirical Setting: Violence toward Civilians in the Vietnam War
In a country of just 17 million people, estimates put the number of total civilian
casualties in the Vietnam War at two hundred thousand at the lowest and as high as
one million (Hirschman et al. 1995).83 The Communist Party of South Vietnam
distributed a broad list of 15 groups that rebels might target that included government
83 Civilians lived primarily in one of about 30,000 hamlets, organized into about 3,000 villages, which
were inside 237 political districts, inside 44 provinces. The country was further divided into 4 Corps
Tactical Areas by the U.S. military.
157
administrators, popular local leaders, persons who collaborated with the government,
and family members of the above (Pike 1970, 30-31). The government in return targeted
members of the rebel organization commonly referred to as the Viet Cong
Infrastructure (VCI), which was either an overt cadre that openly performed
governmental and support functions or a covert cadre that clandestinely worked for the
rebel forces while blending into the population.84 The government compiled a large list
of political positions controlled by the Viet Cong and assigned them A, B, and C letter
scores representing their priority to the targeting program. Government figures show
that between 15,000 and 22,000 Viet Cong suspects were captured or killed annually
from when the program became fully operational in 1968 to when it was mostly
disbanded in 1972. In the same period, a substantial share of aerial bombardment and
artillery shelling was targeted toward populated areas that were considered to be under
rebel control (Thayer 1985, Kocher et al. 2011).
The Vietnam War is a uniquely transparent case due to the availability of
extensive sources of information on violence toward civilians during the war. Rebel
violence toward civilians is detailed in interviews with civilians (Pohle 1969; Leites
documents, and the actual database of suspects used by the Phoenix Program (Kalyvas
and Kocher 2007).
4.4.1 Dependent Variable- Selective Targeting
I have compiled the details of 47,404 government killings and arrests committed
with the support of or documented by the Phoenix Program between July 1969 and
December 1972. Of those, 8,617 were recovered from archived printouts of “Monthly
Neutralization Reports” from the Viet Cong Infrastructure Neutralization System from
July 1969 to June 1970.85 Another 38,787 are detailed in the archived electronic copy of
the National Police Infrastructure Analysis System (NPIASS).86 Each act is
georeferenced to the nearest village. Temporal resolution varies between the two
systems, but I aggregate the unit of analysis to the village-quarter. Total violence is 85 Because of an incomplete preservation of documents, only data for Forth Corp is available from January
1970 to July 1970. The full country is available otherwise. For a description of the data see “Vietcong
Infrastructure Neutralization Systems (VCINS)”, no date, Folder 065, US Marine Corps History Division
Vietnam War Documents Collection, The Vietnam Center and Archive, Texas Tech University. Accessed
23 Mar. 2012. <http://www.vietnam.ttu.edu/virtualarchive/items.php?item=1201065056> 86 For a description of the data see National Archives and Records Administration, “Reference Copy of
Technical Documentation for National Police Infrastructure Analysis Subsystem (NPIASS) I & II Master
Files,” 2008, Records of the Joint Commands, RG 349. The genesis of the database is described by
McChristian (1994), and for a recent analysis see Kalyvas and Kocher (2007).
159
measured by the sum of killings and arrests committed in that village-quarter. Both
systems record whether the victim was specifically targeted by the operation or if
they were identified concurrently or following the operation .87 About a third of
Phoenix targeting were operations launched based on prior information, 15,313 versus
32,803.88
The model speaks primarily to government selective violence, where costs for
targeting may be relatively low thanks to greater manpower, superior technology, and
the availability of highly mobile units. However, for comparison I include rebel
selective violence recorded at the level of individual attacks by the Terrorist Incident
Reporting System (TIRSA).89 TIRSA records whether an act was selective or general in
nature, the means used, the target, and the number of casualties inflicted. I use the
original coding of selective and general, with the minor change that general acts against
public officials with only one or two casualties were probably selective acts because of
the target and the close proximity of the violence, which I recode accordingly. The data
show that between July 1969 and December 1972, the Viet Cong selectively killed or
87 NIPIASS records whether the victim was a “Specific Target” or “Non-specific target.” VCINS records
whether the victim was a “Specific target,” “General target,” “Cordon and Search,” “Main Force Sweep,”
or “Other.” 88 Random violence (profiling) took many forms, including cordon and sweep operations and road
blocks. In operation Barking Sands, the 25th Infantry Division temporarily detained over 35,000 people
over a seventh month period in Hua Nghai and Binh Duong Provinces (Bergerud 1993, 166). In the
cordon and search operation Cedar Falls, 106 villagers were arrested out of six thousand over a one
month period (Schell 1967). 89 The data are documented in National Archives and Record Administration (NARA), Reference Copy of
Technical Documentation for Accessioned Electronic Records The Terrorist Incident Reporting System
(TIRSA) October 1967-February 1973, RG330, Records of the Office of the Secretary of Defense.
160
abducted at least 5,623 civilians and government administrators. The distribution of
both government and rebel selective violence over time is plotted below in Figure 4.4.
Figure 4.4: Government and Rebel Selective Violence July 1969-December 1972
This figure shows the total number of civilians killed and captured/abducted over time. The dip
in government targeting in the first and second quarter of 1970 is the result of missingness; only
data for IV Corps is available for this period.
4.4.2 Independent Variables- Territorial Control and Intelligence
How to correctly map the distribution of military and political infrastructure to
territorial control is a problem that both sides struggled with throughout the war (Hunt
1974, 15; Blood 2005, 62-63; Adams and Hackworth 1998, 55). A reasonable approach
was developed in the form of the Hamlet Evaluation System (HES), which is discussed
in much greater detail in Chapter 3. HES assigned each of over 12,000 hamlets and over
2,500 villages aggregate security scores based on the answers to over 60 questions and
161
was updated monthly using a weighted Bayesian procedure (Kalyvas and Kocher
2009b, 17). In each case, answers were provided by American District Senior Advisors
along with their South Vietnamese military counterparts.90 For simplicity, in this
chapter I follow Kalyvas and Kocher (2009) and use aggregate Bayesian measures used
in the original HES survey. Chapter 3 develops more refined measures based on an item
response model, but the original HES aggregations are more than sufficient to illustrate
and test the model proposed here.91
The first aggregate measure, , takes into account the presence of both
government and rebel forces and roughly categorizes a village into fully government
control, partial government control, fully contested, partially rebel controlled, and fully
rebel controlled.92 To measure , I use a constituent aggregation of
questions pertaining only to the presence of government military forces.93 The measure
includes questions on the government forces in or nearby the village, availability of
outside fire support, and the ability for government personnel to safely travel. To
90 A full discussion of the controversies surrounding data collection and generation in the Vietnam War
are beyond the scope of this article. For a representative critique of the first HES system see Tunney
(1969), and for a supportive external validity check of HES see Pool et al. (1968). For a modern critique of
the misuse of metrics in Vietnam see Daddis (2011). 91 In addition to substantially streamlining the discussion of the evidence, using the original measures
provides access to a number of observations for which the original questions and responses are not
available. 92 The aggregation is known as VMOD6B and is a population weighted aggregation of hamlet and village
level questions. Kalyvas and Kocher (2009b) describe the qualitative interpretation of each category in
terms of the Hamlet Evaluation System score for a similar aggregation. See Kalyvas (2006, 421) for a more
thorough account of territorial control and Samson (1970) for the five zone scheme’s applicability to the
Vietnam case. Chapter 2 examines this measure in much greater detail. 93 The aggregate HES measure is called VMOD1D.
162
measure RebelControl, I use a constituent aggregation of questions pertaining to the
presence of rebel military forces.94 The measure includes questions on whether rebel
forces physically occupy the hamlet, make the area around the hamlet unsafe for travel,
are able to tax or recruit, and the estimated size of guerrilla and main force units in the
area. The constituent questions for both aggregations appear in Appendix A.4 and A.5.
As expected, the two measures are negatively correlated (-0.61), but there is
considerable overlap. The distribution of each type of control and the joint distribution
of and appear below in Figure 4.5. Of particular
interest in a conflict such as Vietnam is the fractured nature territorial control; rebel
pockets directly border government pockets of control throughout the country as
shown in Figure 4.6.
94 The aggregate HES measure is called VMOD1A.
163
Figure 4.5: Control Disaggregated into Rebel and Government Control
This figure shows the distribution of total control and two disaggregated constituents of
government control and rebel control. Measures are based on Bayesian village level aggregations
from the HES70/71 system, VMOD6B for total control, VMOD1D for government control, and
VMOD1A for rebel control. To maintain comparison to the existing literature, the order is
reversed from an earlier chapter; Full Government=1; Partial Government=2, Mixed=3, Partial
Rebel Control=4; and Full Rebel Control=5. The disaggregations of government control and rebel
control increase in number so that 1 is least control and 5 is most.
164
Figure 4.6: Map of Village Control in Oct. 1970
This figure shows estimates of control from Oct. 1970 based on the Bayesian village level
aggregation from HES70/71 VMOD6B.
165
To measure the availability of intelligence in a community, I use two Hamlet
Evaluation Survey quarterly questions that ask the District Senior Advisor to rate the
portion of rebel identities known to friendly intelligence personnel. The first, which I
refer to as IntelligenceVCI, asks, “Are the identities of members of the enemy
infrastructure for this village known to friendly intelligence personnel?” The second,
, asks, “Are the identities of the members of the enemy village
guerrilla unit known to friendly intelligence personnel?” The answer to both is an
ordered response: “No”; “one”; “Yes, a few (less than 10%)”; “Yes, some (10%-40%)”;
“Yes, many (41%-90%)”; “Yes, all or nearly all”; and “No enemy infrastructure [village
guerilla unit] exists for this village.” I create dummy variables and
indicating the complete absence of rebels (and thus no intelligence to have). I further
create a composite index where
( ) which is
normalized to take a value between 0 and 1. The composite is necessary and useful due
to the similarity between concepts represented in the individual questions. This is
reflected in their high correlation (0.831).95 Figure 4.7 shows the levels of
TotalIntelligence.
95 Correlation calculated by excluding responses of no rebels present.
166
Figure 4.7: Availability of Intelligence and Territorial Control
This figure shows the distribution of access to intelligence over villages under different levels of
control. Control is based on the Bayesian village level HES70/71 aggregation VMOD6B. Total
Intelligence is the combination of two village level questions on knowledge of local persons
belonging to the rebel ranks, and is normalized here to fall between 0 and 1. The dark line
represents a fitted normal distribution. Even in partially and fully rebel controlled areas, District
Senior Advisors reported at least some knowledge of the identities of local rebels.
4.4.3 Control Variables
The existing empirical and theoretical literature on sub-national violence,
including work specific to Vietnam, suggest a number of relevant control variables.
Kongsgård (2010) shows that attacks against military targets were more prevalent near
populated areas, and Kocher (2004) shows that in Vietnam urban areas were much
more likely to be under government control. Therefore, I include the village’s log
population and whether the village contains at least one hamlet that is urban. Common
167
demographic traits such as ethnicity and religion can help solve the collective action
problems inherent to organizing rebellion, so I include whether the hamlet is primarily
of the majority ethnicity, Vietnamese, or the major religion, Buddhist (Lichbach 1995;
Popkin 1979; Kalyvas and Kocher 2007). I include a dummy variable for whether the
primary occupation of the village is farming because resource extraction is thought to
influence propensity for violence, and at one point 80 to 90 percent of rebel finances
were obtained from rice taxes (McChristian 1994, 167).
4.5 Results
4.5.1 Violence over Aggregate Territorial Control
According to the theory of selective violence proposed by Kalyvas (2006) and
applied to the Vietnam War by Kalyvas and Kocher (2009), each side’s selective violence
should peak in their own area of partial control and enemy areas should be relatively
absent of such violence. The prediction depends on the argument that violence ought to
only be directed towards places where civilians are willing to provide information, and
they are only willing to do so when protected from the retaliatory violence by the
opponent. There is strong evidence that civilians in Vietnam weighed their security
situation carefully when considering whether to cooperate with the government, but
the overall suggested pattern does not match contemporaneous accounts.
168
Civilians in rebel areas were disproportionately targeted for arrest and
assassination by government forces. Based on interviews with South Vietnamese
legislators and policy makers, Goodman (1973, 227) finds, “One of the major sources of
'Viet Cong Suspects' are military operations that move into a Viet Cong area and pick
up all the civilians they encounter. This method is called the 'snatch' and on official
reports the suspect is 'linked' to the Viet Cong because he was found in an insecure
area.” An American military Phoenix Program advisor similarly reports that “The
touchables are generally those living in VC havens and low level legals. If they are
neutralized no one really cares. They have no money, political power, or religious
influence. They are non-influential entities. They are touchable - neutralizable.”96
Contested areas were sometimes particularly dangerous. When the city of Hue fell to
Viet Cong forces during the Tet Offensive, it experienced a purge of 2,500 to 3,500
civilians based on precompiled lists provided by local informants. It then experienced
another purge by government forces liberating the city based on names compiled by the
CIA’s base chief (Prados 2009, 240).
Were contested and rebel areas relatively free of government random or
informed targeting? I interpret this in a regression framework where government
violence is represented by (indexed by or when specifically applying to informed
96 Endy, Major Clarence E. “Phung Hoang (Thua Thien Province) advisor, gives his views on Phung
Hoang based on his experience in that province 10/71-9/72”, September 19, 1972. CK3100198059.
Declassified Documents Reference System. Farmington Hills, Mich.
169
or random targeting), communities are indexed by , and time periods by . Define to
be the ratio of informed violence to all violence,
. I estimate violence as a
function of an aggregate measure of territorial control which roughly divides
communities into five zones: (1) Full Government Control, (2) Partial Government
Control, (3) Mixed, (4) Partial Rebel Control, and (5) Full Rebel Control. I break each
zone into dummy variables with full government control as the base category. I further
include controls for population, urbanity, administrative center, ethnicity, religion, and
occupation, along with district and quarter fixed effects. Throughout, I use ordinary
least squares with errors clustered by village.w
The results in Table 1, which are displayed graphically in Figure 4.8, show that
violence disproportionately targeted mixed and rebel areas, with a sharp drop off in
fully rebel controlled areas. Informed violence is distributed rather uniformly across
contested, partially rebel-controlled, and fully rebel-controlled areas. Government
random violence actually peaks in rebel areas of partial control, but across models both
fully contested and rebel controlled areas are statistically indistinguishable from one
another. Importantly, the more prevalent areas of government and partial government
control are underrepresented in violence overall. In the final two columns, I include
Viet Cong selective violence as a base of a comparison. Rebel violence peaks in fully
170
contested and partially rebel controlled areas. The distribution is remarkably flat but
consistent with the view that in the later part of the war the Viet Cong were limited in
their ability to project violence into government-controlled areas.
Figure 4.8: Distribution of Selective Targeting over Territorial Control
This figure shows parameter estimates for number of attacks in each zone of control relative to
full government control, as presented in Table 4.1. The unit of observation is the village-quarter
and zones of control are (1) Full Government, (2) Partial Government, (3) Mixed, (4) Partial Rebel,
and (5) Full Rebel. Whiskers are 95% confidence intervals from robust standard errors clustered
on village. It shows that mixed and partially rebel controlled areas are disproportionately