17
Why Philippine Growth Is Sustainable Over the Long Term Dr. Bernardo M. Villegas Ph.D. (Harvard) University Professor, University of Asia and the Pacific Manila, Philippines

Why Philippine Growth Is Sustainable Over the
Long Term
Dr. Bernardo M. Villegas
Ph.D. (Harvard)
University Professor, University of Asia and the Pacific
Manila, Philippines
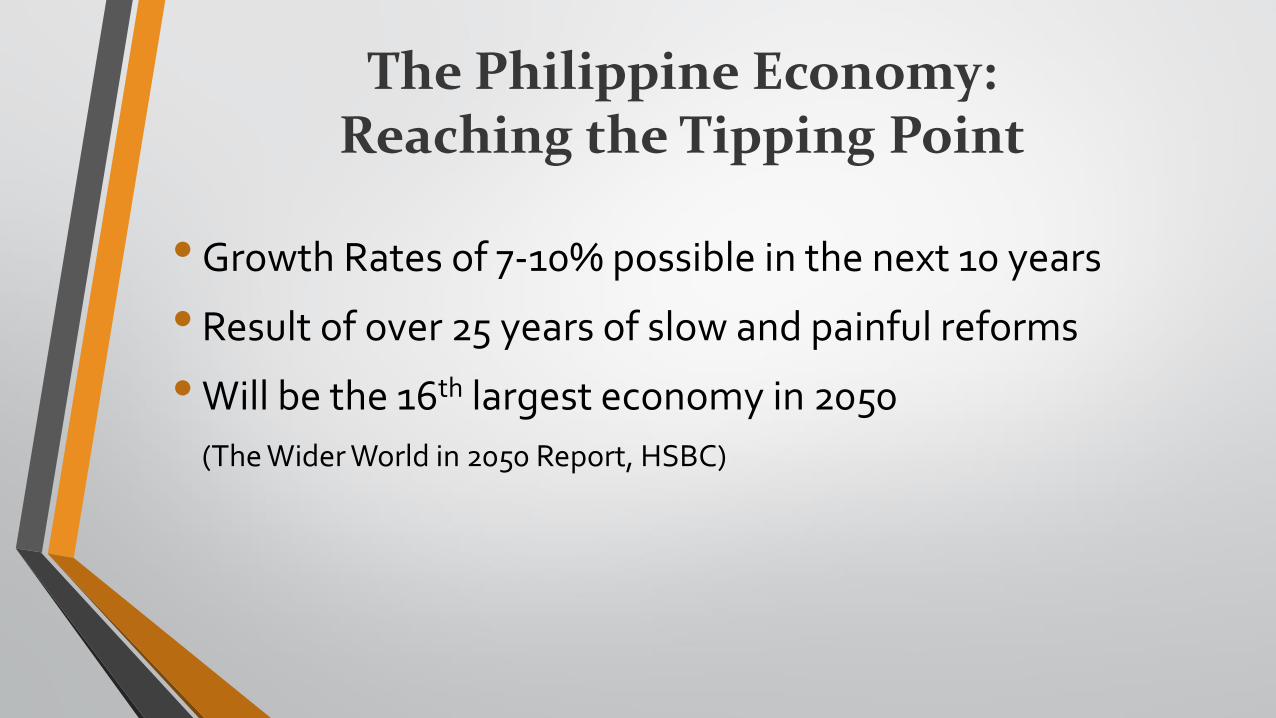
The Philippine Economy: Reaching the Tipping Point
•Growth Rates of 7-10% possible in the next 10 years
• Result of over 25 years of slow and painful reforms
•Will be the 16th largest economy in 2050
(The Wider World in 2050 Report, HSBC)
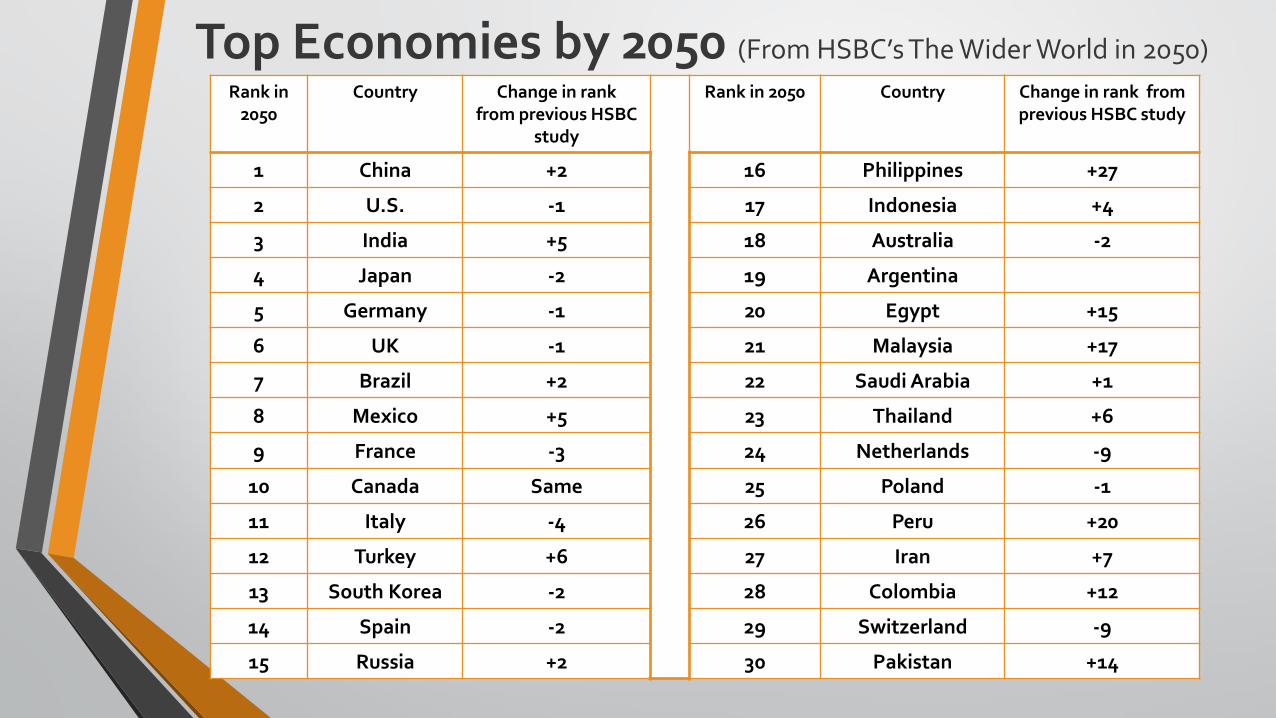
Top Economies by 2050 (From HSBC’s The Wider World in 2050)
Rank in 2050
Country Change in rank from previous HSBC
study
Rank in 2050 Country Change in rank from previous HSBC study
1 China +2 16 Philippines +27
2 U.S. -1 17 Indonesia +4
3 India +5 18 Australia -2
4 Japan -2 19 Argentina
5 Germany -1 20 Egypt +15
6 UK -1 21 Malaysia +17
7 Brazil +2 22 Saudi Arabia +1
8 Mexico +5 23 Thailand +6
9 France -3 24 Netherlands -9
10 Canada Same 25 Poland -1
11 Italy -4 26 Peru +20
12 Turkey +6 27 Iran +7
13 South Korea -2 28 Colombia +12
14 Spain -2 29 Switzerland -9
15 Russia +2 30 Pakistan +14
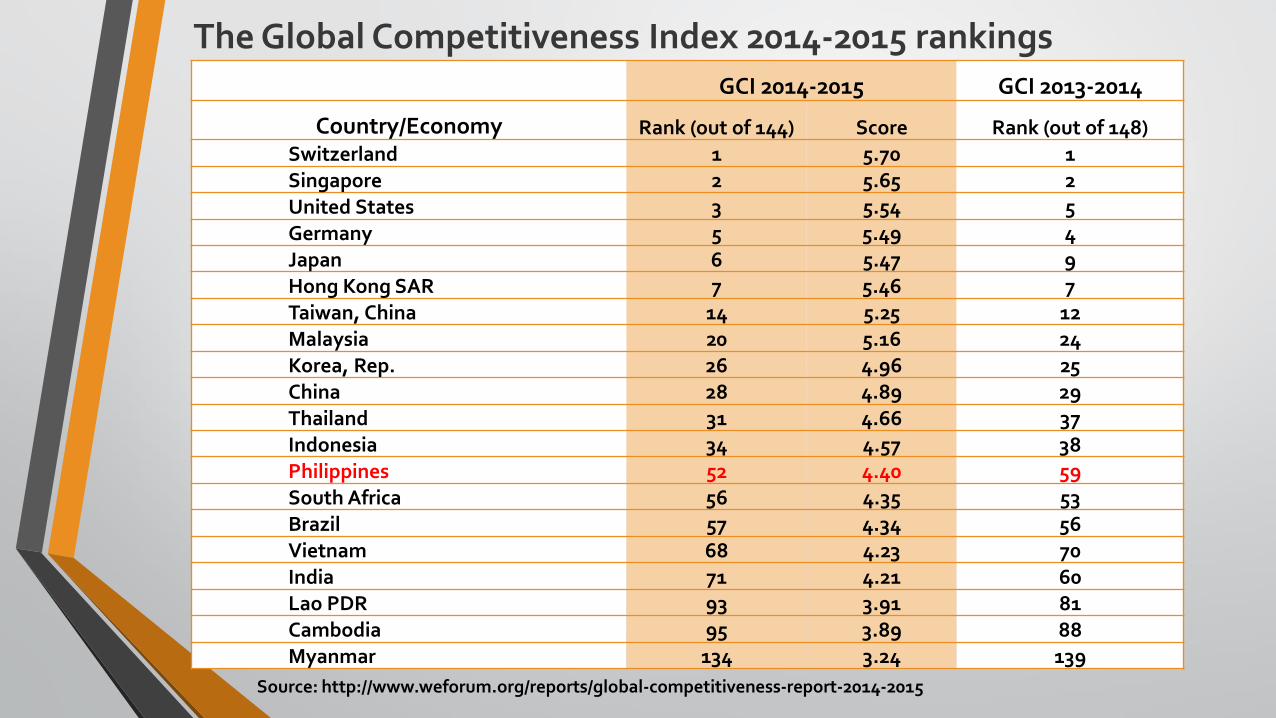
The Global Competitiveness Index 2014-2015 rankings
Source: http://www.weforum.org/reports/global-competitiveness-report-2014-2015
GCI 2014-2015 GCI 2013-2014
Country/Economy Rank (out of 144) Score Rank (out of 148) Switzerland 1 5.70 1
Singapore 2 5.65 2
United States 3 5.54 5
Germany 5 5.49 4
Japan 6 5.47 9
Hong Kong SAR 7 5.46 7
Taiwan, China 14 5.25 12
Malaysia 20 5.16 24
Korea, Rep. 26 4.96 25
China 28 4.89 29
Thailand 31 4.66 37
Indonesia 34 4.57 38
Philippines 52 4.40 59
South Africa 56 4.35 53
Brazil 57 4.34 56
Vietnam 68 4.23 70
India 71 4.21 60
Lao PDR 93 3.91 81
Cambodia 95 3.89 88
Myanmar 134 3.24 139
5.9
5.9
5.5
5.1
4.7
4.1
3.6
3.1
2.7
2.4
2
1.7
1.1
0.8
0.6
0.4
0.2
0.1
0.1
0.3
0.4
0.7
1
1.5
1.9
2.3
2.7
3.1
3.6
4.2
4.8
5.3
5.8
6.2
6.2
8 7 6 5 4 3 2 1 1 2 3 4 5 6 7 8
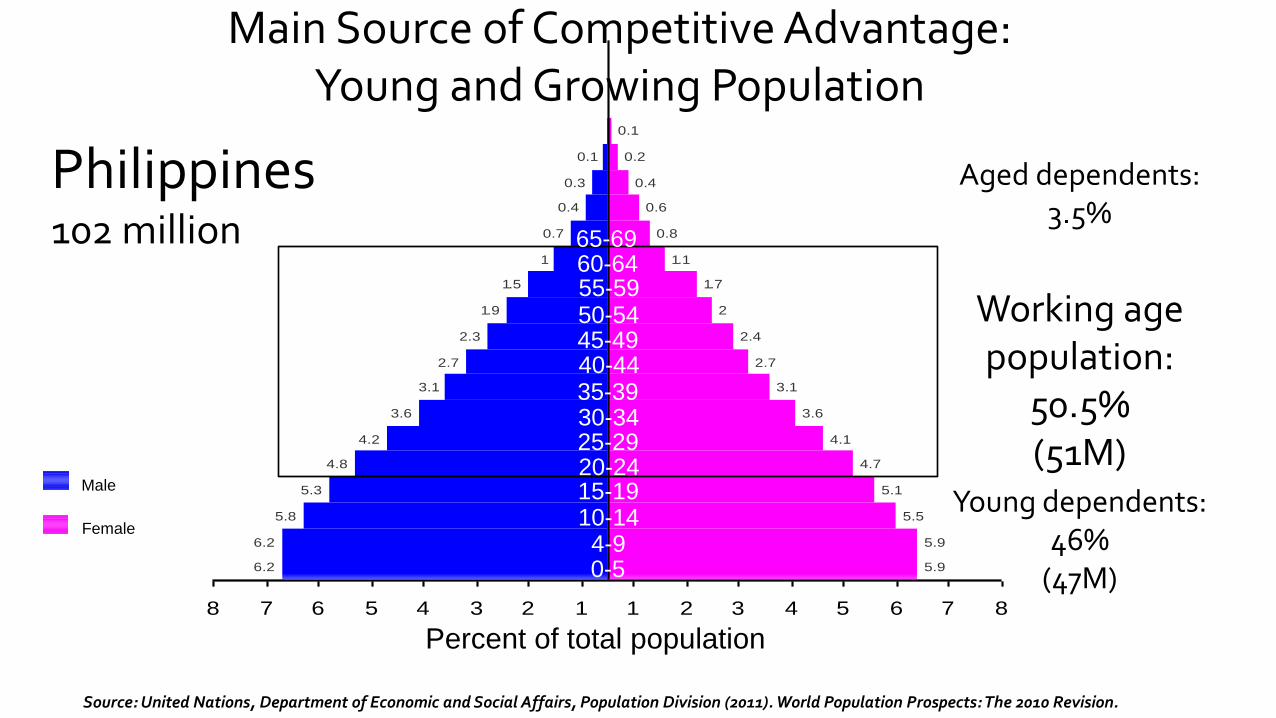
Philippines 102 million
Source: United Nations, Department of Economic and Social Affairs, Population Division (2011). World Population Prospects: The 2010 Revision.
Percent of total population
25-29
50-54
40-44
30-34
15-19
4-9
55-59
45-49
35-39
20-24
10-14
0-5
60-64 65-69
Working age population:
50.5% (51M)
Male
Female
Young dependents: 46%
(47M)
Aged dependents: 3.5%
Main Source of Competitive Advantage: Young and Growing Population
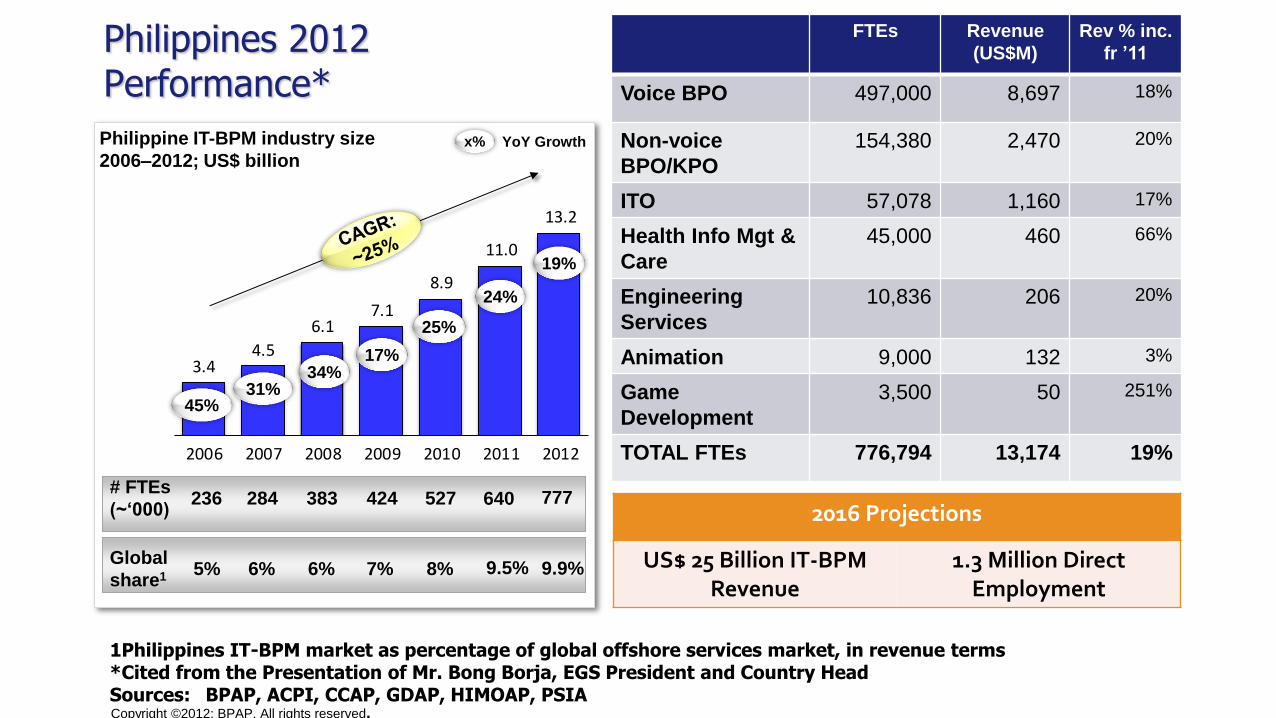
Philippine IT-BPM industry size
2006–2012; US$ billion x% YoY Growth
1Philippines IT-BPM market as percentage of global offshore services market, in revenue terms *Cited from the Presentation of Mr. Bong Borja, EGS President and Country Head Sources: BPAP, ACPI, CCAP, GDAP, HIMOAP, PSIA
# FTEs
(~‘000) 236 383 424 527
Global
share1 5% 6% 6% 7% 8%
3.44.5
6.17.1
8.9
11.0
13.2
2006 2007 2008 2009 2010 2011 2012
34% 17%
25%
24%
Copyright ©2012: BPAP. All rights reserved.
FTEs Revenue
(US$M)
Rev % inc.
fr ’11
Voice BPO 497,000 8,697 18%
Non-voice
BPO/KPO
154,380 2,470 20%
ITO 57,078 1,160 17%
Health Info Mgt &
Care
45,000 460 66%
Engineering
Services
10,836 206 20%
Animation 9,000 132 3%
Game
Development
3,500 50 251%
TOTAL FTEs 776,794 13,174 19%
19%
284 640
9.5%
777
Philippines 2012 Performance*
31% 45%
9.9%
2016 Projections
US$ 25 Billion IT-BPM Revenue
1.3 Million Direct Employment
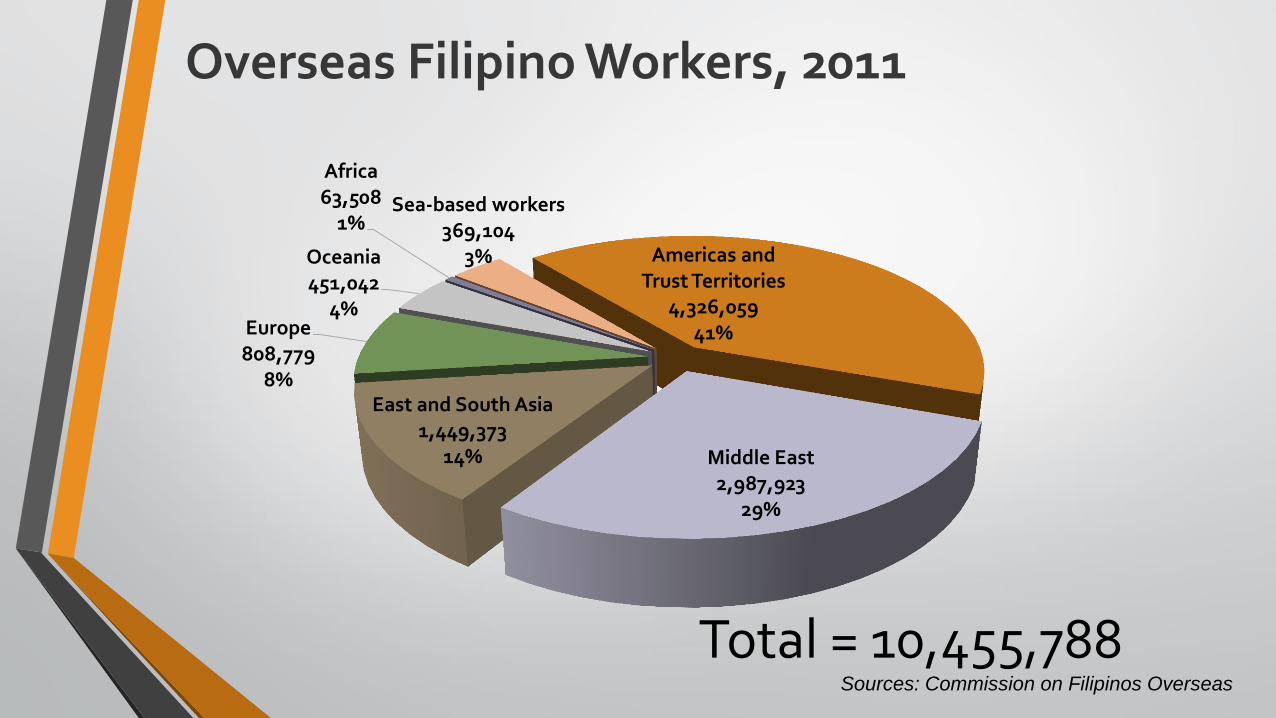
Overseas Filipino Workers, 2011
Sources: Commission on Filipinos Overseas
Americas and Trust Territories
4,326,059 41%
Middle East 2,987,923
29%
East and South Asia 1,449,373
14%
Europe 808,779
8%
Oceania 451,042
4%
Africa 63,508
1% Sea-based workers
369,104 3%
Total = 10,455,788
Positive Trends
• Stable democracy
• Improving governance
• Strong macroeconomic fundamentals
• Labor peace
• Educated, young, and English-speaking labor force
• Strategic geographic location: launching pad for AEC
• Renaissance of manufacturing
• High rate of savings due to OFW remittances
• Low rate of dependence on petroleum
• One of the emerging markets
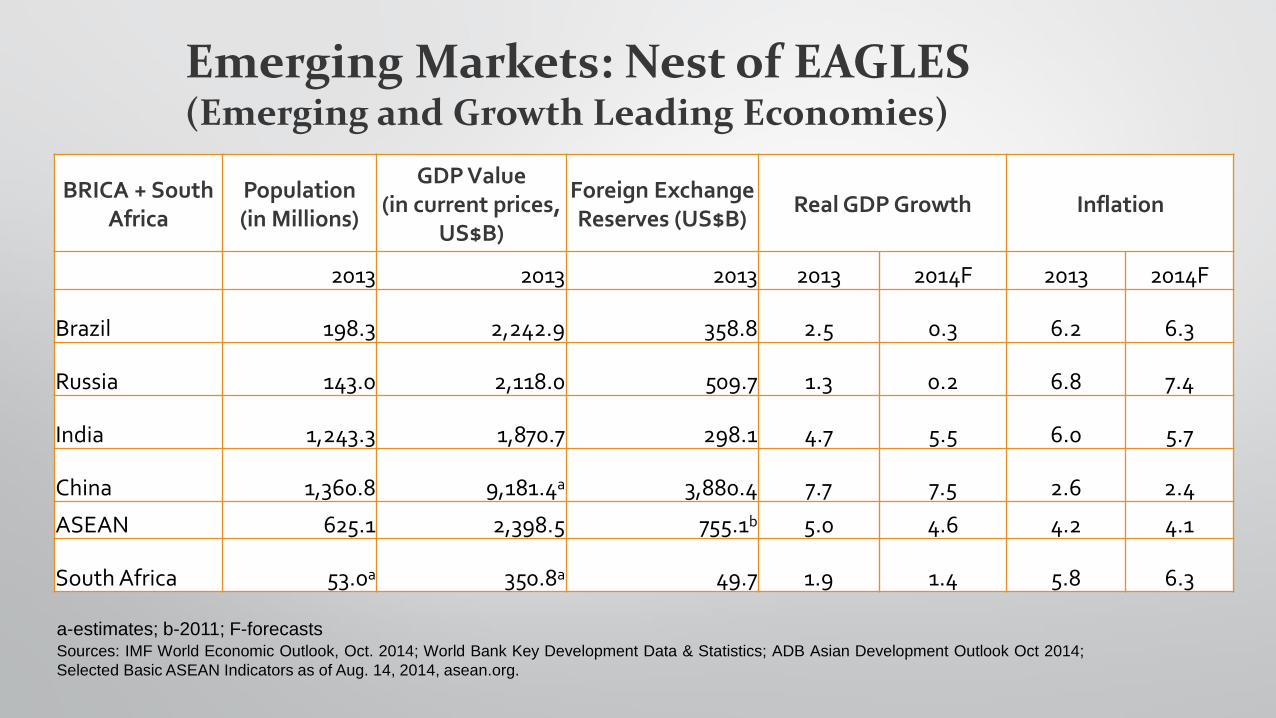
BRICA + South Africa
Population (in Millions)
GDP Value (in current prices,
US$B)
Foreign Exchange Reserves (US$B)
Real GDP Growth Inflation
2013 2013 2013 2013 2014F 2013 2014F
Brazil 198.3 2,242.9 358.8 2.5 0.3 6.2 6.3
Russia 143.0 2,118.0 509.7 1.3 0.2 6.8 7.4
India 1,243.3 1,870.7 298.1 4.7 5.5 6.0 5.7
China 1,360.8 9,181.4a 3,880.4 7.7 7.5 2.6 2.4
ASEAN 625.1 2,398.5 755.1b 5.0 4.6 4.2 4.1
South Africa 53.0a 350.8a 49.7 1.9 1.4 5.8 6.3
Emerging Markets: Nest of EAGLES (Emerging and Growth Leading Economies)
a-estimates; b-2011; F-forecasts Sources: IMF World Economic Outlook, Oct. 2014; World Bank Key Development Data & Statistics; ADB Asian Development Outlook Oct 2014;
Selected Basic ASEAN Indicators as of Aug. 14, 2014, asean.org.
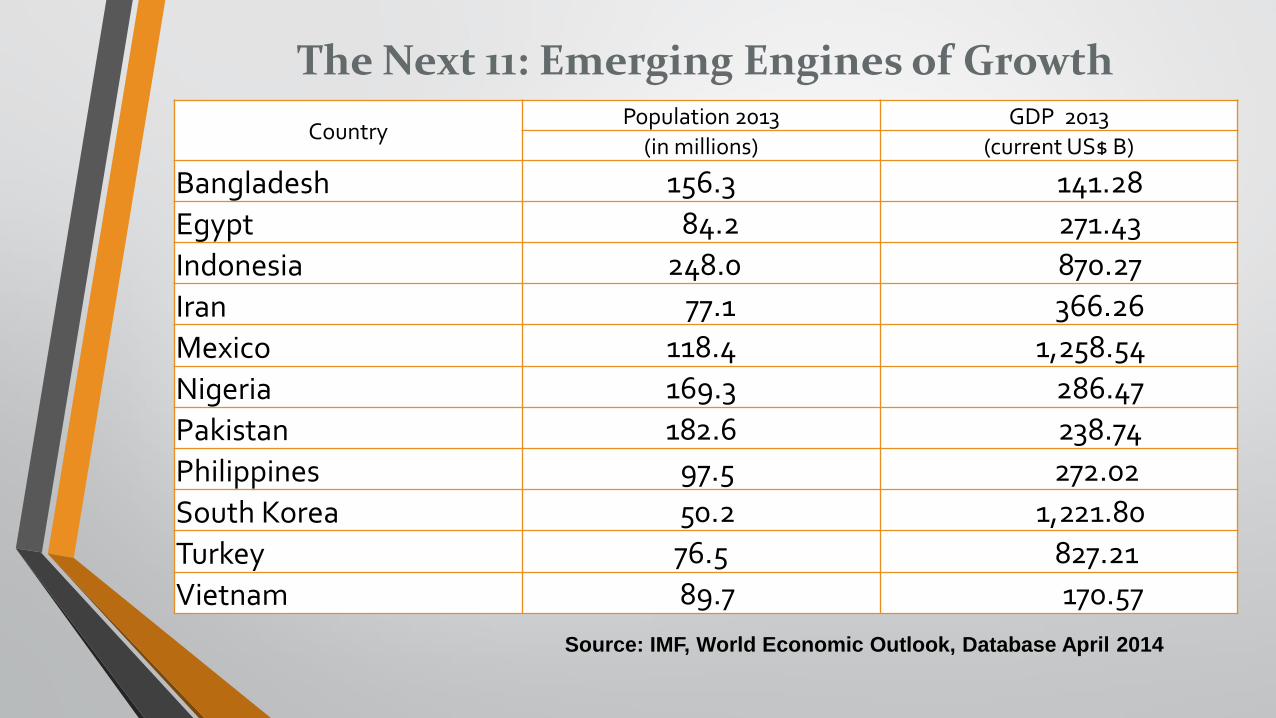
The Next 11: Emerging Engines of Growth
Source: IMF, World Economic Outlook, Database April 2014
Country Population 2013 GDP 2013
(in millions) (current US$ B)
Bangladesh 156.3 141.28
Egypt 84.2 271.43
Indonesia 248.0 870.27
Iran 77.1 366.26
Mexico 118.4 1,258.54
Nigeria 169.3 286.47
Pakistan 182.6 238.74
Philippines 97.5 272.02
South Korea 50.2 1,221.80
Turkey 76.5 827.21
Vietnam 89.7 170.57
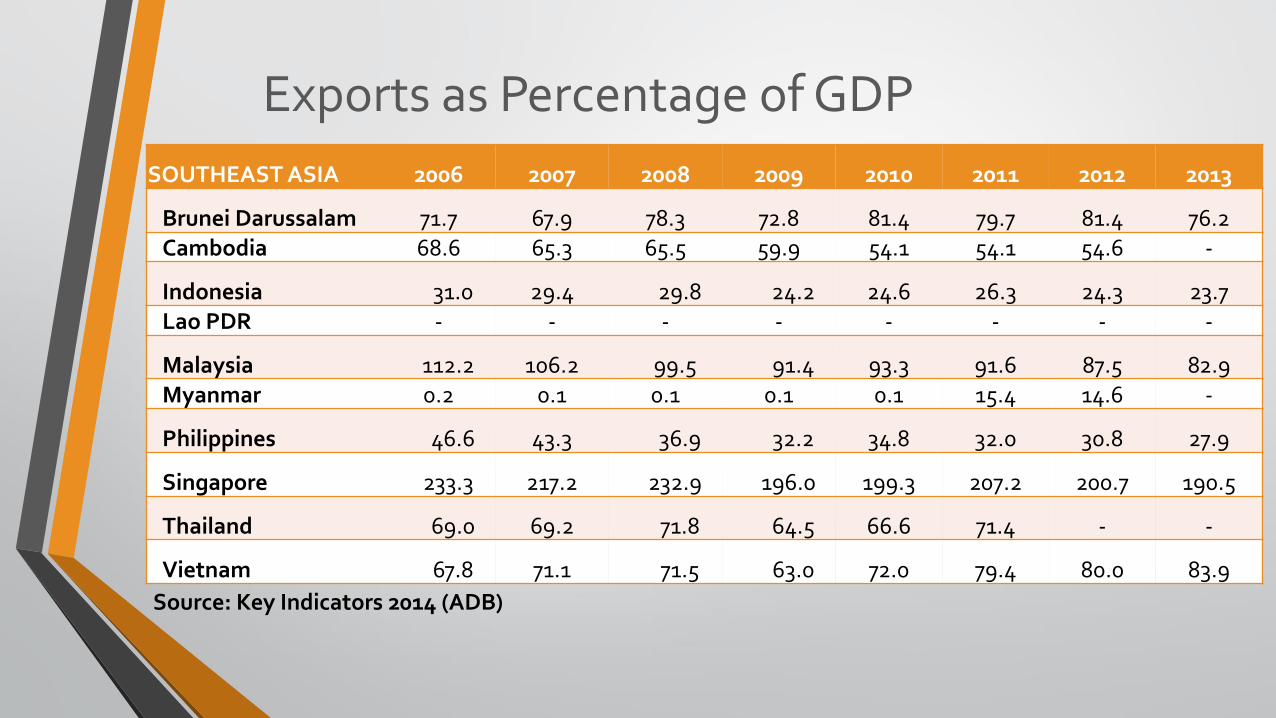
Exports as Percentage of GDP
Source: Key Indicators 2014 (ADB)
SOUTHEAST ASIA 2006 2007 2008 2009 2010 2011 2012 2013
Brunei Darussalam 71.7 67.9 78.3 72.8 81.4 79.7 81.4 76.2 Cambodia 68.6 65.3 65.5 59.9 54.1 54.1 54.6 -
Indonesia 31.0 29.4 29.8 24.2 24.6 26.3 24.3 23.7 Lao PDR - - - - - - - -
Malaysia 112.2 106.2 99.5 91.4 93.3 91.6 87.5 82.9 Myanmar 0.2 0.1 0.1 0.1 0.1 15.4 14.6 -
Philippines 46.6 43.3 36.9 32.2 34.8 32.0 30.8 27.9
Singapore 233.3 217.2 232.9 196.0 199.3 207.2 200.7 190.5
Thailand 69.0 69.2 71.8 64.5 66.6 71.4 - -
Vietnam 67.8 71.1 71.5 63.0 72.0 79.4 80.0 83.9
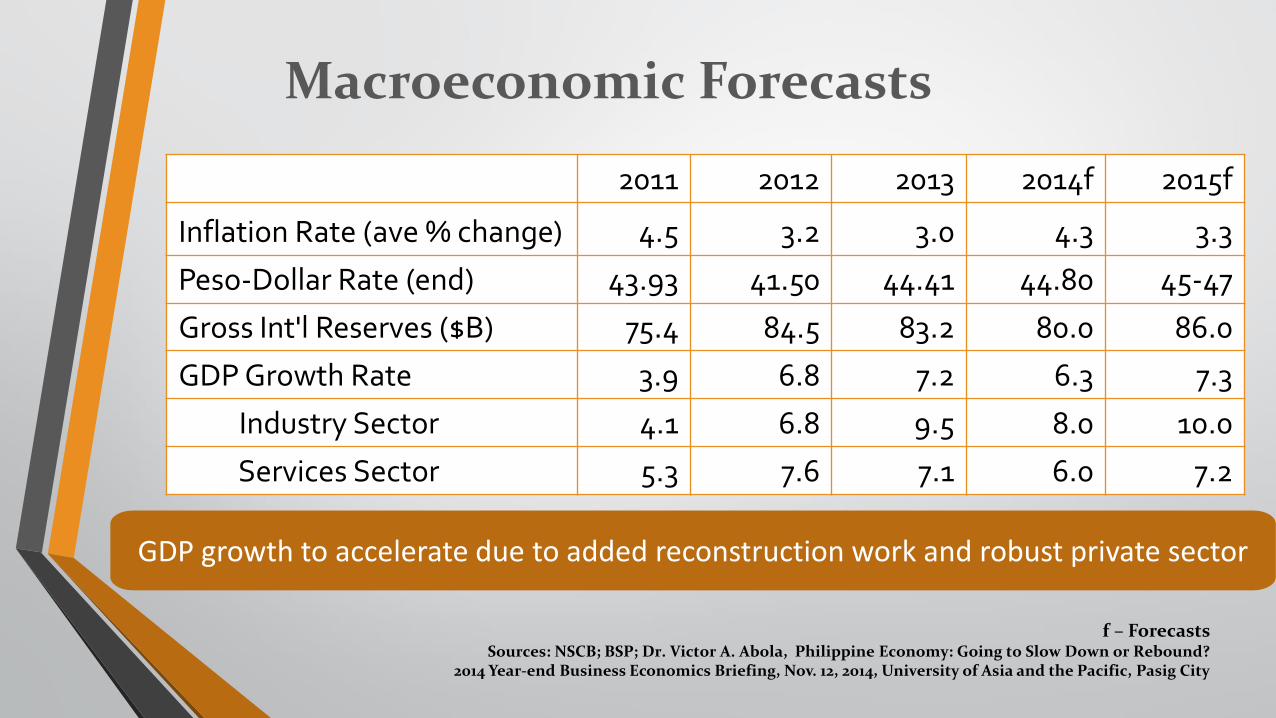
Macroeconomic Forecasts
2011 2012 2013 2014f 2015f
Inflation Rate (ave % change) 4.5 3.2 3.0 4.3 3.3
Peso-Dollar Rate (end) 43.93 41.50 44.41 44.80 45-47
Gross Int'l Reserves ($B) 75.4 84.5 83.2 80.0 86.0
GDP Growth Rate 3.9 6.8 7.2 6.3 7.3
Industry Sector 4.1 6.8 9.5 8.0 10.0
Services Sector 5.3 7.6 7.1 6.0 7.2
GDP growth to accelerate due to added reconstruction work and robust private sector
f – Forecasts Sources: NSCB; BSP; Dr. Victor A. Abola, Philippine Economy: Going to Slow Down or Rebound?
2014 Year-end Business Economics Briefing, Nov. 12, 2014, University of Asia and the Pacific, Pasig City

Financial Market Forecasts
2011 2012 2013 2014f 2015f
Inflation Rate (%) 4.7 3.4 3.0 4.3 3.3
Peso-Dollar Rate (P/US$)* 43.9 41.5* 44.4* 44.8* 44-47*
91 day T- bill rate (% p.a.)* 2.0* 1.5* 0.3* 1.3* 2.0*
10-year T-bond rate * (% p.a.)
5.1* 4.7* 3.3* 3.9* 4.4*
PSEi (Level / % change) 4,372 +4.1
5,500 +26.2
6,325 +16.0
7,100 +12.2
8,200 +15.5
*Year-end forecast
Investment environment to remain friendly with low interest rates
f – Forecasts Sources: NSCB; BSP; Dr. Victor A. Abola, Philippine Economy: Going to Slow Down or Rebound?
2014 Year-end Business Economics Briefing, Nov. 12, 2014, University of Asia and the Pacific, Pasig City
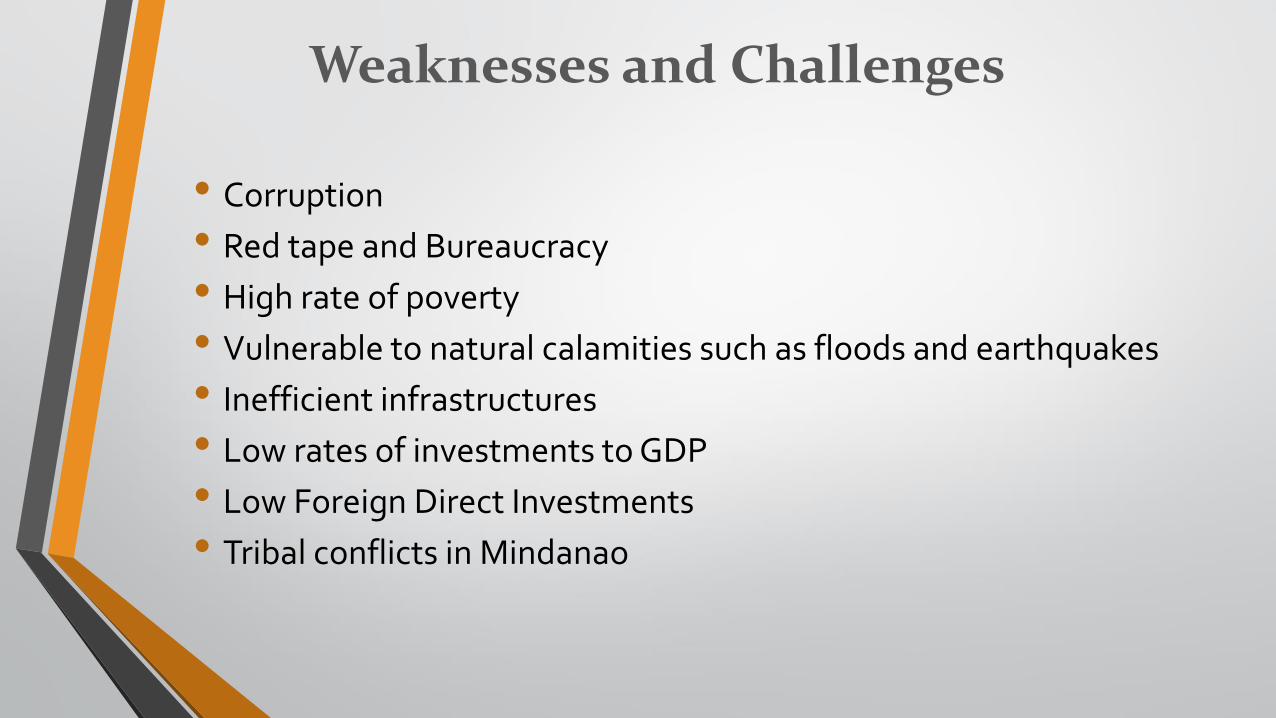
Weaknesses and Challenges
• Corruption
• Red tape and Bureaucracy
• High rate of poverty
• Vulnerable to natural calamities such as floods and earthquakes
• Inefficient infrastructures
• Low rates of investments to GDP
• Low Foreign Direct Investments
• Tribal conflicts in Mindanao
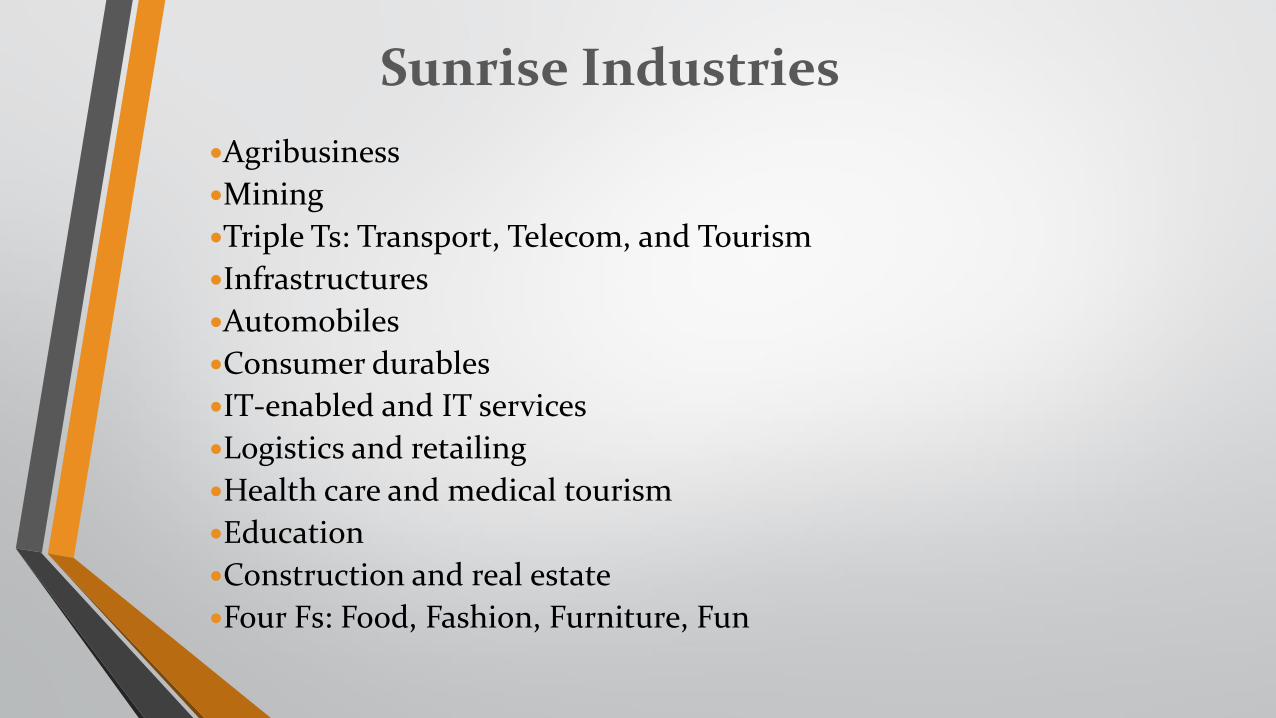
Sunrise Industries
Agribusiness
Mining
Triple Ts: Transport, Telecom, and Tourism
Infrastructures
Automobiles
Consumer durables
IT-enabled and IT services
Logistics and retailing
Health care and medical tourism
Education
Construction and real estate
Four Fs: Food, Fashion, Furniture, Fun
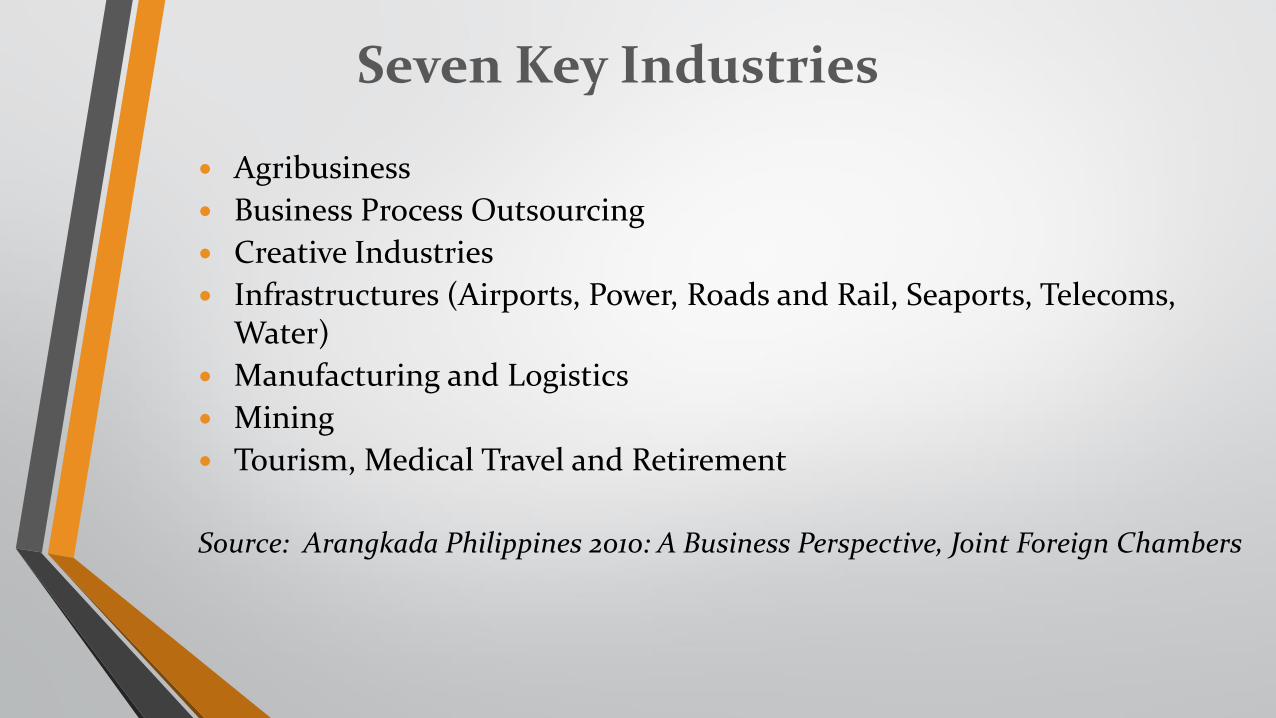
Agribusiness
Business Process Outsourcing
Creative Industries
Infrastructures (Airports, Power, Roads and Rail, Seaports, Telecoms, Water)
Manufacturing and Logistics
Mining
Tourism, Medical Travel and Retirement
Source: Arangkada Philippines 2010: A Business Perspective, Joint Foreign Chambers
Seven Key Industries
Thank you.
Dr. Bernardo M. Villegas
Ph.D. (Harvard)
University Professor, University of Asia and the Pacific
Manila, Philippines


