44
By Peter Shawn Taylor Why taxing food and drink won’t make Canadians thinner. But will make their governments much, much fatter.

By Peter Shawn Taylor
Why taxing food and drink won’t make Canadians thinner.
But will make their governments much, much fatter.

The Canadian Taxpayers Federation (CTF) is a federally incorporated, non-profit and non-partisan advocacy
organization dedicated to lower taxes, less waste and accountable government. The CTF was founded in 1990 when the Association of Saskatchewan Taxpayers and the Resolution One Association of Alberta joined forces to create a national taxpayers organization. Today, the CTF has more than 84,000 supporters from coast-to-coast.
The CTF maintains a federal office in Ottawa as well as provincial and regional offices in British Columbia, Alberta, the Prairies, Ontario and Atlantic Canada. Provincial and regional offices conduct research and advocacy activities specific to their provinces in addition to acting as local organizers of nation-wide initiatives.
CTF offices field hundreds of media interviews each month, hold press conferences, utilize social media like twitter, Facebook, YouTube and the CTF blog, as well as issuing regular news releases, commentaries and publications to advocate on behalf of CTF supporters. The CTF’s flagship publication, The Taxpayer magazine, is published four times a year. Action Update e-mails on current issues are sent to CTF supporters regularly. CTF offices also send out weekly Let’s Talk Taxes commentaries to more than 800 media outlets and personalities nationwide.
CTF representatives speak at functions, make presentations to government, meet with politicians and organize petition drives, events and campaigns to mobilize citizens to affect public policy change.
All CTF staff and board directors are prohibited from holding a membership in any political party. The CTF is independent of any institutional affiliations. Contributions to the CTF are not tax deductible.
Canadian Taxpayers Federation
1915-130 Albert Street Ottawa, ON K1P 5G4 Ph: (613) 234-6554
Website: www.taxpayer.com
About the CAnAdiAn
tAxpAyers FederAtion

About the AuthorPeter Shawn Taylor is editor-at-large of Maclean’s, where he writes the weekly editorial “From the Editors.” He’s also a regular columnist for the Waterloo Region Record and Canadian Business. After earning a Master’s degree in Economics from the University of Alberta in 1989, Peter served as senior analyst for the Alberta Liberal Caucus in the 1990s under leader Laurence Decore. Since then he has worked extensively in journalism, writing for publications including Alberta Report, National Post, The Globe and Mail, Winnipeg Free Press, Montreal Gazette, Reader’s Digest, Saturday Night, Equinox, Canadian Geographic and many others. Topics of interest include Canadian history, child care, transit and other areas of public policy. He lives in Waterloo, Ontario.
I

II

Executive Summary
Introduction
Part I: Canadian Context
Part II: Food Taxes in Practice (They don’t work)
Part III: Food Taxes are Unfair
Part IV: Food Taxes are Unpopular
Part V: Food Tax Leviathan
Conclusion
Appendix
1
3
7
13
21
25
29
35
37
tAbLe oF Contents
III


exeCutiVe suMMAry
exeCutiVe suMMAry Continued
CTF FIndIng: Obesity is a complex condition with multiple determinants including social, environmental and biological factors. Taxing particular foods or beverages in order to reduce obesity is a naive solution to a multifaceted problem. (See page 11)
CTF FIndIng: Claims that younger generations of Canadians will be doomed to a shorter lifespan than their parents due to rising rates of obesity are entirely unsupported by recent longevity data in Canada. (See page 5 and 21)
CTF FIndIng: Food and drink taxes are unfair to the 96% of Canadians who do not face an elevated risk of mortality associated with their weight. People considered overweight or slightly obese actually have a lower risk of death from all causes than people at their ‘ideal’ weight. Only 3.4% of Canada’s population is grade 2 obese or above, which is associated with a higher risk of mortality. (See page 3 and 18)
CTF FIndIng: With respect to soft drinks and other sugar-sweetened beverages, there is no scientific consensus tying soda consumption to weight gain. Numerous peer-reviewed studies in academic journals have found no link between these drinks and obesity. (See pages 13-20)
CTF FIndIng: Demand for soft drinks tends to be inelastic and poorly suited to control via taxes. For example, based on U.S. research the tax rate on soda necessary to achieve a weight reduction of 25 pounds in an average adult is approximately 1,200%, yielding a total per can cost of $9.75. (See pages 17-18 and Appendix)
CTF FIndIng: Substitution effects inevitably confound efforts to impose a diet via food or drink taxes. A study of U.S. adolescents revealed that an increase in soda taxes led to an overall increase in calories consumed, as teenagers drank less pop but substituted more milk and fruit juice. (See pages 18-20)
CTF FIndIng: New food or drink taxes would disproportionately and unfairly punish low-income Canadians. Because low-cost calorie-dense foods are an important component of a rational low-income diet, higher costs imposed by taxes will inevitably lead to a reduction in the overall food budget of poor Canadians. (See pages 21-23)
1

CTF FIndIng: Food and drink taxes are extremely unpopular. Despite claims from advocates that new taxes on ‘unhealthy foods’ find majority support, recent evidence proves otherwise. In the U.S., soda and candy taxes have consistently been rejected or struck down in votes across numerous states and cities. The world’s first fat tax in Denmark was withdrawn a year after its introduction when it proved to be deeply unpopular. (See pages 25-26)
CTF FIndIng: Polling in Canada reveals 65% of Canadians reject a role for governments in deciding what they should eat or drink. (See page 27)
CTF FIndIng: A soda tax of 5¢ per litre is estimated to raise $40 million per year in Quebec alone. This suggests a nation-wide tax at the same rate could raise $170 million. A penny-per-ounce tax on soft drinks, as has been promoted in the U.S. and Canada, could raise as much as $1.1 billion per year in Canada. (See page 30)
CTF FIndIng: Excise taxes, as proposed on food and drink in Canada, create an inevitable conflict between governments’ desire to raise revenues and the urge to constrain consumer behaviour. The history of tobacco taxes suggests governments seek to maintain a constant revenue stream in the face of declining consumption over time, leading to repeated increases in tax rates. It is reasonable to assume food and drink tax rate will follow a similar upward trajectory. (See pages 30-32)
CTF FIndIng: Taxing food and drink is far more complicated than most advocates admit. Denmark’s hugely unpopular fat tax took two years of consultations to create and nonetheless resulted in many bizarre or irreconcilable inconsistencies. Creating specific definitions for soft drinks, candy, fat and other ‘unhealthy’ items will inevitably require new and more intrusive bureaucracies, additional red tape and bigger, more expensive government. This creates new burdens for taxpayers and businesses.(See pages 26 and 32-33)
exeCutiVe suMMAry
2
Like a plump Sword of damocles, the threat of obesity
hangs heavy over Canada.
“Obesity could cut short a person’s life by two to five years − meaning that today’s children may be the first in history of North America to live shorter lives than their parents.” Ontario Medical Association. October 23, 2012.1
“Today’s youth may be the first generation of Canadians to have a shorter lifespan than their parents,” Glen Hodgson, senior vice-president and chief economist of the Canadian Chamber of Commerce. October 29, 2012.2
“This generation of children may be the first to have a shorter life expectancy than their parents,” Dr. David Butler-Jones, Chief Public Health Officer of Canada. 2008-09.3
“For the first time in recorded history, our younger generation is expected to live shorter lives than their parents due to obesity.” Alberta MP Rob Merrifield, chairperson of the House of Commons Standing Committee on Health, March 27, 2007. 4
introduCtion
It is widely repeated that the current generation of Canadian children will be the first in our country’s history to live shorter lives than their parents due to an epidemic of obesity. A third of all children in this country are reported to be either overweight or obese. More than half of all adult Canadians are said to be above their ideal weight.
It bears mention, however, that none of these dire predictions correspond to Canadian evidence on longevity. According to Statistics Canada’s latest projections, current life expectancy for a Canadian born in 2010 or 2011, regardless of sex, is 81.3 years: an improvement of 2.4 months over the previous year’s projection of 81.1. In fact life expectancy has grown at an average rate of 0.2 additional years per year for more than half a century. The average Canadian life span today is a decade longer than it was in 1961, when obesity was not a great public concern.5 6
This significant and unexplained gap between breathless predictions of an obesity epidemic and observed reality suggests claims from anti-obesity advocates deserve closer scrutiny.
1 Ontario Medical Association “Ontario Doctors Call for Urgent Action to Combat Obesity Epidemic” Press release October 23, 2012. Accessed at https://www.oma.org/Mediaroom/PressReleases/Pages/ActiontoCombatObesityEpidemic.aspx2 Hodgson, Glen “The battle against obesity begins at school,” in The Globe and Mail October 29, 2012. Page A11.3 Office of the Chief Public Health Officer of Canada. Report on Plans and Priorities 2008-2009. Accessed at http://www.tbs-sct.gc.ca/rpp/2008-2009/inst/ahs/ahs-eng.pdf4 House of Commons Health Committee press release “Health Committee Targets Childhood Obesity, March 27, 2007. Accessed at http://www.parl.gc.ca/HousePublications/Publication.aspx?DocId=2795313&Language=E&Mode=1&Parl=39&Ses=15 Statistics Canada “Mortality: Overview 2010 and 2011. Accessed at http://www.statcan.gc.ca/pub/91-209-x/2013001/article/11867-eng.pdf6 Statistics Canada “Deaths 2009” in The Daily May 31, 2012. Accessed at http://www.statcan.gc.ca/daily-quotidien/120531/dq120531e-eng.htm
3

introduCtion
MeAsurinG obesity, iMperFeCtLyThe international benchmark for judging weight and health is the Body Mass Index, calculated as a person’s weight in kilograms divided by their height in metres squared. The World Health Organization considers individuals with a BMI between 18.5 and 25 to be at a normal or ideal weight for their height. BMI between 25 and 30 is considered overweight. Over 30 is categorized as obese, with readings above 35 considered grade 2 obesity. A BMI below 18.5 is underweight.
However, BMI is a notoriously unreliable indicator of individual health because it fails to differentiate between muscle mass and fat; athletes and other obviously healthy individuals are frequently labeled as being overweight. NHL hockey superstar Sidney Crosby, NFL quarterback Tom Brady, former U.S. President George W. Bush and James Bond movie icon Daniel Craig are all are considered overweight according to their BMI scores. Well-muscled movie star Dwayne “the Rock” Johnson is considered obese. BMI data is clearly imperfect although it remains the basis for all policy discussions regarding population weights.
nAmE
Daniel Craig
Tom Brady
George W. Bush (circa 2006)
Sidney Crosby
Dwayne ‘The Rock’ Johnson
HEIgHT
5’10”
6’ 4”
5’ 11½”
5’11”
6’5”
WEIgHT
180 lbs
225 lbs
196 lbs
200 lbs
260 lbs
BmI
25.8 (Overweight)
27.4 (Overweight)
27.0 (Overweight)
27.9 (Overweight)
30.8 (Obese)
7 Lavie, Carl et al, “Body Composition and Heart Failure Prevalence and Prognosis: Getting to the Fat of the Matter in the “Obesity Paradox,” in Mayo Clinic Proceedings July 2011. Volume 85, Number 7. Accessed at http://www.ncbi.nlm.nih.gov/pmc/articles/PMC2894715/8 Olds, T. et al, 2011. “Evidence that the prevalence of childhood obesity is plateauing: data from nine countries.” International Journal of Pediatric Obesity. October 2011. Volume 6, Issue 5-6. Abstract viewable at http://www.ncbi.nlm.nih.gov/pubmed/21838570 9 Organization for Economic Co-operation and Development. “Obesity and the Economics of Prevention: Fit Not Fat. Key Facts − Canada Update 2012. Accessed at http://www.oecd.org/els/health-systems/49712071.pdf10 Statistics Canada. “Ranking and the number of deaths for the 10 leading causes of death, Canada 2000 and 2009.” Accessed at http://www.statcan.gc.ca/pub/84-215-x/2012001/table-tableau/tbl001-eng.htm
Sources: Craig: www.kinobody.com/workouts-and-exercises/daniel-craig-skyfall-workout/; Bush: www.nytimes.com/2006/08/02/washington/02bush-physical.html; Brady: http://www.patriots.com/team/roster/tom-brady/272d4f2c-1bb9-4372-b02c-dfa3fa60575b/; Crosby: http://penguins.nhl.com/club/player.htm?id=8471675; Johnson: www.wrestlescoop.com/news/the-rock/
Ample scientific evidence reveals that overweight and slightly obese individuals actually live longer lives than people at their ideal weight. (See sidebar - next page). The “obesity paradox” is another exhaustively-researched medical phenomenon that recognizes overweight and obese individuals experience higher survival rates after
being diagnosed with heart disease.7 National and global evidence suggests the growth rate in obesity may be slowing down.8 9 Finally, if an obesity epidemic is shortening the lives of Canadians, why have annual deaths caused by heart disease been falling significantly in Canada over the past decade?10
4
introduCtion
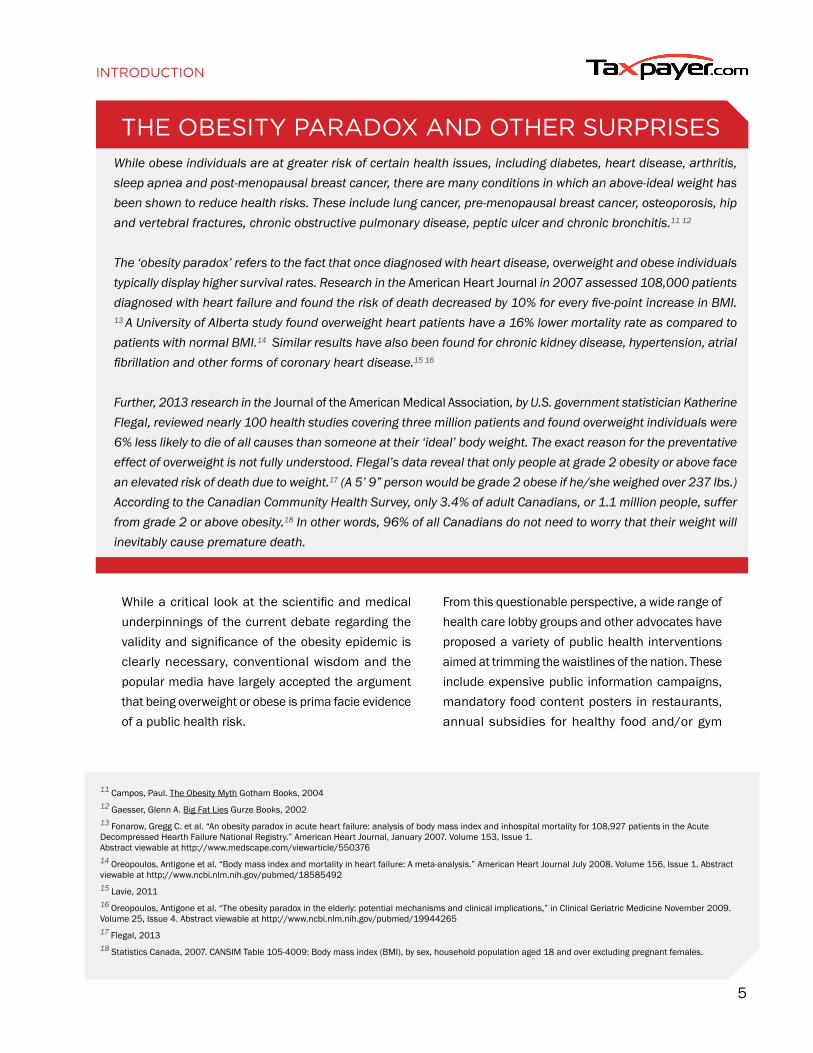
the obesity pArAdox And other surprisesWhile obese individuals are at greater risk of certain health issues, including diabetes, heart disease, arthritis, sleep apnea and post-menopausal breast cancer, there are many conditions in which an above-ideal weight has been shown to reduce health risks. These include lung cancer, pre-menopausal breast cancer, osteoporosis, hip and vertebral fractures, chronic obstructive pulmonary disease, peptic ulcer and chronic bronchitis.11 12
The ‘obesity paradox’ refers to the fact that once diagnosed with heart disease, overweight and obese individuals typically display higher survival rates. Research in the American Heart Journal in 2007 assessed 108,000 patients diagnosed with heart failure and found the risk of death decreased by 10% for every five-point increase in BMI. 13 A University of Alberta study found overweight heart patients have a 16% lower mortality rate as compared to patients with normal BMI.14 Similar results have also been found for chronic kidney disease, hypertension, atrial fibrillation and other forms of coronary heart disease.15 16
Further, 2013 research in the Journal of the American Medical Association, by U.S. government statistician Katherine Flegal, reviewed nearly 100 health studies covering three million patients and found overweight individuals were 6% less likely to die of all causes than someone at their ‘ideal’ body weight. The exact reason for the preventative effect of overweight is not fully understood. Flegal’s data reveal that only people at grade 2 obesity or above face an elevated risk of death due to weight.17 (A 5’ 9” person would be grade 2 obese if he/she weighed over 237 lbs.) According to the Canadian Community Health Survey, only 3.4% of adult Canadians, or 1.1 million people, suffer from grade 2 or above obesity.18 In other words, 96% of all Canadians do not need to worry that their weight will inevitably cause premature death.
11 Campos, Paul. The Obesity Myth Gotham Books, 200412 Gaesser, Glenn A. Big Fat Lies Gurze Books, 200213 Fonarow, Gregg C. et al. “An obesity paradox in acute heart failure: analysis of body mass index and inhospital mortality for 108,927 patients in the Acute Decompressed Hearth Failure National Registry.” American Heart Journal, January 2007. Volume 153, Issue 1. Abstract viewable at http://www.medscape.com/viewarticle/55037614 Oreopoulos, Antigone et al. “Body mass index and mortality in heart failure: A meta-analysis.” American Heart Journal July 2008. Volume 156, Issue 1. Abstract viewable at http://www.ncbi.nlm.nih.gov/pubmed/1858549215 Lavie, 201116 Oreopoulos, Antigone et al. “The obesity paradox in the elderly: potential mechanisms and clinical implications,” in Clinical Geriatric Medicine November 2009. Volume 25, Issue 4. Abstract viewable at http://www.ncbi.nlm.nih.gov/pubmed/19944265 17 Flegal, 201318 Statistics Canada, 2007. CANSIM Table 105-4009: Body mass index (BMI), by sex, household population aged 18 and over excluding pregnant females.
While a critical look at the scientific and medical underpinnings of the current debate regarding the validity and significance of the obesity epidemic is clearly necessary, conventional wisdom and the popular media have largely accepted the argument that being overweight or obese is prima facie evidence of a public health risk.
From this questionable perspective, a wide range of health care lobby groups and other advocates have proposed a variety of public health interventions aimed at trimming the waistlines of the nation. These include expensive public information campaigns, mandatory food content posters in restaurants, annual subsidies for healthy food and/or gym
5

memberships, warning labels on ‘unhealthy’ foods, outright bans on certain foods and zoning restrictions on the location of fast food outlets.
The most prominent and popular suggestion is a tax on ‘unhealthy food choices.’ Soda taxes, fat taxes and an assortment of other food levies are frequently demanded as a necessary and immediate solution to obesity. Creating a new range of food and drink taxes would artificially raise the price of these foods in order to reduce their popularity. The goal is thus to put all Canadians on a government-mandated, fiscal food diet. Inspiration for such a policy is drawn from government experience with tobacco taxes over several decades.
The purpose of this report is to consider the public policy implications of taxing food and drink on individual Canadians and the economy at large. The use of governments’ coercive power to change the prices of what we eat and drink represents a massive intrusion into personal choice and individual freedom. As one of the most powerful tools in any government’s arsenal, taxes ought to be used judiciously and with clear purpose and effect.
Ample and convincing evidence is presented, comprising both real world data from around the globe as well as peer-reviewed research in prestigious academic journals. The unmistakable conclusion is that food taxes consistently fail to achieve their stated objective of reducing obesity. The reasons for this failure are varied, ranging from an absence of a clear connection between any one particular food or drink and individual weight gain, deeply-held consumption preferences to confounding consumer behaviour.
Further, food and drink taxes pose significant costs to society at large. Less than 4% of Canadians face risk of an early death due to their weight. While this is a significant matter that deserves attention, it makes no sense to punish the other 96% of the population with anti-obesity programs or policies. Similarly, food or drink taxes disproportionately
and unfairly affect low-income Canadians, who will find their budgets severely constrained.
Food taxes also encourage larger and more intrusive government. Beyond intolerable bureaucratic diktat aimed at altering individual food choices, excise taxes also alter government behaviour in many other undesirable ways. Evidence from many decades of tobacco taxation reveals that excise tax rates face constant upward pressure in order to maintain government tax revenues in the face of declining consumption. A penny-per-ounce (30ml) soda tax could deliver as much as $1.1 billion annually to Canadian treasuries. And as excise taxes rise, so does underground illegal activity. Further, the complications of designing food and drink taxes will inevitably lead to more bureaucracy and red tape.
For all the above reasons, food and drink taxes have proven to be highly unpopular with voters around the world, despite claims to the contrary. When voters in Europe and the United States have been asked their opinion on food or drink taxes in referenda, ballot initiatives or through other political processes, they’ve inevitably rejected them. Canadians hold similar views.
Food taxes are an idea whose time has not come. And never will.
introduCtion
6
pArt i CAnAdiAn Context “Adult obesity rates in Canada reaching historic highs,” Toronto Star Feb 28, 2013.
“Experts working to fight obesity epidemic; 60% of adults overweight,” Regina Leader-Post July 13, 2013.
“Chubby Canadians tip scales into the world’s fattest zone,” The (Montreal) Gazette, Sept. 23, 2010.
Obesity has become a major public policy preoccupation in Canada and it is increasingly commonplace to refer to the expanding weight of the nation as an “epidemic.” However, evidence suggests growth rates for obesity have slowed.
A 2012 update on Canada from the Organization for Economic Co-operation and Development (OECD) concludes that “Obesity rates are high in Canada, relative to most OECD countries, but they have not increased substantially in the last 15 years.” [Emphasis added.] Similarly, recent evidence across developed countries reveals a plateauing in the prevalence of childhood overweight and obesity. 19 20
Apparent stability in obesity rates in Canada and other developed countries suggests individuals are already altering their diet or lifestyle in response to widespread concerns about weight. Despite this, however, demands that federal
and provincial governments take fiscal action against obesity have been gathering speed over the past decade. The 2002 Romanow Commission on the Future of Health Care received several submissions demanding the use of taxes to alter the Canadian diet. In particular, the lobby group Centre for Science in the Public Interest called for changes to the federal Goods and Services Tax (now the Harmonized Sales Tax in some provinces) to place new taxes on “nutrient-poor foods.”21 It termed such policies “food tax reform.”
Similarly, the former CEO of the Calgary Health Region, Jack Davis, suggested in 2005 a tax on junk food and soft drinks as the means to discourage unhealthy food choices. “We know there are negative health impacts if you eat certain foods. They should be taxed,” he told a local newspaper. 22
19 Olds, 201120 Olds, TS et al. “Trends in the prevalence of childhood overweight and obesity in Australia between 1985 and 2008.” International Journal of Obesity, January 2010. Volume 34, Issue 1. Abstract viewable at: http://www.ncbi.nlm.nih.gov/pubmed/19823187 21 Centre for Science in the Public Interest, 2002. “Submission of the Centre for Science in the Public Interest to the Commission on the Future of Health Care.” Accessed at http://www.cspinet.org/canada/pdf/romanow_submission.pdf22 Bell, Rick, 2005 “Taxes urged on ‘fat’ food: CHR boss wants to reward healthy living,” in Calgary Sun, Dec. 23, 2005.
7

In a 2007 pre-budget brief to the House of Commons Standing Committee on Finance, the Canadian Medical Association advocated a “tax on high-calorie, nutrient-poor foods” and subsidies for food deemed to be appropriately nutritious.23 To bolster its contention that “there is support among voters for such a tax,” the CMA’s only evidence was an unscientific survey from the (now defunct) Internet service eDiets.com that claimed 75% of respondents to its online diet site approved of the idea.
In 2012 the Ontario Medical Association attracted national attention in unveiling a wide-ranging package of “aggressive
new measures to help prevent thousands of premature deaths associated with obesity.” These included new taxes on junk food, retail information displays for high-sugar and high-fat foods, graphic warning label requirements modeled on cigarette packaging rules that would require pictures of diseased livers or similar grotesqueries on pizza boxes, juice cartons and other food containers (see sidebar), advertising restrictions on fatty foods and sugary foods and bans on selling such products in community recreation facilities.24
pArt i: CAnAdiAn Context
23 McMillan, Colin J. “Tax Incentives for Better Living: The Canadian Medical Association’s 2007 pre-budget consultation brief to the Standing Committee on Finance.” Canadian Medical Association, Aug. 15, 2007. Accessed at http://policybase.cma.ca/dbtw-wpd/Briefpdf/BR2007-08.pdf. 24 OMA, 2012
FeAr the juiCe: oMA reCoMMended wArninG LAbeLs
8

pArt i: CAnAdiAn Context
Source: Ontario Medical Association: https://www.oma.org/Resources/Documents/Pizza%20Obesity%20Warning.pdf
9

Among all food tax recommendations, the most frequently heard specific demand is a soda tax.
In 2011 the Chronic Disease Prevention Alliance of Canada, comprised of a wide variety of organizations including the Canadian Cancer Society, Dietitians of Canada, the Heart & Stroke Foundation of Canada, Canadian Diabetes Association and the YMCA, launched a national campaign for a stand-alone soda tax.25 “Strong evidence supports the association between the consumption of sugar-sweetened beverages and the development of childhood obesity,” the group’s position paper states. It further implicates such drinks in the incidence of diabetes, heart disease, stroke, arthritis and cancer. The Alliance defines sugar-sweetened beverages to include carbonated soft drinks, fruit punch, sports and energy drinks, sweetened tea and many brands of vitamin water.
The Alliance position paper claims the average Canadian consumes 73.2 litres of soft drinks per year and points to studies that link “the development of chronic diseases with overweight and obesity.” It further claims “the majority of Canadians agree that governments should add a tax to sugary drinks if the revenue from the tax is invested in the prevention of obesity.” The Alliance does not provide a specific tax rate suggestion.
In a January 2011 pre-budget submission to the Quebec government, the Coalition québécoise sur la problèmatique du poids (Coalition Poids) recommends “taxing soft and
energy drinks to prevent obesity.” In its lengthy policy brief, Coalition Poids argues that “the consumption of soft drinks doubled in Canada between 1971 and 2001.” Claiming that the consumption of soft drinks is a “probable factor” in obesity, the group calls for a 5¢ per litre tax on soft drinks and energy drinks.26
Such a tax would raise the price of a can of soda by 2.4¢, and a two-litre bottle of pop by 10¢. This represents a price increase of 3% to 5% for name-brand soda sold by the can or bottle. Cheaper off-brand, generic and bulk items would face a tax rate of 10% or more. This tax would generate $40 million in additional provincial revenue. Coalition Poids proposes that some of this money should be allocated to a province-wide school meal program.
The Alberta Coalition for Chronic Disease Prevention echoes the Quebec suggestion and also calls for a tax on sugar sweetened beverages “as a first step toward changing the price structure of food and beverages that currently promotes unhealthy choices.”27
All Canadian food and drink tax advocates mentioned above make explicit reference to the record of tobacco taxes in reducing cigarette consumption and promote taxes as an effective means to fight obesity as well. The implications of this link between anti-tobacco policy and food taxes will be explored in Part IV. First, however, a closer look at food taxes in theory and practice.
pArt i: CAnAdiAn Context
25 Chronic Disease Prevention Alliance of Canada. “Extra Sugar, Extra Calories, Extra Weight, More Chronic Disease: The Case for a Sugar-Sweetened Beverage Tax.” CDPAC Position Statement June 16, 2011. Accessed at http://www.childhoodobesityfoundation.ca/files/files/CDPAC_ssb_tax.pdf26 Coalition Poids “Creating Resources to Invest in our Future: Brief Pre-Budget Consultation 2011-2012,,” January 2011. Accessed at http://www.cqpp.qc.ca/documents/file/2011/Brief_Pre-Budget-Consultation_2011-2012.pdf27 Alberta Coalition for Chronic Disease Prevention “Taxing Sugar Sweetened Beverages: The Case for Public Health,” October 2011. Accessed at http://www.childhoodobesityfoundation.ca/files/files/policy_coalition_support_for_ssb_tax_2_.pdf
10

28 Public Health Agency of Canada “Obesity in Canada: Determinants and Contributing Factors.” Modified June 23, 2011. Accessed at http://www.phac-aspc.gc.ca/hp-ps/hl-mvs/oic-oac/
puttinG soMe theory behind Food tAxes
While weight gain can be defined in simple mathematical terms as an excess of calories consumed over calories expended, obesity is a complex condition governed by a myriad of behavioural, environmental and societal factors.28 As any dieter knows, it is possible for two individuals to eat similar foods and pursue similar exercise routines but experience very different weight profiles.
Proposals for new taxes on ‘unhealthy’ food or drink ignore the intricacies of obesity in favour of a simple storyline: people gain weight because they consume too much of a particular product. Does such a claim stand up to rigorous analysis?
If the stated goal of a particular food or drink tax is to alter consumer behaviour and produce weight loss, evaluation of this claim must be considered in the same careful manner as all public policy proposals. Three criteria present themselves:
First, there must be a clear and provable link between the item in question and weight gain. If the goal is to reduce the incidence of overweight and obesity, the item being taxed must demonstrate an obvious positive and significant connection to gaining weight. If this is not the case, then the tax is obviously ill-conceived.
Second, consumers should be sufficiently sensitive to price changes that a tax increase will lower demand in a significant way. To use economics terminology, demand for taxed items must be elastic. This means consumers will demand less of an item as its price rises. If, on the other hand, demand is inelastic, a tax will raise a lot of revenue for government but fail to change consumption in a noticeable way. (See Appendix 1)
Third, the tax must not lead consumers to make substitutions of equally unhealthy, but untaxed, food or drink for those items subject to tax. If a food or drink tax merely shifts consumption patterns such that the prevalence of overweight and obesity remains unchanged, then the tax must again be considered a failure.
pArt i: CAnAdiAn Context
11

12
pArt ii Food tAxes in prACtiCe(THEY DON’T WORK)
While the Canadian debate over food and drink taxes is still in the proposal stage, other jurisdictions have decades of real world experience.
The U.S. federal government first imposed a bottled soda tax in 1919 as a revenue measure. This was repealed in 1922. But beginning in the 1920s individual U.S. states also introduced soda, candy and snack food taxes as a means to raise funds in the same manner taxes are levied on other indulgences.29 Using evidence from U.S. soda taxes, as well as other food and drink taxes from around the world, it is possible to test the effects of food and drink taxes on consumer behaviour and obesity rates.
TAkIng A CLoSEr Look AT SodA TAxES
Due to their prevalence, ease of definition and reputation as purveyors of empty calories, soft drinks have become the most popular target for anti-obesity campaigners in Canada. In recognition of its role as a likely ‘first strike’ in any fiscal war against obesity, this section will largely focus on the effectiveness of taxes on soda and other sugar-sweetened beverages in reducing obesity rates.
Currently, 33 U.S. states impose some type of tax on soft drinks.30 This may take the form of a specific retail or excise tax, or as an exclusion from a sales tax exemption provided to other food items.31 Regardless of the mechanism, the typical U.S. soda tax varies from 1% to 7% of the retail price, with an average rate of approximately 5%.32 The 5¢ per litre soft drink and energy drink tax proposed by Coalition Poids for Canada is therefore within the range of existing U.S. soft drink taxes.
Canada has no specific federal or provincial taxes on soft drinks. Non-alcoholic sugar-sweetened beverages may or may not be taxable under HST and provincial sales tax regimes. For example, Ontario exempts all soft drinks from the provincial portion of the HST when sold together with a restaurant meal for less than $4.33 In Manitoba and Quebec, sugar-sweetened fruit punch containing at least 25% fruit juice is not taxable under provincial sales tax, whereas carbonated soda pop is taxable.34 35
29 Tax Foundation. “Special Report Overreaching on Obesity: Governments Consider New Taxes on Soda and Candy,” October 2011. Accessed at http://taxfoundation.org/article/overreaching-obesity-governments-consider-new-taxes-soda-and-candy 30 Andreyeva, Tatiana et al. “Estimating the potential of taxes on sugar-sweetened beverages to reduce consumption and generate revenue.” Preventive Medicine 2011, Volume 52. Accessed at http://www.yaleruddcenter.org/resources/upload/docs/what/economics/SSBTaxesPotential_PM_6.11.pdf31 Council of State Governments. “Capitol Facts & Figures: Soda Taxes,” June 2010. Accessed at http://www.csg.org/policy/documents/CR_FFSodaTax_000.pdf32 Andreyeva, 2011.33 Government of Ontario. “Prepare for Ontario’s HST: Point of Sale Rebate for Qualifying Prepared Food and Beverages $4.00 and Under,” May 2010. Accessed at http://www.fin.gov.on.ca/en/taxtips/hst/11.html34 Government of Manitoba. “Food and Beverages Information Bulletin No. 029, Revised February 2013.” Accessed at http://www.gov.mb.ca/finance/taxation/bulletins/029.pdf35 Revenu Quebec, 2013. “The QST and the GST/HST: How they apply to foods and beverages,” 2013 Accessed at http://www.revenuquebec.ca/en/sepf/publications/in/in-216.aspx
pArt ii: Food tAxes in prACtiCe
13

Saskatchewan exempts all restaurant meals, including soft drinks, from provincial tax.36
Recent interest worldwide in soda taxes can be traced to an influential 2009 article in the New England Journal of Medicine by Kelly Brownell, currently dean of the Sanford School of Public Policy at Duke University. Brownell advocates a penny-per-ounce excise tax on all soft drinks and other sugar-sweetened beverages, which would raise the price of a standard can of soda by 12¢, or approximately 20%.37 This would nearly quadruple the size of the current soda tax in most states.
An excise tax is preferred over a retail sales tax by Brownell because a sales tax is applied to the final sale price of an item and may encourage some consumers to choose cheaper brands of soda. In comparison, an excise tax is applied at the manufacturer level and thus constitutes a much higher percentage of the final price for low-cost brands, which discourages brand-switching. For example, a penny-per-ounce excise tax on a $1 two-litre carton of bargain brand lemonade would yield an effective 68% tax rate. The same tax on a higher-priced brand-name product would produce a much lower effective tax rate of 19%. A retail sales tax, by comparison, would be applied at a consistent rate across all brands. (See chart in Part III)
Brownell posits a direct link between all sugar-sweetened drinks and obesity. While acknowledging that a tax may cause some soda drinkers to increase consumption of other beverages, he expects this to affect only a small percentage of consumers. His calculations predict a 20% tax will reduce overall daily U.S. consumption of soft drinks by 20 calories per person. This is the equivalent of approximately two
pounds of individual weight loss per year. Brownell further calculates his tax would raise $14.9 billion per year for the federal U.S. government, explicitly referencing tobacco tax policies in this regard.38
Brownell’s arguments thus follow our three criteria for food tax evaluation:
• A clear and provable link between the food item and weight gain.
• Consumers are highly sensitive to price changes.
• A soda tax will not lead consumers to make large-scale
substitutions or changes to their diet.
How do these three claims stand up to real world experience and academic research?
do SoFT drInkS CAUSE oBESITy?
Despite the intuitive appeal of the notion that soft drinks cause obesity, there is a surprising absence of scientific consensus tying soda consumption to weight gain.
Brownell provides several academic references showing a link between the consumption of sugar-sweetened beverages and weight gain, particularly among children.39 However, he does not mention an equally large body of literature that finds no link whatsoever. These studies, published in a variety of reputable peer-reviewed sources, raise serious concerns about the reliability of claims that taxing soft drinks will lead to weight loss.
36 Ministry of Finance, Saskatchewan, 2002. “The Provincial Sales Tax Act: Information for Restaurants.” Revised May 2002. Accessed at http://www.finance.gov.sk.ca/revenue/pst/bulletins/PST-33%20Restaurants.pdf37 Brownell, Kelly et al. “The Public Health and Economic Benefits of Taxing Sugar-Sweetened Beverages. New England Journal of Medicine October 15, 2009. Volume 361, Issue 16. Accessed at http://www.nejm.org/doi/full/10.1056/NEJMhpr090572338 Brownell, 200939 Brownell, 2009
pArt ii: Food tAxes in prACtiCe
14

Cross border beVerAGe diFFerenCes
sodA ConsuMption Loses its FiZZ
While U.S. experience with soft drink taxes provides a rich source of evidence to evaluate Canadian proposals, there are significant differences in the drinking preferences of the two countries. Carbonated soft drinks are the most popular beverage category in America and constitute, by some calculations, up to 7% of all calories consumed.40 In Canada the most popular drinks are, in order, water, coffee and milk. Soda is not even a ‘top-three’ beverage.41 A 2004 survey by Statistics Canada found only 2.5% of total calories consumed by adult Canadians comes from soft drinks.42 As soda is a less-important source of calories in Canada, U.S. evidence will tend to overstate the potential impacts on Canadians arising from soda taxes.
Canadian soft drink consumption has dropped dramatically over the past decade and a half. Statistics Canada puts annual consumption of soft drinks at 64 litres per person in 2012, down 35% from a peak of 99 litres per person in 1998,43. Over this time, coffee, tea and bottled water consumption have all grown. If, as the Alliance, Coalition Poids and other soda tax lobby groups claim, obesity has been rising at an epidemic pace in Canada in recent years, the culpability of soft drinks seems highly dubious. This significant decline in soft drink consumption since 1998 should be considered further evidence that Canadians are capable to making informed choices about food and drink on their own without need for government intervention or taxation.
40 Fletcher, Jason et al. “Can Soft Drink Taxes Reduce Population Weight?” Contemporary Economic Policy, Jan. 2010, Volume 28 Issue 1. Accessed at http://medicine.yale.edu/labs/fletcher/www/fft.pdf41 Garriguet, Didier “Beverage Consumption of Canadian Adults,” Statistics Canada November 2008. Accessed at http://www.statcan.gc.ca/pub/82-003-x/2008004/article/6500821-eng.pdf42 Garriguet, Didier. “Overview of Canadians’ Eating Habits 2004. Statistics Canada.” Accessed at http://publications.gc.ca/Collection/Statcan/82-620-M/82-620-MIE2006002.pdf43 Statistics Canada, 2013. Table 002-0011 “Food Available in Canada” CANSIM.
Source: Statistics Canada, 2013 Table 002-0011 “Food Available in Canada,” CANSIM. Soft drinks (litres per person), adjusted for losses, waste and spoilage.
1993 87.06
1994 92.26
1995 92.82
1996 93.81
1997 95.54
1998 99.28
1999 98.98
2000 95.72
2001 96.08
2002 95.12
2003 93.48
2004 90.18
2005 87.2
2006 84.89
2007 76.37
2008 72.66
2009 71.31
2010 69.34
2011 67.41
2013 64.33
0
25
50
75
100
1993 1994 1995 1996 1997 1998 1999 2000 2001 2002 2003 2004 2005 2006 2007 2008 2009 2010 2011 2013
LITrES oF SodA ConSUmEd PEr PErSon In CAnAdA
pArt ii: Food tAxes in prACtiCe
1993 87.06
1994 92.26
1995 92.82
1996 93.81
1997 95.54
1998 99.28
1999 98.98
2000 95.72
2001 96.08
2002 95.12
2003 93.48
2004 90.18
2005 87.2
2006 84.89
2007 76.37
2008 72.66
2009 71.31
2010 69.34
2011 67.41
2013 64.33
0
25
50
75
100
1993 1994 1995 1996 1997 1998 1999 2000 2001 2002 2003 2004 2005 2006 2007 2008 2009 2010 2011 2013
15

The title of a 2007 article in the British medical journal Nutrition explicitly asks “Is sugar-sweetened beverage consumption associated with increased fatness in children?” The short answer: no. “There was no evidence of an association between sugar-sweetened beverage consumption at age 5 to 7 and fatness at age 9,” the report concludes.44
Research from Project EAT (Eating Among Teens) at the School of Public Health in the University of Minnesota and published in the American Journal of Clinical Nutrition in 2009 also set out to examine the role of soda and other beverages in adolescent obesity.45 It is interesting to note the goal of the study as stated by the researchers: “We hypothesized that sugar-sweetened beverages would be positively associated with weight gain.” The final results conclusively reject their original hypothesis. The study finds “no association between sugar-sweetened beverage consumption, juice consumption, and adolescent weight gain over a five-year period.”
Another study encompassing over 137,000 children from 34 countries, including Canada, funded in part by Health Canada and the Canadian Population Health Initiative and published by the International Association for the Study of Obesity looks at the relationship between healthy foods such as fruits and vegetables, unhealthy beverages such as soft drinks and overall weight gain.46 Again the expected link between soda and obesity is nowhere to be found.
“There were no consistent patterns and few significant findings for the relationships between fruit, vegetable and soft drink intake with overweight,” reports the study. What researchers did find was a significant relationship
between physical activity, television viewing and BMI scores. “With greater television-viewing there was a greater odds of overweight.” These findings suggest obesity-reduction public policy efforts are misplaced when focused on diet.
A large study of Canadian children published in 2012 finds “no consistent relationship between sweetened beverage patterns of intake and overweight and obesity” among four of five demographic categories examined (both sexes aged two-to-five, boys six-to-11, girls six-to-11, boys 12-to-18 and girls 12-to-18).47 Only boys aged six-to-11 who consumed large amounts of soft drinks showed an elevated risk of overweight and obesity.
Yet another Canadian study of Grade 5 students in Nova Scotia compares the availability of soft drinks in school cafeterias and finds no difference in the risk of weight gain between children who could drink soda at school and those who do not.48 However, “the association between obesity levels and frequency of physical education classes was striking,” the report states. Children in families that ate dinners together were also less likely to be overweight.
A 2004 article in the International Journal of Food Sciences and Nutrition using data from the U.S. National Health and Nutrition Examination Survey covering 1988 to 1994 finds that “consumption of regularly carbonated soft drinks and fruit drinks/ades − two beverages widely hypothesized to be positively associated with BMI − were not statistically significant in any of the models [for childhood weight gain].”49 The most significant variables are exercise programs, participation in team sports and television viewing.
44 Johnson, Laura et al. “Is sugar-sweetened beverage consumption associated with increased fatness in children?” Nutrition July/August 2007 Volume 23 Issue 7-8. Abstract viewable at http://www.ncbi.nlm.nih.gov/pubmed/1761634245 Vanselow, Michelle et al. “Adolescent beverage habits and changes in weight over time: findings from Project EAT.” American Journal of Clinical Nutrition December 2009. Volume 90 Issue 6. Abstract viewable at http://www.ncbi.nlm.nih.gov/pubmed/1986441246Janssen, I et al. “Comparison of overweight and obesity prevalence in school-aged youth from 34 countries and their relationships with physical activity and dietary patterns.” Obesity Reviews May 2005. Volume 6 Issue 2. Abstract viewable at http://www.ncbi.nlm.nih.gov/pubmed/15836463
47 Danyliw, Adrienne et al. “Beverage patterns among Canadian children and relationship to overweight and obesity.” Applied Physiology, Nutrition and Metabolism June 2012. Volume 37 Number 5 Accessed at http://www.nrcresearchpress.com/doi/pdf/10.1139/h2012-07448 Veugelers, Paul and Angela Fitzgerald “Prevalence of and risk factors for childhood overweight and obesity,” Canadian Medical Association Journal. Sept. 13, 2005. Volume 173 Issue 6. Accessed at http://www.cmaj.ca/content/173/6/607.full.pdf+html49 Forshee, Richard A. et al. “The role of beverage consumption, physical activity, sedentary behavior and demographics on body mass index of adolescents.” International Journal of Food Sciences and Nutrition 2004. Volume 55. Number 6. Abstract viewable at http://informahealthcare.com/doi/abs/10.1080/09637480400015729?journalCode=ijf
pArt ii: Food tAxes in prACtiCe
16

Finally, a 2009 Journal of the American Medical Association article titled “Nutritively Sweetened Beverage Consumption and Obesity: The need for solid evidence on a fluid issue” notes a troubling pattern of bias in many previous studies both for and against the case that soft drinks cause weight gain.50 Evidence cited by Brownell in support of his soda tax thesis is explicitly singled out as distorting and misleading.
Taken together, low and declining soda consumption in Canada, a lack of scientific consensus on any connection between soda consumption and weight gain and potential issues of data manipulation cause a soda tax to fail our proposed first criterion of a clear and unambiguous link with obesity.
IS SodA dEmAnd ELASTIC?
If the objective of a soda tax is to cause people to drink less of the beverage and lose weight as a result, demand for soft drinks must be highly sensitive to price changes. Economists describe the demand for such products as ‘elastic.’ Products that display high price elasticity include non-necessity or luxury items such as restaurant meals, fresh tomatoes, leisure travel and new cars.51 A small increase in the price of these items will typically result in a large drop in demand.
Products that have low price elasticity (also called ‘inelastic’ demand) are those items people cannot do without over the short term and/or for which there are no easy substitutes. Examples here include gasoline, natural gas, medical services and coffee.
According to Brownell’s own research, a 10% increase in the price of soda will decrease consumption by between
50 Allison, David and Richard Mattes. “Nutritively sweetened beverage consumption and obesity: The need for solid evidence on a fluid issue.” Journal of the American Medical Association. Jan. 21, 2010. Volume 301, Number 3. Accessed at http://www.ncbi.nlm.nih.gov/pmc/articles/PMC2864605/ 51 Anderson, Patrick L. et al. “Price Elasticity of Demand.” Mackinac Center for Public Policy, Nov. 13, 1997. Accessed at http://www.mackinac.org/article.aspx?ID=124752 Mytton, Oliver et al. “Could targeted food taxes improve health?” Journal of Epidemiology and Community Health August 2007. Volume 61, Number 8. Accessed at http://www.ncbi.nlm.nih.gov/pmc/articles/PMC2652984/53 Williams, Richard and Katelyn Christ. “Taxing Sins: Are Excise Taxes Efficient?” Mercatus on Policy Number 52, May 2009. Accessed at http://mercatus.org/sites/default/files/publication/RSP_MOP52_Taxing_Sins_web.pdf
8% and 10%. This is considered to be in the range of moderately inelastic. Other work puts the elasticity of carbonated sugar-sweetened beverages in a similar range. (See Appendix 1 for more technical detail.)
If soda demand is generally and moderately inelastic, the scope for using taxes to significantly change demand is limited. Small tax increases will not lead to a noticeable drop in consumption. This is why Brownell and other food tax advocates have taken to suggesting much larger taxes − in the range of 20% and above − to create perceptible changes in consumer behaviour. The need to greatly expand the size of recommended food taxes can be seen in similar arguments made in Britain advocating a 17.5% fat tax.52 The inelasticity of soft drinks and other foods is driving the move to much bigger recommended tax rates.
supersiZe thAt sodA tAx
Taxes necessary to effect real change may in fact be much larger than even 20%. To produce a weight loss of 25 pounds in a soda-drinking female of average build, the Mercatus Center at George Mason University calculated the required tax rate to be approximately 1,200%, yielding a total per can cost of soda of $9.75.53
pArt ii: Food tAxes in prACtiCe
17

Beyond the immediate effect of reducing soda purchases via new taxes, the issue of substitution effects must also be considered. If, as Brownell claims, a 10% increase in soda price causes an 8% to 10% reduction in soda consumption, the overall implications of this change must be considered. Will consumers simply forgo pricey drinks altogether? Will they grab tap water instead of a cola? Or will they choose to quench their thirst with other beverages equally high in calories? If the latter, then the soda tax may have no appreciable impact on net weight.
Brownell argues relatively few soda drinkers will switch to other high-calorie beverages. In this way, his soda tax will have a noticeable impact on total calories consumed. Given the long history of soda taxes in U.S. states, his proposition is relatively easy to test.
Several decades of evidence on existing soft drink taxes in the U.S. provides a rich data set on the efficacy of taxes in altering consumers’ beverage habits. Between 1990 and 2006, for example, 28 U.S. states altered their soft drink tax rates up or down. If soft drink consumption is linked to obesity, if demand is sufficiently elastic and if substitution effects are modest − then these changes in soda tax rates should have a noticeable impact on population weight of those states.
Research published in 2010 by Jason Fletcher of the School of Public Health at Yale and two co-authors reveals the impact of soda taxes is negligible to the point of irrelevance.54
According to observed data, a 1% increase in soda taxes produces a mere 0.003 point decrease in state-wide BMI over time, what the authors call “small in magnitude.” To engineer a mere one-point drop in public BMI would require a staggering 333% tax increase. Such a minuscule result is clearly a major disappointment for advocates of a soda tax.
Further research by the same academic team looked specifically at youth beverage consumption patterns and found even less foundation for imposing soda taxes.55 Using many years of data from the National Health Examination and Nutrition Survey covering thousands of children annually, the researchers found a 1% increase in soda tax yielded a decline in soda consumption of approximately six calories daily. However, this reduction was met with other confounding changes in consumer behaviour. As soda consumption fell by six calories, the study found whole milk consumption rose by eight calories per day. There was “suggestive evidence” that fruit juice consumption also increased.
“The results show that there is no statistically significant impact of the soft drink tax rate on total calories,” Fletcher and his co-authors conclude. “It is not likely an increase in soft drink taxes would decrease obesity... any reduction in soft drink consumption has been offset by the consumption of other calories.”
54 Fletcher, 2010 55 Fletcher, Jason M. et al. “The effects of soft drink taxes on child and adolescent consumption and weight outcomes.” Journal of Public Economics September 2010. Volume 94 (2010) Accessed at http://medicine.yale.edu/labs/fletcher/www/soda.pdf
pArt ii: Food tAxes in prACtiCe
18

56 Zhen, Chen et al. “Predicting the Effects of Sugar-Sweetened Beverage Taxes on Food and Beverage Demand in a Large Demand System,” American Journal of Agricultural Economics. Published online July 2013. Accessed at http://ajae.oxfordjournals.org/content/early/2013/07/28/ajae.aat049.full.pdf+html57 Kuchler, Fred et al. “Taxing Snack Foods: Manipulating Diet Quality or Financing Information Programs?” Review of Agricultural Economics Spring 2005 Volume 27, Number 1. Abstract viewable at http://www.jstor.org/discover/10.2307/3700775?uid=3739448&uid=2&uid=3737720&uid=4&sid=21102537749373
Not only does a soda tax fail to produce a meaningful drop in soda consumption, it actually produces slightly higher overall calorie intake (and higher fat consumption) due to substitution effects as children consume other drinks equally or higher in calories. If the public health concern is weight gain, it is total calories consumed that matter; it should make no difference whether those calories come from soda or milk.
doubLe-doubLe troubLe
Given sizable differences in Canadian and American beverage preferences as well as research into substitution effects among consumers, it seems reasonable to assume a Canadian soda tax would lead to greater coffee consumption. Is this a good thing? A medium Tim Hortons double-double coffee, for example, contains more calories and fat than a can of regular cola. However, a take-out sugar-and-fat-laden coffee would escape tax under even the broadest sugar sweetened beverage tax proposal. From this example, taxing soda could be reasonably expected to lead to weight gain, rather than weight loss.
Regular cola (12 oz) 160 Calories, 0 Grams of Fat
Medium Tim Hortons Double-Double (14oz)
210 Calories, 12 Grams of Fat
Further evidence on the inability of soft drink taxes to alter the weight of a nation comes from recent research using current data on shopping patterns published in the American Journal of Agricultural Economics.56 Researchers found a 0.5¢ per ounce tax on sugar-sweetened beverages would slightly lower soft drink consumption. However, the consumption of fat and salty snacks is predicted to rise simultaneously as consumers sought satisfaction from untaxed comestibles. The long term impact on weight loss for an individual was calculated at between 0.7 pound and 1.5 pounds over 10 years − another minuscule result. In a press release announcing his results, lead author Chen Zhen explains that: “Instituting a sugary beverage tax may be an appealing public policy option to curb obesity, but it’s not as easy to use taxes to curb obesity as it is with smoking. Consumers can simply substitute an untaxed high calorie food for a taxed one.”
Such confounding results are not just associated with soda taxes, but all types of junk food and fat taxes.
A U.S. Department of Agriculture study looking at taxes on salty snacks such as potato chips, Cheezies, popcorn and corn chips found demand for these products to be substantially more inelastic than soda. As a result, even a large tax of 20% has no appreciable impact on demand. “Price changes do not appear to induce major changes in consumers’ salty snack choices,” the researchers conclude.57
pArt ii: Food tAxes in prACtiCe
19

Other U.S. research shows that a 5.5% snack tax on crackers, cookies, cakes, frozen yogurt treats, marshmallows and roasted nuts in Maine was irrelevant to state-wide BMI statistics.58 And an experiment in Australia published in 2011 finds that children fed low-fat dairy products in place of regular fat milk, cheese, yogurt and ice cream lost no weight as the subjects compensated for the reduction with additional calories from other non-dairy sources.59
While soft drinks and snack foods may be a convenient target for anti-obesity advocates because they are simple to tax and easily demonized, there’s no evidence either product is directly implicated in obesity among children or adults. Further, evidence reveals consumers of all ages display a strong desire to maintain total calories consumed for a variety of behavioural, societal and biological reasons − irrespective of tax policies. Finally, there is considerable evidence, generally ignored by food tax advocates, suggesting the most effective solution to weight gain is greater focus on exercise and physical activity rather than calories consumed.
58 Oaks, Brion. “An evaluation of the snack tax on the obesity rate of Maine,” Masters of Public Administration applied research project. Texas State University. Fall 2005. Accessed at: https://digital.library.txstate.edu/bitstream/handle/10877/3670/fulltext.pdf59 Hendrie, Gilly and Rebecca Golley. “Changing from regular-fat to low-fat diary foods reduces saturated fat intake but not energy intake in 4-13-year-old children,” American Journal of Clinical Nutrition. May 2011. Volume 93, Number 5 Accessed at http://ajcn.nutrition.org/content/93/5/1117.long
pArt ii: Food tAxes in prACtiCe
20

pArt iii: Food tAxes Are unFAir
pArt iii Food tAxes Are unFAir
Beyond the fact food taxes do not work, they also violate the basic tenets of economic and social fairness.
Food TAxES PUnISH THE HEALTHy
The stated goal of most food and drink tax proposals is to lower the collective body weight of the populace. However, this is clearly unfair to individuals who are not overweight or obese. Many people can enjoy an indulgence of soda or candy without any risk of gaining weight. Why should they have to pay more for their food?
Further, some products taxed under a sugar-sweetened beverage tax are explicitly designed for athletes or fit individuals and can be considered a necessary component of a rigorous workout routine. Under most soda tax proposals for example, sports drinks that contain added sugar are taxed at the same rate as regular soda and fruit punches. People engaged in precisely the sort of activity that lowers body weight and promotes overall healthfulness should not be taxed as if they are contributing to the opposite outcome.
And due to the blunt aspects of food and drink taxes, the vast majority of people forced to pay a soda or fat tax will be perfectly healthy individuals. Recall the research of U.S. government statistician Katherine Flegal that reveals only
individuals at grade 2 obesity or higher face an elevated risk of mortality due to their weight (See side bar page 5). With just 3.4% of Canada’s population considered grade 2 obese or above, any national food or drink tax would be entirely unfair to the other 96% of all Canadians.
Food TAxES HUrT THE Poor
Policies that raise the price of foods cause different effects on different income groups. Because food, as well as other necessities, constitute a greater percentage of overall expenditures for low-income families as compared to high-income families, food taxes are unfairly regressive.
“Fat Taxes: Big Money for Small Change,” published in Forum for Health Economics & Policy in 2007 provides a detailed breakdown of the distributional implications of a fat tax on food.60 Using U.S. supermarket scanner data, researchers study a proposed 10% tax on the fat content of dairy products including milk, cheese and yogurt. They find such a tax produces a mere 1% decline in consumption. The authors also examine the implications of such a tax by income level and age.
60 Chouinard, Hayley et al. “Fat Taxes: Big Money for Small Change,” Forum for Health Economics & Policy 2007. Volume 10, Issue 2. Accessed at http://faculty.ses.wsu.edu/LaFrance/reprints/CDLP-BEP-2007.pdf
21

As demand for dairy products is generally inelastic, a fat tax causes significant budgetary problems for lower income families. “This tax is extremely regressive,” the authors conclude. “Almost the entire burden of the fat tax falls on poor families.” For families below $20,000 annual income, the average additional cost arising from the increase in dairy products is estimated at $47 per year, since dairy products constitute an important source of fat in their daily diet. Families with an income over $100,000 per year suffer a burden, or welfare loss, of only $24 from the tax − half that experienced by poorer families. A similar result holds for senior citizens. “Families in their sixties suffer roughly twice the welfare loss of families whose heads of household are in their twenties.”
The same phenomenon is observable for soft drink taxes. A simulation study in the American Journal of Agricultural Economics found a 0.5¢ per ounce tax on sugar-sweetened beverages would hit low-income households harder than high-income households, in both proportionate and absolute terms. Total taxes paid would be higher among the poor, who tend to consume a greater volume of soft drinks than rich households. Further, the tax burden on low-income households from a small soda tax was estimated at 0.1%, whereas for high-income households it was mere 0.03%. “A sugar-sweetened beverage tax would indeed be regressive in nature,” it concludes.
Low-income families frequently and rationally choose cheap, high-calorie food as their best nutrition option. The highly-competitive fast food industry may promote soft drinks and food high in fat, but it also offers customers the most calories for their dollar and thus represents an important, cost-effective component of a low-income diet.61 62 Taxes on these foods needlessly make life more difficult and less healthy for low-income families, as a recent paper from the Stanford Center on Poverty and Inequality observes:63
“When faced with a limited budget, low-income families typically opt for cheaper, high-calorie, low-quality foodstuffs over relatively more expensive, healthful fresh products. By increasing the cost of each item, a sales tax may therefore lead some low-income families to consume less nutritious food in an effort to stretch their budget.”
The importance of fast food in the diet of low-income individuals is often lost on those groups claiming to advocate for the poor. In 2007, for example, the Calgary Committee to End Homelessness proposed a tax on all restaurant meals, with the money raised dedicated to building affordable housing.64 Ironically, such a tax would have inevitably hit the poor hardest; in essence, they would be asked to pay for their own housing out of their own meagre food budgets. The proposal was thankfully never adopted.
61 Eisenberg, 2011.62 Drewnowski, Adam. “Obesity, diets and social inequality,” Nutrition Reviews May 2009. Volume 67, Issue Supplement S1. Accessed at http://onlinelibrary.wiley.com/doi/10.1111/j.1753-4887.2009.00157.x/full63 Newman, Katherine and Rourke O’Brien.”Taxing the Poor: How some states make poverty worse,” Pathways Summer 2011. Stanford University. Accessed at http://www.stanford.edu/group/scspi/_media/pdf/pathways/summer_2011/PathwaysSummer11_NewmanOBrien.pdf64 Cryderman, Kelly. “Tax on meals urged to help homeless. The Calgary Herald, Aug. 9, 2007. Accessed at http://www.canada.com/story_print.html?id=080de31d-99fc-476c-914b-d2437ac29746&sponsor=
pArt ii: Food tAxes Are unFAir
22

Other confounding results arise when governments attempt to control food choices through fiscal policies. Consider the broader implications of a tax on restaurant meals. While a tax can be expected to reduce the amount of food consumed away from home, it will also lower a household’s overall food budget and may change the mix of food eaten at home as well. The surprising interplay of these two forces, according to research in the Journal of Health Economics, produces a less-healthy diet and overall weight gain: “A 10% tax on food away from home would increase the body weight of an average male by 0.196%.”65 Note that this effect is greater than the weight loss predicted by a 20% increase in the cost of soda. A food tax would not only punish low-income consumers by raising the cost of their food, but could (ironically) also cause them to gain weight.
65 Schroeter, Christiane et al. “Determining the impact of food price and income changes on body weight.” Journal of Health Economics January 2008 Volume 27, Issue 1. Abstract viewable at http://www.sciencedirect.com/science/article/pii/S0167629607000355
Finally, Brownell and others argue for an excise tax on pop instead of a retail sales tax in order to prevent consumers from switching to lower-cost generic or store brands. As Table 1 illustrates, excise taxes impose effective tax rates on bargain or store brand beverages that are many times greater than the effective tax rate on higher-priced name-brand products. Raising the price of bargain-priced food and drink products inevitably increases the burden on the poor. The effective tax rate on bargain brands arising from a penny-per-ounce excise tax is as high as 70%, compared to a low of 19% for premium brands. Again, the evidence reveals a disturbing regressive component to food and drink taxes.
ProdUCT
1.75 litre premium brandSimply lemonade2 litre bargain brand Neilson’s lemonade2 litre bottle Sprite2 litre bottle Great Value lemon-lime soda12 cansCanada Dry ginger ale12 cansGreat Value ginger ale
PrE-TAx PrICE
$3.00
$1.00
$1.87
$0.97
$4.97
$3.97
PEnny PEr oUnCE TAx
$0.59
$0.68
$0.68
$0.68
$1.44
$1.44
AFTEr TAx PrICE
% InCrEASE
$3.59
$1.68
$2.55
$1.65
$6.39
$4.43
19%
68%
36%
70%
29%
48%
TABLE 1: ExCISE TAxES PUnISH BArgAIn HUnTErS WITH
HIgHEr EFFECTIVE TAx rATES on CHEAPEr BrAndS
Prices retrieved from Walmart.ca and in-store surveys October 2013. Data assume pre-tax prices remain constant after the imposition of an excise tax.
pArt iii: Food tAxes Are unFAir
23

24

pArt iV Food tAxes Are unpopuLAr
Medical groups and other advocates of food and drink taxes often justify their demands on the basis of the alleged impact obesity can have on Canada’s taxpayer-funded health care system. According to economist Peter Kennedy of the University of Victoria, a supporter of a food tax, “Dietary choices affect health outcomes, and the taxpayer-financed nature of our health care system therefore makes personal dietary choices a matter of public concern.”66 In other words, what you eat is not your business, but everyone else’s.
If this is the case, however, there’s little in the way of evidence to support it. In fact there’s ample evidence to the contrary: individuals everywhere appear to actively dispute the need to tax their food and drink for personal or public reasons.
In the U.S., where soda and sugar taxes have a much longer history, the voting public has repeatedly voted to remove old taxes and prevent new ones. Despite the best efforts of doctors and other advocates, people do not accept the need to tax themselves thinner.
Brownell’s much-referenced 2009 article promoting a penny-per-ounce soda tax cites three polls in 2001, 2003 and 2004 that supposedly show increasing support for his
concept. However, recent U.S. voting records suggest an entirely different trend.67
In 2008 voters in Maine repealed an excise tax on soda and other beverages, with 64% voting to remove the tax.68 At 42¢ per gallon, the Maine tax was one-third the size of Brownell’s penny-per-ounce concept. And in 2010 a Washington State ballot initiative overturned a soda tax of 2¢ per 12 ounce can by a 65% vote.69 Such a tax is one-sixth that recommended by Brownell.
Again, in November 2012 residents of two small California cities with severe budget constraints, Richmond and El Monte, put a Brownell-style penny-per-ounce soda tax on their municipal ballots. Richmond voters voted 67% against. El Monte voted 77% against.70 Other cities that have failed to pass soda tax proposals include Anchorage, Philadelphia, Pittsburgh and Washington, D.C.71
Brownell further points to a 2008 New York State poll showing 52% support for a soda tax, rising to 72% if the revenue is used to support programs for obesity prevention. Yet even this sort of specific ear-mark proposal has proven to be deeply unpopular in the real world.
66 Kennedy, Peter, 2006. “Junk Food Tax a Move in the Right Direction,” University of Victoria website. Accessed at http://web.uvic.ca/~lwelling/econ%20203/kennedyjunktax.pdf67 Brownell, 200968 Curtis, Abigail. “Beverage tax repeal effort succeeds,” Bangor Daily News, Nov. 5, 200869 Garber, Andrew, “Voters reject state income tax, candy-soda tax,” Seattle Times, Nov. 2, 2010. Accessed at http://seattletimes.com/html/localnews/2013329508_elextaxinits03m.html70 Allen, Sam. “Soda taxes lose big in California,” Los Angeles Times. Nov. 7, 2012. Accessed at http://latimesblogs.latimes.com/lanow/2012/11/soda-taxes-lose-big-in-california.html71 Council of State Governments, 2010 72 Brownell, 2009
25

In 2008 Democratic New York Governor David Patterson proposed an 18% “obesity tax” on soft drinks with the funds dedicated, in part, to fighting obesity. In 2009 he was forced to withdraw the idea in the face of massive public and political protest. He attempted to re-introduce it again in 2010 as a penny-per-ounce tax identical to Brownell’s proposal.73 Patterson again failed to win over New Yorkers or the legislature, and found himself opposed by both Republicans and Democrats.74
By far the most compelling international evidence on the myriad problems and unintended consequences of food taxes comes from Denmark. In 2011 this small European country made history with its fedtafgiften, a tax of 16 kroner ($3 CDN) per kg of fat for all food with over 2.3% fat content. While Denmark holds the dubious title of the world’s most heavily taxed country, the fat tax proved to be deeply unpopular.75
Denmark’s fat tax displayed all the confounding complexities of other food and drink tax proposals. Demand for dairy, meat and other food items with high fat content was sufficiently inelastic that overall fat consumption was reduced by a much smaller percentage than the tax rate itself. What did change in significant fashion was where Danes shopped. Cross-border shopping into Germany skyrocketed following the imposition of the tax as Danes demonstrated their preference for lower-priced meats, butter and other products. Border stores in Germany proudly sent flyers into parts of Denmark, translated into Danish, boasting “Come shop here. No fat tax applied.”76 According to a poll by the Danish
Chamber of Commerce, before the tax one in three Danes regularly shopped in Germany. After the tax this rose to one in two. Job losses in the retail sector during the first year of the tax were estimated at 1,200.
It was also administratively complex. The tax took almost two years to design because of difficulties in deciding how to measure the fat content of various products. Many final decisions appeared entirely arbitrary. Nuts were exempt from the tax because of their apparently healthy image, whereas products packed in oil, such as sundried tomatoes or jalapeno peppers, were taxed as if purchasers intended to drink all the oil.77 Producers also had to pay tax on the oiled paper used to separate layers of dried fruit in containers.
After a little over a year, the Danish government announced the repeal of the fat tax due to extreme public discontent. The first country in the world to implement a fat tax became the first country to eliminate it as well. A plan for a future tax increase on the sugar content in food was also scrapped. “The fat tax is one of the most maligned we [have] had in a long time,” the Danish minister for food, agriculture and fisheries explained at the time.78 In making the official repeal announcement, the Danish Department of Taxation also admitted taxes on fat and sugar weighed more heavily on lower income budgets and that their removal would improve social equity.79 That a country as inured to high taxes as Denmark would rebel against the fat tax should be seen as convincing evidence of the lack of public support for the idea world-wide.
73 Berger, Joseph. “New Strategy for Soda Tax Gives Diet Drinkers a Break,” New York Times, May 19, 2010. Accessed at http://www.nytimes.com/2010/05/20/nyregio an/20sodatax.html74 Blain, Glenn. “Gov. Patterson’s sugared-soda tax is going flat fast in Albany.” New York Daily News, May 20, 2010. Accessed at http://www.nydailynews.com/news/gov-paterson-sugared-soda-tax-flat-fast-albany-article-1.44838475 Bomsdorf, Clemens. “Denmark Scraps Much-Maligned ‘Fat Tax” After a Year.” Wall Street Journal, Nov. 11, 2012. 76 Blaze Carlson, Kathryn. “Fat taxes like ‘shooting rabbits with nuclear weapons,’ Denmark warns,” National Post, February 21, 2013. Accessed at: http://news.nationalpost.com/2013/02/21/fat-taxes-like-shooting-rabbits-with-nuclear-weapons-denmark-warns/ 77 Taylor, Peter Shawn. “You can’t tax yourself thin.” Canadian Business, April 1, 2013. Accessed at http://www.canadianbusiness.com/economy/you-cant-tax-yourself-thin/78 Strom, Stephanie. “’Fat Tax’ in Denmark is Repealed After Criticism,” New York Times, Nov. 12, 2012. 79 Taxation Department, Government of Denmark. “Lavere afgifter for forbrugere,” (Lower taxes for consumers), Nov. 10, 2012. Translated via Google Translate. Accessed at http://www.skm.dk/public/dokumenter/presse/Faktaark_afgiftsogkonkurrencepakke.pdf
pArt iV: Food tAxes Are unpopuLAr
26

whAt do CAnAdiAns thinK?
In an exclusive nationwide poll for the Canadian Taxpayers Federation by Harris/Decima, more than 1,000 representative adults were asked their opinions on government food taxes. A clear majority – 62% − said they did not trust government to determine which foods should be taxed. An even greater percentage said they did not believe it was the proper role of government “to tax some foods and not others.” According to 65% of respondents, it should be left up to individuals and parents to decide what to eat and not what to eat. A mere 28% of Canadians accepted a role for government in making menu choices via the tax system. Seven percent had no opinion or were unsure. This should be seen as further convincing evidence of the unpopularity of food taxes as government policy.
pArt iV: Food tAxes Are unpopuLAr
28%
7%
65%BELIEVE THAT IT
SHoULd BE LEFT To
IndIVIdUALS And
PArEnTS To dECIdE
WHAT Food IS EATEn
ACCEPT A roLE For
goVErnmEnT In mAkIng
mEnU CHoICES VIA THE
TAx SySTEm
UnSUrE/no oPInIon
27

28

pArt V: Food tAx LeViAthAn
As part of his much-publicized fight against obesity, in 2012 New York City Mayor Michael Bloomberg announced a ban on the sale of soft drinks larger than 16 ounces. The “portion cap” rule, imposed by the city’s Board of Health, was intended to prevent New Yorkers from drinking too much soda. As opponents pointed out, however, the regulation itself was poorly conceived, arbitrary, unfair and unlikely to have any impact on weight gain or loss.
Most significantly, the cap did not apply to all drink vendors − grocery stores were exempt because they did not fall under the jurisdiction of the Board of Health. While it was popularly called a ‘Big Gulp ban’ in fact 7-Eleven convenience stores, which sell the Big Gulp, would not have been affected by the rule either. The ban did not prevent refills. And it did not apply to other drinks that could contain more calories and fat, such as coffee or energy drinks. Plus, as previously discussed, there’s a surfeit of scientific evidence showing soft drinks do not contribute to overall levels of obesity.
The court system eventually ruled against the ban. New York State Supreme Court Judge Milton Tingling’s ruling on the portion cap rule focused not on the practicality of the proposal, but rather on its legitimacy. Did the city public health department have the authority to impose regulations of this kind on the citizenry? Tingling struck down the portion
cap rule on the grounds it was unconstitutional. “The Portion Cap Rule, if upheld,” he declared in his judgment, “would create an administrative Leviathan.80 ”
Judge Tingling’s memorable phrase is in many ways evocative of the risks associated with all efforts to impose regulations and taxes on food and drink in the cause of curbing obesity. New food and drink taxes pose a serious threat of ‘administrative Leviathan’ overseeing everything we eat and drink. Such a beast will create many more problems than it will solve.
CrEATIng A nEW goVErnmEnT rEVEnUE AddICTIon
Food and drink taxes hold the promise of a substantial new source of revenue for government. In 2008 the U.S. Congressional Budget Office estimated a tax of 3¢ per 12-ounce can of soda could raise $5 billion per year to fund health care reform.81 According to Brownell’s original 2009 results, a penny-per-ounce tax on soft drinks and other sugar-sweetened beverages in the U.S. would raise $14.9 billion per year.82
80 New York Statewide Coalition of Hispanic Chambers of Commerce et al v. New York City Department of Health and Mental Hygiene and New York City Board of Health 2013. New York State Supreme Court 653584/12 JSC Hon. MA Tingling. Accessed at http://www.scribd.com/doc/129784002/Judge-Halts-Bloomberg-Soda-Ban81 Congressional Budget Office, “Budget Options, Volume 1: Health Care” 2008. Accessed at http://www.cbo.gov/sites/default/files/cbofiles/ftpdocs/99xx/doc9925/12-18-healthoptions.pdf82 Brownell, 2009.
29

While per capita soda consumption is significantly higher in the U.S. than in Canada, Coaltion Poids’ recommendation of a “minimal” 5¢ per litre tax on sugar-sweetened drinks (one-seventh the Brownell rate) would nonetheless bring in an estimated $40 million per year in Quebec alone.83 Scaling up these calculations across all provinces by population, suggests a national soft drink tax could be expected to raise approximately $170 million per year. Potential Canadian revenues from a Brownell-sized tax, which the Quebec minister of health has publicly supported, could reach over $1.1 billion a year nation-wide, based on similar rough calculations.84
Beyond the possibility of a massive new source of government revenue, food and drink tax proposals can also be expected to have a significant impact on government behaviour.
THE ToBACCo ExPErIEnCE
All food tax advocates, from Brownell in the U.S. to Coalition Poids and the Ontario doctors’ association in Canada, make explicit reference to the role of cigarette taxes in reducing demand and raising revenue:
“Anti-tobacco campaigns have helped to reduce smoking rates in Ontario from close to 50 percent in the 1960s to less than 20 percent today. Tax increases were the most important reason for this success...” 85
There are, however, many obvious and important differences between tobacco and food. The most significant is that eating is a necessity and smoking is not. No food or drink, no matter
how unhealthy it may be considered, presents the same health risk as a single cigarette. Even the Canadian Medical Association Journal recognizes this distinction: “Although every cigarette is bad, all foods, even junk food, have some nutritional value.”86 When consumed in moderation, pop and chips can be part of a healthy diet.
Nonetheless, much of the current food tax rhetoric paints sugar, fat and other ‘unhealthy’ food choices as a menace to society requiring taxes similar to those levied on tobacco. What does the history of tobacco taxes tell us about the future of food and drink taxes?
In Canada tobacco taxes currently bring in over $7.4 billion annually to federal and provincial treasuries.87 While excise rates in Canada have varied considerably in recent decades due to competing concerns over international cigarette smuggling and efforts to reduce consumption, around the world tobacco taxes have proven to be one of the most important and reliable sources of government revenue.88
As appealing as tobacco taxes may be to governments, however, their success in reducing consumption has proven to be a double-edged sword. As cigarette use declines due to higher taxes, so does revenue. In order to maintain a reliable revenue stream, government must continually raise its tax rate to compensate for fewer consumers.
83 Coalition Poids, 2011.84 Teisceira-Lessard, Philippe. “Taxe sur les boissons gazeuses: le ministre Hébert ‘y croit’” La Presse March 9, 2013. Accessed at http://www.lapresse.ca/actualites/sante/201303/09/01-4629452-taxe-sur-les-boissons-gazeuses-le-ministre-hebert-y-croit.php85 OMA, 2012 86 Eisenberg, Mark et al. 2011. “Legislative approaches to tackling the obesity epidemic” Canadian Medical Association Journal, Sept. 20, 2011. Volume 183, Issue 13. Accessed at http://www.cmaj.ca/content/early/2011/04/26/cmaj.101522.full.pdf+html 87 Physicians for a Smoke-Free Canada, “Tax Revenues from Tobacco Sales 1990-1991 to 2010-2012” Nov. 2012. Accessed at http://www.smoke-free.ca/factsheets/pdf/totaltax.pdf88 DeCicca, Philip et al. “Excise Tax Avoidance: The Case of State Cigarette Taxes,” National Bureau of Economic Research Working Paper 15941 April 2010. Accessed at http://www.nber.org/papers/w15941
pArt V: Food tAxes LeViAthAn
30

This reflects the dilemma inherent with all excise taxes. While their ostensible goal is to reduce consumption of a particular activity or product, such as smoking, drinking alcohol or eating junk food, they serve another equally important purpose: to generate government revenue. An excise tax that significantly lowers consumption will fail to produce a reliable source of funding for government, and vice versa. This inevitable conflict between consumption reduction and revenue maintenance can have a significant impact on fiscal policy.
The phenomenon can be seen plainly in a 2011 report by the Treasury Department of Australia that discusses the need to raise tobacco tax rates in order to keep revenues stable. “Whilst an efficient and stable source of revenue − tobacco collections are in long term real decline. Due to the declining per-capita consumption of tobacco, this decline can only be arrested by increases in the rate of excise above and beyond standard CPI indexation.” 89
It is noteworthy that the Australian Treasury considers declining tobacco revenues to be a problem that must be “arrested.” If the goal of tobacco taxation is simply to reduce demand, then declining consumption should be considered a benefit that requires no action on the part of government. Only if the goal is to raise revenue does a decline in demand become a problem. The Australian government’s solution was a 25% increase in the tobacco excise tax. This was expected to cause a 6% further decline in smoking rates and, more importantly, a 17% increase in revenues.
Such a response is typical of all governments’ attitudes toward excise taxes. While they may be justified on the basis
of a particular social or moral need, in reality smokers are just another convenient source of funding to be squeezed when necessary. The fewer smokers, the more squeezing must be applied to keep the money flowing into government coffers.
Another perspective on the inevitability of rising excise tax rates to keep revenues constant can be found in the work of anti-tobacco advocate Frank Chaloupka of the University of Illinois.
“Over time inflation will erode the value of tobacco tax revenues, unless these taxes are increased often enough to keep pace with inflation. Similarly, as tobacco use declines in response to other tobacco control efforts, revenues from tobacco taxes will also decline unless taxes are increased periodically.”90
The impact of tax increases on smoking rates fades over time. In order to maintain a steady and sustained drop in smoking, it is necessary to push the price higher and higher. Concerns about ‘stagnant rates’ of smoking in Canada and elsewhere can be seen as proof that advocates will never be satisfied with point reductions, but rather demand that rates continually fall.
89 Treasury Department, Government of Australia “Issues in Tobacco Taxation” February 2013. Accessed at http://www.treasury.gov.au/~/media/Treasury/Access%20to%20Information/Disclosure%20Log/2011/Plain%20packaging%20of%20tobacco%20products/Downloads/Document_57.ashx90 Chaloupka, Frank et al. “Tobacco taxes as a tobacco control strategy,” Tobacco Control 2012. Volume 21 Abstract viewable at http://tobaccocontrol.bmj.com/content/21/2/172.short
pArt V: Food tAxes LeViAthAn
31
The minimum effective tobacco tax, according to Chaloupka, should be set at 70%. However, even in countries already at that level (most Canadian provinces currently tax cigarettes at a rate of 60% to 70%) he says further increases “would be appropriate.” In other words, there is no maximum. Chaloupka also advocates broadly targeted tobacco taxes in order to capture all possible substitutes to cigarettes, such as smokeless tobacco, cigars, and cigarillos. 91
If soft drink and food taxes are to be modeled on tobacco taxes, as advocates of a soda tax explicitly state, the obvious lesson is that rates will inevitably rise over time. If consumption falls due to the tax, rates must grow to protect the government’s revenue stream. And since advocacy groups are unlikely to be satisfied with any consumption greater than zero, continual increases in tax rates will also be necessary to maintain continual reductions in demand. From this perspective a tax of 5¢ per litre or a penny-per-ounce on soft drinks should be considered merely the beginning.
BLACk mArkET SodA?
Beyond repeated increases in excise tax rates, another lesson to be gleaned from the experience of tobacco taxes is that repeated efforts to extract more tax revenue inevitably lead to more illegal behaviour. Canadian experience is particularly relevant here, as rising federal and provincial excise taxes have been closely linked to illegal cigarette smuggling and gray/black market sales.
As detailed in a Canadian Taxpayers Federation special report on contraband tobacco sales, between 1985 and 1991 federal tobacco excise tax rates rose 218%.92 This led to a dramatic increase in contraband tobacco sales and smuggling. By 1994 it was estimated that 40% of all cigarette sales were illegal. In response to this problem, created solely by high taxes, Ottawa and five provinces dramatically lowered tobacco tax rates. The smuggling problem largely went away.
Starting in 2001, however, federal and provincial governments again began to hike tobacco taxes in another effort to reduce smoking. Between 2001 and 2008, most provinces doubled their excise rates. In lockstep, smuggling and contraband cigarette sales rose once more. Estimates of the current size of the black market range from 30 to 49% of the total market.
If grocery taxes are intended to rival in size those on tobacco, it would seem entirely reasonable to assume such a policy will lead to similar increases in smuggling and black market sales of forbidden food. If taxes on groceries are smaller in magnitude than those on cigarettes a more likely scenario might be an increase in Canadian cross-border shopping, to the detriment of Canadian retailers.
91 Chaloupka, 201292 Fildebrandt, Derek, “How Much is Contraband Tobacco Costing Ontario Taxpayers?” Canadian Taxpayer Federation, December 2012. Accessed at http://www.taxpayer.com/media/How%20Much%20is%20Contraband%20Tobacco%20Costing%20Taxpayers%20in%20Ontario%20-%20December%202012.pdf
pArt V: Food tAxes LeViAthAn
32

rEd TAPE on THE mEnU
The complexity of food and drink taxes can also be expected to lead to an associated increase in bureaucracy and red tape. Such was clearly the result of the fat tax in Denmark, with bizarre, arbitrary rules to establish which foods are ‘officially’ healthy or unhealthy.
In Canada, the distinction between healthy and unhealthy sugar-sweetened beverages already varies across provinces. Manitoba and Quebec, for example, consider fruit drinks with at least 25% fruit content to be juice and thus exempt from tax.93 94 The Coalition Poids proposal for a 5¢ per litre tax on sugar-sweetened beverages, however, would tax all fruit drinks that contains any added sugar regardless of juice content.95 Sorting out these differences holds the potential for creating circumstances similar to that experienced in Denmark with its fat tax.
Research on the implementation of soda taxes in the U.S. reveals a host of such unexpected complications. Some states allow fruit punch with as little as 10% fruit juice to qualify for an exemption from tax, whereas other states only exempt 100% fruit juice.96 Some states tax diet soda in the same manner as regular soda, others do not. And the taxation of candy in many states has led to absurd regulations that exempt some chocolate bars (such as Twix or Kit Kat) from the tax because they contain a cookie wafer and are thus considered a baked good, while other chocolate bars equally high in calories (Milky Way, for example) face the full tax because they do not list flour in
their ingredients.97 Canadians can expect any tax on food or drink to be similarly complex, bureaucratic and absurd.
Suggestions that the consumption of healthy food should be rewarded by subsidies or tax exemptions pose equally large problems about what deserves to be considered nutritious or virtuous.98 99 Raw fruits and vegetables would presumably be considered healthy. But what about canned tomatoes or other healthy-but-processed food items? Should unprocessed meat be exempt from tax? Or just lean cuts? A new food bureaucracy would be required to test all foods. Many decisions to exempt or subsidize healthy foods will doubtless prove as arbitrary and confusing as those made in the name of taxing unhealthy foods.
In summary, the creation of new taxes on food or drink promises to create a thicket of new problems and regulations. Government addiction to new sources of food tax revenue could prove as problematic to society as any concerns over obesity or consumer addictions to soda, fat or other ‘unhealthy’ foods.
93 Manitoba, 201394 Quebec, 201395 Coalition Poids, 201196 Tax Foundation, 201197 Tax Foundation, 201198 Centre for Science in the Public Interest, 2002.99 McMillan, 2007.
pArt V: Food tAxes LeViAthAn
33

34

ConCLusion
Food or drink tax proposals represent an effort to impose a simple solution on a very complex issue. Unfortunately, there are no simple or easy answers to the problem of weight gain and obesity. In fact there may not even be a problem.
Elevated mortality risk arising from obesity is limited to people at grade 2 obesity and above. As this constitutes a mere 1.1 million Canadians, it makes no sense to impose dramatic nation-wide solutions to cure a problem than affects less than 4% of the population.
With respect to specific tax suggestions, substantial real world evidence covering decades of experience in the U.S. and other countries demonstrates the futility of using taxes to control overweight or obesity. Despite popular belief, individual products do not necessarily cause weight gain. The fact that Canadian soft drink consumption has fallen over a third since 1998, while concerns about obesity have grown exponentially, highlights the obvious irrelevance of soda consumption to weight gain.
Further, consumers habitually seek to maintain pre-existing consumption patterns in spite of taxes, information campaigns or other public health efforts. While demand for taxed food and drink items can be expected to fall following the imposing of a tax, demand for untaxed substitutes will likely rise. This generally causes total calories consumed to remain constant. In some cases, substitution effects may actually lead to an increase in calories consumed.
Weight control via fiscal policy is frustrating, complicated and ultimately doomed to failure.
Considered against the standards of coherent public policy, food and drink taxes fail on every conceivable criterion. They do not deliver the promised outcome of lowering obesity, they create inequities and unfairness, they are inefficient, lead to larger and more intrusive government and they’re deeply unpopular with the public they’re supposed to be helping.
If the goal is to improve the health of Canadians, it ought to be considered significant that many of the academic papers cited in Part II found no link between soft drink consumption and weight gain, particularly among children and adolescents, but repeatedly emphasized the role of physical activity and sedentary behaviour with respect to obesity. This suggests lack of exercise plays a much bigger role in childhood obesity than any one beverage or food item. As such, provincial governments responsible for removing or reducing physical education requirements in schools over the past two decades likely bear far more of the blame for current levels of obesity than any food or drink item or product.
Tax policy is not an efficient or desirable means to weight loss.
35

36

Appendix: A CLoser LooK At soFt drinK deMAnd
Arguments regarding the effectiveness of taxes on sugar-sweetened beverages in reducing consumption are heavily dependent on estimates of the price elasticity of soft drinks. As this is a contentious topic, it deserves a closer look.
WHAT IS ELASTICITy?
If demand for a product is elastic, then a small price increase will result in a proportionately larger reduction in demand. Similarly, a price decrease will cause demand to rise by a greater amount. In mathematical terms, elastic demand is expressed as -1.0 or less. (That is, if price increases by 1%, demand will fall by more than 1%.) Products with elastic demand include luxury goods and services, as well as items that have an obvious and easily-obtained substitute. Examples include restaurant meals (elasticity of -2.3), pleasure travel (-4.0), fresh vegetables such as green peas (-2.8) and particular brands of automobiles (Chevrolets -4.0).100
Inelastic demand exists when a price increase leads to a relatively smaller reduction in demand. In mathematical terms, inelastic demand is a number greater than -1. (A price increase of one per cent will cause demand to fall by less than one per cent.) Inelastic products tend to be necessities or items without an obvious or easily-obtained substitute. Examples include salt (-0.1), gasoline (-0.2), tobacco (-0.45) and medical services (-0.6).101
A third category is unit elasticity. This obtains when price increases or decreases lead to proportionate changes in demand. Mathematically, unit elasticity is described as a number close to -1. (A price increase of one per cent will cause demand to fall by one per cent.) Here are included products that may not be strict necessities, but are nonetheless desirable or useful in everyday life. Examples include car tires (-0.9), movies (-0.9) and private education (-1.1).102
WHAT’S THE EVIdEnCE on SoFT drInkS?
Calculations regarding elasticity can be obtained from price and volume sales data, or through experimentation.
One of the more fascinating efforts to calculate the elasticity of soda comes from an experiment at a hospital cafeteria.103
Researchers controlled beverage sales at the Brigham and Women’s Hospital, a 700-bed facility in Boston, Mass. and adjusted the prices up and down over a period of six weeks. When the price of regular soda was hiked by 35%, soda sales decreased by 26%. This produces a price elasticity figure of -0.7, which is considered inelastic. Sales of substitute drinks such as diet soda, water and coffee rose by an equivalent amount, as overall beverage sales remained roughly constant.
100 Anderson, Patrick L. et al. “Price Elasticity of Demand,” 1998. Mackinac Center for Public Policy. Accessed at http://www.mackinac.org/article.aspx?ID=1247101 Anderson, 1998102 Anderson, 1998103 Block, Jason et al. “Point-of-Purchase Price and Education Intervention to Reduce Consumption of Sugary Soft Drinks.” American Journal of Public Health August 2010. Volume 100, Number 8. Accessed at http://www.ncbi.nlm.nih.gov/pmc/articles/PMC2901278/
37

Other data-driven efforts at deriving soda elasticity have come to similar conclusions. A 2010 academic paper using a year’s worth of household purchasing data from representative American consumers estimate elasticity for carbonated soft drinks at -0.73.104 A comparative review of 14 separate studies estimating soda elasticity, found the average to be -0.79.105 And Brownell’s influential 2009 article promoting the idea of a penny-per-ounce soda tax claims “The price elasticity for all soft drinks is in the range of -0.8 to -1.0.”
To summarize, soda demand appears to occupy a range between moderate inelasticity and unit elasticity. Soft drinks thus appear to be a poor choice for a tax. Consumption will fall by less than the tax rate. This means large taxes will be necessary to effect substantial changes in demand.
Despite the apparent consensus regarding soft drink elasticity, Brownell’s more-recent work on soda taxes curiously adopts an elasticity measure of -1.2, firmly in the elastic range. Brownell cites as his source for this significant change a single U.S. Department of Agriculture paper that has been criticized for its questionable assumptions and unusual results.106 107 (For example, the USDA article ignores chocolate milk and alcoholic beverages as possible substitutes for soft drinks, and strangely finds that demand for un-taxed diet soda declines when regular soda is taxed.)
Using the controversial -1.2 figure for elasticity allows Brownell to predict much greater declines in soft drink consumption than found in his previous work. Under his
104 Finkelstein, Eric et al, “Impact of Targeted Beverage Taxes on Higher- and Lower-Income Households.” Archives of Internal Medicine, Dec. 13-27, 2010. Volume 170, Issue 22. Abstract viewable at http://www.ncbi.nlm.nih.gov/pubmed/21149762105 Andreyeva, Tatiana et al. “The impact of food prices on consumption: a systematic review of research on the price elasticity of demand for food,” American Journal of Public Health, XX 2010. Volume 100, Issue 2. Accessed at http://www.ncbi.nlm.nih.gov/pmc/articles/PMC2804646/ 106 Smith, T.A. et al. “Taxing caloric sweetened beverages: potential effects on beverage consumption calorie intake and obesity. Economic Research Report, U.S. Department of Agriculture, 2010. ERR-100 Accessed at http://www.ers.usda.gov/publications/err-economic-research-report/err100.aspx#.UoDpGvlORFY 107 Klick, Jonathan. “Assessing the USDA Report, “Taxing Caloric Sweetened Beverages: Potential Effects on Beverage Consumption, Calorie Intake and Obesity by Travis A. Smith, Biing-Hwan Lin and Jonq-Ying Lee,” University of Pennsylvania Law School White Paper. Accessed at https://www.law.upenn.edu/fac/jklick/USDA.pdf
new elasticity estimates, Brownell claims a penny-per-ounce soda tax would cut sugar-sweetened beverage consumption by 24% nationwide, a reduction of almost 50 calories per day per person, more than twice his original estimate. He also calculates potential revenue earned from such a tax applied to all regular and diet sodas nationwide in the U.S. at $118 billion over six years.
Appendix: A CLoser LooK At soFt drinK deMAnd
38


![Unpopular Wonders of Tea That You Should Know [Infographic]](https://static.documents.pub/doc/80x56/5a648bf17f8b9a94568b4ae7/unpopular-wonders-of-tea-that-you-should-know-infographic.jpg)


