Why the Google IPO might stay exotic – An experimental analysis of offering mechanisms Andreas Trauten a and Thomas Langer b June 2008 Abstract Despite their theoretical efficiency in selling shares to the public, auctions are not the preferred me- chanisms in Initial Public Offerings (IPOs). Chemmanur and Liu (2006) and Sherman (2005) provide a rational explanation for this “IPO auction puzzle” based on the notion that issuers are not only inter- ested in the offering proceeds, but also the secondary market price, and thus try to induce investors to produce information about the IPO. In this paper, we report the results of an experimental study set up to test the mechanisms underlying this reasoning. Our findings strongly support the theoretical argu- ment. If the issuer has some discretion in setting the offering price (as with bookbuilding or fixed- price offerings), he can maintain investors’ propensity to produce information by appropriately adjust- ing the offering price even if information costs are high. In auctions, however, high information costs inevitably result in a low propensity to produce information. This is a consequence of investors’ com- petitive bidding behavior, which prevents them from recovering the costs of information production. Our results provide experimental support for the theoretical argument that an auction is not the prefer- able offering mechanism for young and risky IPO firms because, while there is strong demand for information about such firms, the costs of producing this information are high. Keywords: Initial Public Offerings, IPO auctions, fixed-price offerings, endogenous entry, experi- mental finance JEL-classification: C72, D84, G24, G32 a Finance Center Münster, Lehrstuhl für BWL, insbesondere Finanzierung, Universität Münster, Universitäts- straße 14-16, 48143 Münster, E-Mail: [email protected]. b Finance Center Münster, Lehrstuhl für BWL, insbesondere Finanzierung, Universität Münster, Universitäts- straße 14-16, 48143 Münster, Tel.: +49-2 51-8 32 20 33, Fax.: +49-2 51-8 32 26 90, E-Mail: Tho- [email protected]. A previous version of this paper was titled “Information production and bidding in IPOs - An experimental anal- ysis of auctions and fixed-price offerings”. We would like to thank Fabrizio Adriani, Daniel Hoechle, Alexander Klos, Ann E. Sherman, Chris Yung, Christian Zaum and participants in the Campus for Finance Research Confe- rence 2008, the EFM Symposium Initial Public Offerings 2008, the ESA 2007 World Meeting, the 11 th Confe- rence of the Swiss Society for Financial Market Research and the Finance Center Münster doctoral seminar for valuable comments and insights. Financial support from the Bundesministerium für Bildung und Forschung (BMBF) through the project “Internetökonomie und Hybridität” is gratefully acknowledged.
Transcript
Why the Google IPO might stay exotic
– An experimental analysis of offering mechanisms
Andreas Trautena and Thomas Langerb
June 2008
Abstract
Despite their theoretical efficiency in selling shares to the public, auctions are not the preferred me-chanisms in Initial Public Offerings (IPOs). Chemmanur and Liu (2006) and Sherman (2005) provide a rational explanation for this “IPO auction puzzle” based on the notion that issuers are not only inter-ested in the offering proceeds, but also the secondary market price, and thus try to induce investors to produce information about the IPO. In this paper, we report the results of an experimental study set up to test the mechanisms underlying this reasoning. Our findings strongly support the theoretical argu-ment. If the issuer has some discretion in setting the offering price (as with bookbuilding or fixed-price offerings), he can maintain investors’ propensity to produce information by appropriately adjust-ing the offering price even if information costs are high. In auctions, however, high information costs inevitably result in a low propensity to produce information. This is a consequence of investors’ com-petitive bidding behavior, which prevents them from recovering the costs of information production. Our results provide experimental support for the theoretical argument that an auction is not the prefer-able offering mechanism for young and risky IPO firms because, while there is strong demand for information about such firms, the costs of producing this information are high. Keywords: Initial Public Offerings, IPO auctions, fixed-price offerings, endogenous entry, experi-mental finance JEL-classification: C72, D84, G24, G32
a Finance Center Münster, Lehrstuhl für BWL, insbesondere Finanzierung, Universität Münster, Universitäts-straße 14-16, 48143 Münster, E-Mail: [email protected].
b Finance Center Münster, Lehrstuhl für BWL, insbesondere Finanzierung, Universität Münster, Universitäts-straße 14-16, 48143 Münster, Tel.: +49-2 51-8 32 20 33, Fax.: +49-2 51-8 32 26 90, E-Mail: [email protected].
A previous version of this paper was titled “Information production and bidding in IPOs - An experimental anal-ysis of auctions and fixed-price offerings”. We would like to thank Fabrizio Adriani, Daniel Hoechle, Alexander Klos, Ann E. Sherman, Chris Yung, Christian Zaum and participants in the Campus for Finance Research Confe-rence 2008, the EFM Symposium Initial Public Offerings 2008, the ESA 2007 World Meeting, the 11th Confe-rence of the Swiss Society for Financial Market Research and the Finance Center Münster doctoral seminar for valuable comments and insights. Financial support from the Bundesministerium für Bildung und Forschung (BMBF) through the project “Internetökonomie und Hybridität” is gratefully acknowledged.
1
1. Introduction
In an initial public offering (IPO), the issuing firm sells a large number of identical shares to
the public where the value of the shares is uncertain. According to economic theory, auctions are a
very efficient mean to carry out such a transaction (e.g., Dasgupta and Hansen, 2007). Indeed, empiri-
cal evidence suggests that the direct costs associated with auctioned IPOs are lower than the costs of
IPOs via the typical alternative offering mechanisms, namely, fixed-price and bookbuilding offerings.1
Further, in countries where auctions and alternative offering mechanisms coexist, the indirect costs of
IPOs arising from underpricing, i.e., selling the shares at an offering price below the fair value in the
secondary market, seem to be lower in auction offerings.2 A prominent example of a successful IPO
auction is the going public of the internet search firm Google in the summer of 2004, in which Google
raised $1.67 billion of capital. Yet auctions have not become the preferred offering mechanism in
IPOs. In contrast, while auction IPOs occurred in many countries in the 1980s and 1990s, they have
been abandoned in favor of fixed-price offerings and, more recently, bookbuilding offerings in most
countries (Sherman, 2005; Jagannathan and Sherman, 2006; Kutsuna and Smith, 2004, Degeorge et
al., 2007). The crowding out of auctions in IPOs in spite of their theoretical suitability is known as the
“IPO auction puzzle” in the literature on IPOs (e.g., Chemmanur and Liu, 2006; Chen and Wu, 2006).
Chemmanur and Liu (2006) (CL hereafter) provide a rational explanation for the IPO auction
puzzle. In their model, issuers not only have a preference for maximizing the offering proceeds (or
equivalently, for minimizing underpricing), but also for information production by investors. The ra-
tionale is that more information results in higher secondary market prices if the true (but ex ante un-
known) value of the firm is high. CL endogenize the preference for precise secondary market prices by
assuming that the issuer sells only a part of its shares in the IPO and the remainder in the secondary
1 Direct costs comprise listing and promotion costs and the underwriter spread. The latter is calculated as a
percentage of offering proceeds and is charged by the syndicate of banks conducting the IPO. Pukthuanthong
et al. (2006) study the Google IPO as well as the IPOs conducted via the online auction platform of W. R.
Hambrecht & Co. They find that the underwriter spreads in auction IPOs are significantly below the spreads
in bookbuilding IPOs of matched firms (5.6% versus 7% spread on average).
2 Underpricing is typically defined as the initial return on the first trading day. Derrien and Womack (2003)
find evidence of lower underpricing in auction IPOs in France and Pukthuanthong et al. (2006) find similar
for the US IPO market. For evidence on other IPO markets see Ritter (2003).
2
market. Against this background, CL analyze IPO proceeds in the primary market and the subsequent
proceeds in the secondary market in uniform price auctions and fixed-price offerings. In uniform price
auctions of K shares, the K highest bidders receive an allocation at a uniform price, which is usually
set equal to the K+1-highest bid (multiple-unit second-price sealed bid common value auction). In
fixed-price offerings, the offering price is set by the issuer and shares are randomly allocated if de-
mand exceeds supply. The central insight of CL’s model is that in fixed-price offerings, the issuer can
induce investors to produce information by lowering the offering price. In auctions, however, the issu-
er cannot influence the propensity to produce information. Since investors bid competitively, the com-
pensation for information costs is limited. Thus, fewer investors produce information if the costs of
information production are high. In this setting, for a given preference for information production (i.e.,
a given split of overall shares into those for sale in the primary offering and those for sale in the sec-
ondary offering), the ranking of IPO mechanisms depends on the costs associated with producing in-
formation. If information costs are low, auctions attract a sufficient number of information producers
und generate higher overall proceeds than fixed-price offerings. In contrast, fixed-price offerings gen-
erate higher overall proceeds if information costs are high. This is a solution to the IPO auction puzzle
since the level of information costs is a proxy for the awareness level and risk associated with the IPO
firm. The riskier the firms’ business, the more complex it is to evaluate, and hence the higher are the
information costs. As the majority of IPO firms are newly established or operate in new and risky
businesses, most IPOs are conducted via mechanisms other than auctions.
In an earlier study, Sherman (2005) compares different forms of IPO auctions to the book-
building mechanism. With respect to pricing, bookbuilding combines elements of auctions and fixed-
price offerings since even though the offering price is ultimately set by the issuer, investor demand is
taken into account by collecting bids in the order book. In line with CL, she finds that the issuer’s dis-
cretion in pricing and allocating shares in bookbuilding is beneficial in the case of a high preference
for information accuracy or high information costs.3
3 While CL and Sherman explicitly take into account the issuer’s preference for information production, addi-
tional studies compare IPO mechanisms on the basis of offering proceeds in varying information settings
(e.g., Biais et al., 2002; Biais and Faugeron-Crouzet, 2002; Maksimovic and Pichler, 2006).
3
While the models of CL and Sherman provide persuasive explanations for the IPO auction
puzzle under the assumption of fully rational risk-neutral agents, the extent to which their sensitive
decision mechanisms are able to describe real-life behavior is an open question. The mixed strategies
describing the entry and bidding behavior in IPO auctions assume randomizing over the equilibrium
bid functions as well as over the entry decision and thus are remarkably sophisticated decision prob-
lems. Sherman, p. 618, notes what this decision problem essentially boils down to:
Ex post, there could be too few entrants and the offering could fail, or there could be too many entrants who bid away all of the potential profits, preventing investors from recovering their information costs (see Levin and Smith, 1994). This risk low-ers the entry incentives of all investors, making them less willing to participate.
An empirical test of the models is very difficult due to a lack of auction IPOs. Without a large
sample of IPOs conducted via different offering mechanisms, moreover, it is very hard to distinguish
the effects of the offering mechanism and of information costs from the variety of factors influencing
investor behavior in IPOs.4 In this study we aim to shed light on investors’ information production and
bidding behavior in IPOs by way of a laboratory experiment.
We compare a uniform price auction to the common offering mechanisms with respect to pric-
ing. In uniform price auctions the price is fully determined by demand, whereas in both the bookbuild-
ing and the fixed-price mechanisms the issuer has discretion in setting the offering price.5 In the fol-
lowing, we focus on fixed-price offerings as bookbuilding would considerably complicate our experi-
ment.6 Nevertheless, our main results similarly apply to bookbuilding offerings. The fixed-price and
4 Jagannathan and Sherman (2006) provide a survey of auction IPOs around the world. The anecdotal evidence
indicates that the number of bidders fluctuates strongly.
5 Beyond discretion in pricing, bookbuilding also provides discretion in the allocation of shares. As a result,
bookbuilding allows the issuer or the investment bank to elicit truthful information from investors by reward-
ing investors with underpricing and a preferred allocation (e.g., Benveniste and Wilhelm, 1990; Cornelli and
Goldreich, 2003). Here we solely model the effect of underpricing on investors’ information production be-
havior, as we focus on discretion in pricing, which is a common feature of fixed-price and bookbuilding of-
ferings.
6 Apart from its simplicity, a comparison of fixed-price offerings to auctions seems reasonable in light of the
historic development of offering mechanisms. As Jagannathan and Sherman (2006) show, fixed-price offer-
ings drove out auctions in most countries several years before bookbuilding was introduced.
4
auction offering games underlying the experimental analysis build on the model by CL. We alter the
information structure towards a more realistic design in order to make an experimental investigation
possible, albeit more realism means sacrificing the explicit equilibrium in the auction model.7 The
experiment allows us to observe the effect of the offering mechanism and the level of information
costs on investors’ information production and bidding behavior. For simplicity, we do not consider a
follow-on offering in the experiment, but only look at the IPO event. In order to capture the issuer’s
preference for information production, we multiply the level of information production by a simple
weighting factor. Further, we assume that the costs of producing information are positively related to
the issuer’s inherent risk. Thereby, the experiment yields insights into the optimal choice of an offer-
ing mechanism depending on the issuer’s risk characteristics and preference for information produc-
tion.
Our experimental findings strongly support the theoretical argument. In fixed-price offerings,
the issuer can maintain investors’ propensity to produce information by appropriately adjusting the
offering price even if information costs are high. In auctions, however, high information costs inevita-
bly result in a low propensity to produce information as investors bid too competitively. With respect
to the optimal choice of an offering mechanism, our results suggest that an auction is not the prefera-
ble offering mechanism if both the costs of information production and the issuer’s preference for
information production are high. These characteristics often apply to IPO firms, since such firms are
typically young, less well-known and engaged in new businesses or technologies.
The relation between students’ behavior in experimental IPOs and institutional investors’ be-
havior in real IPOs might appear somewhat tenuous given the considerably higher payments and expe-
rience of institutional investors.8 Indeed, Smith and Walker (1993) find that increased cash payments
drive subjects’ behavior towards the rational solution in experiments, i.e., they invest more time and
effort in the decision process. However, we believe this result rather supports the external validity of
7 To be precise, CL model signals that have no information content with very high probability, but fully reveal
the shares’ true value with very low probability. We model signals that reveal the true value in more than
50% of the cases, but indicate the wrong value in the remaining cases.
8 See Gillette et al. (2007) for an in-depth discussion of external validity in a lab experiment where the stakes
and the decision environment also differ strongly from those in the respective real-life situation.
5
our experimental design: If even students behave as predicted by the sophisticated theoretical models,
institutional investors will be likely to do so too. A growing strand of literature uses both professionals
and students in auction experiments in order to measure the impact of experience. These studies indi-
cate that the results obtained by students are qualitatively similar to those obtained by professionals
(e.g., Dyer et al., 1989; Gillette et al., 2007, fn. 5).
From a game theory point of view, we study two coordination games with both outcome and
strategic uncertainty. Investors observe neither the true value of the shares in the IPOs nor the strategic
behavior of other investors. There are few experimental studies on games that comprise both types of
uncertainty. Cox et al. (2001) analyze endogenous entry and exit in a common value auction. Running
first-price auctions, they observe fewer entries than predicted by the equilibrium solution. Rapoport et
al. (2002) study the entry in a lottery game where the probabilities of the lottery outcomes are explicit-
ly linked to the number of entrants. They find a good coordination of subjects at the aggregate level.
To our knowledge, there are three other experimental studies on IPO mechanisms. Bonini and
Voloshyna (2007) focus on investors’ information revelation behavior in bookbuilding offerings and
in a new mechanism called competitive IPO. Patatoukas (2008) investigates the reasons for underpric-
ing in experimental IPO auctions where the number of bidders is given exogenously. He finds that
underpricing increases as the number of bidders decreases due to strategic underbidding. In the case of
heterogeneous information among investors, underpricing compensates less informed investors for
adverse selection problems. Finally, like us, Zhang (2006) studies uniform price auctions and fixed-
price IPOs in laboratory experiments. He finds that IPO auctions generate higher offering proceeds
than fixed-price offerings. However, Zhang bases his experiment on the comparison of offering me-
chanisms by Biais and Faugeron-Crouzet (2002), which is fundamentally different to our approach.
Specifically, unlike CL, Biais and Faugeron-Crouzet rank IPO mechanisms only by their offering
proceeds and assume an exogenously given number of investors. This study is thus the first experi-
mental analysis of IPO mechanisms that explicitly considers issuers’ preference for accurate secondary
market prices and investors’ endogenous information production and bidding decisions.9 This design
allows us to test the theoretical solutions to the IPO auction puzzle by CL and Sherman.
9 Further differences from Zhang (2006) relate to the signal structure and the information processing model.
6
The paper is organized as follows. Section 2 provides a more detailed discussion of the basic
intuition for the issuers’ preference for information production in IPOs on the basis of CL and the re-
lated literature. Section 3 describes the IPO games that underlie the experiment and derives the equili-
brium solution for fixed-price offerings. Section 4 provides details on the experimental design and
procedures. Section 5 presents the analysis of the information production and bidding behavior in the
experimental sessions. Section 6 summarizes and concludes.
2. The Preference for Information Production in IPOs
According to the theoretical models by CL and Sherman, the choice of the IPO offering me-
chanism affects the overall offering proceeds through a sequence of causal relations. In the following,
we discuss the main intuition behind the models. A crucial assumption is that the IPO firm has a prefe-
rence for accurate secondary market prices, and thus has a desire for a high level of information pro-
duction.10 This assumption is plausible in the case of a high quality firm. Here, the secondary market
price increases with the amount of information if the pieces of information are aggregated according to
Bayes’ law.11 While CL endogenize the issuer’s preference for accurate pricing by assuming a follow-
on offering, there are several other reasons for this preference, including marketing reasons (Demers
and Lewellen, 2003), a sensitivity of post-IPO investment to prices (van Bommel, 2002), aftermarket
trading activities (Busaba and Chang, 2002), insider selling after the end of the lock-up period (Ag-
garwal et al., 2002) and management compensation schemes tied to the stock price.12
Irrespective of the benefits of a high level of information about a stock, the question remains
why information production has yet to be induced prior to the IPO. CL assume that investors only
have an incentive to produce costly information in the primary market. Here, information production is
10 Other papers that point to the importance of buy-side information acquisition include Chemmanur (1993),
Sherman (2000), Sherman and Titman (2002) and van Bommel (2002).
11 A more general rationale for the negative relation between the level of information and the costs of equity
capital is provided in Easley and O’Hara (2004).
12 Yung (2005) models both investors’ information production and bankers’ costly screening of new issues. In
his model, price accuracy mitigates the bank’s moral hazard problem. Thus, a preference for price accuracy
here does not follow from assumptions about post-IPO activities, but arises endogenously in the IPO process.
7
worthwhile if the shares are sold at a discount to the fair value in the secondary market. Thus, the
“money left on the table” associated with underpricing can be regarded as the compensation to inves-
tors for producing information (Chemmanur, 1993). In an efficient secondary market, however, infor-
mation is directly reflected in prices, and thus investors have no chance to generate profits from trad-
ing in order to compensate the costs of information production. This prevents information production
in the secondary market. Indeed, there is empirical evidence that firms do care about information pro-
duction by investors prior to the IPO. A major phenomenon pointing to the desire for information pro-
duction is the IPO firms’ request for vast and influential analyst coverage. Enhancing analyst coverage
is one reason for committing co-managers in an IPO (Chen and Ritter, 2000). Further studies show
that issuers prefer underwriters that employ famous analysts.13 An economic interpretation for this
“analyst lust” (Loughran and Ritter, 2004) is that issuers strive to decrease valuation uncertainty and
thus the level of underpricing required by investors. However, Cliff and Denis (2004) find that higher
analyst coverage increased the underpricing of US IPOs between 1993 and 2000. Apparently, issuers
prefer to “buy” analyst coverage through underpricing. The point is that issuers care about analyst
coverage not only during the IPO but also after the IPO. Consistent with this hypothesis, they find that
firms are more likely to switch the underwriter in a seasoned equity offering if they were not satisfied
with the post-IPO coverage of the IPO underwriter.
Rewarding investors for producing information by underpricing might raise a free-riding prob-
lem since investors could forgo information production and still receive a share at the lower offering
price. CL assume in their model that the value of a piece of information exceeds its costs so that in-
formed bidding strictly dominates uninformed bidding. Thus, after a firm announces the decision to go
public via a certain offering mechanism, an investor has to weigh the costs of purchasing information
against the expected profit from informed bidding. CL show that a symmetric risk-neutral Nash equi-
librium in mixed strategies exists to this problem. Investors choose the probability of entering the IPO
13 For example, Dunbar (2000) shows that between 1984 and 1994 an underwriter’s market share in the US
increased after one of his analysts was highly ranked in the Institutional Investor annual survey. This finding
is confirmed by Clarke et al. (2002), who observe the market share of underwriters after losing or acquiring
all-star analysts in the US between 1988 and 1999. Krigman et al. (2001) survey firms that went public in the
US between 1993 and 1995. They present evidence that a major reason to switch the underwriter in a subse-
quent seasoned offering is to initiate more influential analyst coverage provided by the new underwriter.
8
that results in zero profits in expectation. As a consequence, the number of bidders is endogenously
determined by the offering mechanism and the other IPO parameters. The difference between the of-
fering mechanisms is that in fixed-price offerings, the issuer can induce a higher participation proba-
bility by lowering the offering price while this probability cannot be influenced in IPO auctions. Here,
investors are confronted with the risk that any underpricing is eliminated through competitive bidding.
Thus, information production is more risky in auctions, which discourages investors from producing
information in the first place. This effect exacerbates with increasing information production costs.
Consequently, given a sufficiently high number of shares being sold in the secondary offering (or
equivalently, a sufficiently high preference for price accuracy), the optimal offering mechanism is an
auction in the case of low information costs, but a fixed-price offering in the case of high information
costs.
The costs of producing information about an IPO firm are closely related to the amount of
publicly available information and the firm’s risk. The more information about the firm is publicly
available, the easier it is to aggregate the pieces of information to a signal of firm quality. The riskier
the firm’s operations, the harder it is to estimate the future cash flows and the cost of capital. Measures
such as firm age, size or industry proxy for these information cost factors.14 The older and larger the
firm, the more information is publicly available and the greater the probability that the firm operates in
an established, well-known industry. Yet the typical IPO firm is rather young and small, operating in a
new, innovative industry (e.g., Ljungqvist et al., 2003). Producing information about such a firm is
costly. Thus, CL’s model predicts that an auction offering should not be the preferred IPO method.
This is in line with the empirical observation of a very low proportion of auction offerings in most
countries.
14 Such measures are commonly used as proxies for IPO uncertainty in empirical studies (e.g., Ljungqvist,
2007).
9
3. IPO Games
3.1 COMMON CHARACTERISTICS
The IPO games that underlie the experiment are modeled as follows. A (risk-neutral) firm
plans to go public by selling K shares to investors. The true value of the shares is unknown to the firm
as well as to investors.15 However, it is common knowledge that the firm is of good quality with prob-
ability Θ and of bad quality with probability 1-Θ. If the firm is of good quality, each share is worth
+V . Otherwise, it is worth −V .
There are N risk-neutral investors who get the opportunity to participate in an IPO (enter the
IPO game). The alternative to participating in the IPO is to invest in a riskless interest-free account. If
an investor decides to bid for a share, she incurs bidding costs Cbid (Cbid > 0). These costs reflect bank
fees and the expenditure of time to submit a bid. Each investor can bid for only one share. The poten-
tial demand for shares is assumed to exceed the number of shares offered, thus N > K. Prior to bidding
in the IPO, an investor considers producing information on firm quality. If an investor decides to pro-
duce information about an IPO firm, she incurs information costs Cinfo (Cinfo > 0), which reflect the
effort of gathering and evaluating data on the firm. In return, she receives a binary signal S that takes
either high ( +S ) or low ( −S ) outcomes. This signal is correct with probability p. In the following, we
denote the probability of receiving a signal +S given the firm is of good quality by ++++ = pVSp )|(
and given the firm is of bad quality by −+−+ = pVSp )|( . In the case of the signal −S , the probabilities
−−p and +−p are defined accordingly. The probability of receiving a correct signal is independent of
the firm’s true value. The pieces of information gathered by different investors are independently
drawn conditional on the pre-determined true value of the shares. Hence, signals are related in the
15 While Sherman also assumes that the true value is unknown to the firm, CL assume the value is known. They
argue that it is rational for a bad quality firm to mimic the behavior of a good quality firm as there is a chance
that this firm will achieve a high offering price due to noise in investors’ information. Hence, a firm behaves
as if it were a good quality firm irrespective of its knowledge about the quality. See CL, fn. 23 and 32, for a
detailed discussion on the bad firms’ mimicking behavior. In signaling models of IPO underpricing, however,
it is assumed that firms that know about their bad quality cannot mimic the underpricing of good quality
firms as they cannot compensate for forgone proceeds through higher proceeds in secondary offerings (e.g.,
Allen and Faulhaber, 1989). Thus, good firms use underpricing to signal their quality. The empirical evi-
dence for these theories is mixed at best (Spiess and Pettway, 1997).
10
sense that producing a good signal increases the likelihood that other investors also produce good sig-
nals (Kagel et al., 1995). This information setup is common knowledge in the IPO games.
The investors face a two-stage decision problem. Contingent on K, N, Θ, +V , −V , p, Cbid, Cinfo
and the issue mechanism an investor first decides on whether to produce information (also referred to
as participation decision). In a second step, she decides on bidding for a share in the IPO based on her
updated beliefs about firm quality in the case of information production. If an investor chooses not to
bid for a share after producing information, the information costs are deducted from the interest-free
account. No further gains or losses will be incurred. If the investor bids for a share, bidding costs are
deducted irrespective of whether she receives an allocation.
There is no strategic interaction possible between investors in the IPO games. That is to say,
investors do not learn about either other investors’ information production decisions or the type of
information produced by other investors. Further, other investors’ bidding cannot be observed. How-
ever, each investor’s outcome is affected by the other investors’ decisions in the IPO game. If m < K
investors decided to bid for a share, the IPO fails as not all shares could be placed with investors. In
this case, the IPO is cancelled and no investor receives a share. The IPO takes place if m ≥ K. Here, the
pricing and allocation of shares depends on the offering mechanism.
3.2 FIXED-PRICE OFFERINGS
In a fixed-price offering, the offering price F is set by the issuer (which is the experimenter in
our study) within the range [ −V , +V ] and is communicated to investors prior to their information pro-
duction and bidding decisions. Given m ≥ K investors bid for a share, we define the following alloca-
tion rule for the IPO. If m = K, each bidding investor receives one share. If m > K, the shares are ran-
domly allocated to K investors. Consequently, the probability π of receiving a share decreases with the
number of bidding investors. Further, we maintain the following assumptions regarding the setting of
the IPO parameters:
Assumption 1: Information quality p is sufficiently high compared to the costs of information
Cinfo, and the offering price F is not too low, so that informed bidding strictly dominates uninformed
bidding. It follows that investors enter the IPO game by producing information.
11
Assumption 2: Information quality is sufficiently high, bidding costs Cbid are not prohibitive-
ly high and the offering price F is not too low so that the equilibrium bidding strategy is to bid for one
share after producing the signal +S and to not bid after producing the signal −S .
Given Assumption 1 holds, investors enter the IPO game only by choosing to produce infor-
mation. Further, Assumption 2 ensures that the optimal bidding strategy post-information production
is pre-defined depending on the investor’s information. If the investor produces the information +S ,
bidding is dominant to not bidding. Otherwise, not bidding is dominant to bidding. Under these as-
sumptions, we derive a symmetric risk-neutral Nash equilibrium in mixed strategies for fixed-price
offerings.
Suppose that one investor (“investor i”), considers producing information about an IPO. Prior
to information production, the probability of bidding in the IPO is ( ) −+++ Θ−+Θ pp 1 . The first term is
the probability with which the investor produces the signal +S and the true value of the firm is +V ,
while the second term is the probability of a signal +S and the true value −V . The expected profit to
investor i from bidding depends not only on the offering price and the bidding costs, but also on the
probability π of receiving a share and hence on the other investors’ bidding behavior. Assume that
investor i produces a high signal and thus bids for one share. Further, assume that n – 1 (K ≤ n ≤ N)
other investors also decide to produce information, and m – 1 (K ≤ m ≤ n) other investors bid for a
share. Then, the probability of receiving a share is K / m. In the following, the binomial formula for
the probability that m investors out of n information producers bid for a share given the signal quality
p is denoted by ( ) ( ) mnm ppmnpnm −−⎟⎠⎞⎜
⎝⎛= 1,,β . Thus, for n ≥ K, investor i’s probability of allocation is
( )( )mKpnmnKmn /,1,1 ++
=++ −−Σ= βπ if the firm is of good quality and
( )( )mKpnmnKmn /,1,1 −+
=−+ −−Σ= βπ if the firm is of bad quality. If n < K investors produce informa-
tion, the IPO fails and the probability of allocation is 0== −+++nn ππ . It follows that the expected profit
from bidding is ( ) bidn CFV −−+++π if the firm is of good quality and ( ) bid
n CFV −−−−+π if the firm is
of bad quality. Note that the bidding costs are incurred irrespective of an allocation. Consequently, the
expected profit to investor i from producing information about the IPO given that n – 1 other investors
also produce information is
( )( )( ) ( ) ( )( )
( ) ( )⎪⎩
⎪⎨⎧
<−Θ−Θ
≥−−Θ−+−−Θ=
−+++
−−+−++++++
KnifCpp
KnifCFVpCFVpGE
bid
bidn
bidn
n 1
1 ππ
12
where
( )∑=
++++ −−=n
Kmn m
Kpnm ,1,1βπ and ( )∑=
−+−+ −−=n
Kmn m
Kpnm ,1,1βπ . (1)
In order to induce a rational, risk-neutral investor to participate in the IPO by producing in-
formation, this expected profit should at least offset the information costs Cinfo. With an increasing
number of other information producers, E(Gn) first increases as the probability of IPO failure decreas-
es. A further increase in the number of information producers then lowers E(Gn) since the probability
of receiving an allocation decreases.
In the symmetric risk-neutral Nash equilibrium, each investor chooses to produce information
with probability q (also called probability of participation) and chooses the certain outcome with prob-
ability 1 – q, where the probability that n out of N potential investors decide to produce information is
( )qNn ,,β . In equilibrium, all investors will choose their probability of participation in such a way as
the expected profit exactly offsets the costs of participation. Thus, investor i chooses the q that solves
( ) ( )∑=
=−−N
n
infon CGEqnN
1,1,1β .16 (2)
As an example, consider one set of parameters applied in the experiment below: N = 8, K = 2,
Θ = 0.5, +V = 120, −V = 0, Cbid = 5, ++p = 0.7, Cinfo = 8 and F = 42.50. The equilibrium participation
probability is q = 0.623.17 Note that this equilibrium does not constitute a social optimum. In the social
optimum, q would be chosen so that the overall expected profit from participating in the fixed-price
16 If K > 1, the fixed-price game also has a symmetric pure strategy equilibrium where all N investors reject
information production and choose the certain outcome instead. Irrespective of K, there are
N! / [n*! (N - n*)! + 1 asymmetric pure strategy equilibria where n* investors decide to produce information
and N - n* refrain from information production and choose the certain outcome instead. The equilibrium
number of investors producing information n* is the largest integer satisfying the condition that the LHS of
Equation (2) is greater than Cinfo. However, the pure strategy equilibria do not define which investors choose
to enter the game and which investors choose to stay out.
17 This entry probability in the mixed strategy equilibrium is very close to the proportion of investors choosing
to produce information in the pure strategy equilibrium. There, the respective value of n* is 5 (or
5/8 = 0.625), where E(Gn*) = 0.51. Thus, the fixed-price game is profitable in expectation with 5 investors
producing information.
13
game is maximized.18 If all other exogenous parameters are held constant, lowering the offering price
increases the expected profit to investors and in turn the LHS of Equation (2). For Equation (2) to
hold, investors react to an offering price decrease by raising the probability of participation, which
decreases the probability of allocation and drives the expected profit back to the information costs. If
the RHS of Equation (2) increases, i.e., the information costs rise, investors react by lowering the
probability of participation unless the expected profits are increased too. This is the main insight of the
fixed-price game: The issuer can maintain a certain level of information production if the downward
pressure on information production associated with a rise in information costs is counteracted by cut-
ting the offering price so that Equation (2) holds. By substituting Equation (1) for E(Gn) and solving
for F in the case of n ≥ K, Equation (2) can be rewritten as
( ) ( ) ( )( )( )
( ) ( )( )∑
∑
=
−+−+++++
=
−+++−−+−++++++
Θ−+Θ−−
Θ−+Θ−Θ−+Θ−−+−= N
nnn
N
n
bidnn
info
ppqnN
CppVpVpqnNCF
1
1
1,1,1
11,1,1
ππβ
ππβ. (2’)
Equation (2’) clarifies the relation between Cinfo and F. For a given “target” probability of par-
ticipation and fixed IPO parameters, both sigma sign terms are constant. Thus, the equilibrium offer-
ing price linearly decreases with information costs, where the intercept and the slope depend on the
IPO parameters and the target probability of participation.
3.3 AUCTION OFFERINGS
If the shares are sold using an auction offering, investors again decide on buying information
on the IPO firm first. If investor i decides to bid for a share based on the information, she pays bidding
costs Cbid and submits a (sealed) bid for a share of the firm. The allocation of the shares is based on
investor i’s bid and on the m - 1 bids submitted by the other bidding investors. Like in fixed-price of-
ferings, the IPO fails if m < K, in which case no shares are allocated to investors. Each bidding inves-
tor receives one share if m = K. In the case of m > K, shares are allocated to the K investors that sub-
mitted the highest bids.
18 In the social optimum, the marginal costs of IPO failure equal the marginal costs of entry and bidding in
expectation. In the example given previously, the social optimum implies q = 0.346, where E(G) = 3.21.
14
All investors who receive an allocation pay the same price for their share. We choose a uni-
form price mechanism as this is the dominant type used in most countries that allow auction IPOs
(e.g., Jagannathan and Sherman, 2006). The price paid by all winning bidders is set equal to the high-
est losing bid, i.e., the K+1-highest bid. This pricing rule is the multi-unit equivalent to a second-price
sealed bid auction. We apply this pricing rule since Vickrey (1961) shows that in such an auction, each
bidder’s dominant strategy is to bid his own true willingness to pay. This truth-revealing property en-
sures that in theory, prices in auction offerings reflect the information produced by investors.
Given these features, our auction mechanism can be described as a multiple-unit, second-price
sealed bid common value auction with endogenous entry and discrete signals. Deriving explicit equili-
brium bid functions in the presence of endogenous entry and discrete signals is a nontrivial task.
Campbell and Levin (2000) derive equilibrium bidding strategies in common value auctions with dis-
crete signals, but they consider first-price, single good auctions with an exogenous number of bidders.
Levin and Smith (1994) study common value auctions with endogenous entry in a continuous signal
setting.19 CL and Sherman derive equilibrium bidding strategies for an auction mechanism very close
to ours. However, they apply a rather academic signal structure. Specifically, they use signals that
fully reveal the true value of the IPO firm with very low probability, but are uninformative with high
probability. Such a design is unsuitable for an experimental study where the number of potential inves-
tors is relatively low since investors would produce uninformative signals in most IPOs.20 Further, the
noisy signals applied in our study are more realistic since both the production of a perfect signal and
the production of a completely uninformative signal are very unlikely in real-life IPOs. Cox et al.
(2001) run a laboratory experiment to study the bidding behavior in common value sealed bid auctions
with endogenous entry. In contrast to our treatment, they use a first-price mechanism where signals are
drawn from a continuous distribution. Also, the number of participants in the auction is announced
19 Other studies investigating auctions with endogenous entry and continuous signals include Menezes and
Monteiro (2000), Landsberger and Tsirelson (2003) and Ye (2004).
20 For instance, CL, pp. 25-31, use signal qualities of 2% and of 0.5% to demonstrate the information trade-off
between fixed-price offerings and auctions. This requires very large subject groups in order to obtain a suffi-
cient number of informative signals in an experimental IPO.
15
prior to the subjects’ bidding decisions. This allows them to resort to the equilibrium bid functions
provided in Kagel and Levin (1986) for common value auctions with exogenous entry.
While we leave the derivation of explicit equilibrium bidding strategies in our auction model
to auction theorists, we give some intuition for our expectation that the propensity to produce informa-
tion in the auction IPO game decreases with information costs, mimicing the explicit equilibrium de-
rived in models with the simplified signal structure. We expect that investors will bid competitively in
auction offerings irrespective of information and bidding costs. Such costs are sunk at the time of bid-
ding and thus are not relevant for the decision to bid (e.g., Menezes and Monteiro, 2000). Yet, bids
will vary as the true expected value of the shares is unknown to investors who observe neither the
number of other informed investors nor the value of their information. We suspect that whenever the
number of bidders exceeds the number of shares for sale (m > K), so that the offering price equals the
K+1-highest bid, underpricing will be low due to investors’ competitive bidding behavior. However,
when the number of bidders equals the number of shares (m = K), the shares are maximally under-
priced as the offering price equals −V . This case generates large expected profits to investors. The
probability of m = K decreases with the probability of participation. Consequently, the higher the in-
formation costs, the lower should be the probability of participation in order to increase the chance of
m = K. This effect induces a declining probability of information production with increasing informa-
tion costs.
The focus of this study is not on the derivation of explicit bidding strategies in theoretical
models, but on the extent to which the basic intuition of the IPO games are able to describe investors’
actual behavior. Recall that the models of CL and of Sherman build on the assumption that rational
investors fully grasp the sophisticated decision problems and behave according to the delicate mixed
equilibrium strategies. It is an open question whether these theoretical models allow drawing inference
on investors’ actual behavior. Our laboratory experiment allows us to investigate the effect of the of-
fering mechanism and the level of information costs on investors’ information production and bidding
decisions by controlling for all other IPO variables.
16
3.4 EXPERIMENTALLY TESTABLE HYPOTHESES
Based upon the preceding discussions we expect investor behavior in IPOs to differ with the
offering mechanism. If investors participate in the IPO, they first incur information costs, and, if they
bid for a share, bidding costs. The latter arise irrespective of the particular IPO or the particular offer-
ing mechanism. The focus of this study is on information costs. There are several reasons why the
costs of producing information differ from firm to firm. Some firms may engage in projects that are
more complex to evaluate than others, or the amount of publicly available information about the offer-
ing firms may differ. The aim of this study is to investigate the effect of both the offering mechanism
and the information costs on the propensity to participate and the bidding decision.
In fixed-price offerings, the discretion in setting the offering price supposedly allows the issu-
er to compensate investors for costs incurred in the offering process by adjusting the offering price
according to Equation (2’). In other words, by lowering the offering price the issuer can virtually in-
duce any desired level of information production up to full participation of investors. In the following,
we assume that issuers aim to achieve a certain “target” level of information production irrespective of
the information costs. The notion that the issuer can keep investors’ propensity to participate at a con-
stant level by lowering the offering price as information costs increase comprises our first hypothesis.
More formally:
H1: In fixed-price offerings, the propensity to participate can be held constant if investors are
compensated for higher information costs by a lower offering price according to the theoreti-
cal prediction in the fixed-price game.
Note that Hypothesis 1 is by no means trivial even though it sounds very intuitive that a lower
offering price attracts more attention and thus more interest in information production. The theoretical
solution to the fixed-price game shows that the expected profit depends not only on the offering price,
but also on other investors’ unobservable behavior for two reasons. First, the aggregate information
constitutes the secondary market price. Second, the allocation probability depends on other investors’
bidding decisions.
In contrast, if the issue price is determined by investors, we suspect that investors do not react
to a certain level of information costs by appropriately adjusting their bids, but by adjusting their pro-
17
pensity to participate. The reason is as follows. The fact that the bids determine the allocation of
shares should induce investors to bid competitively in auctions. This implies that investors ignore the
costs of information production and bidding and that they place bids at the expected share value. In
other words, investors do not appropriately lower their bids in the case of high information costs. As a
consequence, the level of underpricing in the auction offering is too low to compensate investors for
the costs of information production. If investors bid competitively, they have to adjust their probability
of participation in order to avoid negative expected profits from participating in the IPOs. This argu-
ment results in the following two related hypotheses:
H2: In auction offerings, the propensity to participate decreases with information costs.
H3: In auction offerings, investors bid competitively, i.e., they bid their expected value irrespective
of the level of information costs.
4. Experimental Design and Procedure
4.1 PARTICIPANTS
Overall, 168 students from the University of Münster volunteered to participate in the experi-
ment. About 18% of the students were female, and more than 90% were majoring in Business or Eco-
nomics. The median participant was 23 years old, had been studying for six semesters at the time of
the study, and had a medium level of experience in financial markets as well as game theory, which is
reflected in a median score of three on a scale from one (very low experience) to six (very high expe-
rience) in both fields. Descriptive information about the participants is summarized in Table I.
[Insert Table I about here]
4.2 PROCEDURE
The experiment was conducted in seven sessions in a networked computer laboratory at the
University of Münster, Germany. Each experimental session lasted about two hours. Each of the 24
students in a session was provided a written copy of the instructions, a ballpoint pen and paper for
18
notes and was seated at a computer terminal.21 The computer terminals were furnished with blinds in
order to ensure that participants could not look at other screens. Communication between the partici-
pants was prohibited. At the beginning of each session, the instructions were read out loud to the stu-
dents by the instructor. Afterwards, the instructor answered remaining questions to ensure that each
participant completely grasped the decision situations in the experiment. Prior to the experimental
sessions, we extensively tested the computer systems as well as the understandability of the instruc-
tions by running three pre-test sessions.
The experiment consisted of 22 rounds. The first two rounds were taken as practice rounds and
were not included in the analysis. In each round, each of the 24 students was randomly assigned to one
of three groups of equal size.22 Then, the eight students in each group got the opportunity to partici-
pate in an IPO as investors. The IPOs in a round were identical for the three groups of investors. The
participants were not made aware of the identity of the other investors in their groups.
Each student was given an endowment of 150 monetary units (MU) in a fictitious, interest-free
account in each round. This endowment could be used to participate in this round’s IPO. The part of
the endowment not used for participating in the IPO remained in the account until the end of the
round. If the student participated in the IPO and received an allocation, the share was entered into a
fictitious security account. Costs incurred in a round as well as the share price in case of an allocation
were deducted from the current account. The account balances of one round did not affect the balances
of subsequent rounds.23 After finishing the 22 rounds, one round was randomly selected. Each student
21 For an English translation of the instructions including graphical displays of the decision screens see Appen-
dix A.
22 The random rematching in each round aimed to prevent tacit collusion among the subjects and to avoid learn-
ing about the other investors’ behavior. Even though the evidence on the effect of random rematching is
mixed (Andreoni and Croson, 2008; Schmidt et al., 2003), we believe it is the best compromise for producing
a large number of observations with a reasonable number of subjects while mitigating the influence of the
history of play. In the analyses we control for history of play effects and for within-session effects by apply-
ing panel data models.
23 Accounts for each round were treated separately in order to avoid any effect of the cumulated balances on
participation and bidding behavior. See Ham et al. (2005) for a discussion of (cash) balance effects.
19
received the Euro-equivalent of the balance of the respective current and security account for the se-
lected round. Monetary units were converted into Euros at a rate of 10 MU = 1 Euro.
In each round, the students were presented the offering characteristics of an IPO, i.e., N, K,
+V , −V , Θ, p, Cbid, Cinfo, the offering mechanism and, in the case of a fixed-price offering, the offer-
ing price F. Most of the IPO parameters were identical in all IPOs: In each IPO, N = 8 investors got
the opportunity to submit a bid for one share of an IPO firm. Overall, K = 2 shares with the same true
value were sold in each IPO. The true value of the shares of the IPO firm was +V = 120 MU or
−V = 0 MU with equal a priori probability (Θ = 0.5). The share quality was supposed to be randomly
drawn for each IPO. However, unbeknownst to students, in each session shares in eleven IPOs were of
good quality and shares in eleven IPOs were of bad quality.24 This was done to simplify data analysis
and aggregation. The information quality was p = 70%. The bidding costs were set to 5 MU in all
IPOs.
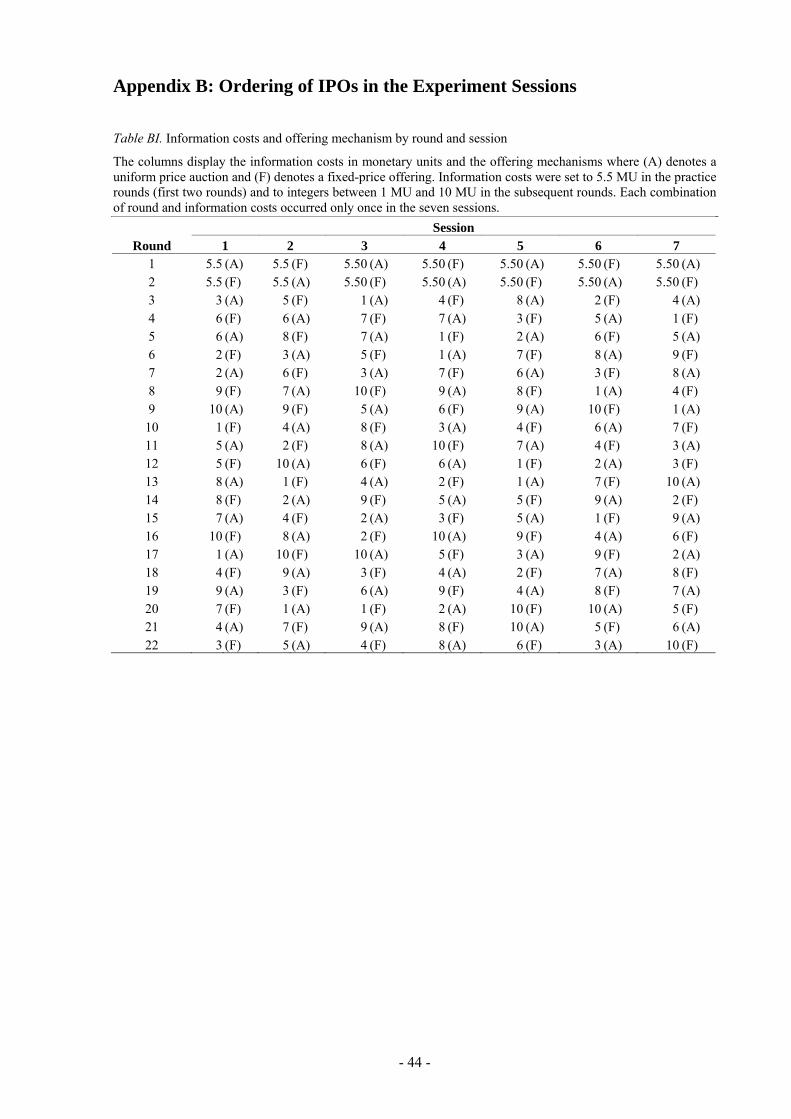
While the IPO parameters given above were identical irrespective of round and session, the of-
fering mechanism as well as the information costs varied from round to round.25 In the first two prac-
tice rounds, information costs were set to 5.5 MU in each session. The information costs in the follow-
ing rounds were integers between 1 MU and 10 MU. They were assigned so that each combination of
offering method and information costs (2 * 10) appeared only once. We defined the fixed-price and
the auction offering round with the same information costs as a pair. Within each of the ten pairs of a
session, the allocation of the 24 students to the three IPOs per round was identical in order to be able
to analyze the difference in information production behavior associated with a mechanism change in a
pure within-subject design. Except for the two practice rounds, each combination of round and infor-
mation costs (10 * 10) appeared at most once in the seven sessions. This design aimed to eliminate
potential order effects.
24 See Appendix B for details on the information costs and offering mechanism by round and session.
25 Regarding the offering mechanism, fixed-price offerings and auction offerings alternated from round to
round and the starting mechanism was counterbalanced. Of the 22 rounds of each session, eleven rounds
comprised fixed-price offerings and eleven comprised auction offerings.
20
In fixed-price IPOs, variations in information costs were accounted for by choosing an offer-
ing price that was supposed to keep the participation ratio at a constant level according to the theoreti-
cal prediction in Equation (2’). The target probability of participation maintained in all fixed-price
offerings was five out of eight investors, or 62.5%. The offering prices corresponding to the informa-
tion costs { }10,...,1∈infoC were 67.5, 64.0, 60.5, 57.0, 53.5, 49.5, 46.0, 42.5, 39.0 and 35.5 MU
(rounded to 0.5). Overall, in these parameter settings informed bidding is strictly dominant to unin-
formed bidding and not bidding is dominant after producing a low signal in fixed-price offerings, i.e.,
Assumptions 1 and 2 hold.
Having learned about the offering characteristics of an IPO, the subjects principally faced the
multi-stage decision problem described in the previous section. Figure 1 presents a sketch of the deci-
sion tree that is taken from the instructions. Initially, students decided whether it is worth producing
information about the IPO. If a student decided to produce information, the decision of whether to bid
for a share depended on the information. Next, if a student decided to bid, the total gain or loss de-
pended on whether she received an allocation and ultimately, on the quality of the share. In both deci-
sion situations students were assisted by an IPO simulator. In fixed-price offerings the simulator could
be used to calculate the probability of receiving an allocation depending on the number of other bid-
ders in the IPO and the gains or losses from participating contingent on allocation and share quality. In
auction offerings, the simulator could be used to calculate the gain or loss from participating contin-
gent on the number of bidders, the third bid and the own bid being below or at least equal to the third-
highest bid.26
[Insert Figure 1 about here]
Note that a student who decided to forgo producing information was not allowed to bid for a
share. This abstracted from reality, where investors can also choose to bid in an IPO without buying
information. We rationalize our simplification by the fact that uninformed bidding is dominated by
informed bidding. As we do not want to test the extent to which investors are capable of understanding
the dominance relation between uninformed and informed bidding, we ease the decision problem by
tying participation in the IPO to information production.
26 For graphical displays of the decision screens, the IPO simulators and the result screen, see Appendix B.
21
If the IPO took place, the two shares were priced and allocated according to the rules de-
scribed in the previous section. Each student was told about the overall status of this round’s IPO and
about her individual outcome within this round. The former includes information about whether the
IPO took place, the number of investors who bid for a share and, if applicable, the offering price. The
latter includes information about whether the student received an allocation and detailed statements of
her current and security accounts. If the student received an allocation, the share was entered into the
security account at the offering price. The true value of the shares was not revealed to any of the stu-
dents, except for in the round drawn to determine the students’ compensation in Euro for participating
in the experiment, in which case the true value would be disclosed at the end of the experiment ses-
sion. Even though irrelevant with fully rational subjects, in the case of bounded rationality this ap-
proach prevents subjects from falling prey to the gambler’s fallacy. However, students were informed
about their gains or losses depending on share quality. By running seven sessions comprising 20
rounds (without practice rounds) and 3 IPOs per round, we yield 21 IPOs for each combination of
offering mechanism and information costs.
5. Results
5.1 SUMMARY STATISTICS ON IPO SUCCESS
Overall, we observe 420 IPOs by running seven sessions with 60 (ten rounds per offering me-
chanism times three IPOs per round) IPOs each. The propensity to participate in the IPOs by produc-
ing information is rather high as reflected in an average number of participants of 6.5 out of eight.
Some IPOs failed because investors decided to forgo the investment opportunity after producing in-
formation. Table II exhibits statistics on IPO frequency and failure by offering mechanism and infor-
mation costs.
[Insert Table II about here]
The vast majority of IPO failures occur within fixed-price offerings with bad share quality.
This is in line with the theoretical prediction as investors cannot react to adverse information by ad-
justing their bid level but only by forgoing the investment. Accordingly, we observe only very few
failures in the case of auction offerings. The sum of failed IPOs is negatively, albeit not significantly,
22
correlated with information costs, which is reflected in a Spearman’s rank correlation coefficient of -
0.31 (p-value = 0.383).
5.2 THE PROPENSITY TO PARTICIPATE IN THE IPOs
The average number of participants compared to the total number of potential investors meas-
ures the propensity to participate in the IPOs by producing costly information and thus allows us to
test our Hypotheses 1 and 2. Figure 2 shows the average number of participants in the 21 IPOs by
information costs and offering mechanism. The exact figures as well as results of significance tests are
presented in Table III.
The black line in Figure 2 shows that investors’ participation in fixed-price offerings is virtual-
ly unrelated to information costs. The result of a Kruskal-Wallis rank test confirms this observation:
Given a p-value of 0.8516, the null hypothesis that the ten populations of 21 fixed-price offerings are
equal cannot be rejected. Apparently, the students understand the trade-off between information costs
and underpricing. Thus, we cannot reject Hypothesis 1. Indeed, the propensity to participate in the
IPOs is unaffected by information costs if investors are compensated for higher information costs by a
lower offering price. The overall participation in fixed-price offerings is higher than predicted by the
mixed-strategy equilibrium solution. While the predicted number of entries is five, we observe an av-
erage participation between 5.9 and 6.4. A Wilcoxon signed rank test reveals that these differences are
highly significant (p-values between 0.0105 and 0.0001). This result contrasts to other experimental
studies of market entry with strategic and outcome uncertainty. Rapoport et al. (2002) observe that the
probability of entering is very close to the equilibrium for equilibrium entry probabilities in the range
of 40% to 70%. Cox et al. (2001) analyze entry behavior in a common value auction. They find fewer
entries than predicted by the mixed-strategy equilibrium. Possible explanations for over-participation
are risk-seeking behavior, overinvestment in information production due to overconfidence (Ko and
Huang, 2007; Camerer and Lovallo, 1999) or simply that students might attach some utility to gam-
bling in this experimental setting (Conlisk, 1993).
[Insert Figure 2 about here]
Regarding the auction offerings, Figure 2 shows that for information costs greater than 2 MU,
the number of participants monotonically decreases from 7.7 to 5.2 participants on average in the case
23
of information costs of 10 MU. In line with this observation, the Kruskal-Wallis test strongly rejects
the hypothesis of equality of populations (p-value = 0.0001). Thus, we cannot reject Hypothesis 2: In
auction offerings, the propensity to participate decreases with increasing information costs. We con-
jecture that the marginal increase at very low information costs can be ascribed to the very high over-
all participation rate.
A comparison of offering mechanisms shows that the number of participants is higher in auc-
tion IPOs up to information costs of 7 MU. For information costs exceeding that level, more investors
participate in the fixed-price offerings. The last column of Table III reveals that based on a Wilcoxon
signed rank test, the difference in participation is highly significant for information costs up to 6 MU
and for information costs of 10 MU. A critical reader might object that even though the level of infor-
mation production is endogenous in the auction offerings, it is set arbitrarily in the fixed-price offer-
ings. Nevertheless, this result strongly supports the notion that if information costs as well as the pre-
ference for information production are high, auctions are not the preferred offering mechanisms, but
rather mechanisms that allow discretion in setting the offering price. These findings are in line with
the theoretical predictions in CL and Sherman.
[Insert Table III about here]
We verify our results for the aggregate level by an analysis of the determinants of investors’
individual participation decisions. For this purpose we estimate the influence of information costs and
several control variables on the probability of taking part in an IPO using random-effects (RE) logistic
regressions. Due to the fact that we observe 168 subjects and 20 participation decisions per subject, the
use of panel data models is most appropriate.27 We specify the participants as the random effects in
27 For further examples of the application of panel data econometrics to laboratory experiments and discussions
of its benefits see Ham et al. (2005) or Harrison (2007).
24
order to account for individual heterogeneity in the data.28 In order to account for a potentially better
understanding of the decision situations over the course of a session, the variable round is included in
the regression. The other explanatory variables are supposed to control for participants’ personal cha-
racteristics. We include age, the number of semesters enrolled, a dummy variable for gender (where
female equals 1), and the participants’ experience in financial markets as well as in game theory. Note
that the offering price is not included in the regression for fixed-price offerings since in our design
(i.e., with a constant q) the offering price is a linear transformation of information costs. Table IV
present the results of the RE logistic regression estimations for both offering mechanisms.
[Insert Table IV about here]
The odds ratios for information costs and the associated p-values strongly support our findings
for the aggregate level. The odds ratio is close to one and insignificant for fixed-price offerings, which
confirms that Hypothesis 1 cannot be rejected, i.e., participation is independent of information costs if
the offering prices are appropriately adjusted. For auction offerings, however, the information costs
odds ratio is highly significant. Since its value is below one, higher information costs lower the proba-
bility of participating in the IPO, which is in line with Hypothesis 2. The insignificant odds ratios of
Round indicate that the subjects’ probability of producing information did not change over the course
of the experiment. The remaining control variables reveal that being a female student significantly
lowers the probability of participating in auction offerings in a statistical as well as an economic sense.
The aversion of female students to auction offerings might be explained by a generally higher risk
aversion, less overconfidence or a better understanding of the difficulty with which costs are recovered
in auction offerings. While the latter is just a conjecture, the two former points have been observed by
several experimental researchers (e.g., Croson and Gneezy, 2004). The values of ρ reveal that more
than 40% and 50% of the total variance in the fixed-price offerings and the auction offerings, respec-
28 The sessions might be a second source of unobserved heterogeneity as individual decisions within a session
might be correlated although we randomly rematch the subjects in each round. A fixed-effects model would
allow for within-session correlation, but is not appropriate for our data as we are also interested in the effects
of several time-invariant control variables that would be dropped in fixed-effects models. In an analysis not
reported here we account for within-session correlation by including session dummy variables (e.g.,
Wooldridge, 2002, p. 288). The results indicate that within-session correlation is negligible in our data.
25
tively, is contributed by the individual heterogeneity. Overall, the regression model significantly ex-
plains the participation in auctions, but not in fixed-price offerings.
5.3 INVESTORS’ BIDDING BEHAVIOR IN AUCTION OFFERINGS
Hypothesis 3 states that investors bid competitively in auction offerings. Competitive bidding
means that investors do not appropriately lower their bids in the case of higher information costs. As a
consequence, the level of underpricing in the auction offering is too low to compensate investors for
the costs of information production. If investors bid as described above, they have to adjust their prob-
ability to participate in order to avoid negative expected profits from participating in the IPOs. There-
fore, Hypothesis 3 is related to Hypothesis 2: Decreasing the probability of participating with increas-
ing information costs is the rational response to competitive bidding, and vice versa. As we already
found strong evidence for a negative relation between information costs and the probability of partici-
pating in the previous section, we also expect investors to bid competitively.
We proceed in two steps in order to investigate investors’ bidding behavior. First, we analyze
the levels of investors’ individual bids. Second, we study the extent to which the individual bid levels
and the resulting offering prices yield positive or negative profits from participation on average. If
investors correctly adjust their participation probability to their bids, the total profits to investors in the
auction offerings are equal to zero on average and are independent of information costs. As a result,
investors coordinate their information production and bidding behavior in such a way that they can
achieve an equilibrium.
Table V provides information about the distribution of bids in auction offerings by type of in-
formation and information costs. Indeed, investors seem to bid competitively since the mean bid levels
do not show a clear relation with increasing information costs.
[Insert Table V about here]
In order to gain deeper insight into the determinants of the bid levels, we regress the levels of
individual bids on information costs, the round and the control variables described previously. Here,
the use of a linear regression model allows us to directly control for individual heterogeneity as well as
for session heterogeneity by including the sessions as a second random effect in the model. The results
26
of the two-way RE regression estimations (Table VI) confirm our conjecture of independence between
information costs and bid levels after low signals, but reject this conjecture after high signals. In the
latter case, investors significantly lower their bids with increasing information costs after high signals.
However, the adjustment of -0.43 for a one-unit increase in information costs is very small compared
to the adjustment of -3.6 on average that is necessary to keep participation at a constant level in fixed-
price offerings. Hence, this finding suggests that investors insufficiently adjust their bid levels. Irres-
pective of the kind of information, the variable round has a positive and highly significant impact on
the bid level. It implies that investors raise their bids in later auctions, i.e., they bid more competitively
over the course of the experiment. The effect of increasingly competitive bidding also outweighs the
moderating effect of increasing information costs on bid levels. The control variables do not signifi-
cantly affect bid levels.
[Insert Table VI about here]
Even though these results point to competitive bidding, the actual competitiveness of inves-
tors’ bidding behavior depends on the adjustment of the probability of participating. For example,
investors might adjust their probability of participating in such a strong way that they could bid even
more competitively to drive the expected profit from participation down to zero. In order to take into
account the interrelation with the decision to participate, we analyze the resulting offering prices in the
auction offerings and the total profits of investors from participating in auction offerings. We calculate
the total profit of investors for each IPO by adding up the fair values of the shares and deducting the
offering prices and the sum of information costs and bidding costs. The fair value equals the expected
value of the shares when taking into account all information in this IPO and thus is calculated using
Bayes’ law. In an efficient secondary market where prices reflect all available information, the shares
should trade at this fair value. Table VII summarizes the mean offering prices, fair values and total
profits of investors by offering mechanism and information costs.
[Insert Table VII about here]
At first sight, the fact that the offering prices in auction IPOs decrease with increasing infor-
mation costs seems to be at odds with the competitive bids observed on the individual bidding level.
However, this phenomenon can be explained by the decreasing number of bidders. The lower the
27
number of bidders in the auction, the greater is the probability that the K+1-highest bid (i.e., the offer-
ing price) is below the mean bid.29 In most cases, the offering prices in high true value auctions are
higher and those in low true value auctions are lower than the respective offering prices in fixed-price
IPOs.
The analysis of total profits in the IPOs shows that investors lose money in fixed-price offer-
ings on average, which reflects the previous observation of overparticipation. However, in most cases
investors realize even larger losses in auction offerings, which indicates that investors’ participation
and bidding behavior in the auction offerings does not constitute an equilibrium either. In other words,
investors either bid too competitively or insufficiently adjust their probability of participating. A fixed-
effects (FE) regression analysis of the determinants of total profits shows that the offering mechanism
significantly influences the total profit of investors (Table VIII).
[Insert Table VIII about here]
To be more precise, a change from the auction to the fixed-price mechanism increases the total
profit by about 14.5. In the light of these results, Hypothesis 3 cannot be rejected. Given the observed
adjustment of the probability of participating, investors bid too competitively to generate zero or posi-
tive expected profits on average. This effect becomes even more severe with increasing information
costs since an increase in information costs by one unit decreases the total profit by 2.7 on average in
auction offerings.30
The overly competitive bidding indicates that investors fall prey to the winner’s curse, a phe-
nomenon commonly observed in experimental studies on common value auctions. For instance, Kagel
et al. (1995) find evidence that bidders suffer from a winner’s curse in second-price common value
29 A fixed-effects regression of the offering price on information costs, round and the number of bidders con-
firms this conjecture. On average, the existence of one more bidder in an auction offering increased the offer-
ing price by 4.8 if the true value is 120 and by as much as 8.0 if the true value is 0.
30 Table VIII also reveals that investors do not converge to the equilibrium solution over the course of a session
since the coefficient on Round is small and insignificant. We conjecture that given the complexity of the de-
cision situations, the sessions with 22 rounds were too short to observe a gradual convergence to the equili-
brium solution through an improved understanding of the decision situation.
28
auctions with a fixed number of bidders. Cox et al. (2001) observe a winner’s curse in a first-price
common value auction with endogenous entry.
5.4 IMPLICATIONS FOR THE ISSUER’S CHOICE OF AN OFFERING MECHANISM
In light of these findings regarding investors’ information production and bidding behavior in
IPOs, the issuer should choose the optimal offering mechanism given his preferences for offering
proceeds and information production. Based on our experimental data, Figure 3 exhibits the superiori-
ty of the offering mechanism in our laboratory experiment by information costs and the weighting of
information production. Superiority is determined by comparing the offering mechanisms with respect
to the sum of the mean offering price per share plus the mean number of information producers times a
weighting factor.31 Filled grey areas indicate the combinations of information costs and weighting
factor for which fixed-price offerings are superior to auction offerings, whereas shaded grey areas
indicate combinations for which auction offerings are superior.
[Insert Figure 3 about here]
Figure 3 shows that for a wide range of medium information costs and medium information
weighting, auctions are indeed the superior mechanisms. However, if both information costs and in-
formation weighting are low, or if both are high, fixed-price offerings are superior. The first, rather
surprising observation follows from the relatively low offering prices in auctions with very low infor-
mation costs (see Table VII). Here, the higher prices in fixed-price offerings outweigh the superior
information production in auctions if information weighting is low. The second observation is in line
with our expectation. Issuers who feel that information production is costly but have a high preference
for such activity should choose a fixed-price offering. Therefore, our experimental results provide a
solution to the IPO auction puzzle. Since the bulk of IPO firms are young, less well-known firms op-
erating in new and risky businesses, they can be located in the upper right corner of Figure 3. Conse-
quently, such firms should care for a sufficient level of information production by choosing an offer-
ing mechanism other than auctions. Nevertheless, an auction is the preferable offering mechanism of
large, established or well-known firms that decide to go public, e.g., in the course of a privatization.
31 The relevant price in auction offerings is the (unweighted) average of the mean price of good quality firms
and the mean price of bad quality firms as ex ante the true value is unknown to the issuer.
29
6. Conclusion
This study contributes to the literature on IPO mechanisms by analyzing investors’ behavior in
fixed-price and auction offerings via a laboratory experiment. Our experimental design is based on the
theoretical model by CL. The central argument is that issuers not only care about offering proceeds,
but also about the level of information production by investors in IPOs. However, the incentives for
producing costly information differ with the offering mechanism. Our experimental findings strongly
support the theoretical argument. In fixed-price offerings, the issuer can maintain investors’ propensity
to produce information by appropriately adjusting the offering price even if information costs are high.
This result also applies to the bookbuilding mechanism where the issuer has similar discretion in set-
ting the offering price. In auctions, however, high information costs inevitably result in a low propen-
sity to produce information. This is a consequence of investors’ competitive bidding, i.e., their insuffi-
cient adjustment of bid levels to increasing information costs. Given their bidding behavior, investors
also insufficiently adjust their information production to increasing information costs. Our results sug-
gest that an auction is not the preferable offering mechanism for young and risky IPO firms since the
costs of producing information about such firms are high, but there is also a strong need to generate
information. Since these are the characteristics of the bulk of IPO firms, our findings explain the
worldwide predominance of fixed-price and bookbuilding offerings.
- 30 -
Appendix A: Instructions for the experiment “IPOs in the lab” (translated from German)
A warm welcome to the experiment “IPOs in the lab”. In this experiment you will have the opportunity to invest in different Initial Public Offerings (IPOs). In the following, we will describe the experiment to you and we will also explain the decision situations you will be facing during the course of the experiment. First of all, we will discuss how the experimental IPOs work. We will then study two examples of IPOs in more detail using screen shots of the experiment software. After we have read through the instructions together, you will have the opportunity to ask any further questions con-cerning the experiment. From now on until the end of the experiment please do not talk to your neighbours.
1 General issues
In this experiment you can take part in 22 consecutive IPOs. For every IPO we create an imaginary current account and a deposit account for you. Your deposit account is initially empty in each IPO. In your current account you find a budget of 150 monetary units (MU) in each of the IPOs. You can use this budget to take part in the respective IPO. If you choose not to take part in an IPO, this money remains in your current account without interest payment. If you buy a share, this share is deposited in your deposit account. Please note that the balances of your current account and your deposit account in one IPO have no influence on the following IPOs. At the end of the experi-ment one IPO is randomly drawn. You will be paid the Euro equivalent of your current account bal-ance and your deposit account balance in this particular IPO. The exchange rate is 10 to 1, i.e., 10 MU is 1 Euro.
In each IPO there are 8 investors involved. However, there are 24 people sitting in this room. This means that there always take place three independent IPOs simultaneously. The allocation of investors to the three IPOs is drawn randomly and will not be announced. Note that prior to each IPO you are again randomly assigned to one of the three groups. Thus, the other investors who take part in an IPO with you change from IPO to IPO.
In each IPO a company offers exactly 2 identical shares. If you wish to take part in the IPO, you can purchase exactly 1 share. We will explain the rules regarding the purchase of shares to you later on. Firstly, let us have a closer look at these shares. Each share has a true value that was ran-domly determined prior to the IPO. It may be either 120 MU or 0 MU. However, this true value is unknown to all of you. The only fact you know is that in each IPO there is a 50% probability that both shares have a value of 120 MU and a 50% probability that both shares have a value of 0 MU. The true value of the shares will not even be announced after the IPO. We will only announce the value of the shares in that IPO which is randomly selected at the end of the experiment in order to determine your payment.
The rules described above, i.e., a budget of 150 MU, 8 investors per IPO, 2 shares per IPO with a 50/50 probability that both are worth either 120 MU or 0 MU, are identical for each of the 22
- 31 -
IPOs. Yet, the rules regarding the pricing of each share and the allocation to the participating investors differ. In this experiment, 11 of the 22 IPOs will take place via a fixed-price mechanism and the other 11 via an auction mechanism. We will now explain to you how both these offering mechanisms work. 2 Offering mechanisms 2.1 Fixed-price offerings
The fixed-price mechanism is characterized by the fact that the shares are offered for sale at a predetermined price. You are notified of this price before the start of the IPO. The price is deter-mined without any knowledge of the actual share price. Therefore, this offering price is completely independent of the actual value of the shares. If you decide to participate in a fixed-price offering, you pay the predetermined fixed price, given you receive an allocation. Whether you actually receive an allocation in the case that you bid for a share depends on the decisions of the other 7 investors. If you are the only investor who bids for a share, the IPO fails as not all shares can be sold. Therefore you do not purchase a share. If one other investor, in addition to yourself, decides to bid for a share, the IPO takes place and both of you purchase one share each at the predetermined offering price. If more than one other investor, in addition to yourself, decide to bid for a share, there are more investors than shares. Therefore, a draw takes place in order to determine which investors receive an allocation, i.e., purchase the shares. The more investors bid for a share, the smaller is your chance to receive an allocation. The probability of an allocation is calculated as the total number of shares divided by the number of bidders. Table 1 below summarizes the rules of the fixed-price offerings.
Allocation No allocation (IPO fails) Both bidders receive
1 share
Lottery (Probability of receiving a share =
Number of shares/ Number of bidders)
- 32 -
2.2 Auction offerings
If you decide to participate in an auction offering, you need to place a limit bid for one share, i.e., you need to indicate the limit price you are willing to pay at the most. You may freely choose a limit price between 0 MU and 120 MU. Whether you receive an allocation and if so, the offering price you have to pay for that share, not only depends on your bid but also on the other investors’ bids. If you are the only investor who bids in the auction, the IPO fails as not all shares can be sold. There-fore, you do not purchase a share. If one other investor, in addition to yourself, decides to bid for a share, the IPO takes place and both of you receive an allocation. If more than one other investor, in addition to yourself, bid in the IPO, the two investors who bid the highest price will receive one share each. If more than two investors bid the same price, so that no single highest or second highest bid can be determined, the equal bids enter into a draw.
The offering price depends on the bids placed by the investors. The type of auction applied here is known as a uniform-price auction. This means that the two highest bidders pay the same offer-ing price. The offering price paid by the two highest bidders equals the limit price of the third highest bid. It may surprise you that not the bids of the two highest bidders, but the bid of the third highest bidder, the one who just does not receive an allocation any more, determines the offering price. How-ever, we carefully chose this auction mechanism since auction theorists have shown that in this mechanism, all bidders have the incentive to bid the limit price that they are really willing to pay for the share. Due to time restrictions here we cannot explain this reasoning in detail. Yet, you should keep in mind that it is not worth your while to bid a price that does not reflect your true willingness to pay. You may now wonder what happens if only two investors bid for a share, i.e., there is no third highest bid to determine the offering price. In this case, we assume that the third highest bid is 0 MU, so the offering price is 0 MU for the two bidders. Table 2 below summarizes the rules for the auction offerings.
Table 2: Rules for the auction offerings
1 bidder 2 bidders More than 2 bidders
Offering price Not available Set to 0 MU Third highest bid
Allocation No allocation (IPO fails) Every bidder receives
one share The bidders with the two highest bids purchase one
share each
After we have explained the theory of the experiment to you, we would now like to continue and discuss the decision situations and the choices that you face during the experiment.
- 33 -
3 Decision situations and your choices
In each IPO you may face up to two decisions. Figure 1 provides a sketch of the decision tree in the experiment. We will discuss the different decisions in more detail below.
Figure 1: Sketch of the decision tree in the experiment
First of all you decide whether you would like to buy information about the IPO. In each IPO you can only purchase one piece of information. Information helps you to estimate the true value of a share more accurately. The piece of information tells you either “120 MU” or “0 MU”. Unfortu-nately, this information has only a 70% probability of being correct. Let us look at the following example in order to completely grasp this idea. Imagine you have an urn in front of you that contains 10 balls. On 7 of these balls the correct value of the share is written and on the other 3 the wrong value is written. Buying the information is equivalent to reaching into the urn and pulling one ball out. In 70% of the time you will pull out a ball which shows the correct value of the share (i.e., the correct information) and in 30% of the time you will pull out a ball which shows the wrong value of the share (i.e., the wrong information). Each investor has such an urn in front of him in each IPO. Since each of you draws one ball out of his own urn, the information that each investor receives varies, although the true value of the shares (and hence, the composition of the urns) is the same for everyone. The only difference is that some people receive the correct and some the false information.
If you receive the information “120 MU”, you know that there is a 70% chance that the shares have a value of 120 MU. Obviously, if you receive the information “0 MU”, the shares have a 70% chance of having a value of 0 MU. In reality, the purchase of information about the true value of a share is expensive and therefore, is also associated with costs in this experiment. These information costs vary from IPO to IPO.
“Is it worthwhile to par-ticipate by producing information about this IPO?”
1
2
3
4
1. Decision: Produce information?
2. Decision: Bid?
“Is it worthwhile to bid in this IPO?”
Depending on information
Yes
No
Yes
No
Profit/Loss
0
- Information costs
- Information costs - Bidding costs (5 MU)
- Information costs - Bidding costs (5 MU) - Price of a share + Share (120 MU or 0 MU)
Allocation
No alloca-tion
- 34 -
If you do not purchase information in an IPO, you do not consider this IPO further and cannot place a bid for the shares. You neither make a profit nor a loss in this IPO (situation in Figure 1).
If you purchase information, your second decision is whether you would like to bid for a share in the IPO. Please note that you can only bid for a share if you have bought the information in this IPO. Initially this may surprise you, but the reasoning is that in this experiment you do not take the role of a private investor, but the role of a large, institutional investor (for example a pension fund or an insurance company). These investors thoroughly analyze the value of an IPO before deciding whether or not to bid for a share. If you decide it is not worth investing in the IPO after receiving the information, your loss equals the information costs (situation in Figure 1).
If you decide to bid in an IPO, you pay the bidding costs of 5 MU (in addition to the previ-ously mentioned information costs). These costs are constant throughout the experiment. They repre-sent various fixed costs that investors incur in reality, including bank charges. If you have placed a bid, but you do not receive an allocation, your loss is equal to the information and bidding costs (situation in Figure 1). In case you receive an allocation, you make a profit if the share is worth 120 MU and a loss if the share is worth 0 MU (situation in Figure 1).
We will now briefly summarize the decision situations shown in Figure 1. In your first deci-sion situation you have to weigh up the costs from purchasing information regarding the IPO against the chance of a profit from this information. This profit is uncertain as you do not know the actual value of the share and your allocation of the share depends on the other investors’ decisions. With the fixed-price method, the uncertainty of the profit depends on the decisions of the other investors as the probability of receiving a share decreases with an increasing number of bidders. With the auction method, the uncertainty of the profit depends on the decisions of the other investors as the level of the profits and the allocation of the shares is directly related to the other investors’ bidding decisions.
After purchasing the information, you need to decide whether to bid for a share. If the infor-mation states “120 MU” bidding is more attractive as there is a 70% probability of making a profit (situation in Figure 1). If the information states “0 MU”, bidding is less attractive as the chance of making a loss is 70%.
In each case, your chance of receiving a share depends on the decisions of the other 7 inves-tors. However, you cannot observe the other investors’ decisions. That is, at the time you make your decisions you know neither how many other investors purchase information nor how many wish to bid in the IPO.
- 35 -
4 Examples 4.1 A fixed-price IPO
In the following section we will look at an example of an IPO using the fixed-price method. Figure 2 displays the first screen that you will see in a fixed-price IPO. In the title you see the name of the experiment and the number of the IPO. The window below the header contains all the necessary information about this IPO, so that you can think about your first decision (whether to buy informa-tion).
The section under the window header “Decision: Buy information” contains all the informa-tion which is identical for every IPO; 8 investors, 2 shares, an information quality of 70%, bidding costs of 5 MU, your budget of 150 MU and that both shares have a 50% probability of being worth either 120 MU or 0 MU.
Figure 2: First decision in a fixed-price offering
Number of investors: 8
Number of shares: 2
Information quality: 70%
Bidding costs: 5.00 MU
Budget: 150.00 MU
Here you may calculate your probability of allocation depending on the bidding decisions of the other investors.
Value of a share: 50% -> 120.00 MU 50% -> 0.00 MU
Experiment “IPOs in the lab”
IPO No. 1
Decision: Buy information
Simulator
Do you want to buy information about the value of a share in the IPO No. 1?
NOTICE: If you choose yes, you pay the information costs and receive a piece of information about the true value of the shares on the following screen. This information is correct with a probability of 70%. After you have got the information, you can decide whetheryou want to bid in the IPO.
NOTICE: If you choose no, you do not participate in the IPO. You do not incur any costs.
Yes No
Offering mechanism: Fixed-price
Offering price: 48.00 MU
Information costs: 6.50 MU
- 36 -
Below the section with the general data you find the specific data for this IPO: The offering mechanism is fixed-price, the offering price is 48.00 MU and the information costs are 6.50 MU. In the bottom section of the screen you make your decision by pressing either the “Yes” or the “No” but-ton. Below both buttons there are brief reminders stating the consequences of pressing the buttons.
You now face a complex decision problem. If you pay 6.50 MU, you receive information which has a 70% probability of giving you the true value of the shares.
• Let us assume that you receive the information “120 MU”, decide to bid for a share in IPO No. 1 on the basis of this information, incur the bidding costs of 5 MU and then, receive an allocation. [Please note: This is only an assumption regarding your choice and does by no means imply that this would be the “correct” decision.]
o If the actual value is 120 MU indeed, which is the case in 70% of the times given that you received the information “120 MU”, you make a total profit of 60.50 MU: (120 MU - 48.00 MU offering price - 6.50 MU inform. costs - 5 MU bidding costs).
o If the actual value is 0 MU, which is the case in 30% of the times given that you re-ceived the information “120 MU”, you make a loss of 59.50 MU: (0 MU - 48.00 MU offering price - 6.50 MU information costs - 5 MU bidding costs).
o If you have bid in the IPO, but you do not receive a share, either because the IPO failed or because you did not receive an allocation in the draw, your loss amounts to -11.50 MU: (- 6.50 MU information costs - 5 MU participation costs).
• Alternatively, let us assume that you receive the information “0 MU” and due to this de-cide against bidding in the IPO No. 1. In this case your total loss would be -6.50 MU. [Please note once again that this does not have to be the recommendable decision in this situation.]
For help regarding this difficult decision you can use the simulator. If you press the “Simula-tor” button on the decision screen, the window presented in Figure 3 will show up in a fixed-price offering.
Figure 3: Simulator in a fixed-price offering
• then the IPO takes place, • my chance of receiving an allocation is 33%.
• 60.50 MU in the case of a share value of 120.00 MU (120.00 MU - 6.50 MU - 5.00 MU - 48.00 MU) • -59.50 MU in the case of a share value of 0.00 MU (0.00 MU - 6.50 MU - 5.00 MU - 48.00 MU)
If I bid for one share and 5 other investors bid for one share, too,
Calculate
If I receive an allocation, my profit is
If I bid for a share, but do not receive an allocation, I lose -11.50 MU.
- 37 -
Using the simulator in fixed-price offerings you can compute your probability of receiving an allocation depending on the bidding decisions of the other investors. The simulator also shows your profit or loss in the case that you bid and receive an allocation and in the case that you bid, but you do not receive an allocation.
If you decide against buying information (situation ), you will see a result screen after the other participants have made their decisions. We will discuss this screen later. Firstly, we assume that you decide to purchase information. Then, you will view the screen shown in Figure 4.
Figure 4: Second decision in a fixed-price offering
You will notice that this screen is similar to the previous one. In the top left section you find the information which is identical for all IPOs. In the middle section you find all the information which is specific to IPO No. 1. Your information is highlighted in blue. Due to the fact that you re-ceived the information “120 MU”, the probabilities of the actual share values have changed as you can see in the top right section of the screen. Now, there is a 70% chance that the true value is 120 MU and a 30% chance that it is 0 MU. Based on this information, you can now decide whether you would like
Offering mechanism: Fixed-price
Offering Price: 48.00 MU
Information costs: 6.50 MU Your information: 120.00 MU
Do you want to bid for a share in the IPO No. 1?
Experiment “IPOs in the lab”
IPO No. 1
Decision: Bid for a share
NOTICE: If you choose yes, you pay the bidding costs and bid for one share. Whether the IPO takes place and then, whether you receive an allocation, depends on the bidding decisions of the other investors.
NOTICE: If you choose no, you do not bid for a share in this IPO. You do not incur any further costs beyond the information costs.
Yes No
Number of investors: 8
Number of shares: 2
Information quality: 70%
Bidding costs: 5.00 MU
Budget: 150.00 MU
Here you may calculate your probability of allocation depending on the participation of other investors.
Value of a share: 70% -> 120.00 MU
30% -> 0.00 MU
Simulator
- 38 -
to bid for a share in this IPO. Below the buttons you are once again reminded of the consequences of each decision.
We now assume that you bid for a share in IPO No. 1. After you and the other 7 investors have made their decisions regarding this IPO, you see the result screen shown in Figure 5. Here, you are notified of whether the IPO took place and if so, whether you received a share. In our example, the IPO took place and also, you received a share.
Figure 5: Result screen of a fixed-price IPO
In the following section you find your current account statement for this IPO. From your ini-tial budget of 150 MU the information costs, bidding costs and the offering price have been deducted, leaving you with a new balance of 90.50 MU. You will notice that the share has been entered into your deposit account at the offering price of 48.00 MU. The total value of the deposit account is unknown as you do not know the true value of the share.
Result
The IPO took place. You received a share for 48.00 MU.
Your current account statement (in MU):
Old balance
Information costs
Bidding costs
Offering price
Your deposit account statement (in MU):
Your total profit or loss in this IPO depends on the actual value of the share. In the case of a share value of 120.00 MU, you win 60.50 MU. In the case of a share value of 0.00 MU, you lose -59.50 MU.
Number of shares: 2
Number of investors: 8
Number of investors who bid for a share: 5
Offering price: 48.00 MU
General information about the IPO:
Continue
Total value Offering price Quantity
Debit Credit
New balance
Share Unknown (120.00 or 0.00)
- 39 -
In the next section of the result screen you are reminded of your total profit or loss from this IPO depending on the true value of the share. In this example your profit would be 60.50 MU in case of a share value of 120 MU and your loss would be -59.50 MU in case of a share value of 0 MU. Fi-nally, you receive some general information about this IPO: In this example 5 investors bid for a share and the offering price was 48.00 MU.
4.2 An auction IPO
An auction offering is very similar to a fixed-price offering. Hence, we would like to save time and abstain from a detailed description of an auction IPO but concentrate on explaining how auction offerings differ from fixed-price offerings. Figure 6 shows the first decision screen in auction offer-ings. Only the middle section of this screen is different from the respective screen in fixed-price offer-ings. Here, the offering mechanism is an auction. Since the offering price is not determined until all investors have made their bidding decisions, no predetermined price is given to you.
Figure 6: First decision screen in an auction offering
Experiment “IPOs in the lab”
IPO No. 2
Do you want to buy information about the value of a share in the IPO No. 2?
Offering mechanism: Auction
Information costs: 6.50 MU
Yes No
Number of investors: 8
Number of shares: 2
Information quality: 70%
Bidding costs: 5.00 MU
Budget: 150.00 MU
Here you may calculate your profit or loss depending on your bid and the bidding decisions of the other investors.
Value of a share: 50% -> 120.00 MU 50% -> 0.00 MU
Decision: Buy information
Simulator
NOTICE: If you choose yes, you pay the information costs and receive a piece of information about the true value of the shares on the following screen. This information is correct with a probability of 70%. After you have got the information, you can decide whetheryou want to place a bid in the IPO.
NOTICE: If you choose no, you do not participate in the IPO. You do not incur any costs.
- 40 -
By using the simulator during an auction offering, you can calculate your profit or loss de-pending on your bid and the bids of the other investors. The example in Figure 7 shows the profit or loss calculated by the simulator in the case that you and 5 other investors place a bid and the third highest bid is 45 MU. You will see that the IPO takes place. If you had bid the highest or second high-est price, you would receive a share. Your profit would then be 63.50 MU, if the share had an actual value of 120 MU, or you would incur a loss of -56.50 MU, if the share’s value was actually 0 MU. If you did not place the highest or second highest bid for the share, you would not receive a share, so your total loss would be -11.50 MU.
Figure 7: Simulator during an IPO auction
• then the IPO takes place,
• and if my bid is the highest or second highest bid, I win/lose
o 63.50 MU in the case of a stock value of 120.00 MU (120.00 MU - 6.50 MU - 5.00 MU - 45.00 MU) o -56.50 MU in the case of a stock value of 0.00 MU (0.00 MU - 6.50 MU - 5.00 MU - 45.00 MU).
• If my bid is lower than the second highest bid, I lose -11.50 MU.
Calculate
If I bid for one share, other investors also bid for one share each and the third highest bid
(of all bids including my own) is MU,
5
45
- 41 -
If you initially decided against buying information (situation in Figure 1), you will see a result screen after all other investors have made their decisions. Here, we assume that you purchase information, so you will now view the screen shown in Figure 8. As in a fixed-price IPO, your piece of information is shown in the middle of the screen. In this case it is “120 MU”. In the bottom section you can then decide if you would like to bid in this IPO. You bid by entering the price that you are willing to pay and then pressing “Bid”. Your limit price must be between 0 MU and 120 MU. Let us now assume that you decide to place a bid of 50 MU. [Again, please note that this is only an assump-tion about your decision and does by no means imply that this is the recommendable decision.]
Figure 8: Second decision in an auction offering
If you want to place a bid for a share in this IPO, please enter your bid below (between 0 MU and 120 MU).
Your bid: Bid No bid
Experiment “IPOs in the lab”
IPO No. 2
Offering mechanism: Auction
Information costs: 6.50 MU Your information: 120.00 MU
Number of investors: 8
Number of shares: 2
Information quality: 70%
Bidding costs: 5.00 MU
Budget: 150.00 MU
Value of a share: 70% -> 120.00 MU 30% -> 0.00 MU
Here you may calculate your profit or loss depending on your bid and the bidding decisions of the other investors.
Simulator
Decision: Bid for a share
- 42 -
After you and the other investors have decided to bid or not, you will see a result screen like the one shown in Figure 9. This is basically the same screen as at the end of a fixed-price IPO. As Figure 9 shows, your offer of 50 MU was either the highest or the second highest bid, so that you re-ceived a share (so situation occurred). The third highest bid was 45 MU. Therefore, the offering price is 45 MU. Like in fixed-price offerings, your current and deposit account statements, the calcula-tion of the total profit or loss, and the general information about the IPO are presented on the result screen.
Figure 9: Result screen of an auction offering
General information about the IPO:
Debit Credits
New balance
No. Landed price Total value
Continue
Result
Your deposit account statement (in MU):
The IPO took place. You received a share for 45.00 MU.
Your current account statement (in MU):
Old balance
Information costs
Bidding costs
Offering price
Your total profit or loss in this IPO depends on the actual value of the share. In the case of a share value of 120.00 MU, you win 63.50 MU. In the case of a share value of 0.00 MU, you lose -56.50 MU.
Number of shares: 2
Number of investors: 8
Number of investors who bid for a share: 5
Offering price: 45.00 MU
General information about the IPO:
Offering price Quantity
New balance
Share Unknown (120.00 or 0.00)
- 43 -
After you have completed all 22 IPOs, one IPO is randomly drawn. The actual value of the shares in this IPO is revealed and your payment is calculated. Your payment is determined as the value of your current and deposit accounts for this IPO converted into Euros. The exchange rate is 10:1, i.e., 10 MU equal 1 Euro. After the calculation of your payment we will ask you for some personal infor-mation. At this point we also welcome any views, criticism or comments that you have regarding the experiment.
Finally, before you start the experiment we have a couple of concluding hints and tips for you:
• We would like to stress once again that any decisions assumed in the examples that we have just run through do by no means have to be the only correct or optimal decisions and must not be interpreted as recommendations for your decisions.
• In every IPO you face a trade off between certain costs (information and bidding costs) and an uncertain profit. The profit is uncertain because you do not know the actual value of the shares and you may or may not receive a share depending on the decisions of the other investors.
• The uncertainty about the profit in the fixed-price offerings depends on the decisions of the other investors as the chance of you being allocated a share decreases with an increas-ing number of bidders.
• The uncertainty about the profit in the auction offerings depends on the decisions of the other investors as the offering price and the chance of you being allocated a share is de-termined by the other investors’ bidding decisions.
• Please keep in mind that due to the auction mechanism that determines the offering price according to the third highest bid, it is rational to place a bid that reflects your true will-ingness to pay. It is not worthwhile to bid a price above or below the price you are actu-ally willing to pay.
• Please take your time to make decisions. Particularly in the first IPOs, please test the con-sequences of different decisions using the simulator. As the experiment progresses and the decision situations become even more familiar to you, you can make your decisions quicker.
If you now have any questions regarding the experiment please ask, if not good luck!
- 44 -
Appendix B: Ordering of IPOs in the Experiment Sessions
Table BI. Information costs and offering mechanism by round and session
The columns display the information costs in monetary units and the offering mechanisms where (A) denotes a uniform price auction and (F) denotes a fixed-price offering. Information costs were set to 5.5 MU in the practice rounds (first two rounds) and to integers between 1 MU and 10 MU in the subsequent rounds. Each combination of round and information costs occurred only once in the seven sessions. Session
References Aggarwal, R. K., Krigman, L. and Womack, K. L. (2002) Strategic IPO underpricing, information
momentum, and lockup expiration selling, Journal of Financial Economics 66, 105-137. Allen, F. and Faulhaber, G. R. (1989) Signaling by underpricing in the IPO market, Journal of Finan-
cial Economics 23, 303-324. Andreoni, J. and Croson, R. (2008) Partners versus strangers: Random rematching in public goods
experiments, to appear in: C. R. Plott and V. L. Smith (eds.), Handbook of Experimental Economics Results, North-Holland, Amsterdam.
Benveniste, L. M. and Wilhelm, W. J. Jr. (1990) A comparative analysis of IPO proceeds under alter-native regulatory environments, Journal of Financial Economics 28, 173-207.
Biais, B., Bossaerts, P. and Rochet, J.-C. (2002) An optimal IPO mechanism, Review of Economic Studies 69, 117-146.
Biais, B. and Faugeron-Crouzet, A. M. (2002) IPO auctions: English, Dutch, …French, and internet, Journal of Financial Intermediation 11, 9-36.
Bonini, S. and Voloshyna, O. (2007) Underpricing, bookbuilding and competitive IPO: An experimen-tal analysis, working paper, SDA Bocconi.
Busaba, W. Y. and Chang, C. (2002) Bookbuilding vs. fixed price revisited: The effect of aftermarket trading, working paper, University of Arizona, University of Minnesota.
Camerer, C. and Lovallo, D. (1999) Overconfidence and excess entry: An experimental approach, American Economic Review 89, 306-318.
Campbell, C. M. and Levin, D. (2000) Can the seller benefit form an insider in common-value auc-tions? Journal of Economic Theory 91, 106-120.
Chemmanur, T. J. (1993) The pricing of initial public offerings: A dynamic model with information production, Journal of Finance 48, 285-304.
Chemmanur, T. J. and Liu, M. H. (2006) How should a firm go public? A dynamic model of the choice between fixed-price offerings and auctions in IPOs and privatizations, working paper, Boston College, University of Kentucky.
Chen, H.-C. and Ritter, J. R. (2000) The seven percent solution, Journal of Finance 55, 1105-1131. Chen, H.-C. and Wu, S.-C. (2006) Why are IPO auctions unpopular, working paper, Yuan Ze Univer-
sity. Clarke, J., Dunbar, C. G. and Kahle, K. M. (2002) All-star analyst turnover, investment bank market
share, and the performance of initial public offerings, working paper, Georgia Institute of Technology, University of Western Ontario, University of Pittsburgh.
Cliff, M. T. and Denis, D. J. (2004) Do initial public offering firms purchase analyst coverage with underpricing? Journal of Finance 59, 2871-2901.
Conlisk, J. (1993) The utility of gambling, Journal of Risk and Uncertainty 6, 255-275. Cornelli, F. and Goldreich, D. (2003) Bookbuilding: How informative is the order book? Journal of
Finance 58, 1415-1443.
- 46 -
Cox, J. C., Dinkin, S. and Swarthout, J. T. (2001) Endogenous entry and exit in common value auc-tions, Experimental Economics 4, 163-181.
Croson, R. and Gneezy, U. (2004) Gender differences in preferences, working paper. Dasgupta, S. and Hansen, R. G. (2007) Auctions in corporate finance, in: B. E. Eckbo, (ed.), Hand-
book of Corporate Finance: Empirical Corporate Finance, Volume 1, North-Holland, Ams-terdam, pp. 87-143.
Degeorge, F., Derrien, F. and Womack, K. L. (2007) Analyst hype in IPOs: Explaining the popularity of bookbuilding, Review of Financial Studies 20, 1021-1058.
Demers, E. and Lewellen, K. (2003) The marketing role of IPOs: evidence from internet stocks, Jour-nal of Financial Economics 68, 413-437.
Derrien, F. and Womack, K. L. (2003) Auctions vs. bookbuilding and the control of underpricing in hot IPO markets, Review of Financial Studies 16, 31-61.
Dunbar, C. G. (2000) Factors affecting investment bank initial public offering market share – The case of Salomon Brothers, Journal of Financial Economics 55, 3-41.
Dyer, D., Kagel, J.H. and Levin, D. (1989) A comparison of naïve and experienced bidders in com-mon value auctions: A laboratory analysis, Economic Journal 99, 108-115
Easley, D. and O’Hara, M. (2004) Information and the costs of capital, Journal of Finance 59, 1553-1583.
Gillette, A. B., Noe, T. H., Rebello, M. J. (2007) Board structures around the world: An experimental investigation, Review of Finance, forthcoming.
Ham, J. C., Kagel, J. H. and Lehrer, S. F. (2005) Randomization, endogeneity and laboratory experi-ments: The role of cash balances in private value auction, Journal of Econometrics 125, 175-205.
Harrison, G. W. (2007) House money effects in public good experiments: Comment, Experimental Economics 10, forthcoming.
Jagannathan, R. and Sherman, A. E. (2006) Why do IPO auctions fail? NBER working paper No. 12151.
Kagel, J. H. and Levin, D. (1986) The winner’s curse and public information in common value auc-tions, American Economic Review 76, 894-920.
Kagel, J. H., Levin, D. and Harstad, R. M. (1995) Comparative static effects of number of bidders and public information on behavior in second-price common value auctions, International Jour-nal of Game Theory 24, 293-319.
Ko, K. J. and Huang, Z. (J.) (2007) Arrogance can be a virtue: Overconfidence, information acquisi-tion, and market efficiency, Journal of Financial Economics 84, 529-560.
Krigman, L., Shaw, W. H. and Womack, K. L. (2001) Why do firms switch underwriters? Journal of Financial Economics 60, 245-284.
Kutsuna, K. and Smith, R. (2004) Why does book building drive out auction methods of IPO is-suance? Evidence from Japan, Review of Financial Studies 17, 1129-1166.
Landsberger, M. and Tsirelson, B. (2003) Games (auctions) with costly actions (bids) and correlated signals, working paper, Haifa University, Tel Aviv University.
- 47 -
Levin, D. and Smith, J. L. (1994) Equilibrium in auctions with entry, American Economic Review 84, 585-599.
Loughran, T. and Ritter, J. R. (2004) Why has IPO underpricing changed over time? Financial Man-agement 33(3), 5-37.
Ljungqvist, A. P. (2007) IPO underpricing, in: B. E. Eckbo (ed.), Handbook of Corporate Finance: Empirical Corporate Finance, Volume 1, North-Holland, Amsterdam, pp. 375-422.
Ljungqvist, A. P., Jenkinson, T and Wilhelm, William J. Jr. (2003) Global integration in primary equi-ty markets: The role of U.S. banks and U.S. investors, Review of Financial Studies 16, 63-99.
Maksimovic, V. and Pichler, P. (2007) Structuring the Initial Offering: Who to sell to and how to do it, Review of Finance 10, 353-387.
Menezes, F. M. and Monteiro, P. K. (2000) Auctions with endogenous participation, Review of Eco-nomic Design 5, 71-89.
Patatoukas, P. (2008) What causes the underpricing of auctioned IPOs? An experimental investigation, working paper, Yale School of Management.
Pukthuanthong, K., Varaiya, N. P. and Walker, T. J. (2006) Book building versus auction selling me-thods: A study of U.S. IPOs, Venture Capital: An International Journal of Entrepreneurial Finance, forthcoming.
Rapoport, A., Seale, D. A. and Ordónez, L. (2002) Tacit coordination in choice between certain out-comes in endogenously determined lotteries, Journal of Risk and Uncertainty 25, 21-45.
Ritter, J. R. (2003) Investment banking and securities issuance, in: G. M. Constantinides, M. Harris and R. M. Stulz (eds.), Handbook of the Economics of Finance, Volume 1A, North-Holland, Amsterdam, pp. 254-304.
Schmidt, D., Shupp, R., Walker, J. M. and Ostrom, E. (2003) Playing safe in coordination games: the roles of risk dominance, payoff dominance, and history of play, Games and Economic Be-havior 42, 281-299.
Sherman, A. E. (2000) IPOs and long term relationships: An advantage of book-building, Review of Financial Studies 13, 697-714.
Sherman, A. E. (2005) Global trends in IPO methods: Book building versus auctions with endogenous entry, Journal of Financial Economics 78, 615-649.
Sherman, A.E. and Titman, S. (2002) Building the IPO order book: Underpricing and participation limits with costly information, Journal of Financial Economics 65, 3-29.
Smith, V. L. and Walker, J. M. (1993) Monetary rewards and decision cost in experimental econom-ics, Economic Inquiry 31, 245-261.
Spiess, K. and Pettway, R. (1997) The IPO and first seasoned equity sale: Issue proceeds, owner/ managers' wealth, and the underpricing signal, Journal of Banking and Finance 21, 967-988.
van Bommel, J. (2002) Messages from market to management: The case of IPOs, Journal of Corpo-rate Finance 8, 123-138.
Vickrey, W. (1961) Counterspeculation, auctions, and competitive sealed tenders, Journal of Finance 16, 8-37.
- 48 -
Wooldridge, J. M. (2002) Economic Analysis of Cross Section and Panel Data, MIT Press, Cam-bridge, Massachusetts.
Ye, L. (2004) Optimal auctions with endogenous entry, working paper, Ohio State University. Yung, C. (2005) IPOs with buy- and sell-side information production: The dark side of open sales,
Review of Financial Studies 18, 327-347. Zhang, P. (2006) Uniform price auctions and fixed price offerings in IPOs: An experimental compari-
son, CeDEx Discussion Paper No. 2006-05.
- 49 -
4
5
6
7
8
1 2 3 4 5 6 7 8 9 10
Figure 1. Sketch of the decision tree in the experiment. The level of information costs varies from IPO to IPO. The offering price is pre-determined in fixed-price offerings and determined endogenously by investors’ bids in auction offerings. Ex ante, the probability of a share being worth 120 MU is 50%.
Figure 2. Number of participants by information costs and offering mechanism. The number of participants is calculated as the mean number of information producers in the 21 IPOs observed for each combination of infor-mation costs and offering mechanism.
1
2
3
4
Decision 1: Produce information?
Decision 2: Bid?
“Is it worth participating, by producing information about this IPO?” “Is it worthwhile to
bid in the IPO?” Depending on
information Yes
No
Yes
No
Profit/Loss
0
- Information costs
- Information costs - Bidding costs (5 MU)
- Information costs - Bidding costs (5 MU) - Offering price + Share (120 MU or 0 MU) Allocation
No allocati-on
Auction
Fixed-price
Information costs
Num
ber
of p
artic
ipan
ts
- 50 -
Figure 3. Superior offering mechanism by information costs and weighting of information production. Areas filled in grey [shaded in grey] indicate that fixed-price offerings [auction offerings] are superior. The offering mechanisms are ranked by the following measure: (Mean offering price) + (Mean number of information pro-ducers) * (weighting factor). This is repeated for each combination of information costs and weighting factor. The weighting factor serves as a simple measure for the preference for information production. The mean offer-ing prices of the auction offerings are calculated as the equally weighted mean of the high true value and the low true value offering prices (see Table VII).
Table I. Descriptive statistics about the participants
Experience in financial markets and experience in game theory are measured on a scale from one (very low ex-perience) to six (very high experience). Mean Median St. Dev. Age 23.55 23 2.28 Experience in financial markets 3.23 3 1.22 Experience in game theory 2.93 3 1.19 Number of semesters studied so far 6.03 6 2.57 Number (ratio) of female students 30 (17.9%) Number (ratio) of students with majors other than eco-nomics or business 15 (8.9%)
Table II. IPO frequencies and failures by offering mechanism, true value and information costs
Freq. denotes the frequency of occurrence. Failed denotes the frequency of IPO failures due to an insufficient number of bidders out of the number of IPOs that occurred. In the cases of information costs of two and nine, no fixed-price offerings with a true value of zero occurred.
Fixed-price Auction Inform. True value = 0 True value = 120 True value = 0 True value = 120 Sum
Table III. Information production contingent on information costs
The p-value of difference is based on a Wilcoxon signed rank test. For each level of information costs, the p-value is calculated for a pairwise comparison of the 21 auction and the 21 fixed-price offerings. KW-test refers to a Kruskal-Wallis test of equality of populations. Fixed-price Auction
Table IV. RE logistic regression of individual participation decisions
Random-effects logistic regression where the individual decision to participate is the dependent variable and the subjects are the random effects. Odds ratios denote the ratio of the probability to participate and the complemen-tary probability to forgo the IPO. An increase in the independent variable increases [decreases] the probability of participating if the odds ratio is greater [smaller] than one. N denotes the number of observations. Wald-test (p-value) denotes the probability that the model is insignificant (i.e., all coefficients are equal to zero according to a Wald test). ρ denotes the fraction of variance that is contributed by individual heterogeneity and LR-test (p-value) denotes the probability that ρ is greater than zero according to a Likelihood-ratio test. Explanatory Fixed-price Auction variables Odds ratio p-value Odds ratio p-value Information costs 1.027 0.269 0.644 0.000 Round 1.001 0.959 0.979 0.165 Age 0.962 0.503 1.049 0.486 Semester 1.082 0.172 1.053 0.470 Gender (female=1) 0.921 0.835 0.366 0.032 Exp. in Fin. Markets 0.870 0.288 0.913 0.576 Exp. In Game Theory 1.234 0.120 1.031 0.858 N 1680 1680 Wald-test( p-value) 0.4901 0.0000 ρ 0.4227 0.5225 LR-test (p-value) 0.0000 0.0000
- 52 -
Table V. Bids in auction offerings by type of information and information costs
Information = 120 (S +) Information = 0 (S –) Information costs Mean St. Dev. Frequency Mean St. Dev. Frequency
Table VI. Two-way RE regression of bid levels in auction offerings by information
Two-way RE regression where the individual bid level is the dependent variable. The subjects and the sessions are defined as the random effects. N denotes the number of observations. Wald-test (p-value) denotes the prob-ability that the model is insignificant (i.e., all coefficients are zero according to a Wald test). Est. St. Dev. [St. Err.] denotes the estimated standard deviation [the standard error of this estimation] of the RE parameters. LR-Test (p-value) denotes the probability that all RE parameters are simultaneously zero according to a likelihood-ratio test. Explanatory Information = 120 Information = 0 variables Coefficient p-value Coefficient p-value Information cost -0.426 0.001 0.090 0.657 Round 1.089 0.000 0.650 0.001 Age -0.314 0.487 -0.471 0.344 Semester 0.239 0.594 0.018 0.974 Gender (female = 1) -1.489 0.619 3.360 0.416 Experience in Financial Markets -1.476 0.135 1.208 0.265 Experience in Game Theory -0.088 0.931 1.219 0.138 Constant 71.127 0.000 36.054 0.001 N 692 431 Wald-test (p-value) 0.0000 0.0236 Est. St. Dev. [St. Err.] of session 0.465 [5.479] 1.870 [2.455] Est. St. Dev. [St. Err.] of subject 12.917 [0.843] 13.752 [1.083] LR-Test (p-value) 0.0000 0.0000
- 53 -
Table VII. Mean offering prices, fair values and total profits to investors by information costs
The fair values are calculated according to Bayes’ law by taking into account all information produced in an IPO. Mean total profits are calculated as the equally weighted mean of the respective total profits of high true value and low true value IPOs. The total profit to investors in each IPO is calculated by adding up the fair values of the shares and deducting the offering prices and the sum of information costs and bidding costs.
Fixed-price offerings Auction offerings Inform. Offering Fair value Total Offering price Fair value Total
Table VIII. FE regression of total profits on IPO parameters
Fixed-effects regression where total profits is the dependent variable and the sessions constitute the fixed effects. N denotes the number of observations. F-Test (p-value) denotes the probability that the model is insignificant and R2 denotes the overall explanatory power. ρ denotes the fraction of variance that is contributed by the fixed effects and F-test (p-value) of FE denotes the probability that the fixed effects are equal to zero. Explanatory All offerings Fixed-price offerings Auction offerings Variables Coefficient p-value Coefficient p-value Coefficient p-value Mechanism (auction = 0) 14.465 0.000 True value (dummy) 134.226 0.000 141.032 0.000 127.394 0.000 Information costs -1.827 0.008 -1.013 0.279 -2.669 0.007 Round 0.021 0.952 0.231 0.620 -0.186 0.707 Constant -100.140 0.000 -95.781 0.000 -89.940 0.000 N 420 210 210 F-test (p-value) 0.0000 0.0000 0.0000 R2 (overall) 0.7429 0.7641 0.7210 ρ 0.0163 0.0826 0.0213 F-test (p-value) of FE 0.4299 0.0153 0.6889