Doing Business 2016 Trading across borders A new approach to measuring trade processes I n the past 10 years international trade patterns have been defined by the rise of developing economies, the expan- sion of global value chains, the increase in commodity prices (and the growing importance of commodity exports) and the increasingly global nature of macro- economic shocks. Each of these trends has reshaped the role of trade in facilitat- ing development. 1 The restoration of more open trade follow- ing World War II involved major multilater- al and preferential trade agreements aimed at lowering tariff and nontariff barriers to trade. For the first time economic relations and international trade were governed by a multilateral system of rules, including the General Agreement on Tariffs and Trade (GATT) and the Bretton Woods institu- tions. These trade agreements, combined with tremendous advances in transport and communications technology, have led to unprecedented rates of growth in international trade. Between 1950 and 2007, for example, real world trade grew by 6.2% a year while real income per capita grew by 2% a year. 2 Greater international trade is strongly correlated with economic growth. A study using data from 118 countries over nearly 50 years (1950–98) found that those opening up their trade regimes experienced a boost in their average annual growth rates of about 1.5 percentage points. 3 Evidence suggests that one important channel by which international trade leads to economic growth is through imports of technology and associ- ated gains in productivity. 4 A study of 16 OECD countries over 135 years revealed a robust relationship between total factor productivity and imports of knowledge (measured by imports of patent-based technology). Indeed, the study found that 93% of the increase in total factor pro- ductivity over the past century in OECD countries was due solely to these tech- nology imports. These results suggest that international trade is a critical chan- nel for the transmission of knowledge, which in turn improves capital intensity and economic growth. The relationship between trade and eco- nomic growth can also be observed at the firm level. Substantial evidence suggests that knowledge flows from international buyers and competitors help improve the performance of exporting firms. A review of 54 studies at the firm level in 34 countries reveals that firms that export are more productive than those that do not (though exporting does not necessarily improve productivity). 5 This is in large part because firms participat- ing in international markets are exposed to more intense competition and must improve faster than firms that sell their products domestically. While access to international markets is important for all economies, develop- ing economies are uniquely affected by trade policy. Because they are skewed toward labor-intensive activities, their growth depends on their ability to import capital-intensive products. 6 Without access to international markets, develop- ing economies must produce these goods themselves and at a higher cost, which pulls resources away from areas where they hold a comparative advantage. In addition, Using a new methodology, Doing Business measures the time and cost for three sets of procedures needed for exporting and importing: documentary compliance, border compliance and domestic transport. For the first time this year, Doing Business considers the product of comparative advantage for each economy when measuring export procedures, while for import procedures it focuses on a single, very common manufactured product (auto parts). Among economies requiring product-specific inspections for their exported agricultural product, border compliance times range from 11 hours to 210. This variation suggests that it is possible to protect consumers and businesses without unduly delaying trade. For economies in a customs union with their case study trading partner, the time for documentary and border compliance is substantially lower on average than for others. Economies that are less efficient importers also tend to be less efficient exporters.
Transcript
Doing Business 2016
Trading across bordersA new approach to measuring trade processes
In the past 10 years international trade patterns have been defined by the rise of developing economies, the expan-
sion of global value chains, the increase in commodity prices (and the growing importance of commodity exports) and the increasingly global nature of macro-economic shocks. Each of these trends has reshaped the role of trade in facilitat-ing development.1
The restoration of more open trade follow-ing World War II involved major multilater-al and preferential trade agreements aimed at lowering tariff and nontariff barriers to trade. For the first time economic relations and international trade were governed by a multilateral system of rules, including the General Agreement on Tariffs and Trade (GATT) and the Bretton Woods institu-tions. These trade agreements, combined with tremendous advances in transport and communications technology, have led to unprecedented rates of growth in international trade. Between 1950 and 2007, for example, real world trade grew by 6.2% a year while real income per capita grew by 2% a year.2 Greater international trade is strongly correlated with economic growth. A study using data from 118 countries over nearly 50 years (1950–98) found that those opening up their trade regimes experienced a boost in their average annual growth rates of about 1.5 percentage points.3
Evidence suggests that one important channel by which international trade leads to economic growth is through imports of technology and associ-ated gains in productivity.4 A study of 16 OECD countries over 135 years revealed
a robust relationship between total factor productivity and imports of knowledge (measured by imports of patent-based technology). Indeed, the study found that 93% of the increase in total factor pro-ductivity over the past century in OECD countries was due solely to these tech-nology imports. These results suggest that international trade is a critical chan-nel for the transmission of knowledge, which in turn improves capital intensity and economic growth.
The relationship between trade and eco-nomic growth can also be observed at the firm level. Substantial evidence suggests that knowledge flows from international buyers and competitors help improve the performance of exporting firms. A review of 54 studies at the firm level in 34 countries reveals that firms that export are more productive than those that do not (though exporting does not necessarily improve productivity).5 This is in large part because firms participat-ing in international markets are exposed to more intense competition and must improve faster than firms that sell their products domestically.
While access to international markets is important for all economies, develop-ing economies are uniquely affected by trade policy. Because they are skewed toward labor-intensive activities, their growth depends on their ability to import capital-intensive products.6 Without access to international markets, develop-ing economies must produce these goods themselves and at a higher cost, which pulls resources away from areas where they hold a comparative advantage. In addition,
� Using a new methodology, Doing Business measures the time and cost for three sets of procedures needed for exporting and importing: documentary compliance, border compliance and domestic transport.
� For the first time this year, Doing Business considers the product of comparative advantage for each economy when measuring export procedures, while for import procedures it focuses on a single, very common manufactured product (auto parts).
� Among economies requiring product-specific inspections for their exported agricultural product, border compliance times range from 11 hours to 210. This variation suggests that it is possible to protect consumers and businesses without unduly delaying trade.
� For economies in a customs union with their case study trading partner, the time for documentary and border compliance is substantially lower on average than for others.
� Economies that are less efficient importers also tend to be less efficient exporters.
doing Business 201684
low income per capita limits domestic opportunities for economies of scale. A trade regime that permits low-cost produc-ers to expand their output well beyond local demand can therefore boost business opportunities. Thus while international trade can benefit developed and develop-ing economies alike, trade policy is clearly inseparable from development policy.
An important issue touching on both trade and development policy is that exporting agricultural products is more costly and
time-consuming than exporting other kinds of merchandise. New data collected by Doing Business show that in economies whose top export is an agricultural product, complying with border and documentary requirements takes considerably longer on average than in economies whose top export is a nonagricultural product. The data also show that a much larger share of economies whose top export is an agricultural product require product-specific inspections and procedures for their export. That said, among economies
requiring product-specific inspections for agricultural exports, border compliance times vary widely.
In many economies inefficient processes, unnecessary bureaucracy and redundant procedures add to the time and cost for border and documentary compli-ance. Only recently has the relationship between administrative controls and trade volumes attracted the attention of multilateral trade networks (see box 9.1 for several explanations for this recent
BOX 9.1 Why the renewed focus on trade facilitation? The recent interest in trade facilitation has come about for several reasons. First, tariff and quota barriers, particularly on general merchandise flows, are lower than in the past thanks to the success of multilateral and preferential trade agreements along with the global recognition of the benefits of international trade. This has sharpened the focus of policy makers and traders on the costs of international trade, which can pose a substantial barrier to trade.
Second, the next major frontier for multilateral trade negotiations—as well as for poverty reduction programs—is the facilitation of global trade in agricultural products (broadly comprising animal and plant-based products). Three-quarters of the world’s poorest people depend, directly or indirectly, on agriculture as their main source of income,a so policies affecting agriculture af-fect poverty, inequality and overall economic growth.b And agricultural products are more regulated and controlled than general merchandise. While phytosanitary and other sanitary standards are widely, and justifiably, adhered to by both importers and ex-porters of these products, public officials attempting to protect domestic agriculture and mining from international competition can impose high costs on traders and, in some cases, discourage international trade through protectionist measures. For bulk agricultural commodities the costs of regulation are magnified by the long downward trend in prices as global supply outpaces global demand.c
Third, as researchers have gained access to great quantities of microeconomic data in recent decades, certain stylized facts have emerged about firms and their participation in international markets that reveal the significant costs of trade.d Trading in-ternationally is certainly more expensive than engaging in domestic trade. For example, compared with other firms in the same industry, those that engage in international trade tend to be larger and more productive as well as capital and skill intensive—and they tend to pay higher wages. In addition, there is substantial evidence of fixed costs of entry into foreign markets—firms that engaged in international trade in the past are much more likely to do so again.
Yet Doing Business indicators are best understood as measuring marginal rather than fixed costs of trading internationally. The trading across borders case study assumes that the exporter or importer has already established its business and is fully op-erational. The one-time cost to obtain a trade license or customs identification number is not measured. The data capture other costs that are not related to entry into the market but do not necessarily vary with the volume of trade (such as the costs of customs procedures, inspections by government agencies and obtaining, preparing and submitting documents). However, differences in marginal trade costs captured by Doing Business have a greater impact on the number of firms participating in international trade.
Recent research has made progress in quantifying the effect of changes in marginal costs on trade volumes and participation. One study finds that a 7% reduction in the median number of days spent in Albanian customs leads to a 7% increase in the value of imports.e Another finds that a 10% increase in customs delays results in a 3.8% decline in exports in Uruguay.f Delays increase costs for exporters, forcing them to reduce their foreign sales. Buyers also experience higher costs and downsize (or eliminate) purchases from firms that experience such delays. a. World Bank 2007.b. World Bank Group and WTO 2015.c. World Bank 2007.d. See Tybout (2003) and Melitz and Redding (2014) for extensive reviews of the empirical and theoretical literature.e. Fernandes, Hillberry and Mendoza Alcantara 2015.f. Volpe Martincus, Carballo and Graziano 2015.
85TrAding Across Borders
interest in trade facilitation). In 2013, for example, members of the World Trade Organization (WTO) concluded a Trade Facilitation Agreement aimed at streamlining trade procedures. The Organisation for Economic Co-operation and Development (OECD) estimates that fully implementing the WTO Trade Facilitation Agreement could reduce trade costs by 14.1% for low-income economies, 15.1% for lower-middle-income economies and 12.9% for upper-middle-income economies. Adopting even its simple (though often still costly) recommendations, such as automating trade and customs processes, could reduce costs for these income groups by 2.1–2.4%.7 In measuring the time and cost associated with border and documentary compliance across 189 economies, Doing Business supports more efficient regula-tory practices for trading across borders.
A NEW APPROACH
The Doing Business indicators on trading across borders were among the first glob-al measures of the administrative, regula-tory and logistical burdens that add to the time and cost for trading internationally. This year’s report introduces important changes in the methodology for the indicators. These changes are aimed at increasing the economic and policy relevance of the indicators, improving the consistency and replicability of the data and clarifying the context in which the data should be interpreted as well as the caveats that should be kept in mind.
Under the new methodology Doing Business customizes the case study assumptions for exports and imports. For exports, it measures the time and cost to export a shipment of 15 metric tons of the economy’s top nonextractive export product. The case study follows the shipment from a warehouse in the economy’s largest business city to the most widely used land border or port through which the shipment would be exported to the main export partner for
the product.8 Time and cost are recorded for border compliance (both handling and clearance and inspections), documentary compliance and domestic transport. For imports, the case study follows the ship-ment from the economy’s most widely used land border or port to a warehouse in its largest business city. The shipment consists of 15 metric tons of container-ized auto parts for all economies, and the trading partner is the main import partner for the product.
The basic premise of the new methodol-ogy is that the case study should reflect the actual directions and volumes of international trade—and that the admin-istrative and regulatory burdens faced by traders differ greatly across different traded products and trading partners. Trade flows are governed by comparative advantage, by the preferences of consumers, by the international structure of production and by the size and geographic location of an economy and its trading partners. The type of traded product determines the standards to which it is held (for example, food items are subject to more safety inspections than computer equipment). And along with the type of product, the identity of the trading partner determines the probability of intru-sive and nonintrusive inspections under risk management systems commonly used at ports and borders around the world.
In recent decades two additional forces have shaped international trade flows. The first is the emergence of multilateral trade agreements—and, increasingly, of regional ones—aimed at reducing the barriers to trade. The new methodology allows an economy to be in a customs union with its case study trading partners. Box 9.2 details several of the interest-ing findings from this year’s data on the impact of customs union membership.
The second is the application of infor-mation and communication technol-ogy in international trade. The process of international trade is a long and complicated one: multiple economic and government agencies interact at many
stages, exchanging numerous pieces of information at each level. Any technol-ogy that makes this flow of information faster and more efficient is likely to have a large effect on trade costs and on the time spent on different procedures. Acknowledging the already large number of economies that have adopted some version of an electronic data interchange, and anticipating more digitization in the future, Doing Business now measures the time to trade in hours rather than in days.
EXPORTING A PRODUCT OF COMPARATIVE ADVANTAGE
By selecting the top nonextractive export product for the case study in each economy, Doing Business ensures that it measures the time and cost to export a product that is relevant to the economy as well as to policy makers. Of the 97 possible products at the two-digit level in the Harmonized System (1996) of classification, 39 emerge as the top export products for the 189 economies covered by Doing Business. These range from dairy products to machinery and mechanical appliances. Grouping these products into broad categories shows that 37% of economies have an agricul-tural product as their top export, 29% a heavy manufacturing product, 22% a light manufacturing product and 12% a metal-based product. Mapping these data reveals intuitive patterns (figure 9.1). For example, most economies whose top export is an agricultural product are in Africa or Oceania, while most whose top export is a heavy manufacturing product are in North America or Europe.
Analysis of outcomes such as the time and cost for border compliance and documen-tary compliance reveals some interesting trends. In economies whose top export is an agricultural product, border compliance takes 70% more time (35 more hours) on average than in other economies, while documentary compliance takes twice as much time (figure 9.2). The difference in cost for documentary compliance is also
doing Business 201686
large: obtaining, preparing and submit-ting documents for agricultural products is twice as costly as doing so for other product categories.
The main reason for these differences is that 81% of economies whose top export is an agricultural product require product- specific inspections and procedures (such
as fumigation or phytosanitary inspec-tions) to export that product, while only 21% of other economies do so for their top export product. Differences that are even more striking emerge when comparing agricultural products with manufacturing products (excluding metal-based prod-ucts). Only 20% of economies whose top export is a manufacturing product require
product-specific inspections and proce-dures for that export.
Yet even among economies whose top export is an agricultural product, documentary and border compliance times vary widely. Border compliance times for agricultural products subject to product-specific inspections range from 11 hours
BOX 9.2 Does customs union membership affect the time and cost for trading? Forty-seven years ago, while the rest of the international community was negotiating the levels of tariffs and quotas, the European Union embarked on a grand experiment—the launch of a customs union. There would be no customs duties at internal borders between the EU member states; there would be common customs duties on imports from outside the European Union as well as common rules of origin for products from outside; and there would be a common definition of customs value.
While the EU customs union remains one of the best examples of trade facilitation between disparate nations, it is far from alone. More than half the 189 economies covered by Doing Business are in a customs union today. Moreover, 33 economies are in a customs union with their case study export partner, and 39 are in a customs union with their case study import partner. For these economies the time for documentary and border compliance is substantially lower on average than for others—as data for EU member economies illustrate (see figure).
Being in the same customs union as an export or import partner tends to reduce the time to trade
Average time for documentary compliance (hours)
Average time for border compliance (hours)
EU member economy exporting to EU member economy
EU member economy exporting to non-EU member economy
0.8
2.0
3.5
19.9
Source: Doing Business database.
But not all customs unions are equal. Customs unions among OECD high-income economies (essentially the EU customs union) perform substantially better than others, followed by customs unions in Europe and Central Asia and then by those in Sub-Saharan Africa. In Latin America and the Caribbean membership in the same customs union as the top export partner does not significantly improve the border compliance time to export. But it does have an effect on documentary compliance time. For imports, customs unions reduce border compliance time in Latin America and the Caribbean as well as other regions. In Latin America and the Caribbean, however, documentary compliance time is actually greater if the import partner is within the same customs union. This may be due to the requirement for a certificate of origin to prove that products are being traded within the customs union.Note: A customs union is understood as the substitution of a single customs territory for two or more customs territories, where members apply a common external tariff. The analysis therefore excludes entities that began as a single customs territory, such as the U.S. customs territory (the United States and Puerto Rico [territory of the United States]) and the main customs territory of China (with Hong Kong SAR, China; and Taiwan, China) as well as treaties extended by the EU customs area (San Marino and Turkey). Because the data on the cost to export or import do not include customs duties and tariffs, the analysis also excludes free trade areas (such as NAFTA), where trade within the group is duty free but members set their own tariffs on imports from nonmembers.
87TrAding Across Borders
to 210. This variation suggests that it is possible to protect consumers and busi-nesses while still facilitating (or at least not impeding) trade. By including only the product-specific procedures required by
an economy’s own government authorities in the time and cost for border compli-ance, Doing Business is able to distinguish between the effects of policies imposed by a government on its own consumers and
businesses—and thus within its control—and those of procedures imposed from abroad.
FIGURE 9.1 What are the trading patterns revealed by each economy’s top export product and partner?
to Japan
to Japan
to Franceto the
Netherlandsto Belgiumto United Kingdom to United
Kingdom
to Spain
to Italyto Germany
to Switzerland to Norway
to C
hina
to C
hina
to India
to United States
to Singapore
to India
to China
to India
MAURITIUS
MADAGASCAR
SEYCHELLES
COMOROS
LESOTHOSOUTHAFRICA
SWAZILAND
BOTSWANA
NAMIBIAZIMBABWE MOZAMBIQUE
MALAWIZAMBIA
ANGOLA
DEM. REP. OFCONGO
RWANDABURUNDI
TANZANIA
KENYAUGANDA
ETHIOPIA
GABONREP. OFCONGO
CENTRALAFRICAN REP.
CAMEROON
SUDAN
SOUTHSUDAN
ERITREACHADNIGER
MALI
BURKINA FASO
BENIN NIGERIA
TOGOEQUATORIAL GUINEA
SÃO TOMÉ AND PRÍNCIPE
GHANACÔTED’IVOIRE
LIBERIA
SIERRA LEONE
GUINEAGUINEA-BISSAU
SENEGAL
MAURITANIA
THE GAMBIA
CABO VERDE
OMANUNITED ARABEMIRATES
SAUDIARABIA
I.R. OF IRAN
QATAR
BAHRAIN
KUWAIT
IRAQ
LIBYA
ALGERIA
MOROCCO
TUNISIA
DJIBOUTI
LEBANONWEST BANK & GAZA
JORDAN
SYRIANA.R.
MALTA
ARABREP. OFEGYPT
REP. OFYEMEN
SOMALIA
MAURITIUS
MADAGASCAR
SEYCHELLES
COMOROS
LESOTHOSOUTHAFRICA
SWAZILAND
BOTSWANA
NAMIBIAZIMBABWE MOZAMBIQUE
MALAWIZAMBIA
ANGOLA
DEM. REP. OFCONGO
RWANDABURUNDI
TANZANIA
KENYAUGANDA
ETHIOPIA
GABONREP. OFCONGO
CENTRALAFRICAN REP.
CAMEROON
SUDAN
SOUTHSUDAN
ERITREACHADNIGER
MALI
BURKINA FASO
BENIN NIGERIA
TOGOEQUATORIAL GUINEA
SÃO TOMÉ AND PRÍNCIPE
GHANACÔTED’IVOIRE
LIBERIA
SIERRA LEONE
GUINEAGUINEA-BISSAU
SENEGAL
MAURITANIA
THE GAMBIA
CABO VERDE
OMANUNITED ARABEMIRATES
SAUDIARABIA
I.R. OF IRAN
QATAR
BAHRAIN
KUWAIT
IRAQ
LIBYA
ALGERIA
MOROCCO
TUNISIA
DJIBOUTI
SOMALIA
LEBANONWEST BANK & GAZA
JORDAN
SYRIANA.R.
MALTA
ARABREP. OFEGYPT
REP. OFYEMEN
IBRD 41850SEPTEMBER 2015
Top export product by type
Agricultural
Metal based
Light manufacturing
Heavy manufacturing
Economies not in theMiddle East and North Africa orSub-Saharan Africa
Not in the Doing Business sample
to Russian Fe
derat
ion
to United Kingdom
to Germany
to United Kingdom
to China
to China
to Germany
to United States to Canada
BRAZIL
URUGUAY
PARAGUAY
COLOMBIA
BOLIVIA
MEXICO
ECUADOR
R. B. DEVENEZUELA
PERU
ARGENTINA
DOMINICANREP.
THE BAHAMAS
COSTA RICA
HAITI
Puerto Rico(US)
PANAMA
TRINIDAD AND TOBAGOGRENADAST. VINCENT AND THE GRENADINES
ST. LUCIABARBADOS
DOMINICAANTIGUA AND BARBUDAST. KITTS AND NEVIS
GUYANA
SURINAME
BELIZE
HONDURAS
NICARAGUA
JAMAICA
GUATEMALAEL SALVADOR
IBRD 41832SEPTEMBER 2015
Top export product by type
Agricultural
Metal based
Light manufacturing
Heavy manufacturing
Economies not in Latin Americaand the Caribbean
Not in the Doing Business sample
F I J I
C H I N A
M O N G O L I A
THAILAND
CAMBODIA
P A P U AN E WG U I N E A
PALAUFEDERATED STATES
OF MICRONESIA
MARSHALLISLANDS
K I R I B A T I
SOLOMONISLANDS
VANUATU
MYANMAR
I N D O N E S I A
LAOP. D. R.
VIETNAM
TIMOR-LESTE
SINGPORE
BRUNEIDARUSSALAM
PHILIPPINES
TONGA
SAMOA
M
A L A Y S I A
BHUTANNEPAL
INDIA BANGLADESH
SRILANKA
MALDIVES
PAKISTAN
AFGHANISTAN
Hong Kong,SAR, China
Taiwan,China
to United Kingdom
to Netherlands
to Germany
to United States
to United States
to Germany
to Australia
to Japanto Rep.
of Korea
F I J I
C H I N A
M O N G O L I A
THAILAND
CAMBODIA
P A P U AN E WG U I N E A
PALAUFEDERATED STATES
OF MICRONESIA
MARSHALLISLANDS
K I R I B A T I
SOLOMONISLANDS
VANUATU
MYANMAR
I N D O N E S I A
LAOP. D. R.
VIETNAM
TIMOR-LESTE
SINGPORE
BRUNEIDARUSSALAM
PHILIPPINES
TONGA
SAMOA
M
A L A Y S I A
BHUTANNEPAL
INDIA BANGLADESH
SRILANKA
MALDIVES
PAKISTAN
AFGHANISTAN
Hong Kong,SAR, China
Taiwan,China
IBRD 41849SEPTEMBER 2015
Top export product by type
Agricultural
Metal based
Light manufacturing
Heavy manufacturing
Economies not in South Asia orEast Asia and the Pacific
Not in the Doing Business sample
to China
AUSTRALIA
CANADA
UNITED STATES JAPAN
NEWZEALAND
CHILE
ISRAEL
EUROPE
REP. OFKOREA
AUSTRALIA
CANADA
UNITED STATES JAPANREP. OFKOREA
NEWZEALAND
CHILE
ISRAEL
EUROPE
IBRD 41803SEPTEMBER 2015
Top export product by type
Agricultural
Metal based
Light manufacturing
Heavy manufacturing
Economies not in the OECDhigh-income group
Not in the Doing Business sample
to Sweden
to Germany
to Austria
to Iraq
to Greece
to China
to China
to Brazil
to France
to Italy
KAZAKHSTAN
KYRGYZ REP.
TAJIKISTANUZBEKISTAN
TURKEY
CYPRUS
BULGARIAFYRMACEDONIA
ALBANIA
MONTE-NEGRO
SANMARINO
ROMANIACROATIA
BOSNIA &HERZ. SERBIA
KOSOVO
LITHUANIA
LATVIA
AZERBAIJAN
GEORGIA
ARMENIA
RUSSIAN FEDERATION
MOLDOVA
UKRAINE
BELARUS
RUSSIANFED.
KAZAKHSTAN
KYRGYZ REP.
TAJIKISTANUZBEKISTAN
TURKEY
CYPRUS
BULGARIAFYRMACEDONIA
ALBANIA
MONTE-NEGRO
SANMARINO
ROMANIACROATIA
BOSNIA &HERZ. SERBIA
KOSOVO
LITHUANIA
LATVIA
AZERBAIJAN
GEORGIA
ARMENIA
RUSSIAN FEDERATION
MOLDOVA
UKRAINE
BELARUS
RUSSIANFED.
IBRD 41828SEPTEMBER 2015 Top export product by type
Agricultural
Metal based
Light manufacturing
Heavy manufacturing
Economies not in Europe andCentral Asia
Not in the Doing Business sample
Source: Doing Business database. Note: The figure reflects World Bank regional classifications, which may differ from common geographic classifications, especially in the case of OECD high-income economies.
doing Business 201688
Of 69 economies whose top export is an agricultural product, 56 have product-specific procedures for this export—while among 118 economies whose top export is a metal-based, heavy manufacturing or light manufacturing product, only 25 have product-specific procedures for it. These economies span all regions and income groups, from Norway among OECD high-income economies to Guinea-Bissau in Sub-Saharan Africa. Both Grenada and Australia, for example, require sanitary inspections and certificates for their top export product. Yet completing border compliance procedures takes 101 hours and $1,034 for an exporter of nutmeg in Grenada, while it takes only 36 hours and $749 for an exporter of meat in Australia. And completing documentary compli-ance takes 10 times as many hours for the exporter in Grenada (77) as it does for the exporter in Australia (7). The exporter in Grenada must contact the Ministry of Agriculture several days in advance and wait to obtain a hard-copy document to clear customs. In Australia, by contrast, quarantine authorities work closely with both producers and customs authorities throughout the production process. What matters is not whether enhanced inspections and procedures are
required—but whether they are carried out efficiently.
IMPORTING AUTO PARTS
While top export products vary widely, all 189 economies import similar products. The explanation for this is intraindustry trade, driven mostly by the global nature of modern production techniques. Supply chains (for raw materials, intermediate goods and final products) extend around the globe in search of higher quality and lower prices—both benefiting from and inducing reductions in the time and cost for international trade. This phenomenon is represented in manufactured products, and it allows the selection of a single import product—auto parts—for all 189 economies. Focusing the case study on the import process for a single homoge-neous product makes the resulting data even more comparable.
Importing auto parts involves greater time and cost on average than export-ing does. Intuitively, it makes sense that imports face more inspections (increas-ing border compliance time and cost) as well as more procedures (increasing documentary compliance time and
cost). In fact, 40% of economies require inspections by other agencies in addition to customs when importing auto parts. Yet why are the average time and cost to import auto parts almost in line with the averages to export agricultural products?
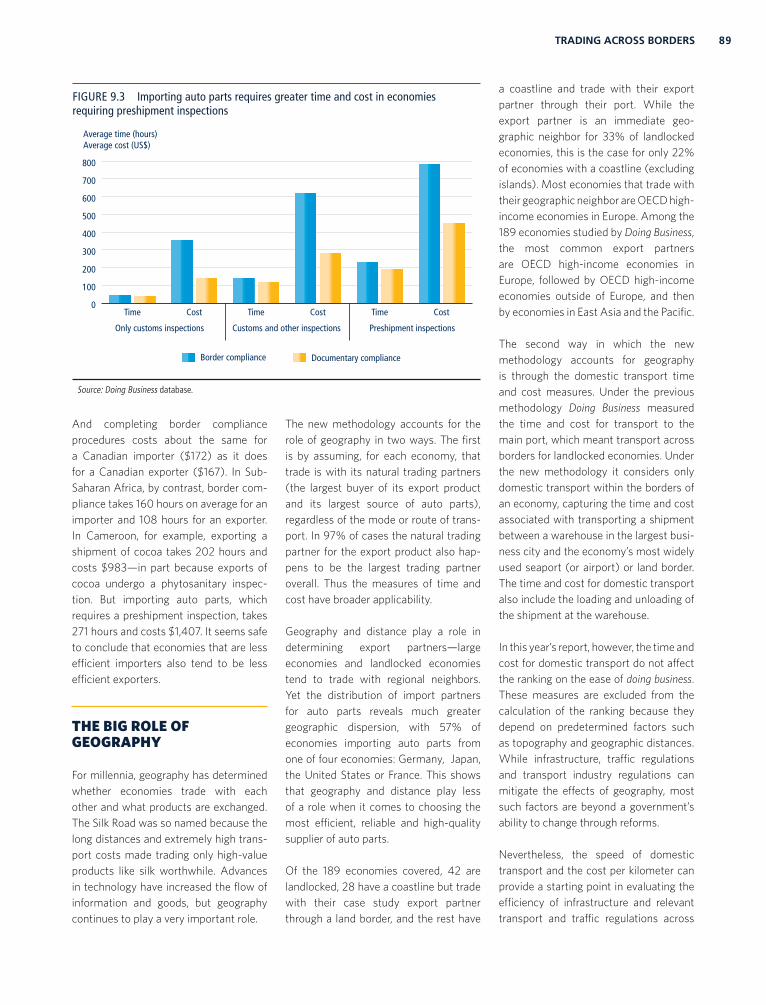
One reason is that another 17% of economies also require preshipment inspections—inspections conducted in the economy of origin by third-party companies. These economies have significantly greater border and documentary compliance times and costs for importing auto parts (figure 9.3). While the existence of protectionist measures cannot be denied, some import inspections are important in protecting con-sumers. Even so, there is potential to improve the efficiency of preshipment inspections and reduce costs for traders. Among the economies requiring such inspections for auto parts, border compliance times range from 56 hours to 1,330, revealing much room for improvement.
While importing generally requires great-er time and cost than exporting, compar-ing the data for economies shows that those that perform well in the time and cost to export their product of compara-tive advantage often also perform well in the time and cost to import auto parts. Of the top 10 performers in the border compliance time to export (excluding the European Union), 6 are also in the top 10 in the border compliance time to import. This pattern is repeated at the other end of the spectrum, with 5 of the bottom 10 performers on this measure for exporting also being in the bottom 10 for importing.
Similar patterns emerge across regions. Importing takes substantially less time on average in OECD high-income economies than in other economies, and so does exporting. Take the example of Canada, where traders benefit from a well-functioning electronic system linking Canadian and U.S. customs. The entire border compliance process between Canada and the United States can be completed in two hours.
FIGURE 9.2 Exporting agricultural products takes more time and cost than exporting other products
0
100
200
300
400
500
600
Nonagricultural productsAgricultural products
CostTimeCostTime
Documentary compliance Border compliance
Average time (hours) Average cost (US$)
Source: Doing Business database.
89TrAding Across Borders
And completing border compliance procedures costs about the same for a Canadian importer ($172) as it does for a Canadian exporter ($167). In Sub-Saharan Africa, by contrast, border com-pliance takes 160 hours on average for an importer and 108 hours for an exporter. In Cameroon, for example, exporting a shipment of cocoa takes 202 hours and costs $983—in part because exports of cocoa undergo a phytosanitary inspec-tion. But importing auto parts, which requires a preshipment inspection, takes 271 hours and costs $1,407. It seems safe to conclude that economies that are less efficient importers also tend to be less efficient exporters.
THE BIG ROLE OF GEOGRAPHY
For millennia, geography has determined whether economies trade with each other and what products are exchanged. The Silk Road was so named because the long distances and extremely high trans-port costs made trading only high-value products like silk worthwhile. Advances in technology have increased the flow of information and goods, but geography continues to play a very important role.
The new methodology accounts for the role of geography in two ways. The first is by assuming, for each economy, that trade is with its natural trading partners (the largest buyer of its export product and its largest source of auto parts), regardless of the mode or route of trans-port. In 97% of cases the natural trading partner for the export product also hap-pens to be the largest trading partner overall. Thus the measures of time and cost have broader applicability.
Geography and distance play a role in determining export partners—large economies and landlocked economies tend to trade with regional neighbors. Yet the distribution of import partners for auto parts reveals much greater geographic dispersion, with 57% of economies importing auto parts from one of four economies: Germany, Japan, the United States or France. This shows that geography and distance play less of a role when it comes to choosing the most efficient, reliable and high-quality supplier of auto parts.
Of the 189 economies covered, 42 are landlocked, 28 have a coastline but trade with their case study export partner through a land border, and the rest have
a coastline and trade with their export partner through their port. While the export partner is an immediate geo-graphic neighbor for 33% of landlocked economies, this is the case for only 22% of economies with a coastline (excluding islands). Most economies that trade with their geographic neighbor are OECD high-income economies in Europe. Among the 189 economies studied by Doing Business, the most common export partners are OECD high-income economies in Europe, followed by OECD high-income economies outside of Europe, and then by economies in East Asia and the Pacific.
The second way in which the new methodology accounts for geography is through the domestic transport time and cost measures. Under the previous methodology Doing Business measured the time and cost for transport to the main port, which meant transport across borders for landlocked economies. Under the new methodology it considers only domestic transport within the borders of an economy, capturing the time and cost associated with transporting a shipment between a warehouse in the largest busi-ness city and the economy’s most widely used seaport (or airport) or land border. The time and cost for domestic transport also include the loading and unloading of the shipment at the warehouse.
In this year’s report, however, the time and cost for domestic transport do not affect the ranking on the ease of doing business. These measures are excluded from the calculation of the ranking because they depend on predetermined factors such as topography and geographic distances. While infrastructure, traffic regulations and transport industry regulations can mitigate the effects of geography, most such factors are beyond a government’s ability to change through reforms.
Nevertheless, the speed of domestic transport and the cost per kilometer can provide a starting point in evaluating the efficiency of infrastructure and relevant transport and traffic regulations across
FIGURE 9.3 Importing auto parts requires greater time and cost in economies requiring preshipment inspections
0
100
200
300
400
500
600
700
800
Documentary complianceBorder compliance
CostTimeCostTimeCostTime
Only customs inspections Customs and other inspections Preshipment inspections
Average time (hours) Average cost (US$)
Source: Doing Business database.
doing Business 201690
economies. Data show that the cost and speed vary by income group, region and type of geography, while there is a clear pattern showing that domestic trans-port speed increases with the level of economic development (figure 9.4).
CONCLUSION
The data collected under the new method-ology for the trading across borders indica-tors reveal that economies’ top export products are quite region specific—for example, OECD high-income economies tend to export manufactured products while Sub-Saharan African economies tend to export agricultural products. The identity of the top export partner also reveals the importance of geography; economies tend to export to those close to them. Trade in auto parts, however, is highly concentrated, with just four economies being the major suppliers to 57% of the world. This reflects the nature of comparative advantage as well as the global span of modern produc-tion techniques.
The benchmark data collected for this year’s report reveal that both the type of product being traded and the geographic location of trading partners affect trade costs. But one of the determinants of
the time and cost for trading across borders is the efficiency of regulation and its implementation. Exporting an agricultural product involves greater time and cost than exporting a machine. But among the economies whose top export is an agricultural product, the time and cost to export that product vary greatly. This suggests that neither comparative advantage nor geography is destiny. Smart regulations that are implemented well can protect national borders without unduly penalizing traders, consumers or producers.
NOTES
This case study was written by Cécile Ferro, Khrystyna Kushnir, Mathilde Lugger, Valentina Saltane, Brandon Thompson and Inés Zabalbeitia Múgica.
1. WTO 2014. 2. WTO 2008.3. Wacziarg and Welch 2008. 4. Madsen 2007. 5. Wagner 2007. 6. Krueger 1998. 7. OECD 2014. 8. For 11 economies the data are collected
separately for both the largest business city and the second largest one.
FIGURE 9.4 The cost and speed of domestic transport vary across income groups
0
5
10
15
20
25
30
Domestic transport cost Domestic transport speed
High incomeUpper middle incomeLower middle incomeLow income0
5
10
15
20
25
30
Average domestic transport speed (kilometers per hour)
Average domestic transport cost (US$ per kilometer)