Page 1
©2011 Chi Solutions, Inc. Proprietary and Confidential.
Executive War College 2011
Why Your Hospital Lab Outreach Program Leaves Big Money on the Table: Six Ways to Boost Net Revenue and Net Profits
Presented byKathleen A. Murphy, PhDChief Executive Officer
©2011 Chi Solutions, Inc. Proprietary and Confidential.1
BasisData from 9th Annual National Outreach Survey (2010)Experience as a lab executive in hospital and independent labsKnowledge gained from working with clientsInterviews
Tom Hirsch of Laboratory Billing SolutionsJohn Leskiw of Quadax
Page 2
©2011 Chi Solutions, Inc. Proprietary and Confidential.2
9th Annual National Outreach SurveyPrimary Outreach Program Weaknesses
PRIMARY OUTREACH PROGRAM WEAKNESSES
Billing and collections is always among the top five weaknesses in this survey.
©2011 Chi Solutions, Inc. Proprietary and Confidential.3
9th Annual National Outreach SurveyProfitability Data
CoreLaboratory (8)
Stand‐AloneHospital Laboratory (39)
% Contribution Margin % Contribution Margin
MaximumUpper QuartileMedianLower QuartileMinimum
Average (Mean)Standard Deviation
43.0%39.3%24.0%8.0%2.0%
23.3%20.3%
53.0%30.0%15.0%10.0%3.0%
20.3%15.1%
MaximumUpper QuartileMedianLower QuartileMinimum
Average (Mean)Standard Deviation
$17,000,000$10,101,374$3,200,000$2,162,660$1,400,000
$6,589,724$5,928,821
$70,795,982$9,649,388$5,571,402$2,452,363$150,000
$9,075,893$13,451,086
Range of profitability from 15 to 25 percent with core labs generally higher than stand-alone labs.
Page 3
©2011 Chi Solutions, Inc. Proprietary and Confidential.4
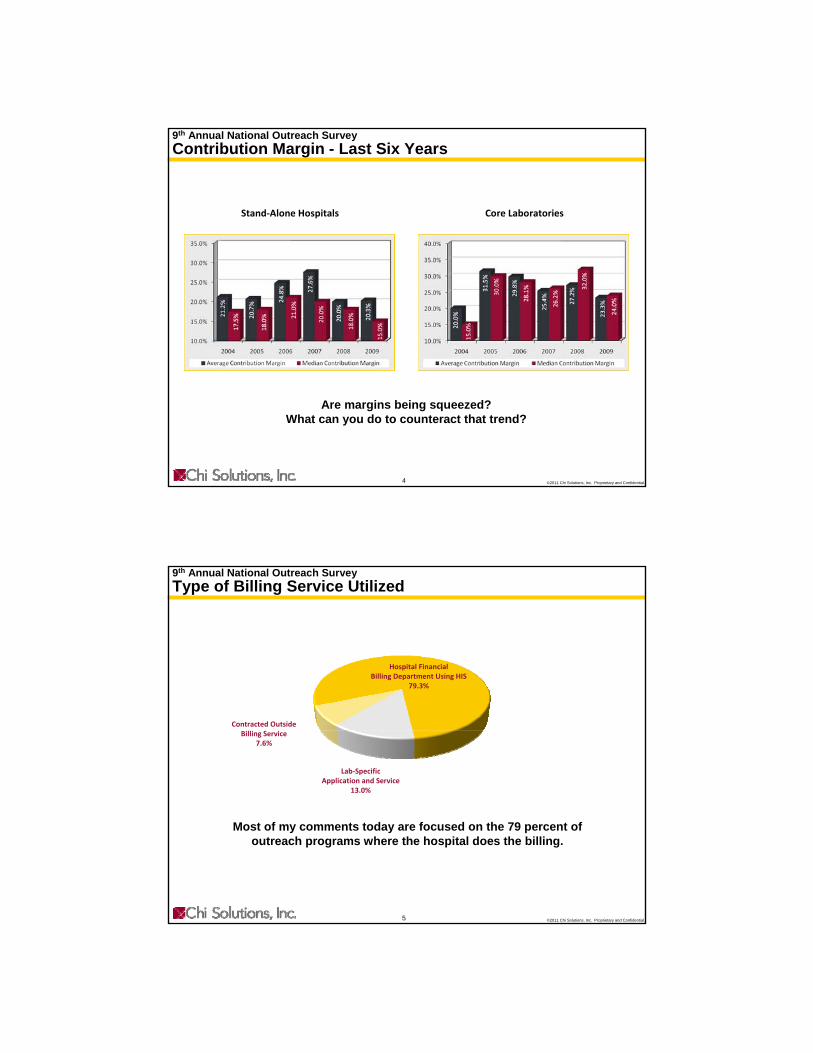
9th Annual National Outreach SurveyContribution Margin - Last Six Years
Stand‐Alone Hospitals Core Laboratories
Are margins being squeezed?What can you do to counteract that trend?
©2011 Chi Solutions, Inc. Proprietary and Confidential.5
9th Annual National Outreach SurveyType of Billing Service Utilized
Hospital Financial Billing Department Using HIS
79.3%
Lab‐Specific Application and Service
13.0%
Contracted OutsideBilling Service
7.6%
Most of my comments today are focused on the 79 percent of outreach programs where the hospital does the billing.
Page 4
©2011 Chi Solutions, Inc. Proprietary and Confidential.6
9th Annual National Outreach SurveyBad Debt and DSO
Bad Debt Rate
MaximumUpper QuartileMedianLower QuartileMinimum
Average (Mean)
11.0%7.3%4.0%2.4%1.0%
5.0%
Know the Bad Debt RateDon’t Know
27.3%72.7%
Days Sales Outstanding (DSO)
MaximumUpper QuartileMedianLower QuartileMinimum
Average (Mean)
11049413226
45
Know the DSODon’t Know
29.4%70.6%
73 percent and 71 percent of outreach programs do not know their bad debt or DSO.
©2011 Chi Solutions, Inc. Proprietary and Confidential.7
9th Annual National Outreach SurveyBad Debt and DSO Over Six Years
Bad Debt Days Sales Outstanding (DSO)
For those who know this information, performance has been trending better over the last few years.
Page 5
In Reverse Order of SignificanceFrom Six to One
Reasons Why $ is Left On The Table
Top 6 Countdown
NOT FIRING“BAD” CLIENTS
Reason #6
Page 6
©2011 Chi Solutions, Inc. Proprietary and Confidential.10
#6 Not Firing “Bad” ClientsAll business is not “good” businessNeed systems to measure profitability by clientCase study - Midwestern Hospital
Profitability By Client - Rank Order
©2011 Chi Solutions, Inc. Proprietary and Confidential.11
Midwestern Hospital
Many of the Top Revenue Clients Were Unprofitable
AfterProfitability of $1M
Raised client pricing or dropped client within 60 days
Limited service area to reduce courier costs
Reduced client base by 30%
Dropped many of largest clients
BeforeLosing $400K annually
Client pricing
Cost of couriers
Large service area
Confusing revenue with profitability
Impact
Shift of $1.4M in Profitability
Page 7
©2011 Chi Solutions, Inc. Proprietary and Confidential.12
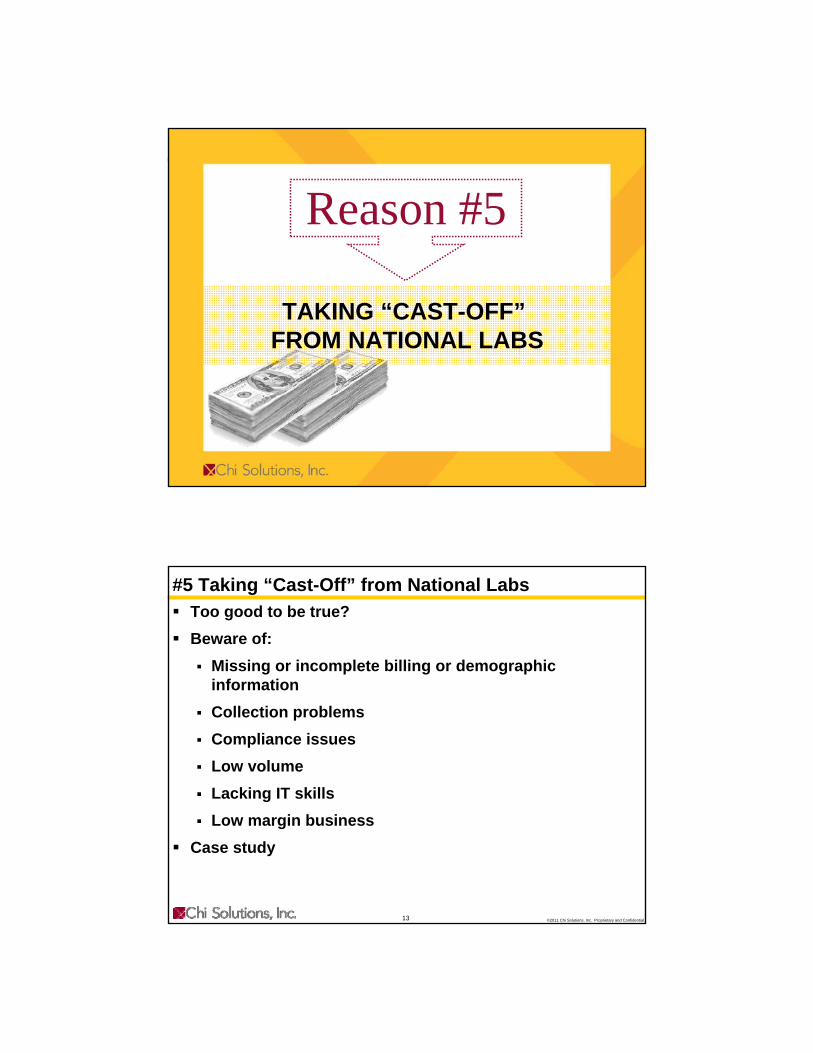
Reason #5
TAKING “CAST-OFF”FROM NATIONAL LABS
©2011 Chi Solutions, Inc. Proprietary and Confidential.13
#5 Taking “Cast-Off” from National LabsToo good to be true?Beware of:
Missing or incomplete billing or demographic informationCollection problemsCompliance issuesLow volumeLacking IT skillsLow margin business
Case study
Page 8
©2011 Chi Solutions, Inc. Proprietary and Confidential.14
“Cast-Offs” Were Not Profitable
Case Study: Mid-Atlantic Health System
Physician Office Business Before After
Revenues 4,012,986 3,050,089 Expenses 4,194,799 2,229,072
Contribution Margin (181,813) 821,017 Contribution Percent (5) 27
Nursing Home Business
Revenue 931,058 -Expenses 1,288,958 -
Contribution Margin (357,900) -Contribution Percent (38) -
TotalContribution Margin (539,713) 821,017 Contribution Percent (11) 27
Total Change of
$1.4M!
©2011 Chi Solutions, Inc. Proprietary and Confidential.15
WRITE-OFF BALANCETOO HIGH
Reason #4
Page 9
©2011 Chi Solutions, Inc. Proprietary and Confidential.16
#4 Write-Off Balance Too HighWrite-off balance for many hospitals is $50For labs, should be $3 to $5 (difference of tenfold)Typical co-pay or deductible ranges from $25 to $48What does this mean to an average lab?
©2011 Chi Solutions, Inc. Proprietary and Confidential.17
#4 Write-Off Balance Too High
Example Calculation of Lost Money from Write-Offs
Typical lab has a co-pay/deductible on 20 percent of patientsA lab seeing 1,000 patients per day will have 200 patients getting an average bill of $35
$35 x 200 Patients x 260 Billing Days/Year = $1.82M Lost to Write-Offs*
Can you afford to leave that on the table?
*Data from Laboratory Billing Solutions.
Page 10
©2011 Chi Solutions, Inc. Proprietary and Confidential.18
UNTIMELY FOLLOW-THROUGH ON MISSING BILLING INFO
Reason #3
©2011 Chi Solutions, Inc. Proprietary and Confidential.19
#3 Untimely Follow-Through—Missing Billing InfoShould be within 24 to 48 hoursPercent collection is disproportionate to time to follow up
After 60 to 90 days, likelihood of getting information from physician office or patient goes downMay exceed filing limits (90 days for most commercial payors)DSO goes up (25 to 30 days for national labs versus 50 to 110 days for hospital labs)Collection rates go down
Page 11
©2011 Chi Solutions, Inc. Proprietary and Confidential.20
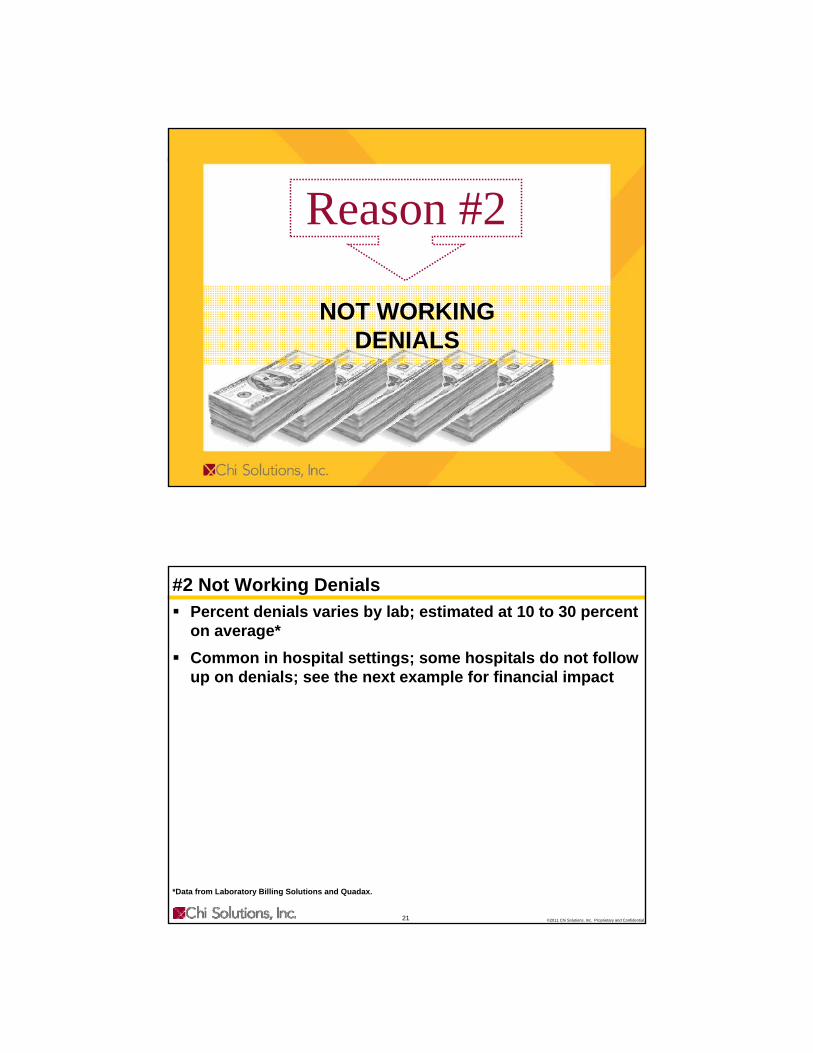
Reason #2
NOT WORKINGDENIALS
©2011 Chi Solutions, Inc. Proprietary and Confidential.21
#2 Not Working DenialsPercent denials varies by lab; estimated at 10 to 30 percent on average*Common in hospital settings; some hospitals do not follow up on denials; see the next example for financial impact
*Data from Laboratory Billing Solutions and Quadax.
Page 12
©2011 Chi Solutions, Inc. Proprietary and Confidential.22
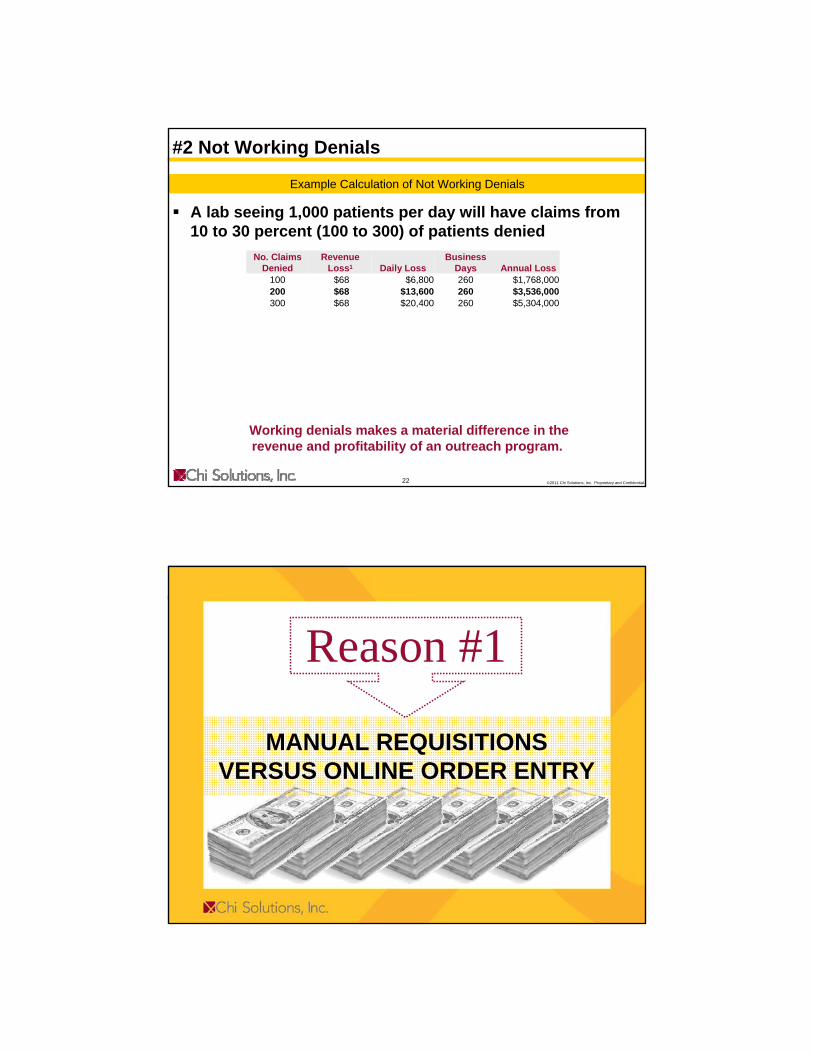
#2 Not Working Denials
A lab seeing 1,000 patients per day will have claims from 10 to 30 percent (100 to 300) of patients denied
No. ClaimsDenied
RevenueLoss1 Daily Loss
BusinessDays Annual Loss
100 $68 $6,800 260 $1,768,000 200 $68 $13,600 260 $3,536,000 300 $68 $20,400 260 $5,304,000
RevenueLoss2
100 $34 $3,400 260 $884,000 200 $34 $6,800 260 $1,768,000 300 $34 $10,200 260 $2,652,000
Working denials makes a material difference in the revenue and profitability of an outreach program.
Example Calculation of Not Working Denials
1Assumes total claim denied.2Assumes 1/2 claim denied.
©2011 Chi Solutions, Inc. Proprietary and Confidential.23
MANUAL REQUISITIONSVERSUS ONLINE ORDER ENTRY
Reason #1
Page 13
©2011 Chi Solutions, Inc. Proprietary and Confidential.24
#1 Manual Requisitions Versus Online Order EntryThe most successful labs have online order entry for 80 to 90 percent of client base
AccuracyCompletenessTimelinessNo denialsNo re-work
Outcome:
COSTSDOWN
PROFITABILITYUP
REVENUEUP
©2011 Chi Solutions, Inc. Proprietary and Confidential.25
Want Some “Free” Money?
Working Denials
Reduce Write‐Offs
No Cast‐Off from Nationals
Firing "Bad" Clients
1Example lab with 1,000 requisitions per day or 13 to 15M in annualized net revenue.2Does not include impact of timely follow‐through on missing information or computerized order‐entry.
This slide is meant to be hypothetical. We recognize that it is unlikely that any one lab will have all these problems…
$8
$6
$4
$2
$0
Computerized OE2 ?Timely Follow‐Through Missing Information2 ?
Page 14
©2011 Chi Solutions, Inc. Proprietary and Confidential.26
How Can Things Be So Bad?
Part of theBigger Picture
©2011 Chi Solutions, Inc. Proprietary and Confidential.27
9th Annual National Outreach SurveyAccess to Information - Key Performance Indicators
Page 15
©2011 Chi Solutions, Inc. Proprietary and Confidential.28
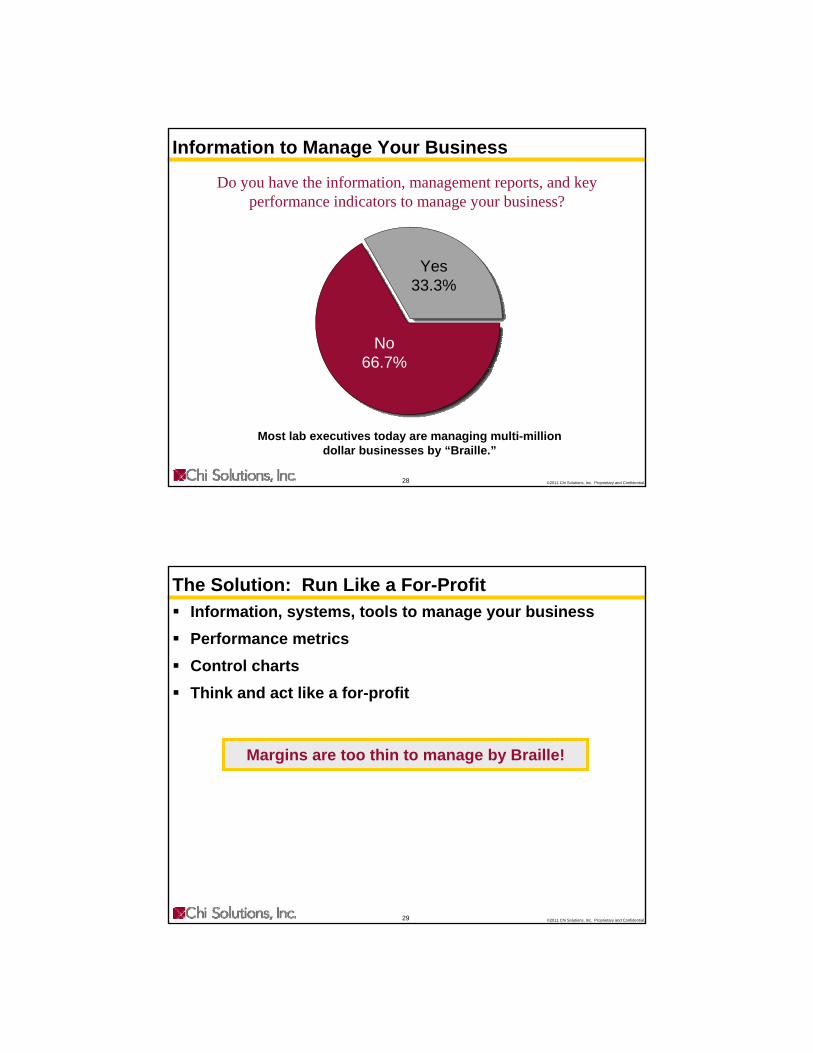
Information to Manage Your Business
Do you have the information, management reports, and key performance indicators to manage your business?
Yes33.3%
No66.7%
Most lab executives today are managing multi-million dollar businesses by “Braille.”
©2011 Chi Solutions, Inc. Proprietary and Confidential.29
Margins are too thin to manage by Braille!
The Solution: Run Like a For-ProfitInformation, systems, tools to manage your businessPerformance metricsControl chartsThink and act like a for-profit
Page 16
©2011 Chi Solutions, Inc. Proprietary and Confidential.30
Planting the Seeds…
Apply What You Learned Here Today and Watch Your Lab Business Grow!
Kathleen Murphy, PhDChief Executive OfficerOffice: (978) 777-9766Mobile: (617) [email protected]