Widely distributed and regionally isolated!Drivers of genetic structure in Gammarusfossarum in a human-impacted landscapeMartina Weiss1* and Florian Leese1,2
Abstract
Background: The actual connectivity between populations of freshwater organisms is largely determined byspecies biology, but is also influenced by many area- and site-specific factors, such as water pollution and habitatfragmentation. Therefore, the prediction of effective gene flow, even for well-studied organisms, is difficult. Theamphipod crustacean Gammarus fossarum is a key invertebrate in freshwater ecosystems and contains many crypticspecies. One of these species is the broadly distributed G. fossarum clade 11 (type B). In this study, we tested forfactors driving the genetic structure of G. fossarum clade 11 in a human-impacted landscape at local and regionalscales. To determine population structure, we analyzed the mitochondrial cytochrome c oxidase 1 (CO1) gene of2,086 specimens from 54 sampling sites and microsatellite loci of 420 of these specimens from ten sites.
Results: We detected strong overall genetic differentiation between populations at regional and local scales withboth independent marker systems, often even within few kilometers. Interestingly, we observed only a weakcorrelation of genetic distances with geographic distances or catchment boundaries. Testing for factors explainingthe observed population structure revealed, that it was mostly the colonization history, which has influenced thestructure rather than any of the chosen environmental factors. Whereas the number of in-stream barriers did notexplain population differentiation, the few large water reservoirs in the catchment likely act as dispersal barriers.
Conclusions: We showed that populations of Gammarus fossarum clade 11 are strongly isolated even at localscales in the human-impacted region. The observed genetic structure was best explained by the effects of randomgenetic drift acting independently on isolated populations after historical colonization events. Genetic drift inisolated populations was probably further enhanced by anthropogenic impacts, as G. fossarum is sensitive to manyanthropogenic stressors. These findings highlight the importance of small-scale genetic studies to determinebarriers restricting gene flow to prevent further loss of genetic diversity and maintain intact freshwater ecosystems.
BackgroundBiogeographic studies revealed wide ranges for manyfreshwater invertebrate species [1]. This holds true inparticular for species found in temperate and morenorthern latitudes, which had to recolonize habitats afterglacial periods. Examples range from various insect spe-cies with terrestrial adult life stages to purely aquaticspecies, such as amphipod crustaceans and molluscs.
Considering the typically wide ranges and high regionaland local abundances, freshwater invertebrates are oftenregarded as frequent and long distance dispersers (e.g.[2, 3]). Over the past 15 years, however, the paradigm ofwide ranges has been increasingly questioned, as mo-lecular studies revealed the presence of morphologicallycryptic species in many freshwater invertebrate taxa (e.g.[4–6]). These cryptic species often show rather smalland allopatric ranges (e.g. [7, 8]), instead of the presumedbroad distribution of the whole cryptic species complex.One ecologically important freshwater taxon, which
was formerly thought to be widely distributed in central
* Correspondence: [email protected] Ecosystem Research, University of Duisburg-Essen,Universitaetsstrasse 5, Essen D-45141, GermanyFull list of author information is available at the end of the article
and southeastern European streams, is the amphipodcrustacean Gammarus fossarum KOCH, 1836. Several re-cent studies revealed an almost exponentially increasingnumber of overlooked species within the G. fossarum spe-cies complex with enhanced geographic sampling and im-proved sensitivity of molecular detection methods [9–11].The highest species diversity, by far, within the G. fos-sarum species complex was found in the southeastern partof the range, where most of the newly discovered specieswere local endemics with narrow ranges [11]. However,the four central and western European species, in particu-lar clade 11, still show broad distributions [10].Generally, G. fossarum is mainly found in the upper
reaches of streams and is sensitive to organic pollution[12, 13], high ammonium concentrations [14], a lack ofoxygen, and acidification [15]. Owing to its high abun-dances and sensitivity to anthropogenic stressors, G.fossarum is often used in ecotoxicological studies (e.g.[16–18]). However, the precise cryptic species used inthese experiments and whether a single or multiplespecies are used are rarely tested or reported. Validat-ing species assignments prior to experiments is critic-ally important, as studies explicitly investigating G.fossarum type A and B (here referred to as clade 12 and11, after Weiss et al. [10]) revealed ecological differ-ences between the species [19–21]. In further studiescomparing these two species, clade 11 was found to bemore tolerant against tested stressors [14, 22], occurredin areas with higher human impact [19] and was the bettercompetitor in comparison with clade 12 [13], but it alsoshowed higher infection rates for various parasites [23].Additionally, in a direct comparison, populations of clade11 were less differentiated across hundreds of kilometersthan populations of clade 12 [24], but still significantdifferentiation within clade 11 was found on a regionalscale. These findings agree well with the moderate gen-etic differentiation found in a broad geographic area formembers of clade 11 (e.g. [10]). Even though thesefindings may indicate a relatively good dispersal abilityfor G. fossarum clade 11, it is difficult to predict actualdispersal rates, as they can be influenced by area- andsite-specific environmental factors, like water chemis-try, stream bed structure, land use and urbanization inthe riverine environment, and fragmentation of streams byin-stream barriers, like dams or reservoirs (e.g. [25–27]).However, as understanding the patterns and mechanismsof dispersal and connectivity is crucial for predictingpopulation resilience and long-term adaptability of a spe-cies [28], it is important to determine the actual dispersalrates. An already regularly applied approach for thispurpose is the use of genetic markers to estimate effect-ive gene flow between populations, i.e. successful dis-persal leading to genetic exchange between populations(e.g. [3, 29, 30]).
In this study, we tested for factors driving the geneticstructure of G. fossarum clade 11 in a human-impactedlandscape at local and regional scales. To determine thepopulation structure, we used two different genetic markers.For the main analyses, we used the barcoding fragment ofthe mitochondrial cytochrome c oxidase 1 (CO1) gene. Wealso examined nuclear microsatellite markers [31, 32] for asubset of populations to validate the CO1 results. The studyarea was the Sauerland region, a low mountain range inNorth Rhine-Westphalia, Germany, which contains severalsmall nature reserves, but is also used for agriculture,industry, forestry, and tourism. The hydrological structureof streams in the Sauerland region is strongly influencedby anthropogenic factors, such as in-stream barriers oc-curring approximately every 1,000 m [33]. Therefore, theregion is characterized by high site heterogeneity in termsof ecological parameters as well as habitat fragmentation,making it an interesting area to study the impact of an-thropogenic factors on the realized dispersal of aquatic in-vertebrates. To account for these factors, we characterizedsampling sites based on several ecological parametersand combined dense small-scale sampling with broaderregional sampling within a range of 85 km. Specifically,we tested the following hypotheses:
1) Populations of Gammarus fossarum clade 11 aregenetically differentiated at the regional scale whenconsidering the whole study area. In contrastdifferentiation is low at the local scale of fewkilometers with evidence of gene flow betweenpopulations. These expectations are based onprevious genetic analyses of G. fossarum species(e.g. [24, 34–36]).
2) Genetic variation is significantly partitioned afterdrainage basins at any spatial scale within theriverine network according to the Stream HierarchyModel [37, 38], because G. fossarum is confined toaquatic habitats throughout its life cycle. Further,populations show patterns of isolation by distance(IBD) within catchments, especially when consideringthe waterway distance as this pattern was also foundin other population genetic studies of G. fossarumclade 11 (e.g. [24]).
After testing the two hypotheses, we discuss the find-ings in order to identify possible drivers of populationstructure.
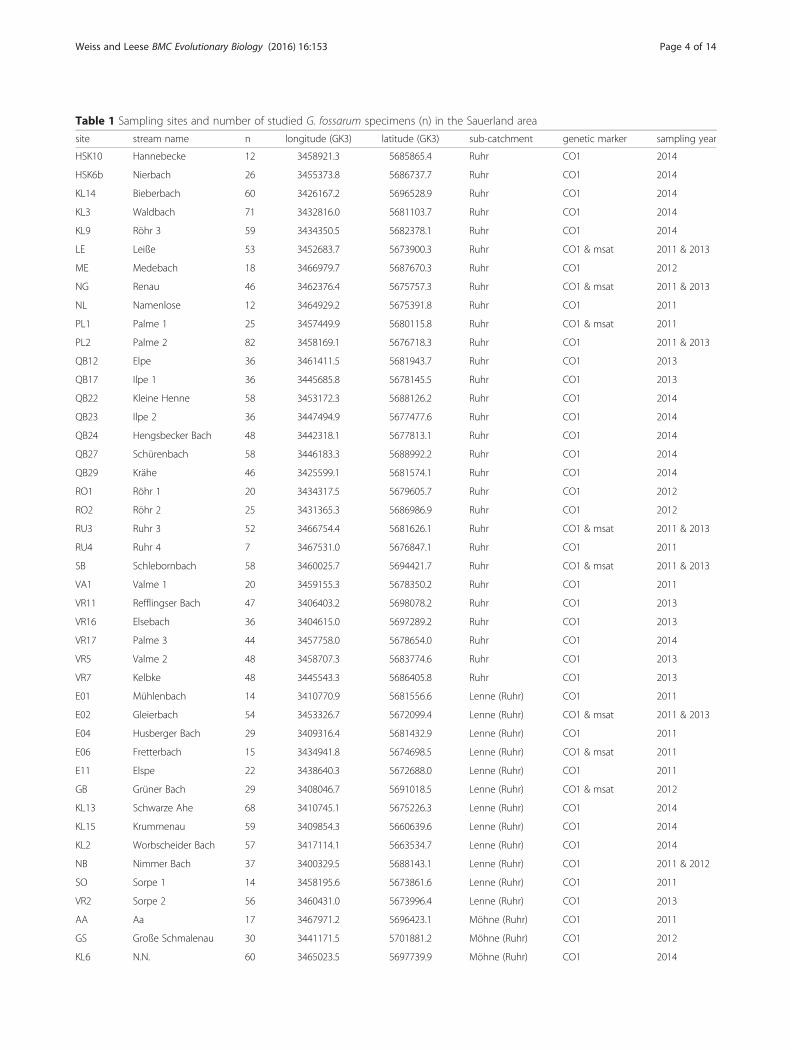
MethodsStudy site and samplingSpecimens of G. fossarum were collected via kick-sam-pling at 54 sampling sites in 45 different streams in theSauerland region (Germany). Animals were preserved in96 % ethanol. The sampling sites were located in three
Weiss and Leese BMC Evolutionary Biology (2016) 16:153 Page 2 of 14
and 2014 (Table 1). Samples from six sites in 2011 wereprovided by Maria Gies and Martin Sondermann (Univer-sity Duisburg-Essen). To examine changes in the geneticstructure of populations over time, seven 2011 samplingsites were resampled in 2013 and one 2011 site was sampledagain in 2012 (Table 1). Additional samples from 2013 and2014 were originally obtained for another study in which astream was sampled at four sites every 200 m with an in-stream barrier between separating sites two and three. Atseven sampling sites in 2014, a similar sampling schemewas used for sewage plants, and, at two sampling sites, simi-lar schemes were used for mining sites. Since no differencesin haplotype frequencies were found between those sites
(FST values were not significant, data not shown), the sam-ples were merged into a single sampling site for this study.
Sequencing and genotypingDNA was extracted from the pereopods of 2,086 speci-mens using a modified salt-extraction protocol [44] (seeAdditional file 2 for details of used protocol). For allspecimens, a fragment of the mitochondrial barcodinggene CO1 was amplified with the standard primersHCO2198 and LCO1490 [45] using the following PCRprotocol: 1× PCR buffer, 0.2 mM dNTPs, 0.5 μM eachprimer, 0.5 μl of DNA template, 0.025 U/μl HotMasterTaq (5 PRIME GmbH, Hamburg, Germany), filled to15 μl with sterile H2O. The PCR settings for CO1 ampli-fication were as follows: initial denaturation at 94 °C for2 min; 34 cycles of denaturation at 94 °C for 20 s, an-nealing at 46 °C for 30 s, and extension at 65 °C for 60 s;final extension at 65 °C for 5 min. The PCR products(9 μl) were purified using 0.5 μl of ExoI (20 U/μl) and1 μl of FastAP (1 U/μl, both enzymes; Thermo FisherScientific, Schwerte, Germany). The reaction was incu-bated for 25 min at 37 °C followed by an inactivationstep at 85 °C for 15 min. Purified PCR products were bi-directionally sequenced by GATC-Biotech (Konstanz,Germany).For 420 specimens from ten sampling sites (Table 1),
eight microsatellite loci were additionally amplified: Gam 2,Gam 14 [31], Gamfos 10, Gamfos 13, Gamfos 18, Gamfos22, Gamfos 27, and Gamfos 28 [32]. For each primer pair,the originally published sequence was adapted to our ana-lysis system by adding a universal M13 tail (5′-CAC GACGTT CTA AAA-3′) to the 5′ ends of the forward primersfor primers developed by Danancher et al. [31] and to thereverse primers for those developed by Westram et al. [32].The amplification of Gam 2, Gam 14, Gamfos 13, Gamfos27, and Gamfos 28 was performed using the followingprotocol: 1× PCR buffer, 0.2 mM dNTPs, 0.2 μMsequence-specific untailed primer, 0.05 μM sequence-specific tailed primer, 0.2 μM fluorescently labelled uni-versal M13 primer, 5 % dimethyl sulfoxide (DMSO),0.5–1 μl of DNA template, 0.025 U/μl HotMaster Taq(5 PRIME GmbH, Hamburg, Germany), filled to 15 μlwith sterile H2O. For Gamfos 10, 18, and 22, betainewas used instead of DMSO. PCR settings for the ampli-fication of Gam2, Gam14, Gamfos 13, Gamfos 18,Gamfos 22, and Gamfos 28 were as follows: initial de-naturation at 94 °C for 2 min; 36 cycles of denaturationat 94 °C for 20 s, annealing at 60 °C for 30 s, and extensionat 65 °C for 30 s; final extension at 65 °C for 45 min. ForGamfos 10 and Gamfos 27, an annealing temperature of54 °C was used.Allele sizes were determined using polyacrylamide gel
electrophoresis on a LI-COR® 4300 DNA Analyzer withthe software SagaGT (LI-COR Biosciences, Bad Homburg,
Weiss and Leese BMC Evolutionary Biology (2016) 16:153 Page 3 of 14
Weiss and Leese BMC Evolutionary Biology (2016) 16:153 Page 4 of 14
Germany). For Gam 2, the alleles could not be scored be-cause too many stutter bands occurred over a range of 90base pairs.
Sequence data analysisSequences were assembled and edited in Geneious8.1.2 (http://www.geneious.com, [46]), and a multiplesequence alignment was computed with MAFFT [47] asimplemented in Geneious (automatic algorithm selection,default settings). Genetic diversity was calculated as haplo-type diversity using Arlequin 3.5 [48]. A minimum span-ning network was calculated using Arlequin and visualizedusing HapStar 0.7 [49]. To show the position of the haplo-types in a broader phylogenetic context nine sequencesfrom five different clades (3, 10, 11, 12 and 13), which havebeen used in the study of Weiss et al. [10] (GenBank Acces-sion numbers: JN900490, KF521805, KF521817, KF521822,KF521828, KF521829, KF521832, KF521833, KF521835),were added to a dataset of the main haplotypes of this studyand a neighbor-joining Tree was calculated with MEGA6[50], with evolutionary distances computed using theKimura 2-parameter method. To test for population dif-ferentiation, pairwise FST values between populations fromdifferent sampling sites were calculated using Arlequin.Negative values were set to zero. The significance levelsfor this and all subsequent FST calculations were adjustedto account for multiple testing using the false discoveryrate control (FDR, [51]). Additionally, FST values werecalculated using data from multiple years for populationsoriginating from the same stream to test if haplotype fre-quencies changed significantly over time.
Microsatellite data analysisUsing the program MICRO-CHECKER 2.2.3 [52], ourdata set was checked for the occurrence of allelic dropout, stutter bands, and null alleles and null allele fre-quencies were calculated using the Dempster method[53]. All loci in all populations were tested for deviationsfrom Hardy–Weinberg equilibrium (HWE) and from
linkage equilibrium using Arlequin. To estimate geneticdiversity, allelic richness was calculated with the pro-gram HP-Rare 1.0 [54] using rarefaction to correct fordifferences in sample sizes.Genetic distances between populations were calculated as
pairwise FST values in Arlequin. To correct for null alleles,FreeNA [55] was used, in which the ENA correction wasimplemented. To test if the allele frequencies in the popula-tions changed over time, FST values were also calculated be-tween populations originating from the same stream, butsampled in different years.
distance or catchment assignment shape genetic structureand to infer the number of populations, spatial Bayesianclustering models were implemented in the R packageGENELAND, v4.0.5 ([58, 59], R version 3.2.2, [60]). Thenumber of populations K was allowed to vary between 1and 20. For six independent runs, 1,000,000 MCMC itera-tions were calculated, sampling every 100 steps. The max-imum number of nuclei in the Poisson-Voronoi tessellationwas set to 6,300. For post-processing, a burn-in of 1,500 it-erations was used and the pixels along the X-axis were setto 300 and along the Y-axis to 150 according to the ratio ofthe sampling area. A second AMOVA implemented inArlequin using the groups detected in GENELAND wasused to analyze if this clustering better reflects the popula-tion structure than the sub-catchments.To test which factors determine the association of the
individual populations to the GENELAND groups, a dis-criminant analysis was performed in IBM SPSS v. 23.For this analysis, the environmental variables obtainedto characterize sampling sites were independent variablesand the main GENELAND groups (consisting of >3 sites)were dependent variables. Additional to the environmentalvariables, also the geographic position of the samplingsites, represented by their coordinates, was used as a vari-able to include a proxy for the possible influence ofcolonization history on genetic structure. To standardizethe predictor variables, z-scores were calculated in SPSSprior to the discriminant analysis. Further, multicollinear-ity between the 25 environmental variables was tested bycalculating the variance inflation factors (VIFs) for eachvariable using the R package “usdm” [61]. Collinearitybetween variables was assumed for VIFs >10. Aftercalculating the VIFs, the variables, which were highlycollinear, were stepwise excluded from the analysisuntil all values were > 10. Therefore, the following dis-criminant analysis was conducted with a reduced set
of variables. In the discriminant analysis, the stepwiseWilks lambda method was used to select predictors.
ResultsWe generated CO1 sequences for 2,086G. fossarumclade 11 specimens from 54 sampling sites. In the557 bp alignment, we detected 52 variable sites, of which12 were non-synonymous substitutions. Specimens clus-tered into 40 distinct haplotypes (H1–H40), of whichten had a frequency of over 1 % (H1, H7, H12, H19,H21, H28–31, and H33) and were found in 97.2 % of allspecimens (Additional file 3). We observed the mostcommon haplotype, H1, in 38 populations and 48.8 % ofsequences. Other common haplotypes were H19 (19populations; 16.7 % of sequences), H21 (8; 6.8 %), andH33 (6; 11.6 %), and we found all four haplotypes in atleast three sub-catchments. Each of these common hap-lotypes had further derived ones, which were mostly dif-ferentiated by a single mutation, visible in the haplotypenetwork (Fig. 1). H33 and the surrounding haplotypesH34 to H40 were differentiated by at least 14 substitutions(distance between H33 and H31) from all other haplo-types. In the neighbor-joining tree (Additional file 4), allhaplotypes clustered together with sequences belonging toClade 11. As already visible in the network, this clade wasdivided into two sub-clusters (one containing H33 and thesecond all other main haplotypes), but the distance be-tween the two sub-clusters was shallow as compared todistances between the different clades.We only detected eight haplotypes that were shared
between at least two populations (H1, H7, H19–22, H31,and H33) and we observed private haplotypes in 20 pop-ulations. At two sampling sites, i.e., KL15 (n = 59) andKL2 (n = 57), populations consisted exclusively of oneprivate haplotype each. Overall, we detected betweenone and six haplotypes per population, with an average
Fig. 1 Minimum spanning network created from CO1 sequences. Circles represent different haplotypes and their dimensions are scaled based onthe number of sequences, which are given in Table 1. Vertical lines represent missing or unsampled haplotypes. Red edges of circles indicate thatthese haplotypes were found at different sampling sites, while black edges indicate private haplotypes. Haplotypes are colored similar to Fig. 2a
Weiss and Leese BMC Evolutionary Biology (2016) 16:153 Page 6 of 14
of two haplotypes, and a haplotype diversity of between0.00 and 0.68, with an average of 0.16 (Additional file 3).The nucleotide diversity ranged from 0.000 to 0.136 withan average of 0.048 (Additional file 3). In seven of theeight populations for which we compared haplotype fre-quencies among years, we did not observe significantdifferences. The only exception was population NH,where, in the second sampling year, only the mainhaplotype of the population (H21) was rediscovered to-gether with a new haplotype (H20), resulting in a small,but significant, FST value.Of the seven microsatellites analyzed to complement
the CO1 data set, only four were polymorphic in the stud-ied populations (Gamfos 10, 13, 18, and 28). Three of theten populations were also monomorphic for the same al-lele at Gamfos 13. We observed between 4 and 23 allelesin all populations at the different loci. We did not detectsignificant linkage between loci considering all popula-tions. We found evidence for null alleles for three of theloci in different populations. The null allele frequencies,number of alleles, and observed and expected heterozy-gosity (HO and HE) are given in Additional file 5. Null al-lele frequencies ranged from 0.00 to 0.29. We observed
deviations from HWE in all populations for at least onelocus (see Additional file 5). As a measure of genetic diver-sity, we estimated allelic richness using rarefaction for aminimum sample size of 15 diploid individuals. We ob-served an average allelic richness over all loci of between2.5 and 5.3 and we detected private alleles in six of thepopulations (Additional file 5). In two of the populationssampled twice in different years (NH and E02), the allelefrequencies changed over time, resulting in small, but sig-nificant, FST values.
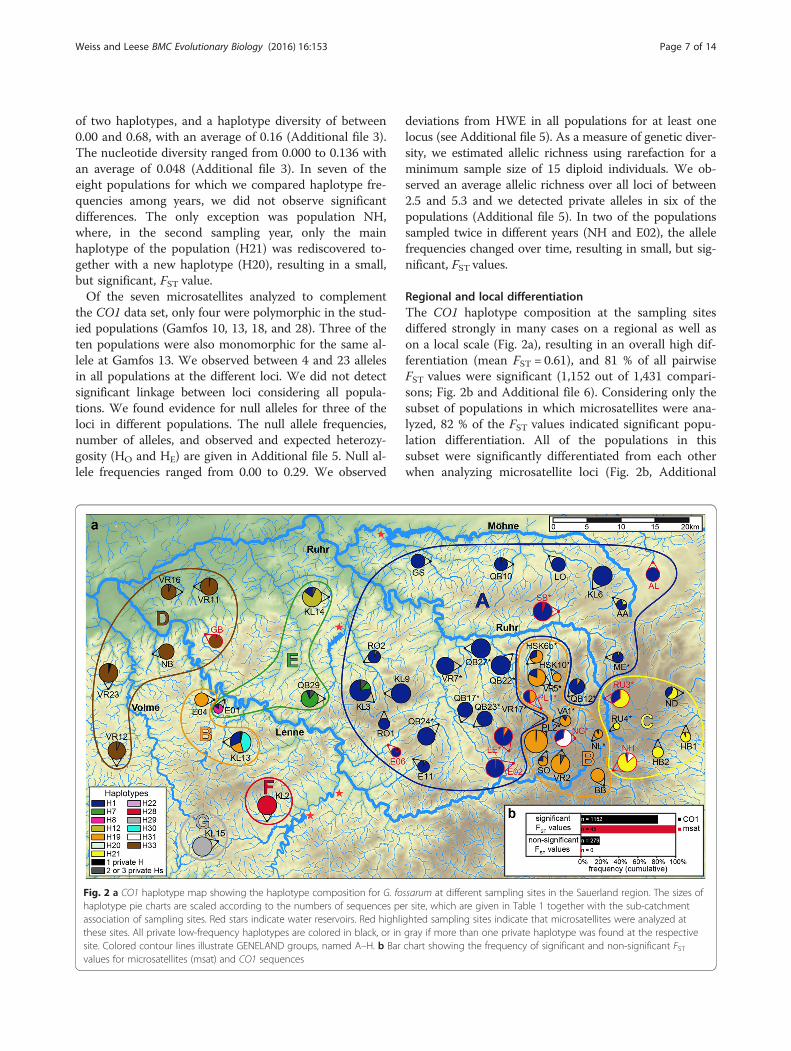
Regional and local differentiationThe CO1 haplotype composition at the sampling sitesdiffered strongly in many cases on a regional as well ason a local scale (Fig. 2a), resulting in an overall high dif-ferentiation (mean FST = 0.61), and 81 % of all pairwiseFST values were significant (1,152 out of 1,431 compari-sons; Fig. 2b and Additional file 6). Considering only thesubset of populations in which microsatellites were ana-lyzed, 82 % of the FST values indicated significant popu-lation differentiation. All of the populations in thissubset were significantly differentiated from each otherwhen analyzing microsatellite loci (Fig. 2b, Additional
Fig. 2 a CO1 haplotype map showing the haplotype composition for G. fossarum at different sampling sites in the Sauerland region. The sizes ofhaplotype pie charts are scaled according to the numbers of sequences per site, which are given in Table 1 together with the sub-catchmentassociation of sampling sites. Red stars indicate water reservoirs. Red highlighted sampling sites indicate that microsatellites were analyzed atthese sites. All private low-frequency haplotypes are colored in black, or in gray if more than one private haplotype was found at the respectivesite. Colored contour lines illustrate GENELAND groups, named A–H. b Bar chart showing the frequency of significant and non-significant FSTvalues for microsatellites (msat) and CO1 sequences
Weiss and Leese BMC Evolutionary Biology (2016) 16:153 Page 7 of 14
file 7), with FST values ranging between 0.07 and 0.57.When estimating FST values with FREENA using theENA method to correct for null alleles, they wereslightly lower in most cases, ranging from 0.06 to 0.55(Additional file 7). Altogether, we detected strong signa-tures of local and regional isolation of G. fossarum popu-lations using both data sets.
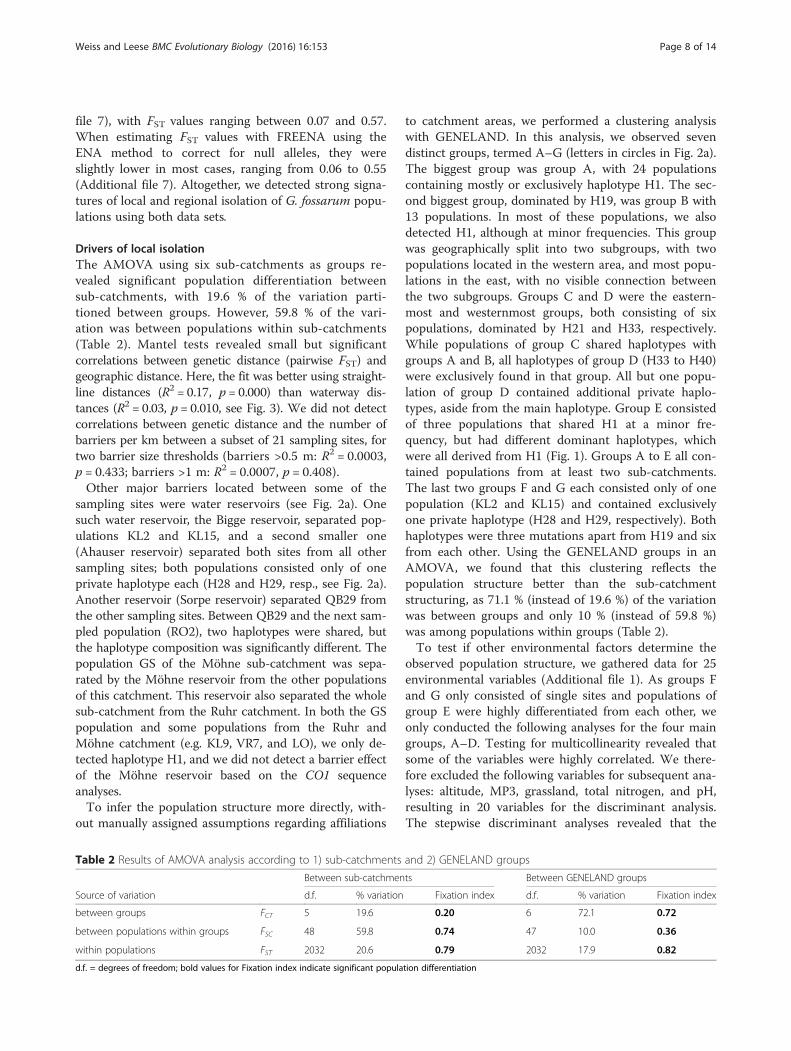
Drivers of local isolationThe AMOVA using six sub-catchments as groups re-vealed significant population differentiation betweensub-catchments, with 19.6 % of the variation parti-tioned between groups. However, 59.8 % of the vari-ation was between populations within sub-catchments(Table 2). Mantel tests revealed small but significantcorrelations between genetic distance (pairwise FST) andgeographic distance. Here, the fit was better using straight-line distances (R2 = 0.17, p = 0.000) than waterway dis-tances (R2 = 0.03, p = 0.010, see Fig. 3). We did not detectcorrelations between genetic distance and the number ofbarriers per km between a subset of 21 sampling sites, fortwo barrier size thresholds (barriers >0.5 m: R2 = 0.0003,p = 0.433; barriers >1 m: R2 = 0.0007, p = 0.408).Other major barriers located between some of the
sampling sites were water reservoirs (see Fig. 2a). Onesuch water reservoir, the Bigge reservoir, separated pop-ulations KL2 and KL15, and a second smaller one(Ahauser reservoir) separated both sites from all othersampling sites; both populations consisted only of oneprivate haplotype each (H28 and H29, resp., see Fig. 2a).Another reservoir (Sorpe reservoir) separated QB29 fromthe other sampling sites. Between QB29 and the next sam-pled population (RO2), two haplotypes were shared, butthe haplotype composition was significantly different. Thepopulation GS of the Möhne sub-catchment was sepa-rated by the Möhne reservoir from the other populationsof this catchment. This reservoir also separated the wholesub-catchment from the Ruhr catchment. In both the GSpopulation and some populations from the Ruhr andMöhne catchment (e.g. KL9, VR7, and LO), we only de-tected haplotype H1, and we did not detect a barrier effectof the Möhne reservoir based on the CO1 sequenceanalyses.To infer the population structure more directly, with-
out manually assigned assumptions regarding affiliations
to catchment areas, we performed a clustering analysiswith GENELAND. In this analysis, we observed sevendistinct groups, termed A–G (letters in circles in Fig. 2a).The biggest group was group A, with 24 populationscontaining mostly or exclusively haplotype H1. The sec-ond biggest group, dominated by H19, was group B with13 populations. In most of these populations, we alsodetected H1, although at minor frequencies. This groupwas geographically split into two subgroups, with twopopulations located in the western area, and most popu-lations in the east, with no visible connection betweenthe two subgroups. Groups C and D were the eastern-most and westernmost groups, both consisting of sixpopulations, dominated by H21 and H33, respectively.While populations of group C shared haplotypes withgroups A and B, all haplotypes of group D (H33 to H40)were exclusively found in that group. All but one popu-lation of group D contained additional private haplo-types, aside from the main haplotype. Group E consistedof three populations that shared H1 at a minor fre-quency, but had different dominant haplotypes, whichwere all derived from H1 (Fig. 1). Groups A to E all con-tained populations from at least two sub-catchments.The last two groups F and G each consisted only of onepopulation (KL2 and KL15) and contained exclusivelyone private haplotype (H28 and H29, respectively). Bothhaplotypes were three mutations apart from H19 and sixfrom each other. Using the GENELAND groups in anAMOVA, we found that this clustering reflects thepopulation structure better than the sub-catchmentstructuring, as 71.1 % (instead of 19.6 %) of the variationwas between groups and only 10 % (instead of 59.8 %)was among populations within groups (Table 2).To test if other environmental factors determine the
observed population structure, we gathered data for 25environmental variables (Additional file 1). As groups Fand G only consisted of single sites and populations ofgroup E were highly differentiated from each other, weonly conducted the following analyses for the four maingroups, A–D. Testing for multicollinearity revealed thatsome of the variables were highly correlated. We there-fore excluded the following variables for subsequent ana-lyses: altitude, MP3, grassland, total nitrogen, and pH,resulting in 20 variables for the discriminant analysis.The stepwise discriminant analyses revealed that the
Table 2 Results of AMOVA analysis according to 1) sub-catchments and 2) GENELAND groups
Between sub-catchments Between GENELAND groups
Source of variation d.f. % variation Fixation index d.f. % variation Fixation index
between groups FCT 5 19.6 0.20 6 72.1 0.72
between populations within groups FSC 48 59.8 0.74 47 10.0 0.36
within populations FST 2032 20.6 0.79 2032 17.9 0.82
d.f. = degrees of freedom; bold values for Fixation index indicate significant population differentiation
Weiss and Leese BMC Evolutionary Biology (2016) 16:153 Page 8 of 14
most useful variable for predicting assignments to theGENELAND groups was longitude; all other variableswere not included in the model. With the resultingmodel, 65 % of the populations clustered correctly to thefour groups, with differences in prediction performancebetween groups (see Additional file 8). While all popula-tions of groups C and D clustered correctly, this was thecase for only 61.5 % of group B and 50.0 % of group Apopulations, as these two groups had a broader geo-graphic range with overlapping longitudinal values.
DiscussionWe analyzed a large number of specimens and popula-tions of the freshwater crustacean G. fossarum clade 11in the anthropogenically heavily impacted Sauerlandregion to identify factors that influence populationstructure and limit dispersal in this species.Our first hypothesis was that populations are genetic-
ally differentiated when considering the regional scale ofthe whole study area, whereas the differentiation is lowat the scale of few kilometers. In agreement with the firstexpectation of this hypothesis we detected strong re-gional differentiation in the Sauerland area, especiallybetween the eastern and westernmost populations. Thewesternmost populations (GENELAND group D) con-tained only haplotypes (H33–H40) separated by at least14 substitutions from the other haplotypes (H1–H32),but we did not detect this high degree of differentiationusing microsatellites. A similar pattern of east-west dif-ferentiation was observed in the stonefly Dinocrascephalotes in the same study area [62]. Specifically, twohighly divergent haplotype groups were found for theCO1 gene. However, contrary to our findings, Elbrechtet al. [62] found haplotypes of these groups to be sharedacross populations of these groups and also detected on-going gene flow using nuclear genes. As the stonefly hasa terrestrial and more mobile life stage, these contrastingpatterns may be explained by differences in mobility. Theobserved divergence between the two G. fossarum clade11 groups (east-west) is likely the result of independent
historic isolation in eastern and western refugia, as sug-gested by Elbrecht et al. (2014) for the stonefly species.Even though G. fossarum populations belonging to thetwo divergent groups seem to be isolated, it is likelythat they can still interbreed when in contact. This isindicated by the low divergence (between 2.51 and3.95 %) in comparison to previous estimates of divergencebetween cryptic species of G. fossarum [10], also visible inthe phylogenetic tree, when comparing intra- and inter-clade divergence. Further, Lagrue et al. [63] found repro-ductive isolation between G. fossarum clades only whenCO1 sequence divergence was greater than 4 %.We did, however, not only find strong differentiation
between populations at a regional scale, but contrary toour hypothesis also at a local scale. Actually, most of thepopulations were highly isolated from each other (80 %of pairwise CO1 FST values were significant), sometimeseven within 2 km in the same stream. The strong iso-lation is further supported by the pattern that manypopulations contained private haplotypes, which mostlydiffered by only a single mutation from the main haplo-type of the respective population. This indicates long-termisolation because independent mutations were able to ac-cumulate in the populations. In contrast to the overallstrong isolation, we found little or no differentiation be-tween some of the populations separated by over 40 kmstraight-line distances and even higher river distances (es-pecially within GENELAND groups A and D) for the CO1gene. However, when analyzing a subset of these popula-tions based on the more rapidly evolving microsatellites,we detected strong differentiation between all populations.Therefore, the subtle differentiation found between popu-lations of group A is most likely not caused by ongoinggene flow; instead, low genetic variation is likely due tobottlenecks and the effects of genetic drift [6, 64].In their study, Westram et al. [24] concluded that differ-
ences in population structure between clade 11 and 12could hint at interspecific differences in dispersal ability,life history or population size. The authors discussed thatdifferences in differentiation levels reflect more likely
Fig. 3 a Correlation between pairwise genetic and waterway distances for sampling sites of the whole Ruhr catchment. b Correlation betweenpairwise genetic and straight-line distances for all sampling sites
Weiss and Leese BMC Evolutionary Biology (2016) 16:153 Page 9 of 14
species specific rather than being driven by geographic ef-fects. However, the strong local differentiation we foundin clade 11 resembled much more the pattern describedfor clade 12 than that of clade 11 [24, 36]. The discrepan-cies observed between the data of Westram et al. [24] andour study suggest that geographic effects can strongly im-pact on the differentiation of populations and with thatprobably on the realized dispersal of populations within aspecies.Based on the SHM [37] our second hypothesis was that
the populations are structured according to catchmentboundaries and show an IBD pattern within catchments.The structuring of populations according to catchmentshas been shown for other crustaceans [65, 66] and an IBDpattern has been detected in G. fossarum [12, 34, 36], spe-cifically in clade 11 [24]. Studying variance partitioningand using the sub-catchment boundaries in an AMOVA,we detected significant partitioning of genetic variance,but most of the variance (59.8 %) was found between pop-ulations within groups, indicating that populations werenot primarily structured by sub-catchments, but were lo-cally isolated within sub-catchments. We found a similarpattern when analyzing the correlation between geneticand geographic distances, as the correlation was signifi-cant, but very weak for both geographic distance metrics(straight-line and waterway distance), especially for water-way distances. The weak signature of sub-catchment-basedstructuring and the stronger correlation between geneticand straight-line distances in comparison to waterway dis-tances indicate that processes other than low dispersalwithin streams are relevant to the genetic structure withinthis species. This inference is also supported by the GENE-LAND analysis, where groups A–E contained populationsfrom at least two sub-catchments each and two populationsin group B were geographically distant to all other popula-tions of this group. Evidence for overland dispersal inaquatic invertebrates, including G. fossarum, was reportedpreviously (e.g. [36, 67, 68]), and it is assumed to occur bytransport via vectors like birds [69–71], large mammals[72, 73], or humans [13]. As some of the springs of thedifferent sub-catchments in our study area are only sep-arated by a few hundred meters and not by mountainranges, overland dispersal is likely possible. However, aspairwise differentiation was high in general, overland dis-persal seems to be more important for rare colonizationevents on evolutionary time scales rather than for recur-rent dispersal at ecological time scales within generations.However, we did not expect the low correlation betweenwaterway and genetic distances. A lack of IBD in otheraquatic invertebrates is often attributed to particularlyweak (e.g. [6, 74–76]) or strong dispersal abilities (e.g.[27, 76–78]). These results may also be explained bythe presence of strong dispersal barriers between popu-lations [79–81]. The slight IBD pattern we found in our
study was mainly caused by the strong differentiationbetween the western- and easternmost populations, asthey were separated by the greatest geographic dis-tances and did not share any haplotypes. Otherwise, formany pairwise comparisons, we detected high geneticdifferentiation at small geographic distances and no dif-ferentiation over long distances. As we found strongpopulation differentiation between populations, indicatedby high and significant FST values, the lack of IBD cannotbe caused by too strong realized dispersal. However, previ-ous studies found IBD in different areas for G. fossarum(e.g. [24]); accordingly, the dispersal ability should gen-erally be sufficient to generate this pattern even thoughthe realized dispersal appears to be very limited here.Therefore, it seems likely that other barriers to geneflow exist. These barriers could either be direct, likedams, weirs, or water reservoirs, or indirect if the con-ditions in connecting areas are unfavorable due to, forexample, anthropogenic land use, organic pollution,acidification, large connecting rivers, or strong compe-tition (e.g. [20, 27, 36, 68, 74, 76, 82, 83]). To analyzethe influence of direct in-stream barriers, we used asubset of populations to determine if the number ofbarriers was correlated with the genetic distance be-tween populations. Based on Mantel tests conductedfor barriers of >0.5 m and >1 m, we did not observe acorrelation with genetic distance, indicating that popula-tion isolation did not simply reflect the number of bar-riers. However, the influence of these barriers on realizeddispersal could not be determined using the currentmarker and sampling scheme. To infer the influence of in-stream barriers more directly, individual barriers shouldbe tested using more rapidly evolving genetic markers.Some of the sampling sites were separated from eachother by water reservoirs, and, with one exception, theseparated populations were significantly differentiatedfrom all other analyzed populations, indicating a strongbarrier effect of these water reservoirs. One exception at afirst glance was in the Möhne sub-catchment, where pop-ulations were dominated by or even consisted exclusivelyof H1. However, as discussed previously, the diversity forthe CO1 gene in this region was too low to detect barriereffects. Therefore, we conclude that in-stream barriers, es-pecially water reservoirs, can have a substantial impact ondispersal, yet they do not explain the general populationstructure observed in this study. With the exception of thewater reservoirs that separate the clearly differentiatedgroups F and G from all other populations there wereno obvious weir- or dam-related boundaries separatingthe groups.In view of the tested parameters that cannot explain
population structure sufficiently the question arises,which other factors ultimately underlie the apparentpopulation structure. To determine if the structure was
Weiss and Leese BMC Evolutionary Biology (2016) 16:153 Page 10 of 14
more influenced by colonization history (represented bythe geographic position of the population) or by envir-onmental factors that may differ between populationgroups, we conducted a discriminant analysis for thefour main groups including variables for both possibledrivers. The best predictor for the assignment of popula-tions to the four GENELAND groups was longitude, indi-cating that the location of each site from east to westdetermines the affiliation to the CO1 clusters. This clearlysuggests that the observed population structure primarilyreflects colonization history. If colonization events occurrarely and are initiated by relatively few individuals, this canlead to strong founder effects; genetic drift in small popula-tions can lead to a strong loss of genetic diversity [64, 84].The maintenance of this structure over time is probablypromoted by a high degree of population isolation, leadingto small effective population sizes and thereby enhancingthe effect of random genetic drift. As G. fossarum is sensi-tive to many anthropogenic stressors, like organic pollution,a lack of oxygen, acidification [15], and high ammoniumconcentrations [14], isolated populations likely underwentdrastic population declines over time, resulting in the lossof genetic diversity in this anthropogenically impacted area.Even though we could not identify a single anthropogenicfactor influencing the population structure, we found popu-lations to be highly isolated on local scales, clearly indicat-ing that there are barriers to gene flow, which were notdetectable with the methods used here.
ConclusionIn this study we found a considerably higher differenti-ation between populations of G. fossarum clade 11 inthe human-impacted Sauerland area than was expectedbased on previous genetic analyses. The strong isolationwas supported by two independent molecular markersystems, indicating that the realized dispersal was low inthe study area. Also contrary to our hypotheses we foundonly a slight isolation by distance (IBD) pattern and struc-turing of populations according to river catchments butrather a strong geographic pattern (east-west differenti-ation). In view of published data, the dispersal ability of G.fossarum clade 11 specimens should be sufficient enoughto create an IBD pattern. In the absence of this we con-clude that there are barriers preventing gene flow partly,even between neighboring populations. Despite the likelyeffect of larger reservoirs on connectivity, we could notdetermine specific anthropogenic factors that directlyinfluence the population structure. In fact, it was bestpredicted by the independent action of genetic drift atlocal sites after initial colonization. These effects arelikely enhanced by the multitude of anthropogenicstressors, because G. fossarum is sensitive to many an-thropogenic stressors. As G. fossarum clade 11 is widelydistributed and is frequently found in the Sauerland
area we conclude that its colonization ability over longtime scales is good. The same holds likely true for itsability to establish new populations based on few colo-nizers, since long distance dispersal by animal vectors isunlikely to occur frequently [3]. Even though we could notdetermine specific anthropogenic factors hindering geneflow, it is likely that the dispersal is influenced by thesefactors because of the exceptionally strong differentiationwe found here in contrast to expectations based the find-ings of an earlier study (Westram et al. [24] and the muchbroader distribution of clade 11 in comparison with theother G. fossarum clades. These findings highlight the im-portance to take regional factors into account when pre-dicting the dispersal ability of species. Further moreresearch is needed to determine the most important bar-riers restricting gene flow between populations to preventfurther losses of genetic diversity and maintain an intactecosystem.
Additional files
Additional file 1: Ecological parameters for individual sampling sites.Group indicates the GENELAND group association of the sampling sites.Site is the abbreviation for each sampling site, and geographiccoordinates are given in the Gauss–Krueger coordinate system. NA: nodata were available for this site. (PDF 66 kb)
Additional file 2: DNA salt-extraction protocol, modified from Sunnucks& Hales [44]. (PDF 51 kb)
Additional file 3: CO1 haplotype information for each sampling site.Group indicates the GENELAND group association of the sampling sites,site is the abbreviation for the sampling site, and n refers to number ofanalyzed specimens per site. # H gives the total number of haplotypes ata site and private H is the number of private haplotypes. H diversity isthe haplotype diversity and H1 to H40 represent the different haplotypes.(PDF 67 kb)
Additional file 4: a: Sampling locations of specimens used in thephylogeny. Symbols in the map correspond with symbols in b toindicate sampling locations of used sequences; the red square indicates theSauerland area in which the specimens belonging to the main haplotypeswere sampled. b: Neighbor-joining tree of main haplotypes and additionalsequences belonging to clades 3, 10, 11, 12 and 13 (sensu Weiss et al. [10]).The tree is drawn to scale, with branch lengths (next to the branches)in the same units as those of the evolutionary distances used to inferthe phylogenetic tree (K2P method). (PDF 2114 kb)
Additional file 5: Microsatellite loci information for the different samplingsites. Site is the abbreviation for the sampling site and n refers to number ofanalyzed specimens per site. AR is the rarefied average allelic richness overloci, and # alleles is the number of alleles found for each locus. HO is theobserved and HE the expected heterozygosity, and bold values indicatesignificant deviations from HWE. (PDF 44 kb)
Additional file 6: Pairwise CO1 FST values between all sampling sites.Sampling sites are indicated by the site abbreviations, and letters fromA–G indicate GENELAND groups. Colors indicate within-group FST values.Asterisks at site names indicate populations where microsatellite loci werealso analyzed. Red and bold FST values indicate significant values. Significancelevels were adjusted according to the FDR. (PDF 67 kb)
Additional file 7: Pairwise microsatellite FST values between all samplingsites. Sampling sites are indicated by the site abbreviations, and lettersfrom A–G indicate GENELAND groups. Colors represent within-group FSTvalues. Red and bold FST values indicate significant values. Significancelevels were adjusted according to the FDR. Below the diagonal, uncorrected
Weiss and Leese BMC Evolutionary Biology (2016) 16:153 Page 11 of 14
FST values are shown; above the diagonal, ENA-corrected FST values areshown. (PDF 42 kb)
Additional file 8: Percentage of populations predicted to belong to differentGENELAND groups according to the discriminant analyses. (PDF 35 kb)
AbbreviationsAMOVA, Analysis of molecular variance; CO1, cytochrome c oxidase 1 gene;FDR, False discovery rate; FST, Fixation index; HWE, Hardy-Weinberg equilibrium;IBD, isolation by distance; SHM, Stream Hierarchy Model; VIF, variance inflationfactor
AcknowledgmentsWe thank Hannah Weigand, Jan Macher, Vasco Elbrecht, Markus Patschke,Vivienne Dobrzinski, Lisa Pöttker, Janis Neumann and Tobias Traub for assistancewith sampling, Maria Gies and Martin Sondermann for providing some of thesamples and Hannah Weigand, Vivienne Dobrzinski, Stefan Gerzmann, MarkusLiebert, Anna Eckert and Julia van der Mond for help in the lab. Wealso gratefully acknowledge the help of the Ruhr-Verband and LANUVin providing the used ecological data. We further thank Ralph Tollrian,Hannah Weigand, Alexander Weigand, Jan Macher, Arne Beermann andChristian K. Feld for helpful discussions and three anonymous Reviewersfrom Axios Review for valuable comments. We thank the Bioedit copyediting service for correcting language in an earlier version of the manuscript.
FundingThis work was funded by a junior research group grant of the Kurt EberhardBode Foundation to FL.
Availability of data and materialSequences of the 40 haplotypes are available in GenBank under theaccession numbers KX065366 – KX065405. Individual Sequences andmicrosatellite data can be made available upon request.
Authors’ contributionsMW and FL conceived and designed the study. MW collected the samples,performed the laboratory work and the data analysis. MW wrote the manuscripttogether with FL and both authors approved the final version of it.
Competing interestsThe authors declare that they have no competing interests.
Consent for publicationNot applicable.
Ethics approval and consent to participateNo special permissions were required for sampling G. fossarum. We obtainedspecial permissions to collect specimens at sites in nature reserves.
Author details1Aquatic Ecosystem Research, University of Duisburg-Essen,Universitaetsstrasse 5, Essen D-45141, Germany. 2Centre for Water andEnvironmental Research (ZWU), University of Duisburg-Essen,Universitaetsstrasse 2, Essen D-45141, Germany.
Received: 15 July 2016 Accepted: 18 July 2016
References1. Illies J, editor. Limnofauna europaea. Stuttgart: Gustav Fischer Verlag; 1978.2. Bunn S, Hughes J. Dispersal and recruitment in streams: evidence from
genetic studies. J North Am Benthol Soc. 1997;16:338–46.3. Bohonak A, Jenkins D. Ecological and evolutionary significance of dispersal
by freshwater invertebrates. Ecol Lett. 2003;6:783–96.4. Witt J, Hebert P. Cryptic species diversity and evolution in the amphipod
genus Hyalella within central glaciated North America: a molecularphylogenetic approach. Can J Fish Aquat Sci. 2000;57:687–98.
5. Pfenninger M, Staubach S, Albrecht C, Streit B, Schwenk K. Ecological andmorphological differentiation among cryptic evolutionary lineages infreshwater limpets of the nominal form‐group Ancylus fluviatilis (OF Müller,1774). Mol Ecol. 2003;12:2731–45.
6. Pauls S, Lumbsch H, Haase P. Phylogeography of the montane caddisflyDrusus discolor: evidence for multiple refugia and periglacial survival. MolEcol. 2006;15:2153–69.
7. Schwenk K, Posada D, Hebert P. Molecular systematics of EuropeanHyalodaphnia: the role of contemporary hybridization in ancient species.Proc Biol Sci. 2000;267:1833–42.
8. Katouzian A, Sari A, Macher J, Weiss M, Saboori A, Leese F, et al.Drastic underestimation of amphipod biodiversity in the endangeredIrano-Anatolian and Caucasus biodiversity hotspots. Sci Rep. 2016;6:22507.
9. Müller J. Mitochondrial DNA, variation and the evolutionary history ofcryptic Gammarus fossarum types. Mol Phylogenet Evol. 2000;15:260–8.
10. Weiss M, Macher J, Seefeldt M, Leese F. Molecular evidence for furtheroverlooked species within the Gammarus fossarum complex (Crustacea:Amphipoda). Hydrobiologia. 2014;721:165–84.
11. Copilaş‐Ciocianu D, Petrusek A. The southwestern Carpathians as an ancientcentre of diversity of freshwater gammarid amphipods: insights from theGammarus fossarum species complex. Mol Ecol. 2015;24:3980–92.
12. Siegismund H. Genetic differentiation in populations of freshwater amphipodsGammarus roeseli and Gammarus fossarum. Hereditas. 1988;109:269–76.
13. Westram A, Jokela J, Baumgartner C, Keller I. Spatial distribution of crypticspecies diversity in European freshwater amphipods (Gammarus fossarum)as revealed by pyrosequencing. PLoS One. 2011;6:e23879.
14. Feckler A, Zubrod J, Thielsch A, Schwenk K, Schulz R, Bundschuh M. Crypticspecies diversity: an overlooked factor in environmental management? JAppl Ecol. 2014;51:958–967.
15. Meijering M. Lack of oxygen and low pH as limiting factors for Gammarusin Hessian brooks and rivers. Hydrobiologia. 1991;223:159–69.
16. Ladewig V, Jungmann D, Köhler H, Schirling M, Triebskorn R, Nagel R.Population structure and dynamics of Gammarus fossarum (Amphipoda)upstream and downstream from effluents of sewage treatment plants. ArchEnviron Contam Toxicol. 2006;50:370–83.
17. Bundschuh M, Zubrod J, Schulz R. The functional and physiological status ofGammarus fossarum (Crustacea; Amphipoda) exposed to secondary treatedwastewater. Environ Pollut. 2011;159:244–9.
18. Schmidlin L, von Fumetti S, Nagel P. Copper sulphate reduces themetabolic activity of Gammarus fossarum in laboratory and fieldexperiments. Aquat Toxicol. 2015;161:138–45.
19. Eisenring M, Altermatt F, Westram A, Jokela J. Habitat requirements andecological niche of two cryptic amphipod species at landscape and localscales. Ecosphere. 2016;7:e01319. doi:10.1002/ecs2.1319.
20. Stürzbecher C, Müller J, Seitz A. Coexisting Gammarus fossarum types(Amphipoda) in Central Europe: regular patterns of population dynamicsand microdistribution. Crustac Biodivers Crisis Proc Fourth Int Crustac CongrAmst Neth July. 1998;20–24(1998):287–93.
21. Müller J, Partsch E, Link A. Differentiation in morphology and habitatpartitioning of genetically characterized Gammarus fossarum forms(Amphipoda) across a contact zone. Biol J Linn Soc. 2000;69:41–53.
22. Feckler A, Thielsch A, Schwenk K, Schulz R, Bundschuh M. Differences in thesensitivity among cryptic lineages of the Gammarus fossarum complex. SciTotal Environ. 2012;439:158–64.
23. Westram A, Baumgartner C, Keller I, Jokela J. Are cryptic host species alsocryptic to parasites? Host specificity and geographical distribution ofacanthocephalan parasites infecting freshwater Gammarus. Infect GenetEvol. 2011;11:1083–90.
24. Westram A, Jokela J, Keller I. Hidden Biodiversity in an Ecologically ImportantFreshwater Amphipod: Differences in Genetic Structure between Two CrypticSpecies. PLoS One. 2013;8:e69576.
25. Zwick P. Stream habitat fragmentation—a threat to biodiversity. BiodiversConserv. 1992;1:80–97.
26. Palmer M, Menninger H, Bernhardt E. River restoration, habitatheterogeneity and biodiversity: a failure of theory or practice?Freshw Biol. 2010;55:205–22.
27. Baggiano O, Schmidt D, Sheldon F, Hughes J. The role of altitude andassociated habitat stability in determining patterns of population geneticstructure in two species of Atalophlebia (Ephemeroptera: Leptophlebiidae).Freshw Biol. 2011;56:230–49.
28. Hughes, Schmidt, McLean & W. Population genetic structure in streaminsects: What have we learned? In: Lancaster J, Briers RA, editors. Aquaticinsects: challenges to populations. Wallingford: CAB International; 2008. p.268–288.
Weiss and Leese BMC Evolutionary Biology (2016) 16:153 Page 12 of 14
29. Cockerham C, Weir B. Estimation of gene flow from F-statistics. Evolution.1993;47:855–63.
30. Rousset F. Genetic differentiation and estimation of gene flow from F-statisticsunder isolation by distance. Genetics. 1997;145:1219–28.
31. Danancher D, Cellot B, Dolédec S, Reynaud D. Isolation and characterizationof the first eight microsatellite loci in Gammarus fossarum (Crustacea,Amphipoda) and cross‐amplification in Gammarus pulex and Gammarusorinos. Mol Ecol Resour. 2009;9:1418–21.
32. Westram A, Jokela J, Keller I. Isolation and characterization of ten polymorphicmicrosatellite markers for three cryptic Gammarus fossarum (Amphipoda)species. Conserv Genet Resour. 2010;2:401–4.
33. Dumont U, Anderer P, Schwevers U. Handbuch Querbauwerke. Düsseldorf:Ministerium für Umwelt und Naturschutz, Landwirtschaft undVerbraucherschutz des Landes Nordrhein-Westfalen; 2005.
34. Siegismund H, Müller J. Genetic structure of Gammarus fossarumpopulations. Heredity. 1991;66:419–36.
35. Müller J. Invasion history and genetic population structure of riverinemacroinvertebrates. Zoology. 2001;104:346–55.
36. Alp M, Keller I, Westram A, Robinson C. How river structure and biologicaltraits influence gene flow: a population genetic study of two streaminvertebrates with differing dispersal abilities. Freshw. Biol. 2012;57:969–981.
37. Meffe G, Vrijenhoek R. Conservation genetics in the management of desertfishes. Conserv Biol. 1988;2:157–69.
38. Hughes J, Schmidt D, Finn D. Genes in Streams: Using DNA to Understandthe Movement of Freshwater Fauna and Their Riverine Habitat. Bioscience.2009;59:573–83.
39. QGIS Development Team. QGIS Geographic Information System. OpenSource Geospatial Foundation Project. http://qgis.osgeo.org. 2015
41. LAWA. Länderarbeitsgemeinschaft Wasser. Gewässerstrukturgütekartierungin der Bundesrepublik Deutschland: Verfahren für kleine und mittelgroßeFließgewässer. 1st ed. Berlin: Kulturbuch-Verlag GmbH; 2000.
42. Raven P, Holmes N, Charrier P, Dawson F, Naura M, Boon P. Towards aharmonized approach for hydromorphological assessment of rivers inEurope: a qualitative comparison of three survey methods. Aquat ConservMar Freshw Ecosyst. 2002;12:405–24.
43. European Commission. Directive 2000/60/EEC, Establishing a framework forcommunity action in the field of water policy. Off. J. Eur. Communities.2000;1–71, Brussels, Belgium.
44. Sunnucks P, Hales D. Numerous transposed sequences of mitochondrialcytochrome oxidase I-II in aphids of the genus Sitobion (Hemiptera:Aphididae). Mol Biol Evol. 1996;13:510–24.
45. Folmer O, Black M, Hoeh W, Lutz R, Vrijenhoek R. DNA primers foramplification of mitochondrial cytochrome c oxidase subunit I fromdiverse metazoan invertebrates. Mol Mar Biol Biotechnol. 1994;3:294–9.
46. Kearse M, Moir R, Wilson A, Stones-Havas S, Cheung M, Sturrock S, et al.Geneious Basic: an integrated and extendable desktop software platform forthe organization and analysis of sequence data. Bioinformatics. 2012;28:1647–9.
47. Katoh K, Standley D. MAFFT multiple sequence alignment software version 7:improvements in performance and usability. Mol Biol Evol. 2013;30:772–80.
48. Excoffier L, Lischer H. Arlequin suite ver 3.5: a new series of programs toperform population genetics analyses under Linux and Windows. Mol EcolResour. 2010;10:564–7.
49. Teacher A, Griffiths D. HapStar: automated haplotype network layout andvisualization. Mol Ecol Resour. 2011;11:151–3.
50. Tamura K, Stecher G, Peterson D, Filipski A, Kumar S. MEGA6: molecularevolutionary genetics analysis version 6.0. Mol Biol Evol. 2013;30:2725–9.
51. Benjamini Y, Hochberg Y. Controlling the false discovery rate: apractical and powerful approach to multiple testing. J R StatSoc Ser B. 1995;57:289–300.
52. Van Oosterhout C, Hutchinson W, Wills D, Shipley P. MICRO-CHECKER:software for identifying and correcting genotyping errors in microsatellitedata. Mol Ecol Notes. 2004;4:535–8.
53. Dempster A, Laird N, Rubin D. Maximum likelihood from incomplete datavia the EM algorithm. J. R. Stat. Soc. Ser. B Stat. Methodol. 1977;39:1–38.
54. Kalinowski S. Hp‐rare 1.0: a computer program for performing rarefactionon measures of allelic richness. Mol Ecol Notes. 2005;5:187–9.
55. Chapuis M, Estoup A. Microsatellite null alleles and estimation of populationdifferentiation. Mol Biol Evol. 2007;24:621–31.
56. Excoffier L, Smouse P, Quattro J. Analysis of molecular variance inferredfrom metric distances among DNA haplotypes: application to humanmitochondrial DNA restriction data. Genetics. 1992;131:479–91.
57. Anderer P, Dumont U, Kolf R. Das Querbauwerke-Informationssystem QUIS-NRW. Wasser Abfall. 2007;7-8:10–4.
58. Guillot G, Mortier F, Estoup A. Geneland: a computer package for landscapegenetics. Mol Ecol Notes. 2005;5:712–5.
59. Guillot G, Santos F, Estoup A. Analysing georeferenced population geneticsdata with Geneland: a new algorithm to deal with null alleles and a friendlygraphical user interface. Bioinformatics. 2008;24:1406–7.
60. R Core Team. R: A Language and Environment for Statistical Computing. RFound. Stat. Comput. Vienna Austria. 2015. https://www.r-project.org.
61. Naimi B. usdm: Uncertainty Analysis for Species Distribution Models. R packageversion 1.1-15. 2015; Available from: http://CRAN.R-project.org/package=usdm
62. Elbrecht V, Feld C, Gies M, Hering D, Sondermann M, Tollrian R, et al.Genetic diversity and dispersal potential of the stonefly Dinocras cephalotesin a central European low mountain range. Freshw Sci. 2014;33:181–92.
63. Lagrue C, Wattier R, Galipaud M, Gauthey Z, Rullmann J, Dubreuil C, et al.Confrontation of cryptic diversity and mate discrimination withinGammarus pulex and Gammarus fossarum species complexes. FreshwBiol. 2014;59:2555–70.
64. Zickovich J, Bohonak A. Dispersal ability and genetic structure in aquaticinvertebrates: a comparative study in southern California streams andreservoirs. Freshw Biol. 2007;52:1982–96.
65. Foulquier A, Malard F, Lefébure T, Douady C, Gibert J. The imprint ofQuaternary glaciers on the present-day distribution of the obligategroundwater amphipod Niphargus virei (Niphargidae). J Biogeogr.2008;35:552–64.
66. Smith P, Smith B. Small‐scale population‐genetic differentiation in the NewZealand caddisfly Orthopsyche fimbriata and the crayfish Paranephropsplanifrons. N Z J Mar Freshw Res. 2009;43:723–34.
67. Bilton D, Freeland J, Okamura B. Dispersal in freshwater invertebrates. AnnuRev Ecol Syst. 2001;32:159–81.
68. Pfenninger M, Salinger M, Haun T, Feldmeyer B. Factors and processesshaping the population structure and distribution of genetic variationacross the species range of the freshwater snail Radix balthica (Pulmonata,Basommatophora). BMC Evol Biol. 2011;11:135.
69. Figuerola J, Green A. How frequent is external transport of seeds andinvertebrate eggs by waterbirds? A study in Donana. SW Spain Arch FürHydrobiol. 2002;155:557–65.
70. Figuerola J, Green A. Dispersal of aquatic organisms by waterbirds areview of past research and priorities for future studies. Freshw Biol.2002;47:483–94.
71. Schwentner M, Timms B, Richter S. Flying with the birds? Recent large‐areadispersal of four Australian Limnadopsis species (Crustacea: Branchiopoda:Spinicaudata). Ecol Evol. 2012;2:1605–26.
72. Peck S. Amphipod dispersal in the fur of aquatic mammals. Can Field-Nat.1975;89:181–2.
73. Vanschoenwinkel B, Waterkeyn A, Vandecaetsbeek T, Pineau O, Grillas P,Brendonck L. Dispersal of freshwater invertebrates by large terrestrialmammals: a case study with wild boar (Sus scrofa) in Mediterraneanwetlands. Freshw Biol. 2008;53:2264–73.
74. Cook B, Bunn S, Hughes J. A comparative analysis of population structuringand genetic diversity in sympatric lineages of freshwater shrimp (Atyidae:Paratya): concerted or independent responses to hydrographic factors?Freshw Biol. 2007;52:2156–71.
75. Previsić A, Walton C, Kucinić M, Mitrikeski P, Kerovec M. Pleistocenedivergence of Dinaric Drusus endemics (Trichoptera, Limnephilidae) inmultiple microrefugia within the Balkan Peninsula. Mol Ecol.2009;18:634–47.
76. Watanabe K, Monaghan M, Takemon Y, Omura T. Dispersal ability determinesthe genetic effects of habitat fragmentation in three species of aquatic insect.Aquat Conserv Mar Freshw Ecosyst. 2010;20:574–9.
77. Schultheis A, Hughes J. Spatial patterns of genetic structure amongpopulations of a stone‐cased caddis (Trichoptera: Tasimiidae) in south‐eastQueensland, Australia. Freshw Biol. 2005;50:2002–10.
78. Murphy N, Guzik M, Wilmer J. The influence of landscape onpopulation structure of four invertebrates in groundwater springs.Freshw Biol. 2010;55:2499–509.
79. Slatkin M. Isolation by distance in equilibrium and non-equilibriumpopulations. Evolution. 1993;47:264–79.
Weiss and Leese BMC Evolutionary Biology (2016) 16:153 Page 13 of 14
80. Keyghobadi N, Roland J, Strobeck C. Genetic differentiation and gene flowamong populations of the alpine butterfly, Parnassius smintheus, vary withlandscape connectivity. Mol Ecol. 2005;14:1897–909.
81. Finn D, Theobald D, Black W, Poff N. Spatial population genetic structureand limited dispersal in a Rocky Mountain alpine stream insect. Mol Ecol.2006;15:3553–66.
82. Monaghan M, Spaak P, Robinson C, Ward J. Genetic differentiation of Baetisalpinus Pictet (Ephemeroptera: Baetidae) in fragmented alpine streams.Heredity. 2001;86:395–403.
83. Dudgeon D, Arthington A, Gessner M, Kawabata Z, Knowler D, Lévêque C, et al.Freshwater biodiversity: importance, threats, status and conservation challenges.Biol Rev. 2006;81:163–82.