WIDER Working Paper 2016/169 The expansion of regional supermarket chains and implications for local suppliers A comparison of findings from South Africa, Botswana, Zambia, and Zimbabwe Reena das Nair 1,* and Shingie Chisoro 1 December 2016
Transcript
WIDER Working Paper 2016/169
The expansion of regional supermarket chains and implications for local suppliers
A comparison of findings from South Africa, Botswana, Zambia, and Zimbabwe
Reena das Nair1,* and Shingie Chisoro1
December 2016
1 Centre for Competition, Regulation and Economic Development, Johannesburg; * corresponding author: [email protected].
This study has been prepared within the UNU-WIDER project on ‘Regional growth and development in Southern Africa’.
The United Nations University World Institute for Development Economics Research provides economic analysis and policy advice with the aim of promoting sustainable and equitable development. The Institute began operations in 1985 in Helsinki, Finland, as the first research and training centre of the United Nations University. Today it is a unique blend of think tank, research institute, and UN agency—providing a range of services from policy advice to governments as well as freely available original research.
The Institute is funded through income from an endowment fund with additional contributions to its work programme from Denmark, Finland, Sweden, and the United Kingdom.
Katajanokanlaituri 6 B, 00160 Helsinki, Finland
The views expressed in this paper are those of the author(s), and do not necessarily reflect the views of the Institute or the United Nations University, nor the programme/project donors.
Abstract: Since the early 2000s, there has been rapid growth in the number and spread of supermarkets in southern Africa. This paper is a synthesis of key findings of studies undertaken in Botswana, South Africa, Zambia, and Zimbabwe on the expansion of supermarkets and the impact this has had on suppliers and the competitive landscape in the region. Supermarkets are driving trade patterns in processed foods and household consumables within the region, opening up large markets for suppliers. If supermarkets are to become a key route to regional markets for suppliers, national policies and laws that currently exist need to be harmonized across the region with a wider view of developing regional value chains. Among key findings of the studies, supermarket procurement and sourcing strategies as well as buyer power are seen to affect the participation of suppliers in supermarket value chains, and affect the development of their capabilities. The impact on the competitive landscape of the spread of supermarkets in each country is also assessed, highlighting concerns of strategic behaviour that dominant supermarkets can engage in to exclude rivals.
Acknowledgements: This paper was presented at the UNU-WIDER and the National Treasury conference on ‘Growth and Development Policy—New Data, New Approaches, and New Evidence’, held in Pretoria, South Africa on 30 November–1 December 2016.
There has been strong growth in the number and spread of supermarkets, particularly South African supermarkets, into the rest of the southern African region since the early 2000s. This comes in the context of increased intra-regional foreign direct investment (FDI), which is part of and follows trade and financial liberalization in many developing countries in the 1990s/early 2000s. Several other factors have been attributed to this growth, including rising urbanization, increased per capita income, rise of the middle class, construction of shopping malls, and economies of scale and scope arising mainly from efficient procurement and distribution systems (Humphrey 2007; Tschirley 2010). The formats and locations of supermarkets in southern Africa have also evolved over the years, moving away from serving high-end affluent consumers in urban areas to penetrating low-income rural communities. The expansion of supermarkets has important consequences for consumers, suppliers, and the competitive landscape within each country as well as across countries in the region.
From a consumer point of view, supermarkets supply a basket of daily food and non-food products. Beyond this, supermarkets offer the supplementary service of arranging a wide assortment of products selling concurrently in a convenient setting and location (Basker and Noel 2013). Supermarkets thus offer a ‘price–quality–range-service’ package that can greatly reduce overall costs for consumers, including transport, time, search, information, and storage costs (OECD 2015a). The offering includes an ‘overall customer experience’, which adds accessibility, ambiance, range, and variety to the shopping experience (Basker and Noel 2013; Betancourt 2006; Betancourt and Malanoski 1999). Supermarkets also often sell products cheaper than independent retailers given economies of scale and more efficient sourcing and distribution strategies (Haese and Van Huylenbroeck 2005). Therefore, vibrant competition between supermarkets benefits consumers in terms of lower prices, increased quality, greater innovation, and a wider range of offerings.
From the view of suppliers, supermarkets are an important source of demand and route to market, providing opportunities for participation in lucrative retail value chains (Boselie et al. 2003; Emongor and Kirsten 2006, 2009). Given the multinational nature of supermarket chains in the region, they open up a larger regional market for suppliers to attain the necessary scale to become competitive in national, regional, and even international markets. The recent trade patterns in selected food and household consumable products reveal the importance of supermarkets in driving regional trade. Supermarkets therefore can be a strong catalyst to stimulate food processing and light manufacturing industries in southern Africa. The development of such industries is squarely in line with the Southern African Development Community’s ‘Industrialisation Strategy and Roadmap, 2015–2063’ (see SADC 2015).
However, there are barriers to suppliers accessing consumers through supermarkets. Supermarkets globally, including in southern Africa, are imposing increasingly higher requirements and standards on suppliers. Along with the buyer power of large supermarket chains and rising levels of concentration, these escalating requirements increase the barriers to participation for suppliers.
To explore these and other issues, this document provides a synthesis of three studies undertaken on the ‘Expansion of regional supermarket chains: Changing models of retailing and the implications for local supplier capabilities in South Africa, Botswana, Zambia, and Zimbabwe’. The studies were undertaken as part of a broader project facilitated by the United Nations University World Institute for Development Economics Research (UNU-WIDER). The research for South Africa and Botswana was undertaken by the Centre for Competition Regulation and
2
Economic Development (CCRED) (see das Nair and Chisoro 2015, 2016), and that for Zambia and Zimbabwe by the Zambia Institute for Policy Analysis and Research (ZIPAR), (see Ziba and Phiri 2016), and the Zimbabwe Economic Policy Analysis and Research Unit (ZEPARU) (Chigumira et al. 2016), respectively.
South Africa was chosen given that many of the large supermarket chains in the region are established South African-owned multinationals. Strategies in the different countries in which these supermarkets operate are typically decided at head office and frequently mirror strategies used in South Africa. The other countries were selected for a number of reasons. The main South African supermarket chains are well established in each of these countries. Given its close proximity, many products on supermarket shelves are imported from South Africa, which raises concerns for local suppliers in these countries who are not able to participate in supermarket value chains. These countries being part of SADC also benefit from several trade agreements.
Zambia is one of the fastest growing countries in the SADC region [at around 7 per cent gross domestic product (GDP) growth between 2000 and 2015]. There is a strong presence of South African supermarkets investing in Zambia to access the growing urban population with rising disposable income. In addition, Zambia shows potential to supply certain products to supermarket value chains as evidenced by the increase in growth of Zambian exports of these products to the region. Although physically closer to South Africa than Zambia, Zimbabwe has seen a more subdued spread of South African supermarkets partly attributable to the level of competition from local supermarket chains, unfavourable economic conditions, and protectionist policies in terms of FDI and trade restrictions. Botswana was selected for additional reasons. The retail landscape in Botswana is different from the other countries. Historically dominated by wholesalers, local retailers have rapidly taken over in recent years, including through wholesalers that have vertically integrated with retail offerings. Botswana is also the only country in the region that has seen the emergence of a strong local retail chain that has grown into a multinational, competing against South African supermarkets throughout southern and East Africa.
The objective of this synthesis paper is to compare and contrast findings from the selected countries on the following dynamics:
the impact of supermarket spread on domestic and regional processed foods and selected household product value chains, in particular on the participation of local firms in their supply chain;
how business models differ between supermarkets and the nature and intensity of competitive rivalry between supermarket chains;
the strategies of supermarkets in procurement and how these have evolved;
the capabilities required for local suppliers to supply food and selected household products to supermarkets and what the constraints are that hinder participation; and
the potential for regional procurement and enabling policy frameworks and support mechanisms necessary to be put in place for this.
Guided by the global and regional trends in the interaction among supermarkets, suppliers, and governments, the studies utilized a combination of primary information from field interviews and secondary sources of data from trade and statistical databases. Around 160 field interviews were conducted collectively in the four countries with supermarkets, franchises, suppliers to supermarkets, producers and manufacturers that do not supply supermarkets, wholesalers, cash-and-carry stores, fresh produce markets, government departments, competition authorities, industry associations, farmer unions, property developers, and industry experts.
3
This paper is structured as follows. Section 2 maps the spread of supermarkets and the retail landscape in each of the selected countries. Section 3 looks at the implications on regional trade of typical supermarket products, highlighting sectors in which there is potential for increased intra-regional trade. This allows identification of industries that policy makers can target to improve capabilities in order to supply the region via supermarkets. Section 4 reviews some of the protection measures in place for local industries in each country, such as local content policies, ownership requirements, and import restrictions that hinder trade between countries in the region. Section 5 evaluates the impact on suppliers of the changing retail landscape, the characteristics and capabilities they require to successfully and sustainably supply supermarkets, and the support received from supermarkets and governments to build capabilities. This section also evaluates the impact of buyer power of large supermarket chains and the terms and conditions they impose on suppliers. Section 6 assesses competition issues, highlighting some of the identified strategic barriers to entry faced by new entrants. Section 7 concludes and provides recommendations on what policy makers can do to increase the opportunities presented by the growth of supermarkets in the region and how a more competitive landscape can be fostered.
2 Mapping the retail landscape and the spread of supermarkets in the selected countries
The main retail supermarket chains in each country are summarized in Table 1. As evident, South African supermarkets have a strong presence in each of the countries assessed.
Table 1: Number of supermarkets and ownership in each country
Botswana South Africa Zambia Zimbabwe
Shoprite (11),* SA Shoprite (1236), SA Shoprite (26), SA
Pick n Pay (9),† SA Pick n Pay (1126), SA Pick n Pay (12), SA TM/Pick n Pay (55), Zimbabwe/SA
SPAR (28),‡ SA SPAR (821), SA SPAR (16), Netherlands
SPAR (44), SA
Food Lover’s Market (1), SA Food Lover’s Market (+100), SA
Food Lover’s Market (2), SA
Food Lover’s Market (5), SA
Game/Walmart (2),§ USA Game/Walmart (117), USA
Game (2), USA
Woolworths (22), SA Woolworths (166), SA Woolworths (2), SA
Choppies (73), Botswana Choppies (31), Botswana
Choppies (2), Botswana
Choppies (20), Botswana
Shoppers (Sefalana) (23), Botswana
Melissa (4), Zambia OK Zimbabwe (43),¶
Zimbabwe Saverite (Trident Eureka/Walmart) (17), USA
Pound Stretcher (3),# UK
Food World (6), Zimbabwe
Notes: Only main chain stores are considered. SA, South Africa. *Store numbers were retrieved from Shoprite Holdings Ltd (2015). Botswana: 6 Shoprite, 1 Checkers, 5 Usave. South Africa: 419 Shoprite, 191 Checkers, 33 Checkers Hyper, 272 Usave, 321 OK Franchise. Zambia: 24 Shoprite, 1 Usave. †Store numbers were retrieved from Pick n Pay (2015). The annual report does not differentiate among the different store formats. ‡Store numbers were retrieved from SPAR Group Ltd (2014). The source does not differentiate between the different formats which include Superspar, Savemor, SPAR Express, Kwikspar, SPAR, Tops, Build It, and SPAR Pharmacy. §This number includes only grocery stores for Woolworths and was sourced from interviews. ¶ Store numbers were retrieved from OK Zimbabwe Limited (2016). The 43 stores include 30 OK stores, 9 Bon Marche stores, 4 OK Mart stores. #Store numbers were retrieved from The Best of Zimbabwe (2014).
Source: Authors’ compilation based on references in notes.
The retail landscape differs in the selected countries and it is important to appreciate these differences to better understand the internationalization of supermarkets, the strategies used, and changes that have occurred since the early 2000s.
4
2.1 Botswana
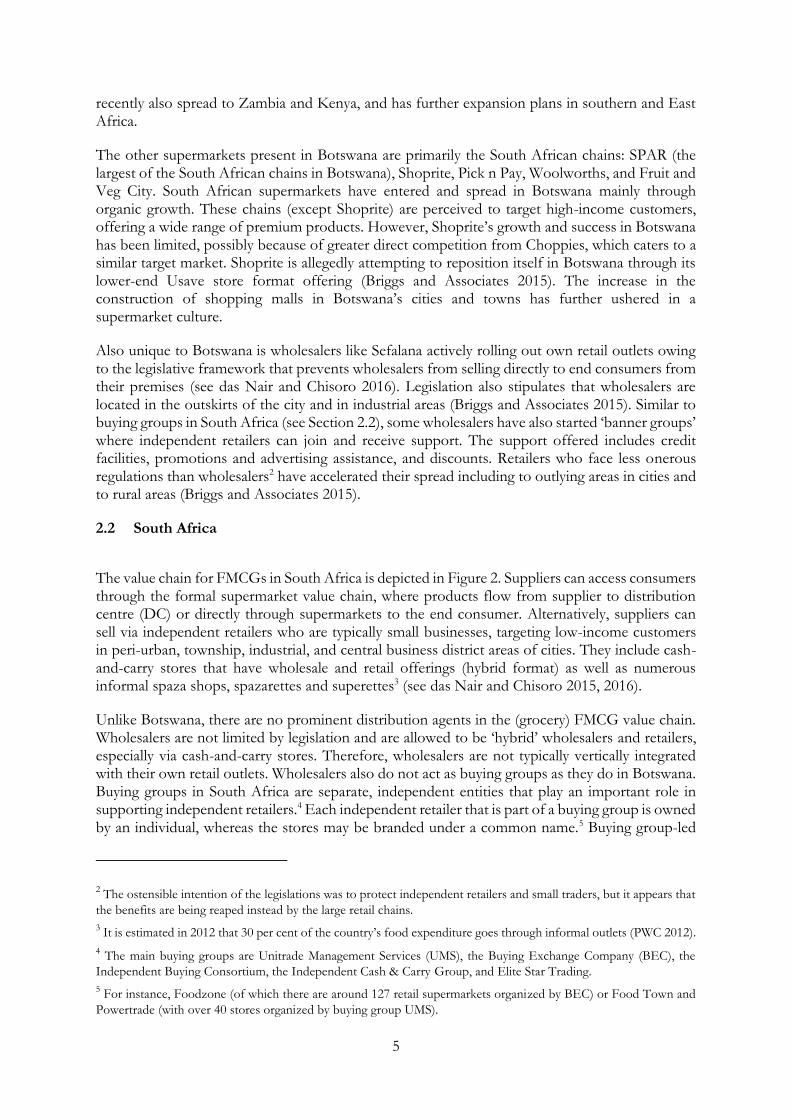
The value chain or routes to market for fast-moving consumer goods (FMCGs) sold on supermarket shelves in Botswana is represented in Figure 1. Supermarkets are a key route to market for suppliers, accounting for over 50 per cent of sales. Alternative routes to market include wholesalers such as Sefalana and Trident Eureka (Walmart) who on-sell to vertically integrated supermarkets or independent retailers. These routes account for approximately 2530 per cent of total sales, whereas the balance of food products goes through the growing ‘quick service restaurant’ market and government contracts.
Figure 1: Value chains for fast-moving consumer goods (FMCGs) in Botswana
Source: Authors’ compilation.
Large distribution agents such as CA Sales & Distribution and Global Holdings are an intermediate level in the value chain for ambient products in Botswana that are not present or that operate on a much smaller scale in the other countries.1
The main retail supermarket chain in Botswana, as highlighted in Table 1, is locally owned Choppies Enterprises with over 35 per cent of the market (in terms of store numbers). Choppies has grown strongly since 1993, from only two stores in Botswana to over 125 stores in Botswana, Zimbabwe, and South Africa. Choppies is listed on both the Botswana Stock Exchange and the Johannesburg Stock Exchange. Presently targeting low-to-middle income consumers, Choppies is attempting to attract middle-to-upper income consumers. It stocks branded international products as well as a wide range of its own private label, or house brand, products. Choppies has very
1 For a more detailed description of the role of distribution agents in Botswana, see das Nair and Chisoro (2016).
Suppliers (e.g. Bolux Milling, Kgalagadi Soaps, Tswana Pride, etc. Includes large imports from foreign suppliers)
Main chain grocery retailers/supermarkets (e.g. Choppies, Pick n Pay, SPAR, etc.)
recently also spread to Zambia and Kenya, and has further expansion plans in southern and East Africa.
The other supermarkets present in Botswana are primarily the South African chains: SPAR (the largest of the South African chains in Botswana), Shoprite, Pick n Pay, Woolworths, and Fruit and Veg City. South African supermarkets have entered and spread in Botswana mainly through organic growth. These chains (except Shoprite) are perceived to target high-income customers, offering a wide range of premium products. However, Shoprite’s growth and success in Botswana has been limited, possibly because of greater direct competition from Choppies, which caters to a similar target market. Shoprite is allegedly attempting to reposition itself in Botswana through its lower-end Usave store format offering (Briggs and Associates 2015). The increase in the construction of shopping malls in Botswana’s cities and towns has further ushered in a supermarket culture.
Also unique to Botswana is wholesalers like Sefalana actively rolling out own retail outlets owing to the legislative framework that prevents wholesalers from selling directly to end consumers from their premises (see das Nair and Chisoro 2016). Legislation also stipulates that wholesalers are located in the outskirts of the city and in industrial areas (Briggs and Associates 2015). Similar to buying groups in South Africa (see Section 2.2), some wholesalers have also started ‘banner groups’ where independent retailers can join and receive support. The support offered includes credit facilities, promotions and advertising assistance, and discounts. Retailers who face less onerous regulations than wholesalers2 have accelerated their spread including to outlying areas in cities and to rural areas (Briggs and Associates 2015).
2.2 South Africa
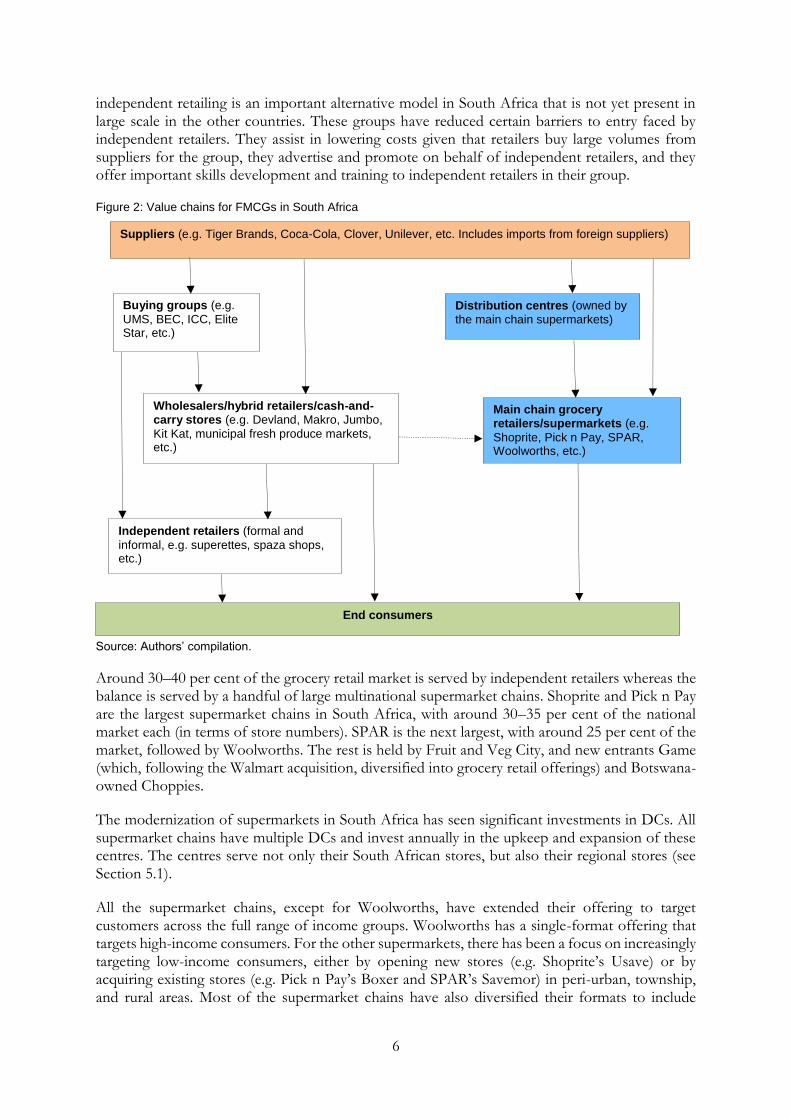
The value chain for FMCGs in South Africa is depicted in Figure 2. Suppliers can access consumers through the formal supermarket value chain, where products flow from supplier to distribution centre (DC) or directly through supermarkets to the end consumer. Alternatively, suppliers can sell via independent retailers who are typically small businesses, targeting low-income customers in peri-urban, township, industrial, and central business district areas of cities. They include cash-and-carry stores that have wholesale and retail offerings (hybrid format) as well as numerous informal spaza shops, spazarettes and superettes3 (see das Nair and Chisoro 2015, 2016).
Unlike Botswana, there are no prominent distribution agents in the (grocery) FMCG value chain. Wholesalers are not limited by legislation and are allowed to be ‘hybrid’ wholesalers and retailers, especially via cash-and-carry stores. Therefore, wholesalers are not typically vertically integrated with their own retail outlets. Wholesalers also do not act as buying groups as they do in Botswana. Buying groups in South Africa are separate, independent entities that play an important role in supporting independent retailers.4 Each independent retailer that is part of a buying group is owned by an individual, whereas the stores may be branded under a common name.5 Buying group-led
2 The ostensible intention of the legislations was to protect independent retailers and small traders, but it appears that
the benefits are being reaped instead by the large retail chains.
3 It is estimated in 2012 that 30 per cent of the country’s food expenditure goes through informal outlets (PWC 2012).
4 The main buying groups are Unitrade Management Services (UMS), the Buying Exchange Company (BEC), the
Independent Buying Consortium, the Independent Cash & Carry Group, and Elite Star Trading.
5 For instance, Foodzone (of which there are around 127 retail supermarkets organized by BEC) or Food Town and
Powertrade (with over 40 stores organized by buying group UMS).
6
independent retailing is an important alternative model in South Africa that is not yet present in large scale in the other countries. These groups have reduced certain barriers to entry faced by independent retailers. They assist in lowering costs given that retailers buy large volumes from suppliers for the group, they advertise and promote on behalf of independent retailers, and they offer important skills development and training to independent retailers in their group.
Figure 2: Value chains for FMCGs in South Africa
Source: Authors’ compilation.
Around 30–40 per cent of the grocery retail market is served by independent retailers whereas the balance is served by a handful of large multinational supermarket chains. Shoprite and Pick n Pay are the largest supermarket chains in South Africa, with around 30–35 per cent of the national market each (in terms of store numbers). SPAR is the next largest, with around 25 per cent of the market, followed by Woolworths. The rest is held by Fruit and Veg City, and new entrants Game (which, following the Walmart acquisition, diversified into grocery retail offerings) and Botswana-owned Choppies.
The modernization of supermarkets in South Africa has seen significant investments in DCs. All supermarket chains have multiple DCs and invest annually in the upkeep and expansion of these centres. The centres serve not only their South African stores, but also their regional stores (see Section 5.1).
All the supermarket chains, except for Woolworths, have extended their offering to target customers across the full range of income groups. Woolworths has a single-format offering that targets high-income consumers. For the other supermarkets, there has been a focus on increasingly targeting low-income consumers, either by opening new stores (e.g. Shoprite’s Usave) or by acquiring existing stores (e.g. Pick n Pay’s Boxer and SPAR’s Savemor) in peri-urban, township, and rural areas. Most of the supermarket chains have also diversified their formats to include
Suppliers (e.g. Tiger Brands, Coca-Cola, Clover, Unilever, etc. Includes imports from foreign suppliers)
Distribution centres (owned by the main chain supermarkets)
Independent retailers (formal and
informal, e.g. superettes, spaza shops, etc.)
End consumers
7
hypermarkets, convenience stores, express stores at fuel forecourts, and fast-food offerings. This suite of multiple formats is not yet offered by these supermarkets in the other countries evaluated. As these markets mature, it is expected that the suite of offerings will expand.
2.3 Zambia
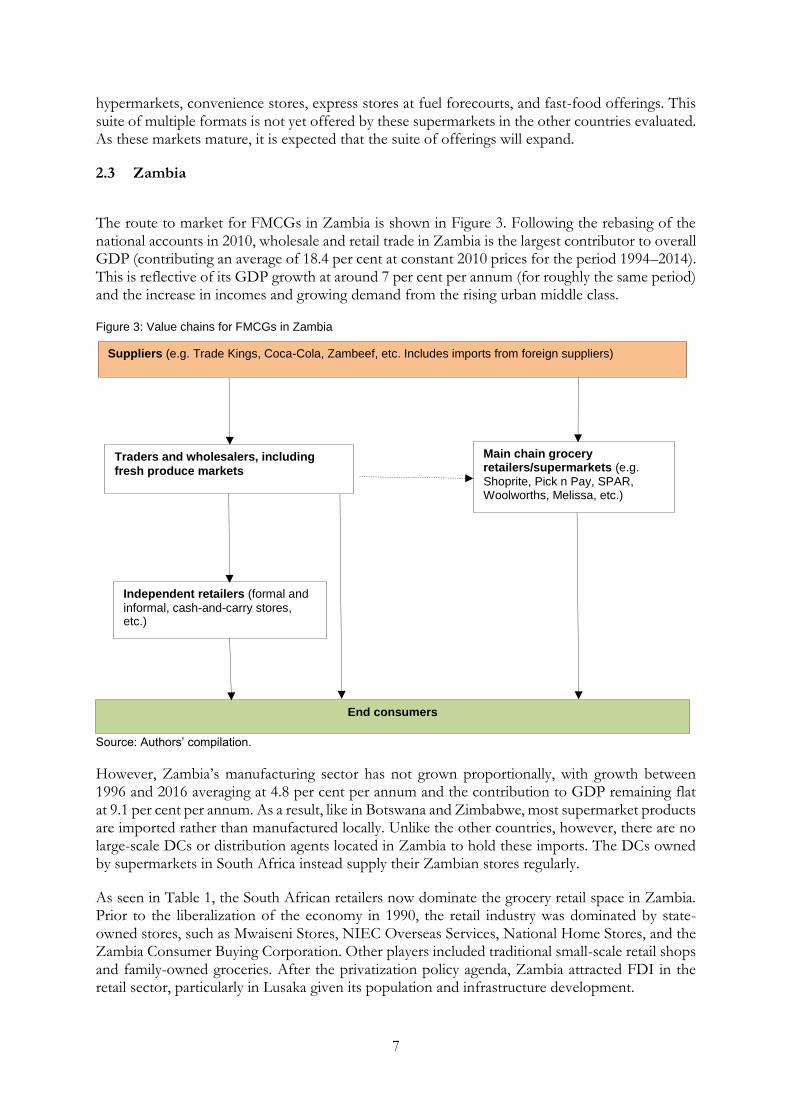
The route to market for FMCGs in Zambia is shown in Figure 3. Following the rebasing of the national accounts in 2010, wholesale and retail trade in Zambia is the largest contributor to overall GDP (contributing an average of 18.4 per cent at constant 2010 prices for the period 1994–2014). This is reflective of its GDP growth at around 7 per cent per annum (for roughly the same period) and the increase in incomes and growing demand from the rising urban middle class.
Figure 3: Value chains for FMCGs in Zambia
Source: Authors’ compilation.
However, Zambia’s manufacturing sector has not grown proportionally, with growth between 1996 and 2016 averaging at 4.8 per cent per annum and the contribution to GDP remaining flat at 9.1 per cent per annum. As a result, like in Botswana and Zimbabwe, most supermarket products are imported rather than manufactured locally. Unlike the other countries, however, there are no large-scale DCs or distribution agents located in Zambia to hold these imports. The DCs owned by supermarkets in South Africa instead supply their Zambian stores regularly.
As seen in Table 1, the South African retailers now dominate the grocery retail space in Zambia. Prior to the liberalization of the economy in 1990, the retail industry was dominated by state-owned stores, such as Mwaiseni Stores, NIEC Overseas Services, National Home Stores, and the Zambia Consumer Buying Corporation. Other players included traditional small-scale retail shops and family-owned groceries. After the privatization policy agenda, Zambia attracted FDI in the retail sector, particularly in Lusaka given its population and infrastructure development.
Suppliers (e.g. Trade Kings, Coca-Cola, Zambeef, etc. Includes imports from foreign suppliers)
Traders and wholesalers, including
fresh produce markets
Main chain grocery retailers/supermarkets (e.g.
Shoprite, Pick n Pay, SPAR, Woolworths, Melissa, etc.)
Independent retailers (formal and
informal, cash-and-carry stores, etc.)
End consumers
8
Shoprite was the first multinational supermarket chain to take advantage of the opportunity to enter Zambia, and is the largest in the country presently with 26 stores. Entering Zambia in 1995, the Zambian government sold six existing, loss-making state-owned stores to Shoprite. Shoprite also benefited from favourable conditions from the government such as a five-year tax break and preferential import tariffs in return for opening outlets in all the provinces. Shoprite has since grown organically mainly through a corporate model, and is the only supermarket (other than Choppies) to have a dual listing in Africa—on the Lusaka and Johannesburg Stock Exchanges.
South African chain Pick n Pay entered well after Shoprite in 2010 and is located in Lusaka and the Copperbelt Province. Although currently only operating corporate stores in Zambia, targeting customers along the full income spectrum, Pick n Pay’s strategy is to expand into franchise stores.
The SPAR stores in Zambia are not incorporated in South Africa, but in the Netherlands. Although franchised out of the SPAR International group in the Netherlands, the SPAR Zambia stores are a joint venture (JV) between Innscor International of Zimbabwe and Platinum Gold Zambia Ltd (see SPAR International 2015). Since opening in late 2003, SPAR has expanded to include eight corporate stores and a further eight franchised stores targeting mainly middle-to-low income consumers.
Other South African chain stores with a smaller presence include Walmart’s Game, which entered Zambia when it was still South African-owned as part of Massmart, and Woolworths, which first entered as a clothing retailer, diversifying into grocery retail only in 2014. Non-South African recent multinational entrants include Choppies and UK’s Pound Stretcher.
The only local retail chain that has managed to effectively compete with the multinationals has been Melissa Supermarkets with four outlets. Targeting middle-to-upper income consumers for over 25 years, Melissa focuses on personalized customer care and quality. Competition from the South African chains has forced Melissa to reposition and restructure its business and procurement models. Unlike in Botswana and Zimbabwe, there is very little direct local competition to the South African retail chains and the investment environment generally has been favourable to FDI since the 1990s.
9
2.4 Zimbabwe
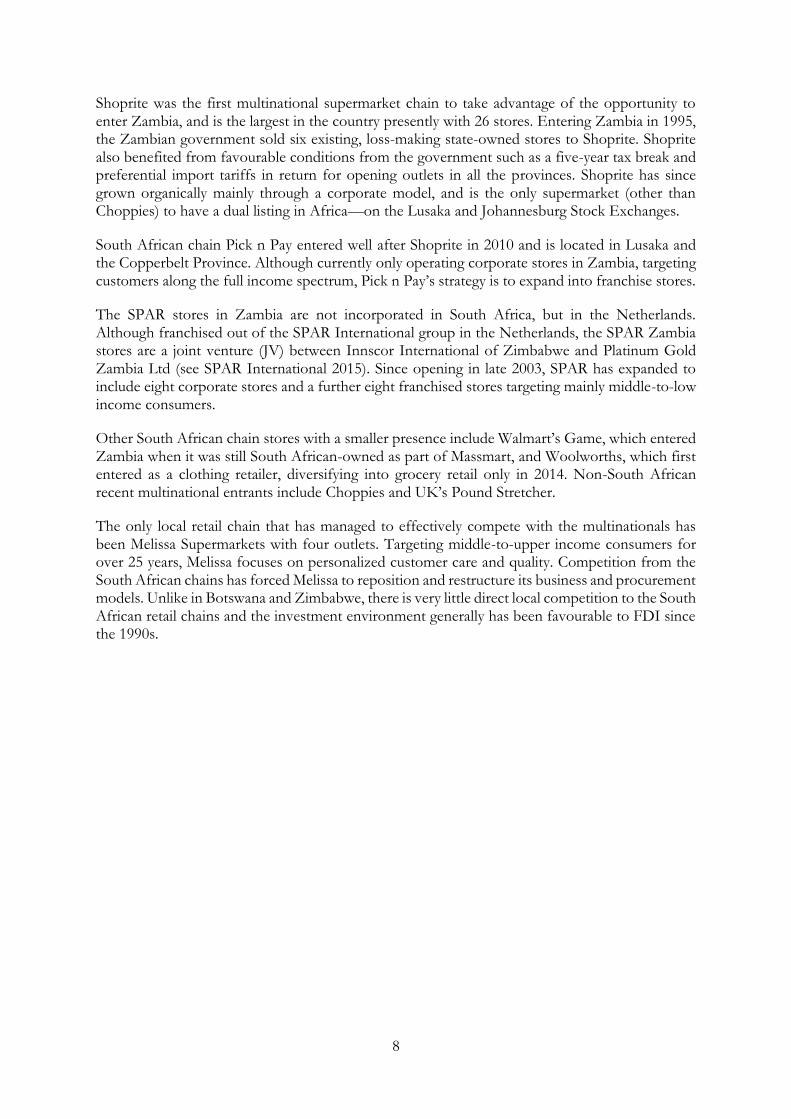
The FMCG value chain in Zimbabwe is depicted in Figure 4. Like in South Africa and Botswana, there are DCs present in Zimbabwe that serve as central procurement points for supermarkets. Also like in South Africa, wholesalers such as Mohamed Mussa Wholesalers, Meikles Mega Market, and Trade Centre are allowed to offer retail sales.
Figure 4: Value chains for FMCGs in Zimbabwe
Source: Authors’ compilation.
Given large imports, there are local agents used by supermarkets, although they appear to operate on a smaller scale than in Botswana. These include agents like Brands Africa and Vital Logistics.
There are more restrictions on retail FDI in Zimbabwe than in Botswana and Zambia. The Indigenization and Economic Empowerment Regulations of 2011 stipulate that 51 per cent of shareholding is owned by indigenous Zimbabweans. Nonetheless, a number of multinationals are operating in Zimbabwe mainly through JV-type models. The informal sector further remains alive with numerous vendors operating within supermarket catchment areas.
The two largest chain stores (in terms of number of stores) are either locally owned or controlled chains. The largest is TM/Pick n Pay supermarkets with 55 stores. Five stores within the group operate under the Pick n Pay brand. The stores have multiple formats, ranging from convenient small supermarkets to hypermarkets. In 2011, Pick n Pay South Africa invested USD 13 million in TM Supermarkets, increasing its shareholding from 25 to 49 per cent. TM is thus essentially in a JV with Pick n Pay, with control on the part of TM as required by the indigenization laws. The JV support extends to sourcing of South African products, sharing of technical expertise, and operational support through a skills development programme. TM/Pick n Pay has been fast increasing its footprint in shopping complexes, particularly in more affluent areas of Harare. It has constructed new buildings and taken over spaces from players that have exited the industry.
Suppliers (e.g. Dairiboard, Proton, Bakers Inn, etc. Includes large imports from foreign suppliers)
Wholesalers, hybrid wholesalers and retailers, warehouses (e.g.
Mohamed Mussa Meikles Mega Market, Trade Centre, etc.)
Main chain grocery retailers/supermarkets (e.g. OK
Zimbabwe, TM/Pick n Pay, SPAR, Choppies, etc.)
Independent retailers (Formal and informal,
cash-and-carry stores, etc.)
End consumers
Distribution centres
(owned by the main chain supermarkets)
Independent distribution agents (e.g. Brands Africa,
Vital Logistics, etc.)
10
The next biggest chain, OK Zimbabwe with 30 stores (and other retail stores under different brand names; see Table 1) is also Zimbabwean-owned. Operating since 1942, OK Zimbabwe targets all income categories. Like Choppies, OK has a wide range of private label products. Given that it imports majority of its products from Asia, it has invested in a central warehousing and DC. OK has also expanded by purchasing stores from supermarkets that have exited the industry in addition to opening new store sites and refurbishing existing stores.
The largest foreign-owned chain and third largest in terms of number of stores (44) is SPAR. SPAR started operating in Zimbabwe in the late 1950s when four grocery stores in Harare joined together to form a buying group and applied to SPAR South Africa for the Zimbabwean franchise. However, sanctions in South Africa during that time forced the group to seek their own rights directly from SPAR International in the Netherlands in 1966. So like in Zambia, the SPAR brand in Zimbabwe is a Dutch brand. A SPAR DC located in Zimbabwe supplies and services independently owned SPAR, Tops, and Savemor stores. SPAR has a voluntary trading agreement that allows retailers to access products from the DC, as well as a support structure that includes procurement and planning services of the group. However, franchisees have the discretion to stock their stores from any supplier of their choice. This is consistent with the model of its operations in southern Africa generally.
Botswana-owned Choppies has also recently entered (in 2013) through the acquisition of 10 former SPAR stores. It is unclear at this stage how Choppies has entered Zimbabwe without adhering to the 51 per cent local ownership requirements. It has since been growing strongly with 20 stores in main cities in Zimbabwe and is currently targeting opening new branches in Gweru and Masvingo, and additional branches in Harare. It has invested in two strategically located DCs in Harare and Bulawayo.
Relative to Zambia, South African supermarkets are less prominent in Zimbabwe. Aside from the TM/Pick n Pay JV, only Food Lover’s Market (part of Fruit and Veg City) has a presence with five stores, all run under a franchise model. The Food Lover’s Market stores target middle-to-high income customers and, like its South African operations, specialize in fresh produce from local farmers as well as imports from South Africa. Noticeably, like in Botswana, Shoprite has not been successful in Zimbabwe. Entering Zimbabwe in 2000 with the opening of a single shop in Bulawayo, Shoprite has since fully exited Zimbabwe. It appears that the presence of strong local chains, like in Botswana, has limited the expansion of Shoprite in Zimbabwe.
A recent international entrant, Horizon Ivato, is a well-known Chinese brand in Asia and in other African countries such as Madagascar, Malawi, Mozambique, and Togo. It started operating in Zimbabwe in December 2013 as a Chinese–Zimbabwean JV. Its head office is in China and most procurement of products is also from China.
There are a number of fully locally owned small chains, of which Food World, with six supermarkets and a wholesaler, is the largest in terms of number of stores. Other small local players include Denenga, Fleximart, Food King, and Mutomba. A number of local players have also exited the market allegedly because of competition from chain stores and a tough operating environment showing a degree of consolidation. These include Afro Foods, Makro, and Friendly Supermarkets.
Supermarkets are an important route to market for suppliers in Zimbabwe, particularly for suppliers of basic commodities like mealie-meal and flour where around 70–80 per cent is supplied to supermarkets (wholesalers take about 10–15 per cent and small independent retailers take the balance). For other products, like oil and beverages, the majority (60 per cent) is sold via wholesalers.
11
3 Trade patterns of supermarket products: Trends in imports and potential export opportunities
Supermarkets provide an important route to market for suppliers of food and household consumable products in southern Africa. Since around 2005, there has been increased trade between the selected countries. The expansion of supermarkets appears to be driving important changes in imports and exports of food and household products within the region.
FMCGs like processed foods and soaps and detergents are key basic products sold on supermarket shelves. Products within these broad categories were chosen for analyses given their importance in a typical consumer basket in the region. The products selected (both for the trade analysis and for the interviews) include fresh fruits and vegetables, poultry, eggs, dairy (milk, cheese, yoghurt, etc.), milled products (maize meal and flour), baked products (bread and pastry), processed food (sauces, prepared meals, soups, pre-cut vegetables, etc.), and household soaps and detergents. Some of the selected products have the potential to be produced outside South Africa and traded between SADC countries through supermarkets as routes to market. These products have the potential to promote value addition and industrialization in the different countries, particularly for products with inputs in which the country has a comparative advantage or advanced supplier capabilities to competitively supply the region. This is important for countries like Zambia, where manufacturing and agro-processing in particular have been identified as priority areas in the government’s Industrialization and Job Creation Strategy for sustainable economic growth and employment creation, as well as for Zimbabwe, where the Industrial Development Policy (IDP, 2012–16) and the Zimbabwe Agenda for Sustainable Social and Economic Transformation (2013–18) are centred on value addition and beneficiation. Furthermore, the selected products are (mostly) not affected by seasonality, which is important in drafting long-term recommendations and policies regarding mutually beneficial trade relations within the region. This is also in line with the SADC’s ‘Industrialization Strategy and Roadmap, 2015–2063’ (see SADC 2015).
Large proportions of products in Botswana, Zambia, and Zimbabwe continue to be imported from South Africa. However, the following sections reveal opportunities for other countries with capacity and capabilities to increase exports to the region, and replace South Africa’s deep-sea imports.
3.1 Zambia6
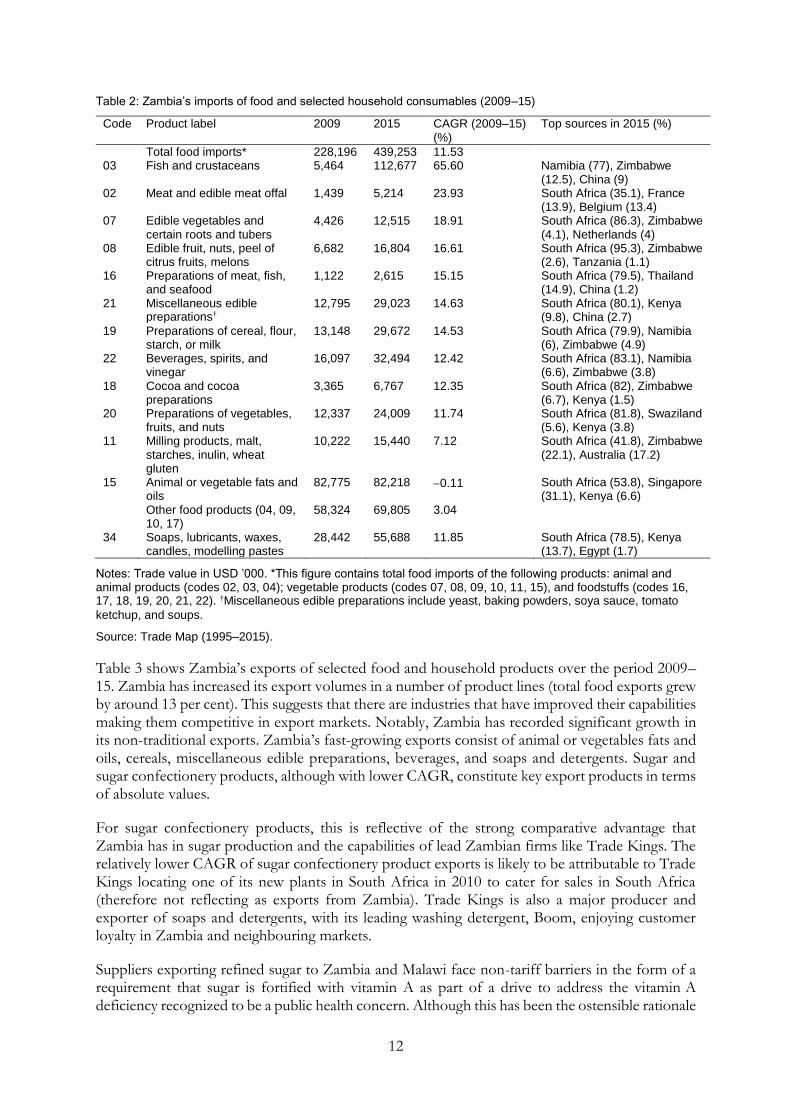
Zambia’s imports of total food products have grown by a compound annual growth rate (CAGR) of around 12 per cent between 2009 and 2015. Its fastest growing imports include fish, meat, vegetables, and fruits. Other major import products in terms of absolute values (although with low growth rates) include soaps and detergents and animal or vegetable fats and oils. As shown in Table 2, South Africa accounts for majority of Zambia’s imports of food and household products in 2015. For example, South Africa accounts for about 80 per cent of the share in value of Zambia’s imports of preparations of cereal, flour, starch, or milk; preparations of vegetables, fruits, and nuts; cocoa and cocoa preparation (which includes chocolate); beverages; and soaps and detergents.
6 It is noted that the ZIPAR report uses ISIC codes from the World Integrated Trade Solutions database to analyse
country trade patterns (see Ziba and Phiri 2016). However, in this paper we use HS product codes to ensure consistency across all the countries analysed. HS product codes are suitable for analysing trade patterns as they report data on export and imports of specific products collected at customs border points. On the other hand, ISIC codes report trade data collected from firms which is then extrapolated for the whole industry.
12
Table 2: Zambia’s imports of food and selected household consumables (2009–15)
Code Product label 2009 2015 CAGR (2009–15) (%)
Top sources in 2015 (%)
Total food imports* 228,196 439,253 11.53
03 Fish and crustaceans 5,464 112,677 65.60 Namibia (77), Zimbabwe (12.5), China (9)
02 Meat and edible meat offal 1,439 5,214 23.93 South Africa (35.1), France (13.9), Belgium (13.4)
07 Edible vegetables and certain roots and tubers
4,426 12,515 18.91 South Africa (86.3), Zimbabwe (4.1), Netherlands (4)
08 Edible fruit, nuts, peel of citrus fruits, melons
6,682 16,804 16.61 South Africa (95.3), Zimbabwe (2.6), Tanzania (1.1)
16 Preparations of meat, fish, and seafood
1,122 2,615 15.15 South Africa (79.5), Thailand (14.9), China (1.2)
21 Miscellaneous edible preparations†
12,795 29,023 14.63 South Africa (80.1), Kenya (9.8), China (2.7)
19 Preparations of cereal, flour, starch, or milk
13,148 29,672 14.53 South Africa (79.9), Namibia (6), Zimbabwe (4.9)
22 Beverages, spirits, and vinegar
16,097 32,494 12.42 South Africa (83.1), Namibia (6.6), Zimbabwe (3.8)
18 Cocoa and cocoa preparations
3,365 6,767 12.35 South Africa (82), Zimbabwe (6.7), Kenya (1.5)
20 Preparations of vegetables, fruits, and nuts
12,337 24,009 11.74 South Africa (81.8), Swaziland (5.6), Kenya (3.8)
28,442 55,688 11.85 South Africa (78.5), Kenya (13.7), Egypt (1.7)
Notes: Trade value in USD ’000. *This figure contains total food imports of the following products: animal and animal products (codes 02, 03, 04); vegetable products (codes 07, 08, 09, 10, 11, 15), and foodstuffs (codes 16, 17, 18, 19, 20, 21, 22). †Miscellaneous edible preparations include yeast, baking powders, soya sauce, tomato
ketchup, and soups.
Source: Trade Map (1995–2015).
Table 3 shows Zambia’s exports of selected food and household products over the period 2009–15. Zambia has increased its export volumes in a number of product lines (total food exports grew by around 13 per cent). This suggests that there are industries that have improved their capabilities making them competitive in export markets. Notably, Zambia has recorded significant growth in its non-traditional exports. Zambia’s fast-growing exports consist of animal or vegetables fats and oils, cereals, miscellaneous edible preparations, beverages, and soaps and detergents. Sugar and sugar confectionery products, although with lower CAGR, constitute key export products in terms of absolute values.
For sugar confectionery products, this is reflective of the strong comparative advantage that Zambia has in sugar production and the capabilities of lead Zambian firms like Trade Kings. The relatively lower CAGR of sugar confectionery product exports is likely to be attributable to Trade Kings locating one of its new plants in South Africa in 2010 to cater for sales in South Africa (therefore not reflecting as exports from Zambia). Trade Kings is also a major producer and exporter of soaps and detergents, with its leading washing detergent, Boom, enjoying customer loyalty in Zambia and neighbouring markets.
Suppliers exporting refined sugar to Zambia and Malawi face non-tariff barriers in the form of a requirement that sugar is fortified with vitamin A as part of a drive to address the vitamin A deficiency recognized to be a public health concern. Although this has been the ostensible rationale
13
for the requirement, it has been argued that this requirement in fact serves to protect local sugar producers in these countries.
Table 3: Zambia’s exports of food and selected household consumables (2009–15)
Code Product label 2009 2015 CAGR (2009–15) (%)
Top markets in 2015 (%)
Total food exports* 219,161 457,957 13.07
15 Animal or vegetable fats and oils
2,145 34,122 58.59 Congo (75.6), Kenya (11.9), Tanzania (8.9)
Notes: Trade value in USD ’000. *This figure contains total food exports of the following products: animal and animal products (codes 02, 03, 04); vegetable products (codes 07, 08, 09, 10, 11, 15), and foodstuffs (codes 16, 17, 18, 19, 20, 21, 22). †Cereals include cereals, wheat, rice, rye, barley, oats, maize, and corn.
Source: Trade Map (1995–2015).
Table 3 also shows that Zambia’s main trading partners are within the southern African region. The Democratic Republic of Congo (DRC), Zimbabwe, and Malawi are key export markets for a range of Zambian products owing to close proximity to Zambia. South Africa, however, is not a key export market for majority of Zambian food products. Table 3 shows that, on average, South Africa accounts for only around 20 per cent share in value in Zambia’s exports of sugar and sugar confectionery and coffee, tea, mate, and spices; and 85 per cent of edible fruit, nuts, peel of citrus fruits, and melons (although the last category is very small in terms of absolute value). For the overall regional partners, Zambian products do not account for a big proportion of their total imports. Currently, these countries import more from South Africa and deep-sea sources. Hence, there is potential for Zambia to increase its fast-growing export products to cater to some of the regional demand.
Results from a survey of 99 suppliers and non-suppliers undertaken by ZIPAR corroborate the trends in the trade data. Suppliers interviewed confirmed that their main export markets were DRC, followed by Zimbabwe and Malawi. These markets are attractive for suppliers because of the strong demand for processed foods, proximity to Zambia, and higher prices achievable for suppliers. In the DRC, markets are largely informal with a high degree of smuggling. Nonetheless, the DRC offers a large potential market for Zambian products especially within the densely
14
populated Katanga Province (with 16 million people). The recent trade agreement signed between the Zambian and DRC governments has the potential to improve trading conditions between the two countries. Zambia’s increasing penetration into the region makes a strong argument for similar trade strategies that will focus on exploiting opportunities in regional value chains where Zambia shows potential, such as in sugar confectionery, soaps and detergents, and cereals.
3.2 Zimbabwe
Zimbabwe’s economic challenges have affected the agricultural and manufacturing sectors that have failed to meet local demand for food and household products, forcing supermarkets to depend on imports. At low levels of manufacturing capacity, imports of food and household consumables are necessary to satisfy local demand. The persistent poor agricultural performance has seen Zimbabwe becoming a net food importer, especially of maize and other cereals.
Zimbabwe’s fastest growing imports include fish, cocoa and cocoa preparations; miscellaneous edible preparations; and preparations of vegetable, fruits, and nuts, all recording above 12 per cent annual growth rates between 2009 and 2015. The main sources for Zimbabwe’s fast-growing imports include Namibia, Zambia, and South Africa. However, South Africa accounts for the largest share in value in Zimbabwe’s imports in 2015 across a range of products.
As described later in Section 4, there has been a concerted drive in recent years to increase protection measures to revive local manufacturers in a range of industries in Zimbabwe, more so than in the other countries studied. Customs duties set by the government in 2011 explain the decline in imports of edible vegetables, poultry, and preparations of cereal, flour, starch or milk by 17, 22, and 13 per cent, respectively, between 2009 and 2015. Similarly, import duties on milled products are likely to have caused the decline in imports by 8 per cent between 2009 and 2015. In terms of absolute values, imports of milled products stood at USD 125.6 million in 2011 and drastically dropped to USD 73 million in 2012 with a further drop to USD 45.7 million in 2013. However, imports started to increase in 2015 recording USD 57.4 million.
Despite high import duties, the country continues to experience growth in imports of processed products that are not produced locally, such as miscellaneous edible preparations, tomato sauce, baked beans (12.9 per cent); processed vegetables, fruits, and nuts (mixed fruit jam) (12.8 per cent), and animal or vegetable fats and oils (2.5 per cent) between 2009 and 2015 (see Table 4).
15
Table 4: Zimbabwe’s imports of selected food and household consumables (2009–15)
Code Product label 2009 2015 CAGR (2009–15) (%)
Top sources in 2015 (%)
Total food imports 731,974 904,748 3.59
03 Fish and crustaceans 3,502 23,675 37.51 Namibia (53.9), Mozambique (37), South Africa (5.9)
18 Cocoa and cocoa preparations 2,932 6,201 13.30 South Africa (85), Zambia (3.6), Turkey (3.5)
21 Miscellaneous edible preparations
23,884 49,335 12.85 South Africa (90.7), Kenya (3.2), France (1.6)
20 Preparations of vegetable, fruits, and nuts
13,495 27,775 12.78 South Africa (87.7), Zambia (9.6), Egypt (1.3)
08 Edible fruit, nuts, peel of citrus fruits, melons
6,146 12,096 11.95 South Africa (99.9)
09 Coffee, tea, mate, and spices 2,572 4,986 11.66 South Africa (97.4), Zambia (1.6), China (0.3)
10 Cereals 220,735 409,870 10.87 Zambia (41.8), South Africa (20.2), Thailand (12.3)
16 Preparations of meat, fish, and seafood
3,290 4,945 7.03 South Africa (39.4), Namibia (27.7), Thailand (15)
22 Beverages, spirits, and vinegar 36,101 52,220 6.35 South Africa (63.4), Zambia (23.4), Netherlands (4.1)
15 Animal or vegetable fats and oils
118,523 137,018 2.45 South Africa (95.1), UAE (2.3), Kenya (0.8)
17 Sugars and sugar confectionery
32,855 36,802 1.91 South Africa (51), Swaziland (20.4), Malawi (12.3)
70,409 95,111 5.14 South Africa (70.3), Zambia (20.6), Botswana (3.1)
Notes: Trade value in USD ’000. *This figure contains total food exports of the following products: animal and animal products (codes 02, 03, 04); vegetable products (codes 07, 08, 09, 10, 11, 15), and foodstuffs (codes 16, 17, 18, 19, 20, 21, 22).
Source: Trade Map (1995–2015).
Although Zimbabwe has limited export potential because of constrained production capacity, Table 5 shows a small improvement in the country’s exports between 2009 and 2015. Starting from a low base, Zimbabwe’s fastest growing exports between 2009 and 2015 include milling products, fish, fruits, and cereals. Exports of milling products grew at an average of 116 per cent per annum. Sugar and sugar confectionary constitutes a major export product in terms of absolute values, although growing only at an average of 4 per cent per annum.
An increase in exports is also evidenced in local industries receiving import protection in Zimbabwe, which suggests that these measures have helped to some extent in reviving production, which in turn supported exports in these industries. The protection conferred to the cooking oil industry has allowed local suppliers to develop/revive their production capabilities resulting in soya bean cooking oil production more than doubling from 7,000 metric tonnes in 2012 to 16,000 metric tonnes in 2015. It has also attracted FDI from South Africa, in the form of Willowton of
16
South Africa setting up a factory in Mutare in eastern Zimbabwe to produce D’Lite cooking oil which was previously fully imported. This is likely to have contributed to the increase in exports of cooking oil to nearby Mozambique (which, as the trade data shows, is a key export market). Local brands such as Olivine and Pure Drop have also displaced imported products on supermarket shelves. It is estimated that cooking oil production will increase from 140,000 tonnes per annum to 200,000 tonnes per annum, which exceeds local demand. Therefore, the Zimbabwean cooking oil industry will have the scale to export to the region, with supermarkets being a key conduit for this.
Local production of milk and milk products, baked confectionery, and beverages has also increased following protection of these industries through import tariffs. Dairiboard Zimbabwe and Dendairy are among the top players that have increased production in the dairy industry. Production of baked confectionery by local firms—Proton, Bakers Inn, and Lobels—has also increased, displacing imported products on supermarket shelves.
Table 5: Zimbabwe’s exports of food and selected household consumables (2009–15)
436 140 17.25 South Africa (65), Zambia (29.3), Nigeria (5)
Notes: Trade value in USD ’000. *This figure contains total food exports of the following products: animal and animal products (codes 02, 03, 04); vegetable products (codes 07, 08, 09, 10, 11, 15), and foodstuffs (codes 16, 17, 18, 19, 20, 21, 22).
Source: Trade Map (1995–2015).
Therefore, in industries where there has been considerable government support, either through import duties, quotas, or local content stipulations, and where there appears to be some existing capabilities, local production has increased displacing imports on supermarket shelves. However, not all of these protected sectors currently exhibit export potential (see also Section 4 for forms of local protection).
17
Zimbabwean farmers exhibit export capabilities in fresh produce as evidenced by positive growth in exports of vegetables and fruits. A few years ago, certain Zimbabwean farmers were able to meet increasingly tighter standards imposed by UK supermarkets, Tesco and Marks & Spencer. In an effort to meet these requirements, local suppliers responded by restructuring their operations, upgrading infrastructure, facilities, processes, and logistics handling (Kaplinsky and Morris 2014). The local upgrading processes were made possible through the effective cooperation between the government and local suppliers which was key in designing and implementing appropriate policies targeting local upgrading processes.
Zimbabwe’s main export destinations in recent years are countries within SADC. Zimbabwe largely exports food in its primary form and there lies some potential for value addition processes of its food exports.
3.3 Botswana
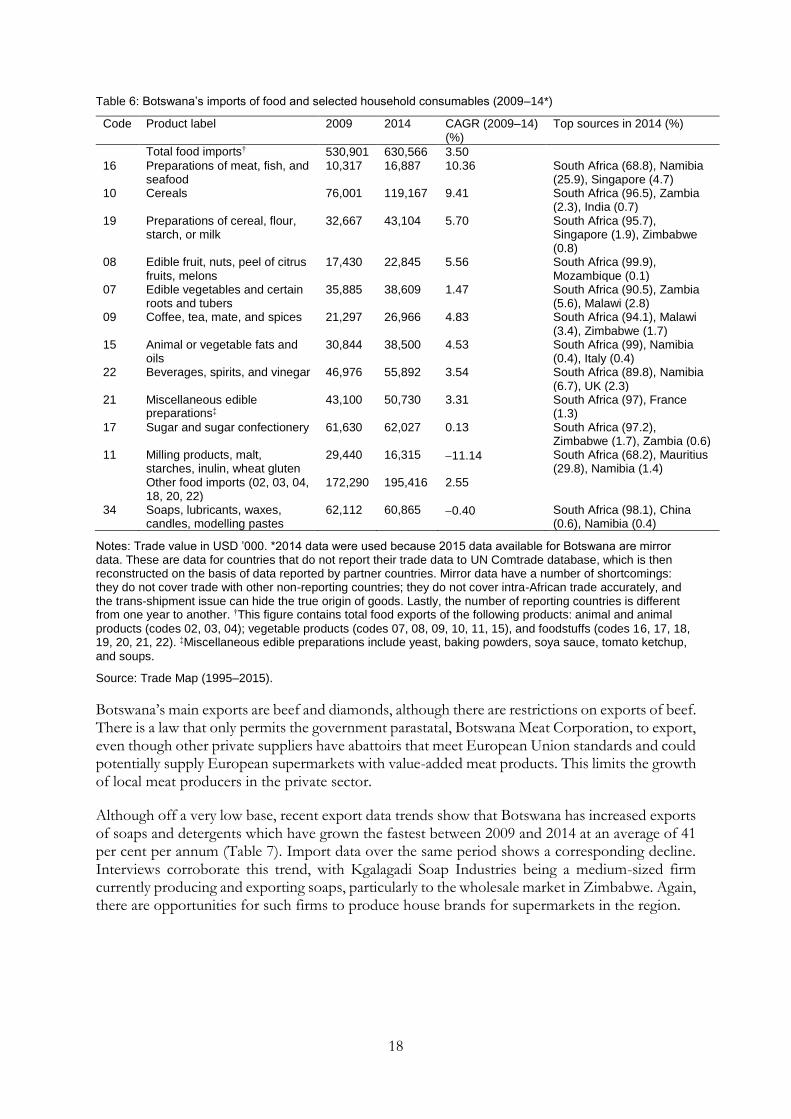
Like Zimbabwe, Botswana remains a net importer of various food and household products. The demand for imports is exacerbated by the fact that Botswana does not grow or produce many food products because of unfavourable weather conditions. The large supermarkets and wholesalers essentially drive imports of food and household products into Botswana, a large proportion of which is again from South Africa. Botswana’s fastest growing imports between 2009 and 2014 include preparations of meat, fish, and seafood; cereals; preparations of cereal, flour, starch, or milk; and edible fruit and nuts (see Table 6). In terms of absolute values, sugar and sugar confectionary and soaps constitute major import products, although they have not grown much between 2009 and 2014.
The drop in imports of milling products, malt, starches, inulin, and wheat gluten by 11.4 per cent between 2009 and 2014 is explained by the introduction of import tariffs on milling products in order to promote local suppliers (see Section 4). The rapid growth in house brands in Botswana, particularly in the milling industry that benefits from import protection, has opened opportunities for local producers to supply supermarkets (see Section 5.5).
18
Table 6: Botswana’s imports of food and selected household consumables (2009–14*)
Code Product label 2009 2014 CAGR (2009–14) (%)
Top sources in 2014 (%)
Total food imports† 530,901 630,566 3.50 16 Preparations of meat, fish, and
seafood 10,317 16,887 10.36 South Africa (68.8), Namibia
(25.9), Singapore (4.7) 10 Cereals 76,001 119,167 9.41 South Africa (96.5), Zambia
(2.3), India (0.7) 19 Preparations of cereal, flour,
starch, or milk 32,667 43,104 5.70 South Africa (95.7),
Singapore (1.9), Zimbabwe (0.8)
08 Edible fruit, nuts, peel of citrus fruits, melons
17,430 22,845 5.56 South Africa (99.9), Mozambique (0.1)
07 Edible vegetables and certain roots and tubers
35,885 38,609 1.47 South Africa (90.5), Zambia (5.6), Malawi (2.8)
09 Coffee, tea, mate, and spices 21,297 26,966 4.83 South Africa (94.1), Malawi (3.4), Zimbabwe (1.7)
15 Animal or vegetable fats and oils
30,844 38,500 4.53 South Africa (99), Namibia (0.4), Italy (0.4)
22 Beverages, spirits, and vinegar 46,976 55,892 3.54 South Africa (89.8), Namibia (6.7), UK (2.3)
21 Miscellaneous edible preparations‡
43,100 50,730 3.31 South Africa (97), France (1.3)
17 Sugar and sugar confectionery 61,630 62,027 0.13 South Africa (97.2), Zimbabwe (1.7), Zambia (0.6)
62,112 60,865 0.40 South Africa (98.1), China (0.6), Namibia (0.4)
Notes: Trade value in USD ’000. *2014 data were used because 2015 data available for Botswana are mirror data. These are data for countries that do not report their trade data to UN Comtrade database, which is then reconstructed on the basis of data reported by partner countries. Mirror data have a number of shortcomings: they do not cover trade with other non-reporting countries; they do not cover intra-African trade accurately, and the trans-shipment issue can hide the true origin of goods. Lastly, the number of reporting countries is different from one year to another. †This figure contains total food exports of the following products: animal and animal
Botswana’s main exports are beef and diamonds, although there are restrictions on exports of beef. There is a law that only permits the government parastatal, Botswana Meat Corporation, to export, even though other private suppliers have abattoirs that meet European Union standards and could potentially supply European supermarkets with value-added meat products. This limits the growth of local meat producers in the private sector.
Although off a very low base, recent export data trends show that Botswana has increased exports of soaps and detergents which have grown the fastest between 2009 and 2014 at an average of 41 per cent per annum (Table 7). Import data over the same period shows a corresponding decline. Interviews corroborate this trend, with Kgalagadi Soap Industries being a medium-sized firm currently producing and exporting soaps, particularly to the wholesale market in Zimbabwe. Again, there are opportunities for such firms to produce house brands for supermarkets in the region.
19
Table 7: Botswana’s exports of food and selected household consumables (2009–14*)
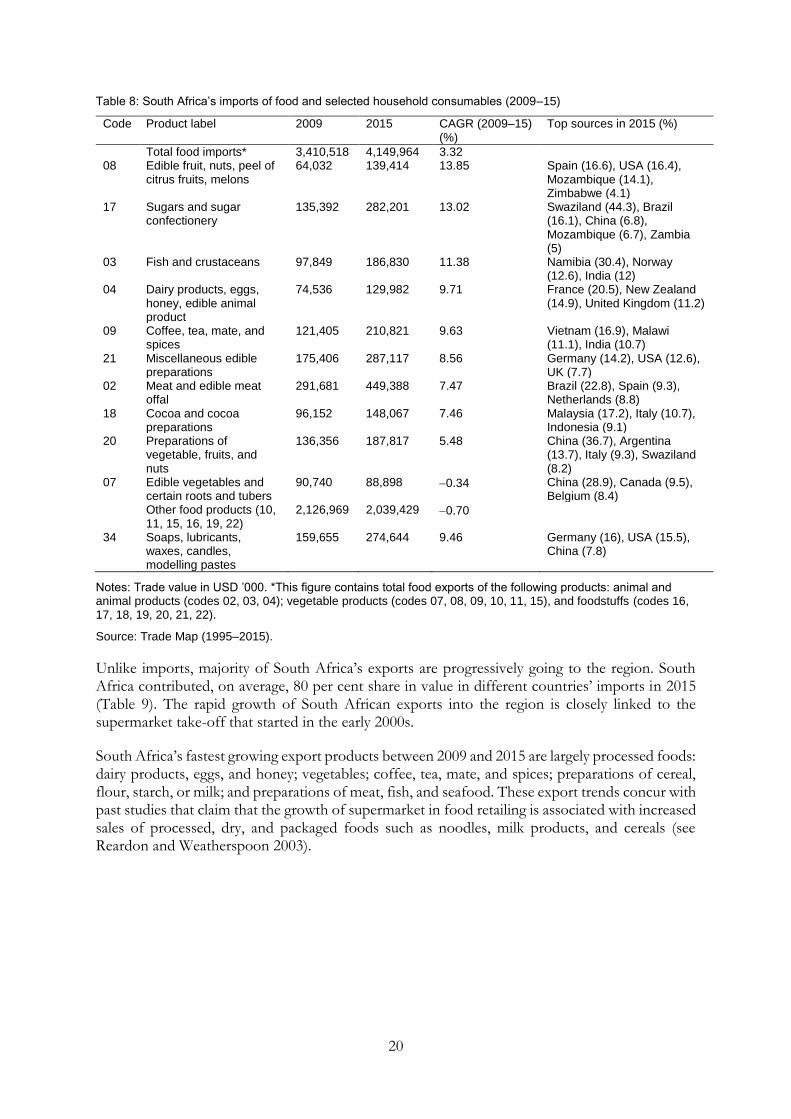
Most of South Africa’s imports of selected food and household products are from deep-sea markets. South Africa’s fastest growing imports between 2009 and 2015 include edible fruits and nuts, sugar and sugar confectionary, fish, and dairy products with an average growth rate above 10 per cent per annum (Table 8). A number of regional countries (Mozambique, Zimbabwe, Swaziland, and Zambia in particular) nonetheless account for South Africa’s fast-growing imports. This signals opportunities for increased exports from regional partners to South Africa, for instance, edible fruits and nuts from Mozambique and Zimbabwe, and sugar and sugar confectionery from Zambia.
20
Table 8: South Africa’s imports of food and selected household consumables (2009–15)
Code Product label 2009 2015 CAGR (2009–15) (%)
Top sources in 2015 (%)
Total food imports* 3,410,518 4,149,964 3.32
08 Edible fruit, nuts, peel of citrus fruits, melons
159,655 274,644 9.46 Germany (16), USA (15.5), China (7.8)
Notes: Trade value in USD ’000. *This figure contains total food exports of the following products: animal and animal products (codes 02, 03, 04); vegetable products (codes 07, 08, 09, 10, 11, 15), and foodstuffs (codes 16, 17, 18, 19, 20, 21, 22).
Source: Trade Map (1995–2015).
Unlike imports, majority of South Africa’s exports are progressively going to the region. South Africa contributed, on average, 80 per cent share in value in different countries’ imports in 2015 (Table 9). The rapid growth of South African exports into the region is closely linked to the supermarket take-off that started in the early 2000s.
South Africa’s fastest growing export products between 2009 and 2015 are largely processed foods: dairy products, eggs, and honey; vegetables; coffee, tea, mate, and spices; preparations of cereal, flour, starch, or milk; and preparations of meat, fish, and seafood. These export trends concur with past studies that claim that the growth of supermarket in food retailing is associated with increased sales of processed, dry, and packaged foods such as noodles, milk products, and cereals (see Reardon and Weatherspoon 2003).
21
Table 9: South Africa’s exports of food and selected household consumables (2009–15)
Notes: Trade value in USD ’000. *This figure contains total food exports of the following products: animal and animal products (codes 02, 03, 04); vegetable products (codes 07, 08, 09, 10, 11, 15), and foodstuffs (codes 16, 17, 18, 19, 20, 21, 22).
Source: Trade Map (1995–2015).
3.5 Some conclusions
A large proportion of food and household products in Botswana, Zambia, and Zimbabwe continues to be imported from South Africa. This trend appears to be driven by the spread of South African supermarkets into selected countries in the region. To create mutually beneficial trade relationships, it is important that South Africa increases its share of imports from the region for sale through supermarket chains. Zambia has export capabilities in sugar confectionary products, cereals, and soaps and detergents. Similarly, Botswana appears to have some, although very small, export potential in exports of soaps and detergents and of beef. Starting from a low base, Zimbabwe shows potential in exports of fresh produce, milling products, and cooking oil. Therefore, there is need to actively encourage the development of capabilities of firms in sectors showing potential so that they can meet the demands of supermarkets (discussed in Section 5).
22
4 Local content requirements and other forms of protection for local industries
Although the trade data highlight products in which there are opportunities to deepen regional trade and reduce the dependence on deep-sea and South African imports, this must be considered in the context of national economic and social policy objectives. Despite the countries studied being part of SADC, each country pursues its own policies to protect and promote its respective national industries. This protection can take many forms, including local content requirements and trade restrictions.
Local content policies or rules require companies, particularly foreign-owned companies, to source a minimum number of goods and services locally by substituting foreign inputs for local inputs (Altenburg et al. 2016). This has an influence on the development of the local supplier base and local supplier participation in the supermarket value chain. The local content initiatives for Botswana and South Africa are highlighted in das Nair and Chisoro (2016).
In Zambia, although there is no formal local content policy presently, there is an increasing drive to source locally. Pick n Pay Zambia committed to targeting 50 per cent local content within 5 years (from 2011) and had already achieved 50 per cent local procurement of fruit and vegetable content within 1 year. Pick n Pay has also replaced certain imported brands of household cleaners with locally manufactured products. Although only around 25 per cent of all products is claimed to be imported directly, this share accounts for 80 per cent of the range of products, suggesting that value addition is still limited in Zambia. Shoprite also claims that 70 per cent of their stock is sourced and produced in Zambia; however, it is unclear what level of value addition these products entail (CCRED 2015). In general, such initiatives and opportunities for developing local capabilities although in existence in Zambia remain underdeveloped and appear to be small in scale, and majority of food products are still imported from South Africa. There are also bans on the importation of maize and wheat, which have had some effect in swinging demand to locally sourced products.
As highlighted, in recent years Zimbabwe has become increasingly protectionist and has a number of restrictions on foreign imports in addition to local ownership and content requirements. The Indigenization and Economic Empowerment Regulations, which sets a requirement of 51 per cent indigenous shareholding in all businesses with a net asset value of USD 500,000, applies to retail and wholesale trade as well as to specific sectors and sub-sectors (e.g. agriculture, bakeries, grain milling, and milk processing). Over and above indigenization laws, there are numerous local content requirements, initiatives, and import restrictions.
The import threshold set by the Competition and Tariff by-laws stipulate that supermarkets are supposed to procure at least 20 per cent of local products. The ‘Buy Zimbabwe’ Trust was created in 2011 to promote production and consumption of local products. There are also high import duties on milled products and cooking oil, as well as a surtax of 25 per cent on imports of a range of supermarket products (e.g. in September 2011, cooking oil, potato chips, baked beans, corn snacks, canned peas, mixed fruit jam, and tomato sauce). In 2012, this was extended to a number of other products. In the case of cooking oil, where there has been a big drive to revive local industry as previously noted, restrictions on imports were within the context of the IDP. Value addition and beneficiation is a key component of the IDP and the Zimbabwe Agenda for Sustainable Social and Economic Transformation. In this regard, in the 2013 National Budget Statement, the government proposed measures to curtail the continued importation of cooking oil, and this was followed by the subsequent removal of cooking oil from the Open General Import Licence in 2015. Consequently, soya bean cooking oil production in the country more than doubled between 2012 and 2015, as previously noted.
23
Customs duty on fresh produce was also increased in January 2012 to 25 per cent to create a favourable environment for local suppliers as vegetable farming provides a source of livelihood for many small-scale producers in the country. There are also custom duties on imported chickens, day-old chicks, and milk products. There has further been a removal of the ‘travellers rebate’ on certain grocery items. Import quotas are also in place for flour and baked confectionery products, whereas import and export licenses are needed for a range of other products.
Over and above local content requirements and import restrictions in certain SADC countries, there are other general challenges faced by exporters or potential exporters in the SADC region. These include cumbersome border procedures such as delays in obtaining and processing export permits and border clearance; high transportation costs exacerbated by road blocks and a poor road network; language barriers particularly in Angola, Mozambique, and the DRC; and high levels of corruption raising costs of doing business. For access to international markets, suppliers highlighted the need to meet phytosanitary regulations, acquire export certificates and permits, comply with state vet audits, as well as comply with the export country requirements (see also Section 5.2).
5 Implications for suppliers and capabilities required
5.1 Critical success factors in the supply to supermarkets
In each country, interviews were conducted with suppliers to supermarkets7 to understand what the critical success factors are in accessing supermarket shelves. The results are fairly consistent across all countries. The most important factors in supplying supermarkets from the perspective of suppliers were the ability to supply products at the lowest cost, to supply at the required quality, and to consistently supply the required volumes across all outlets. However, for franchise stores such as SPAR, small suppliers with limited scale are able to participate in the value chain as there is less of a requirement to have consistency across all the franchises given individual ownership of stores.
Acceptable lead times, particularly for perishables, and brand awareness were also considered important, although ranked lower than the above factors. Brand loyalty was found to be important among low-income customers in South Africa. Such customers have little disposable income and are typically less flexible in trying new brands, preferring to stick with less risky, tried and tested brands. Suppliers therefore have to invest significantly in building brand awareness and loyalty through advertising.
Innovation capabilities appear to be relatively less important in the supply to supermarkets according to suppliers in all four countries, although there was a recognition that a degree of innovation (either in product range or packaging) was important to maintain competitiveness. Forms of innovation undertaken by suppliers in South Africa included investments that improved the quality of existing products (see end of this section for more detail on such investments) and introducing new, value-added products (such as new flavours in yoghurt and yoghurt drinks in the dairy industry, or processed crumbed chicken in the poultry industry). A further finding was that almost all suppliers interviewed had made investments since 2011 in the packaging of their
7 With interviews conducted with non-suppliers too in Zambia.
24
products to improve product image on supermarket shelves, even if no investments were made in the core products themselves.
Location of suppliers relative to supermarkets and transport costs were ranked as the least important factors to supply supermarkets or DCs in Botswana, Zambia, and South Africa. Location of suppliers clearly affects logistics costs in the supply chain. There are variations across products with regard to the location of suppliers—firms that supply high-volume, low-value products such as maize meal are usually located near the source of the input rather than close to the market. For processed foods manufacturers, it is more important to be close to where there is a high density of supermarkets. Similarly, for products with shorter shelf life like milk and meat, it is important to be relatively close to supermarkets. In Zimbabwe, however, transport costs were a greater consideration for suppliers.
Suppliers’ rankings of the critical success factors differed to supermarkets’ ranking of these same factors, at least in Zambia and South Africa, although cost, quality, consistency, and ability to supply volumes were also key requirements of supermarkets. Supermarkets demanded higher capabilities with regard to almost all the factors (with some differences between the countries). This suggests that there are information asymmetries between supermarkets and suppliers, and that suppliers might not be in tune with what supermarkets are looking for. This may call for greater communication between supermarkets and suppliers on why products are rejected by supermarkets, for instance, and what can be done to improve them. As highlighted by suppliers, supermarkets were indeed less concerned about suppliers’ location. This suggests that suppliers can be located in other countries in the region, and as long as they are able to meet the critical success factors identified, they have the potential to supply supermarkets.
A maximum likelihood Probit model was further used by ZIPAR to empirically evaluate additional determinants of participation of local suppliers in Zambia.8 A range of factors was assessed to see what affects the likelihood of supplying supermarkets. These included size (turnover), foreign ownership, years of operations, accreditation, investment in machinery, barcoded packaging, association membership, investment in packaging, management experience, and distance to supermarkets. The results revealed9 that local firms with barcoded products/barcoded packaging are more likely to supply supermarkets than those without barcodes. Similarly, firms that have invested in new production machinery stand a higher chance of supplying supermarkets than those that have not.
5.2 Legal requirements and private standards
The basic legal requirements in all the countries are similar, both for supermarkets and for suppliers, although it appears that certain legal requirements and private standards of supermarkets in South Africa are more stringent than in the other countries.
All the countries have basic local standards that suppliers have to adhere to, such as Zambia Bureau of Standards (ZABS), South African Bureau of Standards (SABS), Botswana Bureau of Standards (BOS), and the Standards Association of Zimbabwe (SAZ) in each country, respectively. Further,
8 Data for the model were collected from 99 suppliers. Of these, 48 per cent were recorded as supermarket suppliers
whereas 52 per cent did not currently supply supermarkets.
9 At the 5 per cent significance level
25
there is a range of food safety, health and safety, environmental, packaging, and labelling standards in each country.
Over and above these basic legal requirements, supermarkets impose private standards on suppliers. In South Africa, supermarkets insist that suppliers have Hazard Analysis and Critical Control Point (HACCP) accreditation. HACCP is an internationally recognized system for reducing the risk of safety hazards in food. The HACCP system requires that potential hazards are identified and controlled at specific points in the process including biological, chemical, or physical hazards. In Zambia, although the HACCP accreditation is fully operational, it is costly and voluntary and is mostly implemented by large companies that can meet these costs. Instead, ZABS of Zambia for instance sets lower minimum domestic quality and food safety standards in order to accommodate majority of local firms struggling to compete with imports. However, this creates a gap between local standards and international standards making it difficult for suppliers to access export markets. In Botswana, it appears that the BOS is in the process of adopting HACCP as a legal standard for Botswana. In Zimbabwe, HACCP is already a compulsory standard and is incorporated into SAZ.
In some cases, supermarkets in South Africa impose higher accreditation standards than HACCP, such as Food Safety System Certification (FSSC 22000) which is also an international accreditation. In other cases, suppliers are taking it upon themselves to get higher accreditations to have a competitive edge over rivals. Regardless of accreditation, it appears that retailers typically send their own auditors to audit the supplier at the supplier’s cost. Estimates from suppliers are that HACCP in South Africa can cost as much as USD 5,500 (around ZAR 80,000) and FSSC 22000 can cost up to USD 13,800 (ZAR 200,000) per annum, with additional USD 6,900 (around ZAR 100,000) annual fees for maintenance.10 Other private standards include sustainability requirements. For instance, Woolworths requires that its food suppliers farm sustainably under its ‘Farming for the Future’ initiative in addition to other sustainability requirements. Shoprite’s fresh produce arm, Freshmark, has its Good Manufacturing Practices standard for all pack-house facilities. Most supermarkets require Halaal and Kosher certifications in South Africa. In the poultry industry, almost all producers are Halaal approved, and abattoirs need to be approved by the government. Supermarkets also impose private standards on house brands for many of these products. In addition, supermarkets are increasingly requiring barcoding on the packaging of products in the countries assessed. As found in the ZIPAR study (Ziba and Phiri 2016), possessing a barcode increases the chances of supplying supermarkets. In Zimbabwe, additional private standards in certain cases include minimum chemical use, organic production systems, minimum pesticides, and use of water-harvested system. Farmers in Zimbabwe who supply to supermarkets are also required to be registered with the Agricultural Marketing Authority (AMA). Other global initiatives, such as GlobalG.A.P. (Good Agricultural Practice), also have implications for local suppliers trying to export to international markets (see das Nair and Chisoro 2016).
The costs of adhering to all these standards and audits is borne entirely by the supplier, making it increasingly costly to supply formal supermarket chains. Independent retailers on the other hand often have lower, if any, private standards. Independent retailers therefore provide an avenue through which new suppliers can start building scale.
10 Exchange rate of 14.427 as of 29 August 2016, as per the Reserve Bank of South Africa.
26
5.3 Procurement practices of supermarket chains
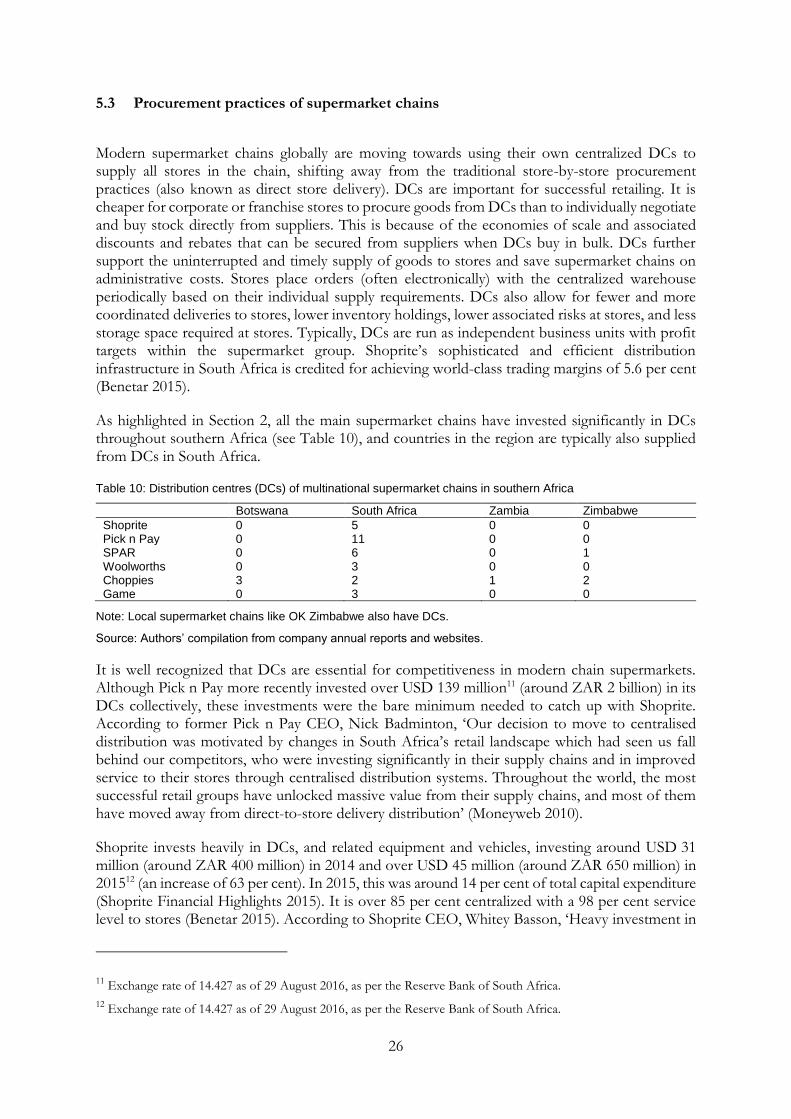
Modern supermarket chains globally are moving towards using their own centralized DCs to supply all stores in the chain, shifting away from the traditional store-by-store procurement practices (also known as direct store delivery). DCs are important for successful retailing. It is cheaper for corporate or franchise stores to procure goods from DCs than to individually negotiate and buy stock directly from suppliers. This is because of the economies of scale and associated discounts and rebates that can be secured from suppliers when DCs buy in bulk. DCs further support the uninterrupted and timely supply of goods to stores and save supermarket chains on administrative costs. Stores place orders (often electronically) with the centralized warehouse periodically based on their individual supply requirements. DCs also allow for fewer and more coordinated deliveries to stores, lower inventory holdings, lower associated risks at stores, and less storage space required at stores. Typically, DCs are run as independent business units with profit targets within the supermarket group. Shoprite’s sophisticated and efficient distribution infrastructure in South Africa is credited for achieving world-class trading margins of 5.6 per cent (Benetar 2015).
As highlighted in Section 2, all the main supermarket chains have invested significantly in DCs throughout southern Africa (see Table 10), and countries in the region are typically also supplied from DCs in South Africa.
Table 10: Distribution centres (DCs) of multinational supermarket chains in southern Africa
Note: Local supermarket chains like OK Zimbabwe also have DCs.
Source: Authors’ compilation from company annual reports and websites.
It is well recognized that DCs are essential for competitiveness in modern chain supermarkets. Although Pick n Pay more recently invested over USD 139 million11 (around ZAR 2 billion) in its DCs collectively, these investments were the bare minimum needed to catch up with Shoprite. According to former Pick n Pay CEO, Nick Badminton, ‘Our decision to move to centralised distribution was motivated by changes in South Africa’s retail landscape which had seen us fall behind our competitors, who were investing significantly in their supply chains and in improved service to their stores through centralised distribution systems. Throughout the world, the most successful retail groups have unlocked massive value from their supply chains, and most of them have moved away from direct-to-store delivery distribution’ (Moneyweb 2010).
Shoprite invests heavily in DCs, and related equipment and vehicles, investing around USD 31 million (around ZAR 400 million) in 2014 and over USD 45 million (around ZAR 650 million) in 201512 (an increase of 63 per cent). In 2015, this was around 14 per cent of total capital expenditure (Shoprite Financial Highlights 2015). It is over 85 per cent centralized with a 98 per cent service level to stores (Benetar 2015). According to Shoprite CEO, Whitey Basson, ‘Heavy investment in
11 Exchange rate of 14.427 as of 29 August 2016, as per the Reserve Bank of South Africa.
12 Exchange rate of 14.427 as of 29 August 2016, as per the Reserve Bank of South Africa.
27
distribution and technology has resulted in huge cost savings. We now have the lowest cost structure in the industry. . . . ‘Through this investment, Shoprite completely outmanoeuvred Pick n Pay. The signs were there in 2007 when Shoprite share price started outperforming Pick n Pay at an accelerated pace’ (Benetar 2015).
DCs also benefit suppliers by reducing queuing times at multiple stores, allowing more efficient use of transport owing to full truck loads, facilitating lower administration costs through single invoicing and allowing less handling of products in the process. However, they can also limit the possibility of small local suppliers negotiating deals individually with stores. In the case of corporate stores within supermarket chains in the southern African region, decisions on suppliers are often made at head office level in South Africa. Store managers often have little discretion to select their own suppliers although they may provide supplier information to head office. Franchises have more flexibility regarding procurement decisions making it relatively easier for local suppliers to supply franchise stores. However, even for franchises, it is often cheaper to source through a central procurement system given the attractive cost savings from economies of scale and scope.
Heavy investments in DCs are a major structural barrier to entry for new supermarket chains. In South Africa, Fruit and Veg City overcame this barrier by focusing initially on a niche area—fresh produce—and procuring daily from local municipal fresh produce markets, thereby significantly cutting costs.13 As Fruit and Veg City built a footprint, they could support investments in DCs and logistics networks. Independent retailers in South Africa have also found ways to partially benefit from economies of scale and scope of DCs without having to invest in them by procuring through buying groups who buy in bulk on their behalf. However, the lack of access to DCs and logistics networks still places them at a considerable competitive disadvantage. Suppliers often provide additional discounts for sales to DCs even for the same volume of product. These include distribution, warehouse, and pallet discounts, which estimates suggest could amount to 10 per cent off the price of products in South Africa. Investments in DCs, therefore, can contribute to levelling the playing field for independent retailers (see das Nair and Chisoro 2015).
5.4 An evaluation of buyer power
Given the market power of the large supermarket chains in the region, suppliers, particularly small- and medium-sized suppliers, may not be able to secure attractive trading terms to enable long-term participation in supermarket value chains. Over and above demanding lower costs and higher standards from suppliers, supermarkets often impose a range of other costs through trading terms. Large supermarket chains in many cases are able to control pricing in their trading terms by controlling elements such as listing fees, rebates, advertising and slotting allowances, promotion fees, payment period terms, settlement discounts, and new store openings fees (Reardon and Gulati 2008). This unilateral control of trading terms is reflective of the buyer power of large supermarket chains globally (Clarke et al. 2002; OECD 2015b).
The supplier interviews in each country revealed that the large supermarket chains generally dominate the negotiations of trading terms. Contracts between suppliers and supermarkets are usually evergreen, with the trading terms typically renegotiated on an annual basis. Given that majority of the same retailers that operate in South Africa also operate in the other countries, the practices in the different countries are generally similar.
13 In addition to efficient management of the business.
28
The South African supermarkets often require suppliers to pay listing fees to be listed in their books. According to supermarkets, given vigorous competition for shelf space, payment of listing fees shows the supplier’s commitment and confidence in their ability to supply supermarkets and in the quality of their product. Examples of listing fees in South Africa range from USD 350 to USD 3,500 (around ZAR 5,000 to ZAR 50,000) for a single product line for a limited time period, or 12–15 per cent off the list price, to as high as USD 17,000 to USD 20,000 (around ZAR 250,000 to ZAR 300,000) for till positions for a limited time period.14 In Zimbabwe, estimates range from USD 10 to USD 2,500 per product line with USD 50 to USD 100 for the introduction of an additional new product line, and USD 180 to USD 300 per gondola. An interesting finding is that suppliers in the other countries often claimed to receive better trading terms from local supermarkets than they did from the South African supermarkets located in their countries. Suppliers in the other countries also generally highlighted the difficulties in accessing decision makers of South African supermarkets who are located in South Africa, making negotiations of trading terms harder.
Access to good shelf space (including in gondola ends during promotions) is critical for suppliers to successfully sell their products. For new entrants and small suppliers, it is a constant battle to access prime shelf space that is usually taken up by dominant suppliers. Similarly, access to cooler/refrigeration space is important for suppliers of cold products (such as soft drinks, ice creams, and frozen products). There have been numerous competition cases globally that have recognized the harm to competition of dominant suppliers imposing exclusivity on cooler space.15 Recently in South Africa, a settlement was reached in the SAB Miller/Coca-Cola bottlers merger which included, among other things, an undertaking to allow 10 per cent of Coca-Cola fridge space in small retail outlets to stock competitors’ carbonated soft drink products.
Settlement discounts are also given to supermarkets for paying the supplier within the number of days stipulated in the trade agreement, which varies depending on the supplier. In South Africa, it is commonly 15–30 days from statement and the discount for paying within this period is usually in the range of 2.5–5 per cent off the list price. In Botswana, the typical payment period is also 30 days after statement. In Zambia and Zimbabwe, however, there appears to be a perception that longer payment periods are the norm in South Africa and that this practice of long payment periods has been ‘imported’ into these countries by South African supermarkets and adopted by local supermarket chains. Long payment periods have been identified as a key cause of non-participation of local suppliers in the supermarket value chain in Zambia. This again highlights serious information asymmetries between suppliers and supermarkets in these countries.
Long payment periods put considerable pressure on suppliers’ cash flow and working capital, which is problematic for small suppliers. Certain suppliers in Botswana further highlighted the need to invest in quality administration systems that invoice accurately and on time to ensure that supermarkets find no reason not to pay or to delay payment. Allegations by suppliers in Zimbabwe extended to suggesting that suppliers were subsidising supermarkets with these long payment periods and that this money was a cheaper way for supermarkets to replenish stock rather than to seek other sources of finance (such as bank loans) to do so.
Supermarkets in South Africa sometimes require advertising discounts off the purchase price for indirectly advertising on behalf of suppliers when they advertise the supermarket chain generally.
14 Exchange rate of 14.427 as of 29 August 2016, as per the Reserve Bank of South Africa.
15 For examples of cases, see European Commission (2005), Competition Commission of Mauritius (2013), and
Competition Commission of Singapore (2013).
29
However, not all suppliers are required to pay such fees, especially those that heavily invest in advertising their own brands. In Zimbabwe, supermarkets sometimes bear part of the advertising costs but in most instances suppliers pay an advertising allowance to supermarkets. Suppliers usually also contribute towards the retailer’s cost for promotions. Suppliers pay supermarkets to participate in different promotions and to get special shelf space for these promotions.16 Promotion fees can range from USD 2,500 to USD 7,00017 (around ZAR 2,500 to ZAR 100,000) in South Africa, depending on the scale of the promotion and the size of the outlet. Suppliers can also run promotions at their own cost in the supermarket premises. Supermarkets in Zimbabwe sometimes provide support to suppliers through joint-sales promotions.18 For large-scale promotions, suppliers can pay around USD 10,000 for each product line to cover the costs of the supermarket advertising through television, newspapers, and flyers.
There are concerns of buyer power in Botswana too. The Competition Authority of Botswana (CAB) undertook an inquiry in the retail sector in Botswana in 2015/16. They evaluated the following potential abuses of buyer power of supermarkets: de-listing and threat of de-listing when suppliers do not reduce their prices or agree to other demands of the supermarket, demanding advertising fees for both branded and house brands, demanding retrospective rebates and after-sales rebates from manufacturers, delaying payments, and demanding swell allowances (for wastage). The CAB highlighted that the various trading terms typically lowered the price that suppliers were able to earn by at least 10–15 per cent, putting pressure on margins (Bagopi et al. 2016).
5.5 Growth of house brands
Another avenue through which supermarkets can increase their bargaining power against suppliers is through increasing their range of private label or house brand products (see das Nair and Chisoro 2016). There has been growth in private label products in supermarket shelves in South Africa recently. Every major supermarket chain has a range of own brand/private label products.19 Many suppliers of branded products also manufacture and sell private labels to supermarkets. Supplying house brands is a way in which suppliers can get their products on supermarket shelves. Suppliers can use this as a stepping stone to get onto supermarkets’ preferred supplier lists especially for suppliers that have not yet built a brand name. House brands also confer some bargaining power to supermarkets over large, multinational suppliers. However, concerns were highlighted around suppliers being ‘forced’ into supplying house brands at lower margins than their own branded products and this was used as a tool to negotiate down prices for branded products.
In Botswana, suppliers are increasingly manufacturing and packing house brands for supermarkets and wholesalers such as Choppies, Sefalana, and Trident/Eureka. Choppies has over 50 of its own branded products in food, beverages, household cleaning products, and cosmetics. Production of house brands provides opportunities for suppliers to supply supermarkets in the region. However,
16 In South Africa, these include Back to School, Hey Days, Easter, and Christmas promotions.
17 Exchange rate of 14.427 as of 29 August 2016, as per the Reserve Bank of South Africa.
18 Such as the OK Grand challenge, TM/Pick n Pay cutlery and car promotions, Food World promotion, and SPAR
Hoza Summer promotion.
19 Majority of Woolworths’ products are private labels. Shoprite has its ‘Ritebrand’ and ‘Housebrand’ ranges in
Checkers, which covers around 300 products. Pick n Pay has its ‘No Name’ brand and is looking to further expand the private label range. Food Lover’s Market produces its own house brands ‘Freshers’ and ‘Food Lover’s Signature’. SPAR also has its own branded products. SPAR does not allow major suppliers to manufacture its own private label products, thus allowing new and small suppliers to enter the supermarket supply chain.
30
national competition authorities, like the CAB, have raised concerns about the rapid increase in house brands and the impact on suppliers. The CAB’s retail inquiry highlighted that house brands considerably increased the buyer power of supermarkets and that this negatively affected the margins of suppliers who supplied both house brands and branded products. The concern was that retailers in Botswana were pushing the sales of house brands at the expense of branded products (in terms of better shelf space, promotions, advertising, etc.).
A further development in Botswana is that local supermarket chains have been backwardly integrating into manufacturing of house brands. In 2015, Choppies entered the broiler industry by acquiring existing abattoirs in Bwate, and started producing its own chickens. The other local poultry producers highlighted that this development resulted in a significant decrease in their sales to Choppies of frozen chicken.20 Choppies appears to have backwardly integrated into the manufacture of other supermarket products, like house brand bottled water and packaged sugar. There is therefore a concern that such vertical integration, along with the growth in popularity of house brands and the buyer power of supermarkets, could result in the foreclosure of suppliers with respect to their higher margin branded products.
Even in Zimbabwe, local chains like OK Zimbabwe have developed a range of their own private label products, such as OK Pot ‘O’ Gold, OK Value, Bon Marche’s Premier Choice, and Shoppers Choice labels. TM/Pick n Pay also have house brands in dairy, household, grain, and processed goods. In Zambia, only a few house brand products are manufactured locally, with the bulk being imported from South Africa and other countries. Competition from house brands was identified as a reason why certain suppliers were not able to access supermarket shelves in Zambia.
5.6 Supplier capabilities and changes in capabilities as a result of supermarkets
Supermarkets require that suppliers make basic investments in their product before they can even start supplying them. These investments include, among other things, branding (to build brand awareness and loyalty), advertising, sampling, point-of-sale material, packaging, merchandising, and marketing. Such investments ensure that the product sells in the market, which is solely the suppliers’ responsibility.
The types of investments in upgrading depend on the sector under consideration (see das Nair and Chisoro 2016). A number of suppliers interviewed in South Africa have made substantial investments in machinery and equipment, an indication that they are investing in upgrading their capabilities to meet or improve on the critical supply factors (costs, volumes, quality, etc.) Suppliers have upgraded their logistics supply chains to reduce costs and improve the quality of existing products (including through research and development spending) and have invested heavily in packaging to ensure that products are well displayed on supermarket shelves. Although these investments are not claimed as necessarily being due to direct pressure from supermarkets, but rather to become more competitive relative to other local producers and imports, they nonetheless occur primarily because suppliers want to improve their sales through supermarket chains. On the other hand, investments by firms supplying house brands or private labels are directly linked to supermarket requirements and specifications.
Although some suppliers in South Africa have made considerable investments in machinery and equipment, not many suppliers have introduced entirely new products into the market, signalling relatively low levels of innovation. This is also a function of the nature of the basic products
20 There is a ban on poultry imports into Botswana.
31
investigated in this study. Nonetheless, a few suppliers have introduced new products to their suite of offerings. For instance, dairy producers have launched ready-to-eat jelly, desserts, flavoured milkshakes, yoghurts, and butters. In the milling industry, suppliers have introduced pre-cooked and flavoured maize meal. Poultry producers have increased sales of value-added products such as chicken nuggets and crumbed chicken in addition to mass processed ‘individual quick frozen’ chicken. Such additions require investments in cold chains. In a few cases, innovation by suppliers has been directly linked to a supermarket chain.21
In Botswana, large local suppliers have invested in new machinery and equipment. Some suppliers are consolidating lines in order to increase volumes on core products and reap economies of scale, but many are investing in improving quality of existing products and packaging. There is little innovation in terms of introducing new product categories.
In Zimbabwe, the general finding was that supplying supermarkets had indeed improved capabilities of suppliers relative to those who were not part of the supermarket value chain. Some companies had introduced new product lines and new designs on existing products as part of innovations to remain competitive. Others multinational suppliers in Zimbabwe invested in new machinery to increase capacity and improve safety and hygiene standards. Like in South Africa and Botswana, suppliers also invested in barcoding and improved packaging of products (for instance, bread is now commonly commercially sold in barcoded and decorated plastics).
5.7 Supplier development programmes and government support for suppliers
As evident, the growth of supermarkets and modernization of procurement systems has placed considerable pressure on suppliers with regard to costs, volumes, consistency, and quality. Suppliers require a range of capabilities to meet these requirements to successfully supply supermarkets. Some lead supermarket groups are more active in building these required capabilities through close partnerships with local suppliers than others. Similarly, some key suppliers have successfully entered supermarket value chains on the back of their own investments.22
In Zambia, suppliers largely receive non-financial assistance from supermarkets. Supermarkets are in certain cases relaxing their standards for processed goods in order to incorporate local suppliers into supermarket supply chains in addition to developing a database procurement system that includes local suppliers. Supermarkets also provide local suppliers with information regarding standards they should meet in order to supply supermarkets including the relevant institutions that certify products in Zambia. However, there have been two concrete local content initiatives implemented by supermarkets since 2011: a memorandum of understanding (MOU) signed between Shoprite and the Zambia Development Agency aimed at promoting small and medium enterprises (SMEs), with support from the Ministry of Trade and Commerce; and an MOU signed between Shoprite and the Private Enterprise Programme Zambia under the Department for International Development programme also aimed at supporting SMEs.
21 For example, a large poultry supplier produces pasteurized ‘safe eggs’ exclusively for Shoprite Checkers in South
Africa. An exclusive fruit supplier to Woolworths invested in distribution facilities with state-of-the-art cooling, ripening, and pre-packing facilities to produce ripe and ready products, and developed new cultivars in some of its fruit lines.
22 For a detailed description of supplier development programmes by supermarkets and government support in South
Africa and Botswana, see das Nair and Chisoro (2016).
32
In Zimbabwe, government agencies such as the AMA assist in registering farmers into groups to facilitate linkages with markets, including through providing them with essential information about markets. There is a range of programmes led by non-governmental organizations that focus on capacity building, input procurement, and creating linkages with global markets. Other upcoming initiatives to promote procurement of local products include the Confederation of Zimbabwe Industries’ intention to launch a vendor card programme supported by a local telecommunication firm, Econet, and the European Union to enable vendors to buy directly from manufacturers. There are also a number of outgrower schemes that are developing between processors and farmers, including in the meat, dairy, oil, and beverage (juice) industries.
There appears to be limited support for suppliers from government, aside from support through import protection, in Botswana. Although there is financial support available in South Africa from government, this is often difficult to access.
There are specific constraints that each country faces, but there are some common concerns across all countries. Aside from access to finance and lack of retail skills, other areas where government assistance was sought include rehabilitation of infrastructure (such as rail, road, and energy infrastructure), better access to agricultural extension services, greater protection from imports, regularly reviewed ‘sensitive product’ industries, and facilitation of access to export markets.
6 Competitive dynamics between supermarkets
The previous sections highlighted the significant impact of supermarkets on the development and participation of suppliers. Greater competition between supermarkets results in more alternatives for suppliers, and this improves their chances of obtaining favourable trading terms as they can play off supermarkets against one another.
The strategic behaviour of incumbent supermarkets with market power can limit the participation of new players in the industry. As highlighted in das Nair and Chisoro (2015), a competition concern in several international jurisdictions23 and a common historic concern in South Africa is the practice of dominant supermarket chains entering into leases with property owners in shopping malls that contain exclusivity clauses.24 This prevents new entrants from locating in lucrative retail spaces, limiting their ability to enter or expand. Attractive store sites are necessary to build scale if a new entrant with a chain store format is to become an effective competitor.
The Competition Commission of South Africa (2016) has received numerous complaints about exclusive leases over the years, and in 2015 announced that it would undertake a market inquiry into the retail sector looking into this issue among others. The inquiry is on-going.
Interviews in South Africa revealed that such leases are still prevalent25 but are typically not favoured by property developers as it limits their ability to place free-standing bakeries, butcheries, or green grocers and from optimizing the best tenant mix suited for the shopper coming to the centre. It also limits the future growth of the centre. In practice, leases usually last for 10 years, but
23 As highlighted in OECD (2013); see also Kobel et al. (2015).
24 For a detailed assessment of this, see das Nair and Chisoro (2015).
25 A range of factors affect whether exclusive leases are insisted upon in South Africa. These include shopping centre
size, whether the centre is a new or existing centre, whether the centre is in a rural or urban area, or whether it is a corporate or franchise store.
33
anchor tenants can have up to five options for renewal resulting in exclusivity that spans for several decades. Although exclusive leases might arguably be justified in the initial phases of the investment to allow the anchor supermarket to recoup its investment, gain footfall, and establish a market, it is hard to see how such justifications can be reasonable for such extended periods of time. This is especially the case if supermarkets are able to recoup their investments within a few years of establishment (das Nair and Chisoro 2015).
It also appears that small property developers, particularly for shopping centres in rural areas, who do not have bargaining power against major supermarkets are more inclined to succumb to entering into exclusive leases to kick-start developments. Lack of competition has far-reaching consequences in rural areas where pricing is a key factor for low-income consumers. Further, small specialized businesses in rural areas like grocers, bakers, and butchers are prevented from locating in centres if there is exclusivity. The anticompetitive impact of exclusive leases is likely to be more strongly felt in such areas, especially because the nearest alternative shopping mall is further away than in urban areas, increasing transport and search costs for consumers.
Some of the South African supermarkets appear to have ‘exported’ the practice of entering into exclusive leases to the other countries in this study. In Botswana, however, the competition authority has reached a settlement with a supermarket that required exclusive leases, resulting in the removal of the clause and an undertaking that it would not continue with this practice. In Zambia, some supermarkets attested to having exclusive leases with shopping malls. Others claimed that these leases no longer exist but did so prior to the Competition and Consumer Protection Commission discouraging such conduct.
Another avenue in which competition between supermarkets may be dampened is when a dominant supermarket uses its buyer power to enter into exclusive agreements with key suppliers, preventing them from supplying ‘must-have’ products to rival supermarkets. In South Africa, suppliers interviewed generally noted that supermarkets did not impose exclusivity conditions in their trading terms (where, if on the supermarket’s supplier list, they are prevented from supplying rival supermarkets). This bears out in practice in that most suppliers usually sell to multiple supermarkets. The exception to this is in the supply of house brands. Certain suppliers are developed exclusively by supermarkets to supply house brands and these suppliers are typically not permitted to sell the brand to other supermarkets. There were no major concerns raised about this in the four countries.26 Aside from a few instances in the supply of house brands, suppliers were free to supply any supermarket chain, new entrant chain, or independent retailer. However, even if suppliers are free to supply independent retailers, the various costs imposed on them by large supermarkets (as highlighted in Section 5) may negatively affect the trading terms with independent retailers as compensation for these higher costs (the waterbed effect). In South Africa, it is often difficult for independent retailers, wholesalers, or buying groups to get similar trading terms to what the large supermarket chains get for seemingly equivalent transactions.
26 There are other ad hoc instances where supermarkets require exclusive commitments from suppliers. For instance,
in Zimbabwe, when supermarkets are running promotions, they may require a temporary exclusive commitment from a supplier for certain products.
34
7 Conclusions and recommendations
This synthesis paper has assessed the modernization and spread of supermarket chains in Botswana, South Africa, Zambia, and Zimbabwe, and the impact this has had on consumers, suppliers, and the competitive landscape. This has been viewed through a regional lens, rather than a national or global lens, in order to potentially identify what can be done to encourage the growth of suppliers in the region through supermarkets as the key route to market.
This paper was the first to map and contrast the evolution of the retail landscape in each country, highlighting the nuances in the value chain, the key players, and the mode of supermarket spread. This evolution is important to appreciate the strategies of supermarkets, their different business models, and the alternative routes to market that suppliers have.
The growth of supermarkets in the region opens up opportunities for suppliers, providing potential to stimulate and revive industries in the selected countries. For countries like Zambia, this can aid the broadening of its export base to counter the risks associated with the dependence on copper that is susceptible to international price shocks. The trade patterns in selected food and household consumable products have revealed the importance of supermarkets in driving regional trade. To create mutually beneficial trade relationships in the SADC region, it is important that South Africa increases its share of imports from the region and that trade is not so heavily skewed in one direction. The research has highlighted that Zambia has export capabilities in cereals, sugar confectionary products, and soaps and detergents, with large growth in exports of these and other non-traditional goods to southern African countries, particularly the DRC. Starting from a low base, Zimbabwe also shows some potential in exports of fresh produce, milling products, and cooking oil. The growth in exports of cooking oil has been bolstered by extensive protection of local producers. Opening up greater trade opportunities through supermarkets could be achieved through bilateral trade agreements between governments of these countries, with off-take commitments from supermarkets.
However, there are presently restrictions to such trade in the form of protection measures through local content policies, import duties, and import quotas that serve to protect national industries in each country. Although local content initiatives have not always been strictly enforced and are at different stages of implementation in the different countries, they are not aligned with an agenda to develop suppliers to supply regional markets. If supermarkets are to become a key route to regional markets for suppliers, then the country policies and laws that currently exist need to be harmonized across the region with a wider view of developing regional value chains. Such policies could be specific to the supermarket industry, where for instance governments and supermarkets jointly determine a proportion of space on supermarket shelves to be allocated to products manufactured in SADC. There may also be benefits in harmonizing legal standards across the region to assist in greater acceptance of products and ease entry into supermarket value chains. However, there are political sensitivities around local content and national protection measures that have to be carefully managed and these have to be borne in mind when designing such policies.
Opening up the region to trade alone is insufficient to guarantee sustainable supply to supermarkets. Suppliers need to develop and invest in capabilities. The research highlighted that certain critical success factors are needed to sustainably supply supermarkets and these were broadly consistent across the countries. These include producing cost-competitive, high quality products as well as meeting consistency and volume requirements of supermarket chains. Investments in machinery and barcoding capabilities were further shown to increase the probability of suppliers entering supermarket value chains. Although location of suppliers was not found to be a major critical success factor, there are transport cost implications of where suppliers
35
are located. Suppliers in Botswana, Zambia, and Zimbabwe could exploit opportunities to transport goods offered by South African trucks that supply products to supermarkets in their respective countries but return empty to South Africa. This requires coordination between suppliers and supermarkets with possible assistance from governments.
The studies showed evidence of upgrading of supplier capabilities to meet some of these critical success factors in all four countries. This has largely been through process upgrading and upgrading in packaging. It may well be that only a few, already large, suppliers are able to upgrade to supply sustainably to the region in each sector. This can result in increased supplier concentration within these sectors in the region. Competition authorities would therefore have to be aware of any inadvertent consequences of large suppliers upgrading their capabilities to supply the region.
There appears to be only limited support from supermarkets in upgrading supplier capabilities in each country. The existing supplier development initiatives are ad hoc, small in scale and scope, and are mainly targeted at farmers with limited success. They also do not have a regional development objective. Successfully developing supplier capabilities requires a much larger, long-term, commercially oriented approach by supermarkets possibly in partnership with governments. This can be done through the creation of supplier development funds as part of programmes similar to the Massmart/Walmart supplier development programme. Funding for such programmes can come from fines levied by the competition authorities in abuse of dominance or cartel matters in each country.
The research has further revealed limited support from governments in each country for new entrants and suppliers to supermarkets. Lack of finance and retail skills were raised as major barriers to expansion, with funding available from government being difficult to access because of extensive red tape. The modernization of supermarkets has also resulted in costly investments required in DCs and supply chain management. Governments can provide support to new entrants and independent retailers through facilitating access to, or financing of, DCs.
The nature of the relationship between supermarkets and suppliers affects participation. The research revealed that the multinational supermarket chains in the region have significant buyer power, the exertion of which is clearly seen in the negotiation of trading terms and in the imposition of private standards. This results in additional costs for suppliers. The international experience has shown that voluntary codes of conduct between suppliers and supermarkets are a useful way to control the exertion of buyer power and have been identified as a practical and effective approach in developing countries to level the playing field and reduce information asymmetries between suppliers and supermarkets. This is similar to what has been done in the United Kingdom, through its Groceries Supply Code of Practice which stipulates that retailers are required to comply with the Groceries Market Investigation Order of the former Office of Fair Trading.27 In Ireland, there are plans to institute a mandatory Code of Conduct in the grocery sector, to be overseen by the Department of Jobs, Enterprise and Innovation. In Spain, a new act focusing on measures to improve the functioning of the food chain was promulgated in 2013; it uses a mixed model of regulation and self-regulation (through voluntary codes of conduct) to govern commercial relations between the agents in the food chain. Such codes of conduct can be
27 This Code is enforced in the United Kingdom by an independent Groceries Code Adjudicator, set up specifically
to oversee the relationship between supermarkets and their suppliers and housed within the former Office of Fair Trading (OFT).
36
encouraged by national governments, and harmonized across the region given that it is largely the same retailers that operate in the different countries in the region.
A growing opportunity for suppliers to participate in supermarket chains in all countries is through producing house brands or private labels for supermarkets. However, concerns around buyer power being exerted on suppliers of house brands at the expense of their branded product have been raised, particularly in Botswana. This foreclosure concern is exacerbated by the fact that some large chains like Choppies are vertically integrating into their own production of supermarket products under house brands. Again, codes of conduct covering negotiations of trading terms tailored for house brands can potentially alleviate some of these concerns.
The exertion of buyer power and private standard requirements are lower in the alternative retail route to market in each country—the independent retailer route—providing an avenue for suppliers to get their products to market and to build scale and capabilities. This highlights the importance of encouraging fair competition between supermarkets and independent retailers, as well as encompassing open and flexible retail space in urban planning to ensure a mix of retail formats.
Finally, the conduct of supermarket chains, particularly the South African chains, tends to be similar in the region given central control out of head offices in South Africa. This extends to procurement practices, trading terms, and potential anticompetitive conduct such as entering into exclusive leases. Although seemingly less common outside South Africa, the potential anticompetitive harm of exclusive leases can be minimized by facilitating legally enforceable undertakings by incumbent supermarkets to either not enter into leases with exclusivity clauses or mandate the reduction of the duration and scope of the clauses.28 The competition authorities in the respective countries can proactively address this, and have done so already in Botswana and Zambia. In South Africa, it is expected that the current market inquiry undertaken by the Competition Commission will address this issue. Governments can also encompass open and flexible retail space in urban planning to ensure a mix of formats and address exclusivity through planning policies, opening up markets to wider participation and ensuring competition to incumbents. This requires municipalities to play a role in opening up markets, possibly under guidance from national government and the competition authorities.
28 Internationally, the UK Competition Commission made an order to phase out exclusivity clauses in its Groceries
Market Investigation Order of 2010 following recommendations for an investigation from the former OFT. In Australia, following the inquiry by the competition authority, the major supermarket chains, a wholesaler, and other retailers voluntarily provided court enforceable undertakings that phased out exclusive lease provisions over a number of years.
37
References
Altenburg, T., E. Kulke, A. Hampel-Milagrosa, L. Peterskovsky, and C. Reeg (2016). ‘Making Retail Modernisation in Developing Countries Inclusive’. Discussion Paper 2/2016. Bonn: German Development Institute.
Bagopi, E., T. Mbongwe, C. Daman, and G. Modungwa (2016). ‘Competition Dynamics in Retail and Wholesale Sector’. Second Annual Competition and Economic Regulation (ACER) Conference, Livingstone, Zambia. Botswana: Competition Authority of Botswana.
Basker, E., and M. Noel (2013). ‘Competition Challenges in the Supermarket Sector with an Application to Latin American Markets’. Report for the World Bank and the Regional Competition Centre for Latin America. Mexico, DF: CRCAL.
Benetar (2015). Shoprite—The Journey to Central Distribution: The Drive to Continuously Satisfy the Consumer. Presentation at the 37th Annual SAPICS Conference & Exhibition. Available at: http://conference.sapics.org/wp-content/uploads/2015/presentations/The%20Journey%20to%20Central%20Distribution%20-%20A%20case%20study%20on%20Shoprite%20the%20last%2020%20years%20-%20Gary%20Benatar.pdf (accessed December 2016).
Betancourt, R. (2006). The Economics of Retailing and Distribution. London: Edward Elgar Publishing.
Betancourt, R., and M. Malanoski (1999). ‘An Estimable Model of Supermarket Behaviour: Prices, Distribution Services and Some Effects of Competition’. Empirica 26: 55–73.
Boselie. D., S. Henson, and D. Weatherspoon (2003). ‘Supermarket Procurement Practices in Developing Countries: Redefining the Roles of the Public and Private Sectors’. American Journal of Agricultural Economics, 85(5): 1155–61.
Briggs and Associates (2015). ‘Botswana Overview: Presentation and “Report on Regulations Affecting Wholesale Trading in Botswana” ’. Personal communication with authors.
CCRED (2015). ‘Growth Promotion through Industrial Strategies—Zambia’. International Growth Centre Working Paper. Johannesburg: International Growth Centre.
Chigumira, G., E. Chipumho, E. Mudzonga, and G. Chiunze (2016). ‘The Expansion of Regional Supermarket Chains: Changing Models of Retailing and the Implications for Local Supplier Capabilities—A Case of Zimbabwe. Forthcoming WIDER Working Paper. Helsinki: UNU-WIDER.
Clarke, R., S. Davies, P.W. Dobson, and M. Waterson (2002). Buyer Power and Competition in European Food Retailing. Cheltenham: Edward Elgar.
Competition Commission of Mauritius (2013). ‘Investigation into the Supply of Coolers to Retailers by Phoenix Beverages Limited and Quality Beverages Limited CCM/INV/019’. Report of Undertakings: Non-Confidential Version. Available at: http://www.ccm.mu/English/Documents/Investigations/INV019-Final%20Report%20of%20Undertaking-NC.pdf (accessed 21 April 2016).
Competition Commission of South Africa (2016). Media Release: Commission appoints panel for the Grocery Retail Sector market inquiry. Available at: http://www.compcom.co.za/wp-content/uploads/2016/01/Commission-appoints-panel-for-the-Grocery-Retail-Sector-Market-Inquiry.pdf; http://www.compcom.co.za/wp-content/uploads/2016/01/Commission-appoints-panel-for-the-Grocery-Retail-Sector-Market-Inquiry.pdf (accessed 29 August 2016).
38
Competition Commission of Singapore (2013). ‘Coca-Cola Singapore Beverages Changes Business Practices in Local Soft Drinks Market Following Enquiry by CCS’. Media Release, 10 January. Available at: https://www.ccs.gov.sg/media-and-publications/media-releases/cocacola-singapore-beverages-changes-business-practices-in-local-soft-drinks-market-following-enquiry-by-ccs (accessed 21 April 2016).
das Nair, R., and S. Chisoro (2015). ‘The Expansion of Regional Supermarket Chains: Changing Models of Retailing and the Implications for Local Supplier Capabilities in South Africa, Botswana, Zambia, and Zimbabwe. WIDER Working Paper 2015/114. Helsinki: UNU-WIDER.
das Nair, R., and S. Chisoro (2016). The Expansion of Regional Supermarket Chains: Implications on Suppliers in Botswana and South Africa. Forthcoming WIDER Working Paper. Helsinki: UNU-WIDER.
Emongor, R., and J.F. Kirsten (2006). ‘Supermarkets in the Food Supply Systems in Southern African Development Community: A Case Study of Zambia’. Journal of Applied Sciences, 6: 800–09.
Emongor, R., and J.F. Kirsten (2009). ‘The Impact of South African Supermarkets on Agricultural Development in the SADC: A Case Study in Zambia, Namibia and Botswana’. Agrekon, 48(1): 60–84.
European Commission (2005). Commission Decision. Case COMP/39.116/B-2 Coca-Cola. Available at: http://ec.europa.eu/competition/antitrust/cases/dec_docs/39116/39116_258_4.pdf (accessed 21 April 2016).
Haese, M.D., and G. Van Huylenbroeck (2005). ‘The Rise of Supermarkets and Changing Expenditure Patterns of Poor Rural Households Case Study in the Transkei Area, South Africa’. Food Policy, 30: 97–113.
Humphrey, J. (2007). ‘The Supermarket Revolution in Developing Countries: Tidal Wave or Tough Competitive Struggle?’. Journal of Economic Geography, 7: 433–50.
Kaplinsky, R., and M. Morris (2014). ‘Developing Industrial Clusters and Supply Chains to Support Diversification and Sustainable Development of Exports in Africa’. Report for the African Export-Import Bank. Cairo: African Export-Import Bank.
Kobel, P., P. Këllezi, and B. Kilpatrick (eds) (2015). Antitrust in the Groceries Sector & Liability Issues in Relation to Corporate Social Responsibility. LIDC Contributions on Antitrust Law, Intellectual Property and Unfair Competition. Berlin/Heidelberg: Springer-Verlag.
Moneyweb (2010). ‘R628m Distribution Centre for Pick n Pay’, 20 July. Available at: http://www.moneyweb.co.za/archive/r628m-distribution-centre-for-pick-n-pay/ (accessed 25 August 2015).
OECD (2015a). ‘Session I—Structural Issues in the Groceries Sector: Merger and Regulatory Issues’. Background paper by the OECD Secretariat, Latin American Competition Forum, DAF/COMP/LACF (2015)13, 23–24 September 2015, Montego Bay, Jamaica.
OECD (2015b). Session III—Competition Issues in the Groceries Sector: Focus on Conduct’. Background paper by the OECD Secretariat, Latin American Competition Forum, DAF/COMP/LACF (2015)18, 23–24 September 2015, Montego Bay, Jamaica..
OK Zimbabwe Limited (2016). Our Brands. Available at: http://www.okziminvestor.com/brands/ (accessed 26 August 2016).
39
Pick n Pay (2015). Integrated Annual Report 2015. Available at http://www.picknpayinvestor.co.za/downloads/2015/Pick%20n%20Pay%20Integrated%20Annual%20Report%202015%20spread%20view.pdf (accessed 26 August 2016).
PWC (2012). ‘South African Retail and Consumer Products Outlook, 2012–2016’. PWC and Economist Intelligence Unit Report, October. Available at: http://www.pwc.co.za/en/assets/pdf/retail-and-consumer-products-outlook-2012-2016.pdf (accessed 15 July 2015).
Reardon, T., and A. Gulati (2008). ‘The Rise of Supermarkets and Their Development Implications: International Experience Relevant for India’. IFPRI Discussion Paper 00752. Washington, DC: International Food Policy Research Institute (IFPRI) and Michigan State University.
Reardon, T., and D. Weatherspoon (2003). ‘The Rise of Supermarkets in Africa: Implications for Agrifood Systems and the Rural Poor’. Development Policy Review, 21(3): 333–55.
SADC (2015). ‘Industrialisation Strategy and Roadmap, 2015–2063’. Zimbabwe: SADC Summit, ILO. Available at: http://www.ilo.org/wcmsp5/groups/public/---africa/---ro-addis_ababa/---ilo-pretoria/documents/meetingdocument/wcms_391013.pdf (accessed December 2016).
Shoprite Holdings Ltd (2015). Integrated Report 2015. Available at: http://www.shopriteholdings.co.za/InvestorCentre/FinancialArchives/Pages/Integrated-Reports.aspx (accessed 26 August 2016).
Shoprite Financial Highlights (2015). Available at: http://www.shopriteholdings.co.za/InvestorCentre/Pages/Analyst-Presentations-.aspx (accessed October 2015).
SPAR Group Ltd (2014). SPAR International Annual Report 2014. Available at: https://www.spar-international.com/wp-content/uploads/2016/03/SPAR-International-Annual-Report-2014-EN.pdf (accessed 26 August 2016).
SPAR International (2015). Key Figures 2015. http://www.spar-international.com/country/zambia/ (accessed 10 August 2016).
The Best of Zambia. (2014). Poundstretcher Zambia. Available at: http://thebestofzambia.com/orgs/poundstretcher/ (accessed 26 August 2016).
Trade Map (1995–2015). Trade Statistics for International Business Development. Available at: http://www.trademap.org/ (accessed 29 August 2016).
Tschirley, D. (2010). ‘Opportunities and Constraints to Increased Fresh Produce Trade in East and Southern Africa’. Paper prepared for 4th Video Conference under AAACP-Funded Series of High Value Agriculture Seminars. Available at: http://citeseerx.ist.psu.edu/viewdoc/download?doi=10.1.1.186.450&rep=rep1&type=pdf (accessed 27 October 2016).
Ziba, F., and M. Phiri, M. (2016). ‘The Expansion of Regional Supermarket Chains: Implications for Local Suppliers—The Case for Zambia. Forthcoming WIDER Working Paper. Helsinki: UNU-WIDER.