26
WIDER Working Paper 2018/4 Fiscal pressure of migration and horizontal fiscal inequality Evidence from Indian experience Pinaki Chakraborty * and Shatakshi Garg * January 2018

WIDER Working Paper 2018/4
Fiscal pressure of migration and horizontal fiscal inequality
Evidence from Indian experience
Pinaki Chakraborty* and Shatakshi Garg*
January 2018

* National Institute of Public Finance and Policy, New Delhi, India; corresponding author, email [email protected]
This research study is released in connection with the WIDER Development Conference on ‘Migration and mobility – new frontiers for research and policy’, jointly organized with the African Research Universities Alliance (ARUA), on 5-6 October 2017 in Accra, Ghana.
Copyright © UNU-WIDER 2018
Information and requests: [email protected]
ISSN 1798-7237 ISBN 978-92-9256-446-9 https://doi.org/10.35188/UNU-WIDER/2018/446-9
Typescript prepared by Ans Vehmaanperä.
The United Nations University World Institute for Development Economics Research provides economic analysis and policy advice with the aim of promoting sustainable and equitable development. The Institute began operations in 1985 in Helsinki, Finland, as the first research and training centre of the United Nations University. Today it is a unique blend of think tank, research institute, and UN agency—providing a range of services from policy advice to governments as well as freely available original research.
The Institute is funded through income from an endowment fund with additional contributions to its work programme from Denmark, Finland, Sweden, and the United Kingdom.
Katajanokanlaituri 6 B, 00160 Helsinki, Finland
The views expressed in this paper are those of the author(s), and do not necessarily reflect the views of the Institute or the United Nations University, nor the programme/project donors.
Abstract: This paper examines the patterns and trends in inter-state migration across Indian states and observes that migration is affected by demographic profile as well as the fiscal profile of states. Econometric estimation suggests that level of vertical federal transfers and its horizontal distribution has an impact on out-migration. To correct for the extant horizontal fiscal inequality across Indian states, the paper suggests a relatively more progressive transfer system and a developmental fiscal policy stance at the state level to reduce pressure of out-migration to prosperous regions of the country.
Keywords: Migration, inequality, demography, fiscal policy, state finance, intergovernmental transfers JEL classification: E62, H7, O15, C33
Acknowledgements: This paper is part of a larger research project on Intergovernmental Fiscal Relations in India. This work was carried out with the aid of a grant from the International Development Research Centre, Ottawa, Canada, under the Think Tank Initiative.

1
1 Introduction
In federal countries, migration is a common feature. Migration of people from low-income regions to the more prosperous regions of the country is a common feature of Indian federation too. This pattern of out-migration has resulted in political opposition in many states demanding migrants to go back so that resident population can avail the benefits of ‘local public goods’ and economic prosperity of these regions1. On the economic side, high-income regions are also wary of the fiscal condition of their states arising on account of the fiscal pressure of migration2. In a federal system, the objective of fiscal transfers is to address the issue of fiscal inequality arising due to the differences in fiscal capacity. How does one find a solution to the problem of fiscal pressure arising out of migration in the high-income regions of the country is an important policy question especially in a country like India with large-scale fiscal inequality among the states? This difference in fiscal inequality has also resulted in inequality in the provision of ‘local public goods’ across regions, accentuating migration. This also raises a further question whether fiscal behaviour of provincial governments in both high and low-income regions of the country induce migration. These issues are addressed in this paper taking data on migration across provinces (inter-state migration), fiscal transfers, provincial government expenditure and own revenues of provinces for the years 1971, 1981, 1991, and 2001.3
Section 2 of the paper examines in detail the revenue sharing principle and its likely implications on transfers to regions and thereby migration. Section 3 presents a brief review of literature on internal migration and some key findings on internal migration in India. Section 4 analyses the pattern of inter-state migration for the period from 1971 to 2001. Section 5 examines economic and demographic profiles of states during this period to understand the nature and pattern of migration. Section 6 analyses fiscal profile of states during this period. Section 7 presents the results of the empirical exercise whether fiscal behaviour of provinces induces migration, and draws conclusions.
2 (a) Population in revenue sharing without factoring in migration: the policy constraint
India is a federal country with three levels of government, namely the Union, State, and Local Government. Article 1 of the Constitution India adopted in 1950 described India as a ‘Union of States’, as a result of which India had a two-tier level of government until 1993. Post-1993, the federal structure of the country was further strengthened as a result of the 73rd and 74th Amendment Acts, and local bodies got constitutional recognition as the third tier of the government. It is important to note that although the Constitution provides for divided
1 Given the huge influx of migrants from Bihar and Uttar Pradesh to Maharashtra, some political outfits in the state of Maharashtra have been very vocal about the pressure of migration on local economy. Available at www.rediff.com/news/2008/mar/05thackeray.htm (accessed 11 September 2017). 2 Maharashtra Chief Minister stated that unchecked influx into the city has put considerable strain on Mumbai's infrastructure. ‘Public amenities such as water, suburban rail network have to bear the burden (of influx).’ The opposition expressed concerns over migration and its adverse impact on the fiscal condition of the state. Available at timesofindia.indiatimes.com/india/Unchecked-influx-strainging-Mumbai-Deshmukh/articleshow/ 2850604.cms?referral=PM (accessed 11 September 2017) 3 Since data on migration is available from the Census of India, we have the time periods in accordance to the Census. The time period of analysis for our study has not been extended to 2011 because data on inter-state migration has not been released yet.

2
governmental functions and powers among the three levels of government, namely Centre, State, and Local Government (as laid out in Schedule VII, Schedule XI and Schedule XII of the Constitution), imbalances often arise between functional responsibilities and financial resources at different layers of the government often as part of the constitutional design (Bagchi 2003(a); Rao and Singh 2004; Rao and Singh 2006). The vertical and horizontal asymmetries arising in a federal polity as a result of differences in functional responsibilities and financial resources among the subnational governments have been studied extensively in the global context (Akerlof 1969; Oates 1999; Boadway 1992; Weingast 2009) as well in particular context of India (Bagchi 2003(b); Rao and Chelliah 1996; Tillin 2006; Singh 2007). Economic asymmetry among the states in the Indian federation is evident from the wide disparities across the Indian states – to illustrate: in terms of area, the largest state, Rajasthan, is almost 90 times bigger than the smallest state, Goa; the state with the highest NSDP in the year 2001, Maharashtra, exceeded Mizoram’s NSDP by roughly 175 times; per capita NSDP of Goa (the highest in the country) was a massive 9 times larger than the lowest per capita NSDP of Bihar. Needless to say, these staggering differences across states have severe implications and influence inter-state migration decisions of individuals.
The task of addressing these regional imbalances was entrusted primarily to the Finance Commission4 and (erstwhile) Planning Commission5 (now the NITI Aayog6). While determining inter-se share of federal taxes to provinces in India, the basic aim has been to correct differentials in revenue-raising capacity and cost disability factors across provinces (Rao and Singh 2003; Kumar and Managi 2009; Chakraborty 2003). To achieve these goals, different Finance Commissions have followed principles of equity and efficiency. The criteria used by the Finance Commission for revenue sharing can be categorised as: (a) factors reflecting needs such as population and income; (b) cost disability indicators such as area and infrastructure backwardness, and, (c) fiscal efficiency indicators such as tax effort and fiscal discipline. To date, fourteen Finance Commissions have been constituted that have each given their recommendations to address both, horizontal and vertical fiscal imbalances. Over these years, recommendations made by the Finance Commission, in general, and the efficacy of transfers in filling the vertical and horizontal gap, in particular, have been discussed extensively (Sinha 2004; Bagchi and Chakraborty 2004; Rangarajan and Srivastava 2011; Chakraborty 2010).
2 (b) Implications of the use of dated population for resource distribution
There was a convention to use latest Census figures for distributing the shareable proceeds of taxes to the states until the mid-1970s. However, since early 1980s, it was mandated that 1971 population will be used for distributing federal tax proceeds to the states. It was the consequence of the 42nd Constitutional Amendment Act which froze the seats in National Parliament and state legislative
4 The Finance Commission is a constitutional body that is constituted by the President of India every five years under Article 280 of the Indian Constitution to address both vertical and horizontal fiscal imbalances in the country. It is entrusted with the responsibility of distributing net proceeds of taxes between Centre and the States, and determining factors governing Grants-in Aid to the states and the magnitude of the same. 5 The Planning Commission was established in the year 1950 when the need for a formal mode of planning was felt. The Commission, an arm of the Central Government of India (thus not deriving its power from the Constitution), had the main function of formulating India’s Five Year Plans. 6 The National Institution for Transforming India, also called NITI Aayog, is the policy think-tank of the Government of India. Formed in 2015 to replace the Planning Commission, the institute provides both directional and policy inputs to the Union and State Governments. It aims at designing strategic and long-term policies and programmes for the Government of India, and involving States as partners in national development to foster cooperative federalism in the country.

3
assemblies on the basis of 1971 population until 2001. The implications of freezing the seats in National Parliament in influencing electoral federalism in the country were discussed extensively (McMillan 2000, 2001; Sivaramakrishnan 2000). This amendment was further extended by the 84th Constitutional Amendment Act until 2026. The basic argument given in its favour was that it would boost the family planning programme (FPP) for population control by providing incentive to the states which were serious in implementing FPP. This was argued to provide a direct incentive to the lagging states in implementation of FPP effectively.
However, the use of 1971 dated population data in this case, by design, has ignored migration as a factor reflecting fiscal needs of a state in subsequent federal distribution of taxes and grants spanning over more than 4 decades. Over the time period of our study (1971-2001), we observe that the demographic composition of states has changed significantly. While the prosperous regions of the country have achieved replacement-level fertility, poorer states like Bihar, Uttar Pradesh, Madhya Pradesh, and Rajasthan have still very high TFR (total fertility rate). The dependency ratio7 has also been relatively higher for the poorer states. It is also observed that in recent years due to fast growing urbanization, people are attracted to bigger cities either in search of a job or to get education. Large number of in-migrants to a place pose several challenges to public service delivery resulting in additional administrative and other fiscal costs of financing public services. Since migration is an important factor affecting the population of the state apart from natural factors viz. fertility and mortality, and is affected by the ever-evolving demographic composition across the Indian states, the use of dated population data in the Indian federal system is unable to take these factors into consideration in the distribution of resources. It may not be an exaggeration to argue that use of dated population data denied resources to the poorer regions which in turn induced out-migration. In this study we have analysed the effect of freezing of 1971 population on the devolution of resources. It has been found that the use of dated population has resulted in the distortion in the allocation of the resources to the states and, penalized the states for having more than average growth rate of population and also for being poor. The Fourteenth Finance Commission was for the first time since the 42nd constitutional amendments mandated to take 1971 population as the base and also subsequent demographic changes as factors for determination of devolution of taxes and duties and grants-in-aid across states (Govt. of India, 2014).
3 (a) Internal migration – a brief review of literature
The UNDP Human Development Report 2009 estimated that internal migrants were almost four times as many as those who have moved internationally. The Report shed new light on the common misconception that migration is heavily concentrated from developing to developed countries. The findings in the Report suggested that migration from one developing economy to another was much more common and that most migrants moved within their own country rather than going abroad (UNDP 2009). Inter-state migration has been studied extensively in literature with a lot of focus to understand the determinants of migration and the influence of migration as an equilibrating mechanism in a changing economy. Todaro (1980: 361) noted that one of the earlier studies on internal migration argued that ‘rapid internal migration was thought to be a desirable process by which surplus rural labor was withdrawn from traditional agriculture to provide cheap manpower to fuel a growing modern industrial complex (Lewis 1954; Fei and Ranis 1961)’. The basic proposition of the theoretical Todaro (1969) model and the Harris Todaro model
7 Dependency Ratio is the number of children (0-14 years old) and older persons (65 years or over) to the working-age population (15-64 years old). Source: United Nations (2002).

4
(1970) that migration proceeds primarily in response to differences in ‘expected’ urban and rural real incomes has been used extensively in literature to understand inter-state migration. Thus, income differentials across regions have been commonly used as determinants to understand inter-state migration.
Coupled with this, there have been a lot of studies on understanding migration and fiscal state of the provinces. Buchanan (1950) suggested that differences in fiscal capacity across regions provide an incentive for migration because ‘if states are not identical in fiscal capacity, the people in the low-capacity (low-income) states must be subjected to greater fiscal pressure (higher taxation and/or lower value of public services) than people in high-capacity states. Bird and Smart (2002) argued that the rationale of transfers from the Centre to the states should be to enable even the smallest and poorest governments to provide all basic local services to their residents so as to check for out-migration from the poorer regions. Shaw (1986) in a comparative study pre-1971 and post-1971 using data on Canada’s 17 Census Metropolitan Areas found that the influence of traditional market variables (wage, employment, and changes in business cycle) diminished over time, and that fiscal variables like unemployed insurance, federal government equalization and related transfers to provinces, and natural resource revenues have had unintended consequences in influencing migration. Barro and Sala-i-Martin (1992) in their comparative study on regional growth and migration in the USA and Japan found that, while reaction of migration to regional income differentials in both countries was significantly positive, the reaction was slow and that exogenous changes in migration seemed to be unimportant in explaining the process of interregional convergence.
Internal migration in India is also driven by regional disparities across the Indian states. Kurian (2000), Srivastava and Saikumar (2003), Joe et al (2009), Srivastava (2011), and Das and Saha (2013) have used various socio-economic indicators to establish that, in general, migrants move from less-developed regions of the country to relatively more-developed regions of the country. Over time, the role of urbanization in influencing the spatial pattern of internal migration in India has been studied extensively in literature along with the ensuing policy challenges of correcting regional imbalances in development (Yadava & Yadava 1995, Mukherji 2001, Srivastava 2011, Bhagat & Mohanty 2009). One of the few studies on migration and fiscal variables in India has been by Cashin and Sahay (1996). In their study on 20 Indian states during the period 1961–91, they found evidence of absolute regional convergence among the Indian states, and that the poorer states received more transfers from the Central government than their richer counterparts. They also found migration to have only little effect on convergence of per capita income across states as significant social, economic, and cultural barriers resulted in net migration from poor to rich states responding only weakly to cross-state income differentials. However, there is no study in the Indian context on the impact of transfers on inter-state migration. Our attempt in this paper is to show how the use of dated 1971 population data in determining transfers from the Centre to the states has failed to account for the changes in population across states due to migration, and thus influenced the pattern of inter-state migration in the country. We then empirically test for the influence of intergovernmental transfers in determining migration across the 28 Indian states for the time period 1971 to 2001.
3 (b) Internal migration in India
Before we begin to analyse the inter-state migration in India and its determinants, we examine internal migration in India and the stated reasons for migration. Data on internal migration is

5
reported in the Census using two criteria – ‘Place of Birth’ and ‘Place of Last Residence’8, and if the place of birth/last residence is different from the place of enumeration, the respondent is reported as a migrant. Internal migration consists of intra-state and inter-state migration — intra-state migration is studied by analysing data reported under the heading ‘Within the state of enumeration but outside the place of enumeration’; data on inter-state migration is studied from the heading ‘States in India beyond the state of enumeration’. Internal migration in India is mostly on account of intra-state migration which is roughly four-fifth of the total migration within the country. It is to be noted that even though inter-state migration constitutes a relatively smaller share of total internal migration in the country, a study of inter-state migration is of significance given the huge magnitude of inter-state migrants in the country. According to the Place of Birth criterion, reported inter-state migrants increased from around 11.5 million in 1981 to 42.34 million in 2001.
It is now interesting to examine the stated reasons for migration. The Census of 1981 for the first time included questions on the reasons for migration9. Figure 1 presents the findings from the analysis of the stated reasons for migration. While for the total population the main reason for migration continues to be marriage, followed by employment, there is huge disparity across gender and the quantum of migration on account of these stated reasons is also changing. It is evident that migration due to employment is the prominent reason stated by males. Migration increased from 31 per cent in 1981 to 48 per cent in 2001 due to employment but migration due to marriage and migration when the family moved decreased over the period 1981 to 2001. On the contrary, for females marriage and family movement are the main reasons for migration while migration due to employment and education constitute a paltry 5 per cent. However, migration due to marriage has come down significantly from 72 per cent in 1981 to 55 per cent in 2001, and migration due to employment, albeit small, has doubled from 2 per cent in 1981 to 4 per cent in 2001. As a result, for the overall population we see a decline in migration due to marriages from 52 per cent in 1981 to 32per cent in 2001, and an increase in migration due to employment from 10% in 1981 to 24 per cent in 2001 (Sekhar 1982; Padamanabha 1988; Vijayanunni; Registrar General and Census Commissioner 2001).
8 Place of Last Residence criterion was first introduced in the 1971 Census. Census from 1881 to 1971 reported data on migration using the Place of Birth criterion alone. 9 1981 census recorded reasons for migration under five broad heads: Employment, Education, Family moved, Education, and Others. The Census of 1991 included two additional reasons – Business and Natural Calamities like droughts, floods, etc. 2001 Census along with the five reasons in the 1981 Census had Business and Moved after Birth as the additional reasons. For analysis, we have clubbed Business, Natural Calamity and Moved after birth with ‘Others’.

6
Figure 1: Stated reasons for migration
0.00
10.00
20.00
30.00
40.00
50.00
60.00Reasons for Migration - Total Population
1981 1991 2001
23.74
1.47
23.0031.78
20.01
Employment EducationFamily moved MarriageOthers

7
Figure 1: Stated reasons for migration (continued)
Source: Computed from Census of India, Various Years
4 Inter-state migration: trends and patterns
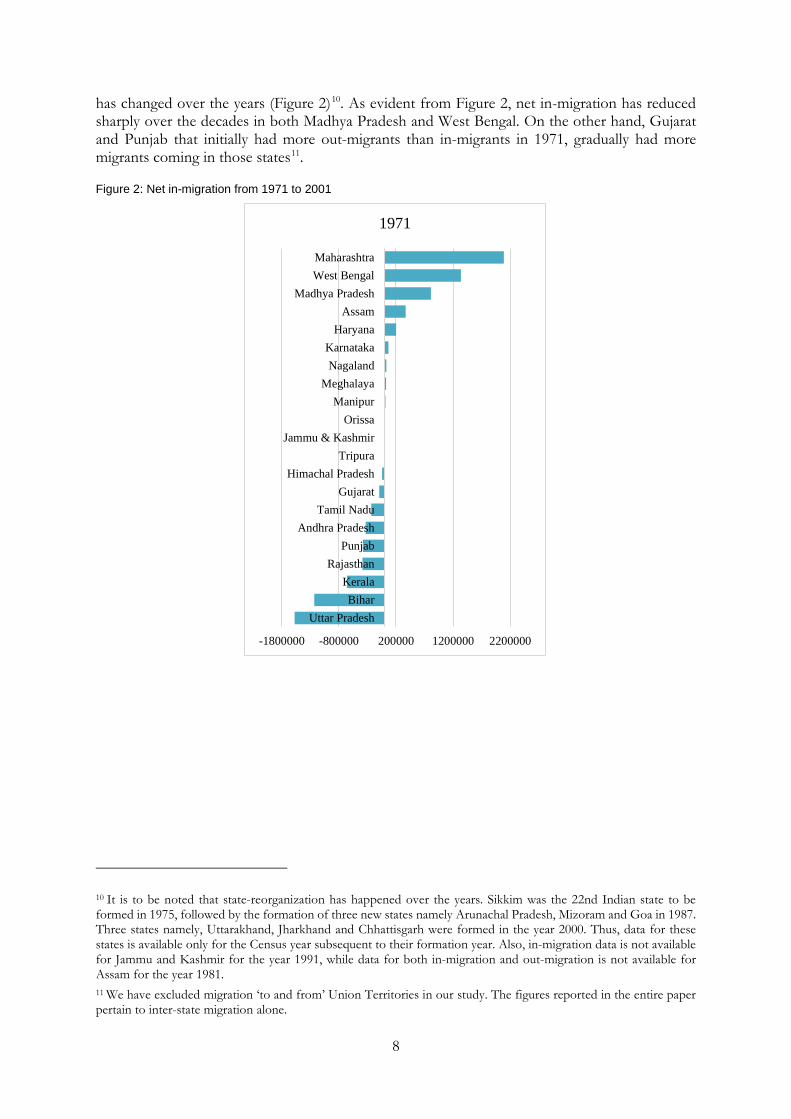
Net migration to a state is computed by subtracting out-migration from a state from in-migration to a state. In our study, we have used Census data on migration based on ‘Place of birth’ criterion for the time periods 1971, 1981, 1991 and 2001. From the Census data for the years 1971, 1981, 1991, and 2001, we observe that three states, namely Maharashtra, West Bengal and Madhya Pradesh have most net in-migrants though the relative shares of these states in total net in-migrants
0.00
10.00
20.00
30.00
40.00
50.00
60.00
Reasons for Migration - Male Population
1981 1991 2001
0.0010.0020.0030.0040.0050.0060.0070.0080.00
Reasons for Migration - Female Population
1981 1991 2001
8
has changed over the years (Figure 2)10. As evident from Figure 2, net in-migration has reduced sharply over the decades in both Madhya Pradesh and West Bengal. On the other hand, Gujarat and Punjab that initially had more out-migrants than in-migrants in 1971, gradually had more migrants coming in those states11.
Figure 2: Net in-migration from 1971 to 2001
10 It is to be noted that state-reorganization has happened over the years. Sikkim was the 22nd Indian state to be formed in 1975, followed by the formation of three new states namely Arunachal Pradesh, Mizoram and Goa in 1987. Three states namely, Uttarakhand, Jharkhand and Chhattisgarh were formed in the year 2000. Thus, data for these states is available only for the Census year subsequent to their formation year. Also, in-migration data is not available for Jammu and Kashmir for the year 1991, while data for both in-migration and out-migration is not available for Assam for the year 1981. 11 We have excluded migration ‘to and from’ Union Territories in our study. The figures reported in the entire paper pertain to inter-state migration alone.
-1800000 -800000 200000 1200000 2200000
Uttar PradeshBihar
KeralaRajasthan
PunjabAndhra Pradesh
Tamil NaduGujarat
Himachal PradeshTripura
Jammu & KashmirOrissa
ManipurMeghalaya
NagalandKarnataka
HaryanaAssam
Madhya PradeshWest BengalMaharashtra
1971

9
Figure 2: Net in-migration from 1971 to 2001 (continued)
-3000000 -1000000 1000000 3000000
Uttar PradeshBihar
KeralaTamil Nadu
Andhra PradeshRajasthan
PunjabHimachal Pradesh
ManipurJammu & Kashmir
TripuraSikkim
NagalandMeghalaya
GujaratOrissa
KarnatakaHaryana
Madhya PradeshWest BengalMaharashtra
1981

10
-3000000 -1000000 1000000 3000000
Uttar PradeshBihar
KeralaTamil Nadu
RajasthanAndhra Pradesh
Himachal PradeshTripuraSikkimOrissa
ManipurMizoram
MeghalayaPunjab
NagalandGoa
Arunachal PradeshKarnataka
AssamHaryanaGujarat
West BengalMadhya Pradesh
Maharashtra
1991

11
Source: Computed from Census of India, Various Years
We now examine the pattern of out-migration and in-migration, and the reasons behind such inter-state migration patterns. It is interesting to note that five Indian states namely, Uttar Pradesh, Bihar, Rajasthan, Kerala and Andhra Pradesh constitute more than four-fifth of total out-migrants in the country of the states where out-migrants exceed in-migrants. The share of out-migrants from these five states has been 84.65 per cent, 87.96 per cent, 88.97 per cent and 88.95 per cent for the years 1971, 1981, 1991, and 2001 respectively. While Uttar Pradesh continues to have the highest share at around 40 per cent of the total, the share of out-migrants from Kerala and Andhra Pradesh has declined from 13.31 per cent and 6.72 per cent in 1971 to 6.52 per cent and 5 per cent in 2001 respectively (Figure 3). It is to be noted that Uttar Pradesh, Bihar and Rajasthan are the poorest regions of the country and remain at the bottom of the ladder as evident from their per capita income.
-5000000 -2000000 1000000 4000000
Uttar PradeshBihar
RajasthanTamil Nadu
KeralaAndhra Pradesh
OrissaAssam
NagalandManipur
Jammu & KashmirTripura
MizoramHimachal Pradesh
ChhatisgarghSikkim
MeghalayaKarnataka
Arunachal PradeshGoa
UttaranchalMadhya Pradesh
PunjabJharkhand
West BengalGujarat
HaryanaMaharashtra
2001

12
Figure 3: Share of states where out-migration exceeds in-migration
Source: Computed from Census of India, Various Years
On the other hand, in-migration is concentrated in six Indian states namely, Gujarat, Haryana, Punjab, Madhya Pradesh, Maharashtra, and West Bengal. Among the states where in-migrants exceed out-migrants, the share of in-migrants in these states has remained at around 90 per cent from 1971 to 2001. However, migration across states has changed significantly. While Maharashtra continues to have the highest share of in-migrants in the country, the share of West Bengal and Madhya Pradesh among the states where in-migrants exceed out-migrants has dropped significantly. Their respective shares of in-migrants have slipped from 27.03 per cent and 16.41 per cent in 1971 to 8.50 per cent and 2.31 per cent in 2001. A contrasting increase in the share of in-migrants has happened in the states of Haryana, Gujarat and Punjab (Figure 4). In fact, Gujarat in 1981 Census and Punjab in 1991 Census for the first time had positive net in-migrants (Refer Figure 2), i.e. in-migrants exceeded out-migrants in these states. It is to be noted that both Maharashtra and Gujarat are the prosperous regions of the country and these states are the high income per capita states.
Figure 4: Share of states where in-migration exceeds out-migration
Source: Computed from Census of India, Various Years
0.00
20.00
40.00
60.00
80.00
100.00
1971 1981 1991 2001
Share of top states
Uttar Pradesh Bihar Kerala Rajasthan Andhra Pradesh Others
0.00
20.00
40.00
60.00
80.00
100.00
1971 1981 1991 2001
Share of top states
Maharashtra West Bengal Madhya Pradesh Haryana Gujarat Punjab Others

13
5 Inter-state migration and economic and demographic profile of states
Having observed the broad pattern of inter-state migration since 1971, it is important to examine the economic and demographic profile of these states in order to explore whether migration is affected by economic performance and demographic composition of the states. We consider four variables namely, Per Capita State Domestic Product (NSDP pc) reflecting economic prosperity, Total Fertility Rate (TFR)12, Dependency Ratio (DR)13 and Urbanization.
From Figure 5 we observe that while Punjab, Haryana, Gujarat and Maharashtra are the prosperous states, Bihar, Madhya Pradesh, Uttar Pradesh and Rajasthan have lower per capita NSDP. This clearly shows that migration within India is from the poorer regions to the richer regions of the country.
Figure 5: State-wise NSDP per capita
Source: Data from EPWRF
We now observe total fertility rate and dependency ratio. From Figure 6 it is clear that while TFR has come down for all the states from 1971 to 2001, the states having a higher share of out-migrants are the ones whose TFR is much higher than the replacement level. While Kerala, Andhra Pradesh, Maharashtra and Gujarat have attained the replacement level of 2.1, the high TFR in Uttar Pradesh, Rajasthan, Madhya Pradesh and Bihar continue to pull up the all-India average figure.
12 TFR refers to total number of children born or likely to be born to a woman in her life time if she were subject to the prevailing rate of age-specific fertility in the population. TFR of about 2.1 children per woman is called Replacement-level fertility. (World Health Organization) 13 DR relates the number of children (0-14 years old) and older persons (65 years or over) to the working-age population (15-64 years old). (United Nations)
0
10000
20000
30000
40000 NSDP per capita (in Rs lakhs)
1971-72 1981-1982 1991-1992 2001-2002

14
Figure 6: State-wise Total Fertility Rate
Source: Census of India, Various Years
Higher fertility (as seen from TFR) combined with a higher dependency ratio can further exacerbate the situation as the pressure on the working population to meet the requirements of the dependent population can induce outward migration from the state in absence of inadequate economic opportunities in the home state. It is evident from Figure 7 that dependency ratio continues to be high for the poorer states (which are also the states with a higher share of out-migrants and higher TFR). Dependency ratio has been more than 85 per cent for Bihar, Rajasthan and Uttar Pradesh even in 2011 when the average for all-India has come down to 73.4. On the contrary, for most of the prosperous states, the ratio has come down to around 65 per cent in 2011 from as high as around 90 per cent in 1971.
Figure 7: State-wise Dependency Ratio
Source: Census of India, Various Years
We now examine the share of urban population in the total population of the states. Growing urbanization is a pull factor for migration as people are attracted to bigger cities in search of either better education and/or employment opportunities. Since 1971, urbanization has been increasing in India, however, it has been spatially unequal. It is evident that the states that have a higher share of out-migrants have lower urban population (Figure 8). It is also interesting to note that out-migration from the relatively prosperous states of Kerala and Andhra Pradesh could be on account
0123456
Total Fertility Ratio
1991 2001
050
100150200250300350400
Dependency Ratio
1971 1981 1991 2001

15
of the low level of urbanization in these states. Additionally, a state like Haryana that has high TFR as well as high dependency ratio attracts more in-migrants from the country probably on account of the fast increasing pace of urbanization in the state over the years.
Figure 8: State-wise urbanization to total population (%)
0 10 20 30 40
Bihar
Uttar Pradesh
Kerala
Madhya Pradesh
Rajasthan
Haryana
Andhra Pradesh
All India
Punjab
West Bengal
Gujrat
Maharashtra
Urbanization (%) - 1971
0 10 20 30 40
Bihar
Uttar Pradesh
Kerala
Madhya Pradesh
Rajasthan
Haryana
Andhra Pradesh
All India
West Bengal
Punjab
Gujrat
Maharashtra
Urbanization (%) - 1981

16
Figure 8: State-wise urbanization to total population (%) (continued)
Source: Census of India, Various Years
From the above analysis, we observe that a combination of push and pull factors on account of the varying (and evolving) demographic and economic profile of the states are influencing the pattern of in-migration and out-migration in Indian states. Use of the dated 1971 population thus fails to account for this dynamism in inter-state migration that is influenced by the changing demographic profile of the states. However, as mentioned earlier, the Fourteenth Finance Commission (which was constituted in 2014 to give recommendations on devolution of resources to states for the five-year period 2015-16 to 2019-20) recognised the need to consider the demographic changes across states since 1971, the obvious ones being the change in the composition of population and also migration, while deciding on the devolution of funds to states.
0 10 20 30 40 50
Bihar
Uttar Pradesh
Rajasthan
Madhya Pradesh
Haryana
All India
Kerala
Andhra Pradesh
West Bengal
Punjab
Gujrat
Maharashtra
Urbanization (%) - 1991
0 10 20 30 40 50
Bihar
Uttar Pradesh
Rajasthan
Kerala
Madhya Pradesh
Andhra Pradesh
West Bengal
All India
Haryana
Punjab
Gujrat
Maharashtra
Urbanization (%) - 2001
17
As a result, the Commission assigned a 10 per cent weight to the 2011 population that would capture the demographic changes since 1971, both in terms of migration and age structure.
6 Inter-state migration and fiscal profile of states
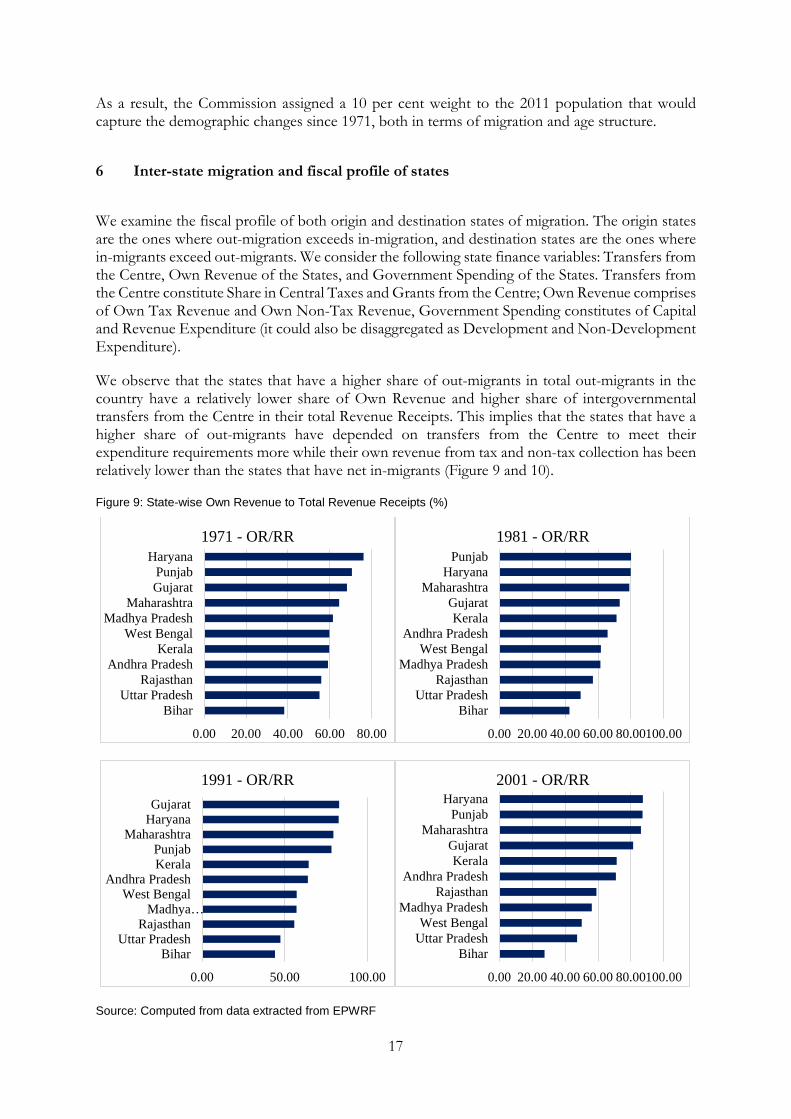
We examine the fiscal profile of both origin and destination states of migration. The origin states are the ones where out-migration exceeds in-migration, and destination states are the ones where in-migrants exceed out-migrants. We consider the following state finance variables: Transfers from the Centre, Own Revenue of the States, and Government Spending of the States. Transfers from the Centre constitute Share in Central Taxes and Grants from the Centre; Own Revenue comprises of Own Tax Revenue and Own Non-Tax Revenue, Government Spending constitutes of Capital and Revenue Expenditure (it could also be disaggregated as Development and Non-Development Expenditure).
We observe that the states that have a higher share of out-migrants in total out-migrants in the country have a relatively lower share of Own Revenue and higher share of intergovernmental transfers from the Centre in their total Revenue Receipts. This implies that the states that have a higher share of out-migrants have depended on transfers from the Centre to meet their expenditure requirements more while their own revenue from tax and non-tax collection has been relatively lower than the states that have net in-migrants (Figure 9 and 10).
Figure 9: State-wise Own Revenue to Total Revenue Receipts (%)
Source: Computed from data extracted from EPWRF
0.00 20.00 40.00 60.00 80.00
BiharUttar Pradesh
RajasthanAndhra Pradesh
KeralaWest Bengal
Madhya PradeshMaharashtra
GujaratPunjab
Haryana1971 - OR/RR
0.00 20.00 40.00 60.00 80.00100.00
BiharUttar Pradesh
RajasthanMadhya Pradesh
West BengalAndhra Pradesh
KeralaGujarat
MaharashtraHaryana
Punjab1981 - OR/RR
0.00 50.00 100.00
BiharUttar Pradesh
RajasthanMadhya…
West BengalAndhra Pradesh
KeralaPunjab
MaharashtraHaryanaGujarat
1991 - OR/RR
0.00 20.00 40.00 60.00 80.00100.00
BiharUttar PradeshWest Bengal
Madhya PradeshRajasthan
Andhra PradeshKerala
GujaratMaharashtra
PunjabHaryana
2001 - OR/RR

18
Figure 10: State-wise Intergovernmental Transfers to Total Revenue Receipts (%)
Source: Computed from data extracted from EPWRF
Government Expenditure as a percentage of GSDP has increased for all the states from 1971 to 2001 but we observe that over time, there is no marked difference between the government spending across the out-migrant and in-migrant states (Refer Figure 11). While government expenditure (as a percentage of NSDP) doesn’t vary across the states, it is interesting to note the difference in the financing pattern of the government expenditure. As was mentioned earlier, the poorer states that have a relatively higher share of out-migrants have received more transfers from the Centre. So it could be argued that while the financing of government expenditure has been from the share of central transfers for the poorer states (that have received a relatively higher share of transfers), the richer states that have more in-migrants have higher own revenues to finance the growing government expenditure. In other words, states with higher fiscal autonomy14 also are the destination states for in-migrants.
14 According to Blöchliger & King (2006), fiscal autonomy of sub-central governments is multi-faceted and must be assessed using several indicators, including the share of tax revenue allocated to sub-central governments, the discretion over those taxes, the share of transfers allocated to sub-central governments and the percentage of earmarked transfers. We have also used a few of these indicators to assess fiscal autonomy of the states.
0.00 20.00 40.00 60.00 80.00
HaryanaPunjabGujarat
MaharashtraMadhya Pradesh
West BengalKerala
Andhra PradeshRajasthan
Uttar PradeshBihar
1971 - IGT/RR
0.00 20.00 40.00 60.00 80.00
HaryanaPunjab
MaharashtraGujaratKerala
Andhra PradeshWest Bengal
Madhya PradeshRajasthan
Uttar PradeshBihar
1981 - IGT/RR
0.00 20.00 40.00 60.00
GujaratPunjabKerala
West BengalMaharashtra
Andhra PradeshHaryana
Uttar PradeshMadhya Pradesh
RajasthanBihar
1991 - IGT/RR
0.00 20.00 40.00 60.00 80.00
HaryanaPunjab
MaharashtraGujaratKerala
Andhra PradeshRajasthan
Madhya PradeshWest Bengal
Uttar PradeshBihar
2001 - IGT/RR

19
Figure 11: State-wise Government Expenditure to NSDP (%)
Source: Computed from data extracted from EPWRF
7 Empirical estimation – panel data regression
Based on the explanatory data analysis it is evident that there is a link between fiscal profile and pattern of migration across states in India. In this section, we examine econometrically how fiscal behaviour of provinces induced migration. The econometric model is estimated using census data points for migration for 28 Indian states and for the time periods 1971, 1981, 1991 and 2001 in a panel data framework15. The share of out-migrants in the total population of the state is the dependent variable and the following are the independent and control variables in the panel:
nsdp_pc : NSDP per capita govex : Government Expenditure as a percentage of NSDP devex : Development Expenditure16 as a percentage of NSDP ownrev : Own Revenue (Own Tax + Own Nom-Tax Revenue) as a percentage of NSDP centrans : Transfers from the Centre (Share in Central Taxes + Grants from the Centre) as a
percentage of NSDP debt : Public Debt as a percentage of NSDP sdum : State dummy ydum : Year dummy
15 It is to be noted that state-reorganization has happened over the years. Sikkim was the 22nd Indian state to be formed in 1975, followed by the formation of three new states namely Arunachal Pradesh, Mizoram and Goa in 1987. Three states namely, Uttarakhand, Jharkhand and Chhattisgarh were formed in the year 2000. 16 Development Expenditure is broadly defined to include all items of expenditure that are designed directly to promote economic development and social welfare. Source: RBI https://rbi.org.in/scripts/PublicationsView.aspx?id=9492 (Accessed on 19 September, 2017)
0.00
5.00
10.00
15.00
20.00
25.00
1971 - GovEx/NSDP (%)
0.005.00
10.0015.0020.0025.0030.00
2001 - GovEx/NSDP (%)

20
The state dummy (sdum) takes value 0 if there is net in-migration in the state and 1 if there is net out-migration. The year dummy (ydum) is introduced to capture the influence of aggregate (time‐series) trends17. We estimate the following three models:
Model 1: migit = ait + b1nsdp_pcit + b2ownrevit + b3centransit + b4debtit + b5sdumit + b6ydumit +eit Model 2: migit = ait + b1nsdp_pcit + b2ownrevit + b3govexit + b4debtit + b5sdumit + b6ydumit + eit Model 3: migit = ait + b1nsdp_pcit + b2ownrevit + b3devexit + b4debtit + b5sdumit + b6ydumit + eit A priori, we expect negative signs for nsdp_pc, ownrev, govex and devex implying that higher per capita NSDP, higher states’ own revenues as a ratio of their state product, and higher government and development expenditure as a ratio of states’ domestic product be associated with lower rates of out-migration. Public debt has been used as a control variable and, a priori, a positive relation is expected implying that higher public debt is associated with higher rate of out-migration from the states. A negative sign for centrans would imply that a progressive transfer mechanism could bring down the rate of out-migration. The results for the three models are presented in Table 1 below. In Model 1, the rate of out-migration is negatively related to nsdp_pc and ownrev implying that higher per capita NSDP and higher share of own revenues in states’ domestic product have negative impact on out-migration. The negative and significant coefficients of centrans implies that for these states an increase in funds devolved from the Centre to the states would significantly reduce the rate of out-migration. While the coefficient of debt is positive and means that reducing the share of public debt in states’ NSDP can check the rate of out-migration, it is not significant. We observe that both state and year dummies are significant. The positive and significant coefficient of state dummy (sdum) implies that the rate of out-migration would be higher for states with net out-migration than the states with net in-migration.
Model 2 suggests that while states’ per capita NSDP and share of own revenues in states’ domestic product are significant and associated with a lower rate of out-migration, a higher share of government expenditure in states’ NSDP can significantly reduce the rate of out-migration. A slightly altered Model 3 suggests the same results along with the finding that a higher share of development expenditure in states’ domestic product is associated with a lower rate of out-migration from states. In fact, the larger coefficient (in absolute terms) of devex suggests that an extra unit of government expenditure if spent as development expenditure, has a larger impact on controlling rate of out-migration from states.
It is to be noted that centrans was not included in Model 2 and 3 because of high correlation between transfers from the Centre and government (and development) expenditure (correlation between centrans and, govex and devex is 0.80 and 0.78 respectively). In fact, it is interesting to note that the coefficient of govex and devex in Model 2 and 3 respectively implicitly capture the impact of funds devolved from the Centre to the states in a sense that transfers to the states are used to finance government expenditure in general, and development expenditure in particular. To sum up, a higher share of own revenues of the states and higher government expenditure (and development expenditure in particular) in their NSDP coupled with higher transfers can control the rate out-migration.
17 Three year dummies have been used (since we have data for 1971, 1981, 1991 and 2001) and collated as ydum.

21
Table 1: Regression Results18,19
Model 1 Model 2 Model 3
nsdp_pc -0.0488 ***
-0.0572 ***
-0.0544 ***
ownrev -70.9717 *
-94.8914 *
-106.9540 *
centrans -47.0780 *
govex -12.2550 **
devex -18.5732 **
debt 12.7042 30.0689 33.0049
sdum 8.1697 *
8.1522 *
7.7776 **
ydum 11.5132 **
12.5794 **
11.5579 **
Source: Own computation
To conclude, the negative and significant relation between share of transfers from the Centre in states’ NSDP and rate of out-migration corroborates with the main argument of our paper that fiscal transfer system has a key role to play in deciding the pattern of migration in Indian federal system. Despite the fact that the net out-migrant states identified in our study received a higher share of central transfers, the results suggest that a relatively more progressive transfer system has the potential of reducing pressure of out-migration. Thus, the use of 1971 population is a distortion which affected resource allocation from the Centre in such a way that contributed to out-migration from poorer regions to the richer regions of the country despite having a progressive transfer system.
However, it is also to be noted that while these transfers are much needed to stop the flow of out-migrants from relatively poorer states, these states also need to boost their own revenues in order to find a self-sustaining financing source of the growing states’ expenditure which has a negative impact on out-migration. The use of 2011 population data for the devolution of resources by the Fourteenth Finance Commission certainly is a step in the right direction. However, the degree of progressivity would depend on the overall resource envelope of the Central government irrespective of the level of need.
18 Figures in the table are the coefficients of the respective variables. *, ** and *** imply significance at 1%, 5%, and 10% respectively. 19 Model 1 is a Random Effects Panel Model, and Model 2 and 3 are Fixed Effects Panel Model. Hausman test was used to select the appropriate models.

22
References
Akerlof, G. A. (1969). ‘Centre-State Fiscal Relations in India’. Indian Economic Review, 4(2): 99-121.
Bagchi, A. (2003) (a). ‘Rethinking Federalism: Changing Power Relations between the Center and the States’. Publius: The Journal of Federalism, 33(4): 21-42.
Bagchi, A. (2003) (b). Fifty Years of Fiscal Federalism in India: An Appraisal. New Delhi, India: National Institute of Public Finance and Policy.
Bagchi, A., and P. Chakraborty (2004). ‘Towards A Rational System of Centre-State Revenue Transfers’. Economic and Political Weekly, 39(26): 2737-2747.
Barro, R. T., and X. Sala-i-Martin (1992). ‘Regional Growth and Migration: A Japan-United States Comparison’. Journal of the Japanese and International Economies, 6(4): 312-346.
Bhagat, R. B., and S. Mohanty (2009). ‘Emerging Pattern of Urbanization and the Contribution of Migration in Urban Growth in India’. Asian Population Studies, 5(1): 5-20.
Bird, R. M., and M. Smart (2002). ‘Intergovernmental Fiscal Transfers: International Lessons for Developing Countries’. World Development, 30(6): 899-912.
Blöchliger, H., and D. King (2006). ‘Fiscal Autonomy of Sub-Central Governments’. OECD Economic Studies, 2(43): 155-188
Boadway, R. W. (1992). The Constitutional Division of Powers: An Economic Perspective. Ottawa, Canada: Canada Communication Group.
Buchanan, J. M. (1950). ‘Federalism and Fiscal Equity’. The American Economic Review, 40(4): 583-599.
Cashin, P., and R. Sahay (1996). ‘Internal Migration, Center-State Grants, and Economic Growth in the States of India'. Staff Papers, 43(1): 123-171.
Chakraborty, P. (2003). ‘Unequal Fiscal Capacities across Indian States: How Corrective Is the Fiscal Transfer Mechanism’. Mimeo. New Delhi, India: National Institute of Public Finance and Policy.
Chakraborty, P. (2010). ‘Deficit Fundamentalism vs Fiscal Federalism: Implications of 13th Finance Commission's Recommendations’. Economic and Political Weekly, 48(48): 56-63.
Das, K. C., and S. Saha (2013). ‘Inter-State Migration and Regional Disparities in India’. Available at www.iussp.org/sites/default/files/event_call_for_papers/Inter-state%20migration_ IUSSP13.pdf (accessed 15 September 2017).
Government of India. (2014). Report of the Fourteenth Finance Commission. New Delhi, India: Government of India Press.
Harris, J. R., and M. P. Todaro (1970). ‘Migration, Unemployment and Development: A Two-Sector Analysis’. The American Economic Review, 60(1): 126-142.
Joe, W., P. Samaiyar, and U.S. Mishra (2009). ‘Migration and Urban Poverty in India: Some Preliminary Observations’. Working Paper 414. Trivandrum, India: Centre for Development Studies.
Kumar, S., and S. Managi (2009). ‘Compensation for Environmental Services and Intergovernmental Fiscal Transfers: The Case of India’. Ecological Economics, 68(12): 3052-3059.

23
Kurian, N. J. (2000). ‘Widening Regional Disparities in India: Some Indicators’. Economic and Political Weekly, 35(7): 538-550.
McMillan, A. (2000). ‘Delimitation, Democracy, and End of Constitutional Freeze’. Economic and Political Weekly, 35(15): 1271-1276.
McMillan, A. (2001). Constitution 91st Amendment Bill: A Constitutional Fraud? Economic and Political Weekly, 36(14/15): 1171-1174.
Mukherji, S. (2001, August). Low Quality Migration in India: The Phenomena of Distressed Migration and Acute Urban Decay. Paper presented at the 24th IUSSP Conference, Salvador, Brazil. Available at archive.iussp.org/Brazil2001/s80/S80_04_Mukherji.pdf (accessed 21 November 2017)
Oates, W. E. (1999). ‘An Essay on Fiscal Federalism’. Journal of Economic Literature, 37(3): 1120-1149.
Padamanabha, P. (1988). Census of India-1981 Series-1-India (Migration Tables). Delhi, India: Controller of Publications, Government of India.
Rangarajan, C., and D. K. Srivastava (2011). Federalism and Fiscal Transfers in India. India: Oxford University Press.
Rao, M. G. and R. J. Chelliah (1996) Fiscal Federalism in India. New Delhi, India: Indian Council of Social Science Research.
Rao, M. G., and N. Singh (2003). The Political Economy of Center-State Fiscal Transfers in India. Working Paper 107. Stanford, CA: Stanford University.
Rao, M. G., and N. Singh (2004). Asymmetric Federalism in India. Working Paper 2004/08. Santa Cruz, CA: UC Santa Cruz International Economics.
Rao, M. G., and N. Singh (2006). ‘The Political Economy of India's Fiscal Federal System and Its Reform’. Publius: The Journal of Federalism, 37(1): 26-44.
Registrar General and Census Commissioner. (2001). Census of India-2001 Series-1-India (Migration Tables). [CD-ROM].
Sekhar, A. C. (1982). Census of India-1971 Series-1-India (Migration Tables). U.T. Chandigarh, India: Controller of Publications, Government of India.
Shaw, R. P. (1986). ‘Fiscal versus Traditional Market Variables in Canadian Migration’. Journal of Political Economy, 94(3, Part 1): 648-666.
Singh, N. (2007). Fiscal Federalism and Decentralization in India. MPRA Paper 1447. Munich Personal RePEc Archive
Sinha, A. (2004). ‘The Changing Political Economy of Federalism in India: A Historical Institutionalist Approach’. India Review, 3(1): 25-63.
Sivaramakrishnan, K. C. (2000). ‘North-South Divide and Delimitation Blues’. Economic and Political Weekly, 35(35/36): 3093-3097.
Srivastava, R. (2011, December). Internal Migration in India: An Overview of its Features, Trends and Policy Challenges. In Workshop Compendium Volume II: Workshop Papers, National Workshop on Internal Migration and Human Development in India (pp 1-47). New Delhi, India: UNESCO
Srivastava, R., & S. K. Sasikumar (2003, June). An Overview of Migration in India, Its Impacts and Key Issues. Paper presented at the Regional Conference on Migration, Development and Pro-Poor Policy Choices in Asia, Dhaka, Bangladesh. Available at www.eldis.org/vfile/upload/1/ document/0903/Dhaka_CP_2.pdf (accessed 22 November 2017).

24
Tillin, L. (2006). ‘United in diversity? Asymmetry in Indian federalism’. Publius: The Journal of Federalism, 37(1): 45-67.
Todaro, M. (1980). ‘Internal Migration in Developing Countries: A Survey’. In S. H. Preston, and R. A. Easterlin, Population and Economic Change in Developing Countries. Chicago, IL: University of Chicago Press.
Todaro, M. P. (1969). ‘A Model of Labor Migration and Urban Unemployment in Less Developed Countries’. The American Economic Review, 59(1): 138-148.
Vijayanunni, M. (1998). Census of India-1991 Series-1-India (Migration Tables). Delhi, India: Controller of Publications. Government of India.
Weingast, B. R. (2009). ‘Second Generation Fiscal Federalism: The Implications of Fiscal Incentives’. Journal of Urban Economics, 65(3): 279-293.
Yadava, S. S., and K. N. Yadava (1995). ‘Migration Urbanization and Economic Development in India’. Journal of Population, 1(2): 157-73.
United Nations Development Programme. (2009). Human Development Report 2009 Overcoming Barriers: Human mobility and development. New York, NY: Palgrave Macmillan.
United Nations (2002). World Population Ageing: 1950-2050. New York, NY: Department of Economic and Social Affairs, UN.


