28
WIDER Working Paper 2019/66 Trade tax reforms and poverty in developing countries Why do some countries benefit and others lose? Amèvi Rocard Kouwoaye* September 2019

WIDER Working Paper 2019/66
Trade tax reforms and poverty in developing countries
Why do some countries benefit and others lose?
Amèvi Rocard Kouwoaye*
September 2019

*CREATE, Laval University, Quebec, Canada; corresponding author: [email protected].
This study was prepared within the UNU-WIDER project Academic Excellence.
Copyright © The Author 2019
Information and requests: [email protected]
ISSN 1798-7237 ISBN 978-92-9256-700-2
https://doi.org/10.35188/UNU-WIDER/2019/700-2
Typescript prepared by Gary Smith.
The United Nations University World Institute for Development Economics Research provides economic analysis and policy advice with the aim of promoting sustainable and equitable development. The Institute began operations in 1985 in Helsinki, Finland, as the first research and training centre of the United Nations University. Today it is a unique blend of think tank, research institute, and UN agency—providing a range of services from policy advice to governments as well as freely available original research.
The Institute is funded through income from an endowment fund with additional contributions to its work programme from Finland, Sweden, and the United Kingdom as well as earmarked contributions for specific projects from a variety of donors.
Katajanokanlaituri 6 B, 00160 Helsinki, Finland
The views expressed in this paper are those of the author(s), and do not necessarily reflect the views of the Institute or the United Nations University, nor the programme/project donors.
Abstract: This paper studies the relationship between trade tax and domestic tax reforms and poverty in developing countries, and explores whether the role of public goods provision matters in this relationship. Using a sample of 91 developing countries for the 1980–2016 period, I model the trade tax reforms–poverty nexus as heterogeneous across countries with cross-sectionally dependent errors. I find that a shift from taxes on international trade towards domestic taxes under revenue-neutrality reduces poverty in the countries that have consolidated, on average, over time their comparative advantage in agriculture, while it increases poverty in countries that moved from being net exporters to net importers of agricultural products. Public goods, however, do not play a significant role in the relationship.
Key words: common factor model, government spending, taxation and poverty, trade liberalization, trade tax and domestic tax reforms
JEL classification: H2, F13, I38, C23
Acknowledgements: I would like to thank Bruno Larue and Marilyne Huchet for insightful comments. I also thank Kyle McNabb for his insightful comments, support, and assistance in tax data collection. I am also grateful to Thomas Baunsgaard and Michael Keen for sharing their data with me. I thank the participants at the 52nd conference of the Canadian Economic Association in Montreal in June 2018 and the participants of the UNU-WIDER seminar. I acknowledge support from UNU-WIDER within the UNU-WIDER PhD Visiting Fellowship programme.

1 Introduction
In the early 1980s, many developing countries engaged in trade and tax reforms to initiate trade lib-eralization processes under the guidance of international institutions such as the World Bank, the In-ternational Monetary Fund (IMF), and the World Trade Organization (WTO). This was to allow themto be more integrated into the world trading system. This process consisted of a reduction or a cutin trade taxes considered as distortionary taxes, and their replacement with non-distortionary domestictaxes, such as value-added tax (VAT), necessary for economic growth and development. According toBaier and Bergstrand (2001), ‘Tariff reductions still explain almost three times as much trade growth astransport-cost declines’. Accordingly, a reduction in trade taxes is likely to increase the exports of de-veloping countries and contribute to poverty reduction. The neoclassical mainstream international tradetheories claim that free trade increases welfare by generating consumption and production efficiencygains. In addition, tariff reduction favours rapid economic growth. There is a consensus that openeconomies perform better than closed ones due to the exploitation of comparative advantage (Krueger1985). Nevertheless, the way the welfare gain is redistributed between people remains an importantquestion. Some people benefit while others lose out.
However, recovering revenue loss due to trade liberalization is a major concern of developing countries.Many developing countries rely heavily on trade taxes as a source of government revenue (Easterly andRebelo 1993; Greenaway and Milner 1991). According to Zee (1996), the average trade taxes as apercentage of total tax revenue of government in Africa was 36.4 per cent over the period 1974–79, 34.8per cent over 1980–84, and 32.5 per cent over 1985–89, whereas in Asia this share was, respectively,26.5 per cent, 24.8 per cent, and 23.8 per cent. This share might be high with respect to each individualcountry. For example, in the early 1990s, the share of trade taxes in total tax revenue was nearly 40 percent in Pakistan (Lahiri and Nasim 2005). According to the World Bank, import duties over governmenttotal tax revenue in 2010 in the Maldives, Ethiopia, Swaziland, and Madagascar were 70 per cent, 52per cent, 51 per cent, and 47 per cent, respectively. These tax revenues are used by the government toprovide good social amenities to its citizens, such as health care and education, good roads, and security,which benefit the poor in particular. Accordingly, decline in trade tax revenues without replacement maybe harmful for poor people.
The consequences of trade policies for government revenues have been the subject of considerable inter-est, but there are controversies about the direction of the effect—that is, whether it is revenue decreasingor increasing. Concerning developing countries, the empirical literature in general concludes that tradeliberalization may lead to revenue depletion even though the potential decrease in tariff revenue has beenreplaced by alternative sources of taxes to offset the loss in trade tax revenue. This loss of tax revenuescan worsen the budget deficit and reduce government public spending, which will accordingly reducethe provision of public goods and services. Moreover, this will generate structural macroeconomic in-stabilities that can be harmful to the economy overall.
Indeed, the structural characteristics of developing countries limit their ability to shift from trade taxesto domestic taxes, then trade liberalization reduces the trade tax ratio to GDP (Khattry and Rao 2002)and total government revenue (Devarajan et al. 1999). According to McCulloch et al. (2001), taxeson foreign trade are administratively easier to collect than taxes on domestic goods. Therefore, tradeintegration should shift from the tax revenue that is easy to collect—trade taxes—towards that whichis hard to collect—taxes on income, production and consumption (Aizenman and Jinjarak 2009). Also,the informal sector accounts for a relatively high share of economic activity, which limits the base fordomestic taxes collection.
1

Baunsgaard and Keen (2010) show that the replacement of trade taxes by other taxes (domestic taxessuch as taxes on consumption, income, and profit) does not compensate totally for the loss of trade taxrevenue. For these authors, government revenues in most developing countries depend heavily on tradetaxes. For every dollar lost due to liberalization, middle-income countries are able to recover 40–60cents through the implementation of other, internal taxes, whereas low-income countries recover at most30 cents. The loss in trade tax revenue may exert a downward pressure on some public goods provision(Khattry 2003). School access (education), for example, is a relevant determinant of the well-beingand productivity of a country. Yet education can be provided by either the private or public sector.Rich people can acquire it privately while the poor cannot; therefore, this service is a source of in-equality if it is not publicly provided. In developing countries, governments are the major stakeholdersin education and a large share of the population relies on public education. There is strong empiri-cal evidence that public education expenditure is positively associated with economic growth throughfavouring human capital accumulation (Blankenau 2005; Blankenau and Simpson 2004; Blankenau etal. 2007; Kaganovich and Zilcha 1999). Consequently, declines in public education provision may leadto an increased poverty.
The effect of the reform of trade taxes and domestic taxes on welfare has received considerable attention,but this attention is more theoretical than empirical. The theoretical predictions on the effects of tradetax and domestic tax reforms on welfare are very mixed (e.g., Emran 2005; Emran and Stiglitz 2005;Falvey 1994; Keen 2008; Keen and Ligthart 2002; Kreickemeier and Raimondos-Møller 2008). To myknowledge, very few papers have paid attention to the effect of trade tax and domestic tax reforms onpoverty directly, and particularly in relation to developing countries. While a reduction in trade taxeswith an increase in VAT has been at the centre of policies that developing countries implemented in the1980s and 1990s under the structural adjustment policies of the IMF and the World Bank, as mentionedabove, Baunsgaard and Keen (2010) show that developing countries have failed to recover the lost tradetax revenue or to increase government revenue. For instance, Anderson (1996) shows that in SouthKorea a reduction in trade taxes with a revenue-neutral increase in VAT reduces welfare. Thus, there isdoubt about welfare improvement or poverty alleviation elements of reduced trade taxes coupled withan increase in VAT.
In this paper, I investigate the heterogeneity effects of the trade tax and domestic tax reforms on povertyin developing countries, but I also explore the role of public goods in this relationship. This entailsinvestigating how a decrease in trade taxes combined with an increase in domestic taxes affects povertyin developing countries. The literature assumes homogeneity of the effect of trade taxes reforms onpoverty. The originality of this paper arises first from the adoption of recent panel time series methodsthat allow accounting for cross-section dependence and to characterize whether the effect of trade taxreforms on poverty differs substantially across countries. Second, I consider the role of public goodsand revenue-neutral reforms of trade taxes and domestic taxes in this relationship.
Using panel data for 91 developing countries over the 1980–2016 period, I at first find that a reduction oftrade taxes on average increases poverty significantly, but that this effect varies widely across countries.Second, I show that a reduction in trade taxes combined with an increase in domestic taxes under revenueneutrality increases poverty on average, with considerable cross-countries heterogeneity in parameters.Countries that benefit in terms of poverty reduction are those that have consolidated their comparativeadvantage in agriculture as their trade balances of agricultural products increase while countries thatlose out are those that have moved from net exporters to net importers of agricultural products. Third,when taking into consideration the role of government public education and health expenditures, I findthat public goods do not significantly affect poverty when a country moves from trade taxes to domestictaxes under revenue neutrality.
2

The remainder of this paper is structured as follow: Section 2 presents a short theoretical review on thewelfare effects of trade tax and domestic tax reforms. Section 3 discusses the empirical strategy anddata, while Section 4 presents the empirical results. Section 5 concludes.
2 Brief synopsis of earlier theoretical work
I present a brief synopsis of the theory of tariff-tax reform effects on income distribution. Mostly, theexisting work on tariff-tax reform effects on income distribution in the literature are theoretical. Thistheoretical literature highlights that trade tax and domestic tax reforms improve welfare under somesufficient conditions, such as lower share of the informal sector in the economy, the presence of non-tradeable goods, revenue-neutral reforms, and perfect competition (e.g., Fujiwara 2013; Hatzipanayotouet al. 1994; Keen 1989; Michael et al. 1993; Naito and Abe 2008).
A reduction in trade taxes combined with an increase in domestic taxes such as VAT or tax on income hasbeen considered in the literature for improving government revenue and welfare in developing countries.The conventional advice prescribed to developing countries under the IMF and World Bank’s policy con-ditionalities consider VAT as a better and non-distortionary tax instrument to raise government revenueand to improve efficiency in resource allocation for better economic performance. Thus, a reduction intrade taxes accompanied by an increase in VAT improves welfare (e.g., Fujiwara 2013; Michael et al.1993).
Keen and Ligthart (2002), in the case of a small economy in which all goods are tradeable and underperfect competition, show that a tariff cut combined with one-to-one increase in domestic consumptiontax—leaving consumer prices unchanged—increases both welfare and government revenue. This occursbecause the tariff cut combined with a point-by-point consumption tax increase enables resources to beefficiently allocated, which in turn leads to a production efficiency that drives mostly the rise in welfare.However, in the presence of non-tradeable goods and tradeable intermediate inputs in the model, it isextremely difficult if not impossible to clearly ensure welfare improvement.
Keen and Ligthart (2005) themselves challenge this increase in welfare and public revenue by showingthat under imperfect competition a tariff reduction reduces national welfare, using a two-country andtwo-good (tradeable goods) general equilibrium model. In the model, two identical firms serve andcompete in the home market: one domestic firm and one foreign firm. The two firms face the sameconsumption tax in the home market, but the foreign firm also pays a tariff imposed by the home country.Raising the tariff increases the cost for the foreign firm (and then reduces its production and increasesthe production of the home country) while an increase in the consumption tax increases both firms’costs and reduces their outputs. Accordingly, a tariff reduction combined with one-for-one increases inconsumption tax reduces the production of the domestic firm (and therefore reduces its profits), increasesthe production of the foreign firm (and increases its profits), and raises the consumer price. Thus, thewelfare falls.
Moreover, the positive effects of the shift from trade taxes towards domestic taxes may be underminedby the presence of a higher share of the informal sector in the economy, which is not captured by theVAT net (Emran and Stiglitz 2005; Gordon and Li 2009; Keen 2008; Piggott and Whalley 2001). Infact, in developing countries, according to Schneider and Enste (2000), the average size of the informalsector is 39 per cent of GDP, ranging from 25 to 35 per cent in Colombia, Paraguay, Brazil, Chile, CostaRica, and Venezuela to 68–76 per cent in Nigeria and Egypt over the 1990–93 period. This higher shareof the informal sector shrinks the fiscal base and reduces government revenue, which is harmful in termsof reducing poverty.
3

Emran and Stiglitz (2005) establish the conditions under which a shift from trade taxes to revenue-neutralincreases in VAT is welfare-worsening in the context of developing countries, taking into account theimplications of a large informal sector in the economy. Taxes on goods, such as VAT, can only be leviedin the formal sector. Therefore, a tax on the formal sector may lower the demand for the goods producedin the formal sector and increase production in the informal sector. VAT is therefore likely to entail ashift from the formal to the informal sector and home production, providing a further distorted source ofrevenue. Consequently, welfare decreases when moving from trade taxes to domestic taxes.
Furthermore, trade tax and domestic tax reforms affect welfare through public goods provision becausethe government may use tax revenue to provide public goods. Abe (1992), using a general equilibriummodel, shows that tariff reductions can reduce welfare in a small, open economy if public goods areinitially under-produced. However, if public goods are over-supplied, tariff reductions increase welfarein this small, open economy.
Given that the share of the informal sector in the economy, public goods provision, sources of govern-ment revenue, economic policies, and institutional environment may vary across developing countries,in this paper I investigate empirically heterogeneous effects across developing countries of the trade taxand domestic tax reforms on poverty.
3 Empirical strategy and data
3.1 Empirical strategy
I examine the relationship between trade tax and domestic tax reforms and poverty by adopting a dy-namic linear model of poverty assuming heterogeneity across countries. In fact, trade tax reforms maydifferently affect countries, depending on their economic characteristics and their capacity to respondto the international competition arising from trade liberalization. The replacement of taxes on interna-tional trade by domestic taxes is the sort of institutional adjustment used for the implementation of tradeagreements. I then consider the differences in the relationship across countries, modelling the relation-ship between trade tax and domestic tax reforms on poverty as not common but heterogeneous acrosscountries, since the effects of trade tax reforms may depend on countries characteristics and concur-rent domestic policy reforms that countries implement. This is the reason that estimating the averageeffect based on a pooled sample might not result in satisfactory policy prescriptions (Santos-Paulino2012). I then depart from the conventional panel econometric models that assume homogeneous param-eters across all countries by estimating country-specific coefficients. In doing so, I am able to providepolicy recommendations to countries to take advantage of trade tax reforms leading to trade liberaliza-tion.
The starting model for the empirical analysis is based on Fischer (2001), and I adopt a specificationallowing for heterogeneous coefficients drawing on a dynamic common correlated effects estimator(Chudik and Pesaran 2015):
yit = α+β0yit−1 +β1tradetaxit +β2landit +β3capitalit +β j4X j
it +uit
uit = γ ′i ft + εit (1)
4

where yit is the poverty headcount in country i at time t, yit−1 is the lagged value of poverty, tradetax istrade tax revenue as a percentage of GDP, land is agricultural land per capita, capital is capital stock percapita, X is other control variables, ft is a vector of unobserved common factors, γi is the heterogeneousfactor loadings, and εit represents idiosyncratic errors. The heterogeneous coefficients are randomlydistributed around a common mean βMG, such that βi = βMG + vi, vi ∼ IID(0,Ωv) (Pesaran and Smith1995).
To estimate the model, I am concerned with the cross-section dependence arising from common or globalshocks, spatial or spillover effects, or unobserved common factors. The cross-section dependence mightoccur through commodity price fluctuations, trade or tax agreements (McNabb 2018), currency unions,or world economic or financial crises. To not account for cross-section dependence using conventionalpanel estimators such as fixed or random effects results econometrically in an inconsistent estimatesand misleading inference (Andrews 2005; Phillips and Sul 2003, 2007). This inconsistency in general,occurs when the unobserved factors and the included regressors or observed explanatory variables arecorrelated (Pesaran 2006).
Many econometric approaches have been developed in the literature to deal with cross-section depen-dence in panel data (e.g., Bai 2009; Chudik and Pesaran 2015; Coakley et al. 2002; Kapetanios et al.2011; Pesaran 2006; Pesaran and Tosetti 2011; Robertson and Symons 2000, 2007). For instance, Coak-ley et al. (2002: hereafter CFS) propose a principal component approach with a two-stage estimationmethod. The CFS method consists first of extracting principal components from residuals obtained fromthe first-stage regression of yit on xit for each i. Then, these principal components (one or more) are usedto augment the original regression equations to proxy possible omitted variables. However, Pesaran(2006) points out that the CFS estimator is not consistent if the unobserved factors and the includedregressors are correlated.
Pesaran’s (2006) common correlated effects estimator (henceforth CCE) accounts for unobserved factorsthrough an augmentation of the regression equation with cross-sectional averages of the dependent andindependent variables. The CCE estimator is robust to different types of cross-section dependence errors,possible unit roots in independent variables, serial correlation in errors, and slope heterogeneity (Chudiket al. 2011; Kapetanios et al. 2011; Pesaran and Tosetti 2011).1 However, Chudik and Pesaran (2015)show that the CCE approach is not valid in the case of a dynamic panel and/or in the presence ofweakly exogenous dependent variables2 because the CCE estimator is subject to a small sample bias,in particular when the time-series dimension of the panel is not sufficiently large.3 Chudik and Pesaran(2015) extend then the CCE approach to allow for a dynamic panel and/or weakly exogenous regressors.In the presence of weakly exogeneous regressors, the CCE estimator provides inconsistent estimates.As a remedy, the authors suggest including further lags of cross-section averages in addition to thecross-section averages of all variables in the model. In this paper, I use Chudik and Pesaran’s (2015)estimator to identify trade tax reform effects on poverty in a linear dynamic model because ‘many largecross country or cross regional panels tend to be subject to error cross-sectional dependence and slopeheterogeneity and are likely to contain weakly exogenous regressors’ (Chudik and Pesaran 2015: 394).
1 A series has unit roots if it is characterized as non-stationary—that is, has a variable variance and a mean that does not returnto a long-run mean over time or fluctuates around a non-constant long-run mean. In the presence of non-stationary series, theestimates from OLS and 2SLS regressions, for instance, are inaccurate or a so-called spurious regression problem (Newboldand Granger 1974).
2 The weak exogeneity is ‘the requirement for conditional estimation to be without loss of information from conditioning’(Ericsson et al. 1998).
3 The Pesaran (2006) CCE estimator assumes strict exogeneity of the observable regressors. The Chudik and Pesaran (2015)approach relaxes the assumption of strict exogeneity for the regressors and thus allows for the feedback between the dependentvariable and regressors.
5

The CCE estimator has been used in the literature to investigate the economic consequences of taxstructure or tax policies (e.g., Arachi et al. 2015; Arnold et al. 2011; McNabb 2018).
The cross-sectionally augmented estimation equation is thus:
yit = α+β0yit−1 +β1tradetaxit +β2landit +β3capitalit +β′ j4 X jit +
PT
∑l=0
δ ′ilzt−l + εit
Zt = (Y t ,Y t−1,X t) (2)
where X includes tradetax, land, capital, and X , and where zt−l is cross-sectional (CS) averages of allthe dependent and independent variables and pT is the number of lags of cross-sectional averages.
The mean group estimates βMG = E(βi) are given by
βMG =1N
N
∑i=1
βi
βi and βMG are consistently estimated with convergence rate√
N if (N,T, pT )→ ∞.
This specification allows slope coefficients to vary across countries—that is, each country has its ownset of slope coefficients both on the observed regressors and on the unobserved common factors. In fact,as countries differ in some economic, social, and political characteristics, the effect of tariffs on povertymay differ from one to another.
Chudik and Pesaran (2015)4 show that the CCE mean group estimator once augmented with sufficientnumber of lags and cross-sectional averages performs well even in the case of dynamic models withweakly exogenous regressors. To estimate the model, I follow the authors’ rule of thumb recommend-ing that p = int(T 1/3) = 3. This is equivalent to adding up to three lagged differences in my model.Moreover, I add the country-specific linear trend in each model.
3.2 Data
My sample comprises 91 developing countries (see the list of countries in Table A1 in the Appendix)spanning the period 1980–2016. The selection of countries in the sample is based on the availabilityof the relevant data, notably the availability of data on trade tax revenue. Tax data are collected fromthe Government Revenue Dataset (GRD) 2018 of ICTD/UNU-WIDER. The GRD offers a ‘significantlymore complete and accurate source of revenue data than any other single source, particularly for devel-oping countries’ (McNabb 2018). I complete some missing values in my data using the OECD RevenueStatistics and Baunsgaard and Keen (2010) datasets.
The poverty indicator used in this paper is the poverty headcount index, which is a measure of absolutepoverty. The poverty headcount index measures the proportion of the population whose consumption orincome is below a specific poverty line. I consider in this paper the US$1.90-a-day poverty line usedby the World Bank. This poverty indicator is often used in the literature (e.g., LeGoff and Singh 2014;Santos-Paulino 2017). The complete definitions of variables and data sources are presented in Table
4 Chudik and Pesaran’s (2015) model is estimated using Ditzen’s (2016) xtdcce2 command, version 1.33d, August 2018.
6

A2. The descriptive statistics of variables used in the empirical analysis are reported in Table 1. Thedescriptive statistics reveal that trade taxes account for up to 36 per cent of GDP while domestic taxesrepresent up to 35 per cent.
Table 1: Summary statisticsVariable Obs. Mean Std dev. Min. Max.
Headcount 3,302 31.37 26.487 0 96.42Trade tax (percentage of GDP) 3,096 3.434 3.412 –1.569 36.116Domestic tax (percentage of GDP) 3,059 10.958 5.655 0.06 35.351Tax revenue (percentage of GDP) 3,238 14.396 6.552 0.6 53.868Land pc 3,252 2.304 6.593 0.019 73.737Capital pc 3,204 0.451 0.538 0.003 3.384GDP pc 3,347 114.76 854.255 0 15,019.63Non-tax revenue 2,859 3.715 4.311 0 46.918Education 1,584 15.352 5.501 0.46 45.883Health 1,550 127.129 97.681 0.35 797.71Government expenditure 1,582 25.692 9.671 9.806 100Population growth 2,250 2.161 1.035 –6.185 7.918
Source: author’s compilation based on sources discussed in the text.
4 Empirical results
Before running the regressions, I carry out Pesaran’s (2004) cross-sectional dependence test on the rawvariables. The results reported in Table A3 suggest that the raw variables are subject to considerablecross-sectional dependence (the presence of common factors in each dataset). The presence of commonfactors in each dataset validates the common factor model approach.
4.1 Trade taxes effects on poverty
The results (the mean group coefficients) of the effects of trade taxes on poverty are reported in Table 2.I start the estimation using Pesaran and Smith’s (1995) mean group estimator (MG) in the first column,which ignores the presence of the cross-sectional dependence, and Pesaran’s (2006) CCE estimator inthe second column. The estimated coefficient of trade taxes is negative and equal to −0.3 for the MGestimator. However, the CD (cross-sectional dependence) statistic is statistically different from zero,indicating the presence of cross-sectional dependence, implying that my two models were mis-specified.Accordingly, my estimates may be biased due to the presence of the cross-sectional dependence. UsingChudik and Pesaran’s (2015) linear dynamic model and including additional lags of the cross-sectionalaverage in the CCE MG model (columns 3–5), the cross-sectional dependence disappears with a CDstatistic indicating that the null hypothesis of cross-sectional independence cannot be rejected for themodels with two and three lags of cross-sectional average. The coefficients of trade taxes are stillnegative, equal to −0.14 and −0.3, and significant at the 5 per cent level, respectively for models withtwo and three lags. The result for the model with one lag is not significant. The negative coefficients oftaxes on international trade reveal that an increase in trade taxes reduces poverty on average. Given thatthe dependent and independent variables are expressed in logarithm, the coefficients of the independentvariables are interpreted as elasticities. An increase of 1 per cent in taxes on international trade reducespoverty from 0.14 per cent to 0.3 per cent. My findings are consistent with the literature on tariff revenuesand poverty (e.g. Topalova 2007) stating that developing countries rely heavily on trade taxes that allowthem to finance public goods necessary for poverty alleviation.
7

Table 2: Trade taxes incidence on poverty estimationDependent variable: poverty headcount ratio (in log)
(1) (2) (3) (4) (5)MG CCEMG CCEMG with lags
CA additional lags First lag Second lag Third lagL. headcount 0.589*** 0.388*** 0.266*** –0.098 0.254**
(0.033) (0.039) (0.064) (0.388) (0.106)Trade tax –0.030* –0.026 –0.032 –0.139** –0.299**(percentage of GDP) (0.017) (0.019) (0.053) (0.063) (0.135)Domestic tax –0.052*** –0.059** –0.057 –0.053 0.056(percentage of GDP) (0.019) (0.028) (0.101) (0.092) (0.213)Capital pc 0.145 –0.075 –0.145 0.234 –1.870**
(0.126) (0.136) (0.399) (0.788) (0.800)Land pc 0.052 –0.031 –0.289 0.141 0.197
(0.139) (0.168) (0.615) (0.759) (1.046)GDP pc –0.437*** –0.691*** –0.624** –2.172 –2.070**
(0.097) (0.129) (0.297) (1.403) (1.034)Non-tax revenue –0.002 0.019 0.029 0.025 0.143
(0.009) (0.013) (0.038) (0.065) (0.105)Constant –0.723 –0.034 –12.060 –13.821 -14.504
(0.630) (1.257) (10.767) (11.663) (9.542)
RMSE 0.097 0.067 0.094 0.084 0.087CD test 9.915 1.68 4.66 0.67 1.47CD p-value 0.000 0.094 0.000 0.506 0.142Number of countries 81 81 65 63 62Observations 2,360 2,360 1,979 1,860 1,765
Notes: *** p < 0.01, ** p < 0.05, * p < 0.1. Standard errors in parentheses are constructed non-parametrically followingPesaran and Smith (1995).All the regressors are in the log. The country-specific linear trend is included in each model.CD test reports the Pesaran (2015) test for weak cross-sectional dependence; under the null hypothesis of weakcross-sectional dependence of the error term, the CD statistic is distributed ∼ N(0,1). RMSE is the root mean squared error.
Source: author’s calculations.
Nevertheless, the effects of taxes on international trade vary widely across countries. Figure 1 shows theheterogeneity effect across countries of trade tax revenue on poverty, meaning that a group of countries(36 countries) are beneficiaries, whereas other groups (24 countries) lose out.5 While most countries inmy sample benefit from an increase in trade tax revenue in terms of poverty reduction, the size of theeffect varies widely between countries. Figure 1 indicates a non-linearity in the relationship betweentrade taxes and poverty and a conclusion about the role of trade tax levels in this heterogeneity cannotbe drawn. Hence, this heterogeneity may imply that the effects of trade tax revenue are not automaticand may depend on country characteristics and some domestic complementary policies. Countries thatexperience poverty reduction associated with the increase in taxes on international trade may have a bet-ter distribution policy that benefits low-income people, or may be one of those those that take advantageof the protection by reducing the competition for their domestic market and therefore consolidate theircomparative advantage. The data show that countries that observe poverty reduction have remained,on average, net exporters of agricultural products over time, while countries in which poverty increaseshave moved from being net exporters to net importers of agricultural products (see Figure A1). For the
5 The 36 countries in which an increase in trade taxes reduce poverty are: Belize, Benin, Bhutan Cameroon, Central AfricanRepublic, Chile, Comoros, Republic of Congo, Costa Rica, Cote d’Ivoire, Dominican Republic, Egypt, El Salvador, Fiji,Ghana, Guinea, Honduras, Iran, Jordan, Kenya, Lesotho, Madagascar, Mali, Mongolia, Morocco, Namibia, Nepal, Niger,Paraguay, Sierra Leone, South Africa, Sri Lanka, Thailand, Togo, Venezuela, and Zimbabwe. The countries that lose outare: Botswana, Burkina Faso, Burundi, Cabo Verde, Colombia, Ethiopia, Guatemala, India, Malawi, Mauritius, Mozambique,Pakistan, Peru, Philippines, Rwanda, Sao Tome and Principe, Senegal, Tanzania, Tunisia, Uganda, Uruguay, Viet Nam, andZambia (some countries are dropped from the estimation due to some missing values). The coefficients of trade taxes forGambia and Malaysia are zero, meaning that trade tax effects on poverty are null in these two countries.
8
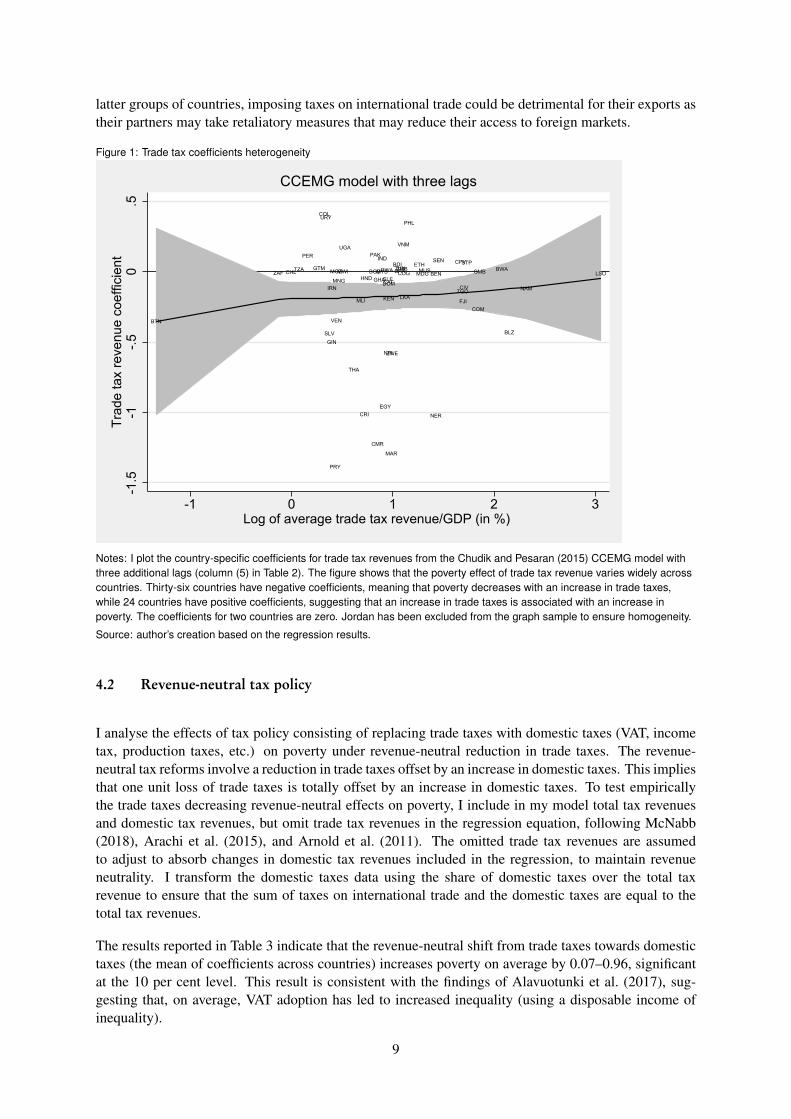
latter groups of countries, imposing taxes on international trade could be detrimental for their exports astheir partners may take retaliatory measures that may reduce their access to foreign markets.
Figure 1: Trade tax coefficients heterogeneity
BGD
BLZ
BEN
BTN
BWABFABDI CPV
CMR
CAF
CHL
COL
COM
COG
CRI
CIVDOM
EGY
SLV
ETH
FJI
GMBGHA
GTM
GIN
HND
IND
IRN
KEN
LSOMDGMWI MYS
MLI
MUS
MNG
MAR
MOZ
NAM
NPL
NER
PAK
PRY
PER
PHL
RWASTPSEN
SLEZAF
LKA
TZA
THA
TGO
TUN
UGA
URY
VEN
VNM
ZMB
ZWE
-1.5
-1-.5
0.5
Trad
e ta
x re
venu
e co
effic
ient
-1 0 1 2 3Log of average trade tax revenue/GDP (in %)
CCEMG model with three lags
Notes: I plot the country-specific coefficients for trade tax revenues from the Chudik and Pesaran (2015) CCEMG model withthree additional lags (column (5) in Table 2). The figure shows that the poverty effect of trade tax revenue varies widely acrosscountries. Thirty-six countries have negative coefficients, meaning that poverty decreases with an increase in trade taxes,while 24 countries have positive coefficients, suggesting that an increase in trade taxes is associated with an increase inpoverty. The coefficients for two countries are zero. Jordan has been excluded from the graph sample to ensure homogeneity.
Source: author’s creation based on the regression results.
4.2 Revenue-neutral tax policy
I analyse the effects of tax policy consisting of replacing trade taxes with domestic taxes (VAT, incometax, production taxes, etc.) on poverty under revenue-neutral reduction in trade taxes. The revenue-neutral tax reforms involve a reduction in trade taxes offset by an increase in domestic taxes. This impliesthat one unit loss of trade taxes is totally offset by an increase in domestic taxes. To test empiricallythe trade taxes decreasing revenue-neutral effects on poverty, I include in my model total tax revenuesand domestic tax revenues, but omit trade tax revenues in the regression equation, following McNabb(2018), Arachi et al. (2015), and Arnold et al. (2011). The omitted trade tax revenues are assumedto adjust to absorb changes in domestic tax revenues included in the regression, to maintain revenueneutrality. I transform the domestic taxes data using the share of domestic taxes over the total taxrevenue to ensure that the sum of taxes on international trade and the domestic taxes are equal to thetotal tax revenues.
The results reported in Table 3 indicate that the revenue-neutral shift from trade taxes towards domestictaxes (the mean of coefficients across countries) increases poverty on average by 0.07–0.96, significantat the 10 per cent level. This result is consistent with the findings of Alavuotunki et al. (2017), sug-gesting that, on average, VAT adoption has led to increased inequality (using a disposable income ofinequality).
9

Table 3: Effects of domestic taxes on poverty under revenue neutralityDependent variable: poverty headcount ratio (in log)
(1) (2) (3) (4) (5)MG CCEMG CCEMG with lags
CA additional lags First lag Second lag Third lag
L. Headcount 0.589*** 0.429*** 0.308*** 0.321*** 0.338***(0.034) (0.042) (0.054) (0.073) (0.121)
Domestic tax 0.036 0.071* 0.261 0.439 0.762(percentage of total tax) (0.045) (0.036) (0.276) (0.304) (0.904)Tax revenue –0.037 –0.057 –0.362** –0.412** –0.496***(percentage of GDP) (0.036) (0.036) (0.149) (0.197) (0.163)Capital pc 0.142 –0.037 1.003 –0.067 –1.806**
(0.134) (0.155) (0.613) (0.948) (0.754)Land pc 0.038 0.165 0.119 –0.309 1.029
(0.137) (0.146) (0.433) (0.845) (0.985)GDP pc –0.461*** –0.614*** –0.644** –1.742* –0.826
(0.095) (0.118) (0.325) (0.964) (0.740)Non-tax revenue 0.002 0.012 –0.002 –0.074 –0.062
(0.008) (0.014) (0.044) (0.094) (0.073)Constant –1.406* 1.375 –1.727 –0.642 –7.209
(0.760) (2.003) (4.448) (2.223) (7.889)
RMSE 0.096 0.067 0.091 0.092 0.094CD test 9.438 2.07 4.59 0.30 1.06CD p-value 0.000 0.038 0.000 0.761 0.290Number of countries 82 82 65 63 62Observations 2,377 2,377 1,979 1,860 1,765
Notes: *** p < 0.01, ** p < 0.05, * p < 0.1. Standard errors in parentheses are constructed non-parametrically followingPesaran and Smith (1995).All the regressors are in the log. The country-specific linear trend is included in each model.CD test reports the Pesaran (2015) test for weak cross-sectional dependence; under the null hypothesis of weakcross-sectional dependence of the error term, the CD statistic is distributed ∼ N(0,1). RMSE is the root mean squared error.
Source: author’s calculations.
However, the revenue-neutrality effects of domestic taxes on poverty are very heterogeneous when ex-amining the effects individually across countries (see Figure 2). I highlight that a shift from trade taxestowards domestic taxes is associated with poverty reduction in a group of countries (25 countries) whilepoverty increases in another group of countries (33 countries).6 Figure 2 reveals that the nexus betweenthe impact of the shift from taxes on international trade towards domestic taxes and the trade taxes-to-GDP ratio is not linear; accordingly, I can’t explain the heterogeneity across countries by the level ofdomestic taxes. I then document the factors that can drive this heterogeneity and point out the role ofcomparative advantage in agricultural products export. Moreover, Figure 2 shows that most countriesthat benefit from an increase in trade taxes are those that lost out from the shift from trade taxes towardsdomestic taxes under revenue neutrality; inversely, most of those that lost out from an increase in tradetaxes benefit from an increase in domestic taxes under revenue neutrality.
The data (see Figure A2) show that countries that experienced poverty alleviation have consolidatedtheir comparative advantage in agriculture as their agricultural trade balances have increased on average
6 The 25 countries that reduce poverty by liberalization trade are: Bangladesh, Botswana, Burkina Faso, Burundi, Cabo Verde,Central African Republic, Costa Rica, Dominican Republic, El Salvador, India, Kenya, Lesotho, Malawi, Mongolia, Morocco,Namibia, Peru, Rwanda, Senegal, Sierra Leone, South Africa, Thailand, Tunisia, Uganda, and Uruguay. The 33 countries inwhich trade liberalization is harmful for poverty are: Belize, Benin, Bhutan, Cameroon, Chile, Colombia, Comoros, Republicof Congo, Cote d’Ivoire, Egypt, Ethiopia, Fiji, Ghana, Guatemala, Guinea, Iran, Jordan, Madagascar, Mali, Mauritius, Mozam-bique, Nepal, Niger, Pakistan, Paraguay, Philippines, Sao Tome and Principe, Sri Lanka, Tanzania, Togo, Venezuela, Zambia,and Zimbabwe. Furthermore, the effects of the shift from trade taxes towards domestic taxes under revenue neutrality is nullin Gambia, Honduras, Malaysia, and Viet Nam.
10

over time (overall agricultural trade surpluses have increases). The increase of their exports results frombetter terms of trade or an increase in the price of agricultural products due to the Stolper–Samuelsontheorem. Also, a reduction in trade barriers (for example, within the WTO framework consisting ofmultilateral reduction in trade barriers under the Doha Round, regional trade agreements, etc.) ledthem to have greater access to the market and to grow their exports through reducing the fixed costof trade (e.g. Chaney 2008; Dutt et al. 2013). For instance, Uruguay’s accession to Mercosur in 1991has boosted its export of beef and the country has been able to export to more distant markets such asJapan. McCaig (2011), analysing the effect of US–Viet Nam bilateral trade agreements on poverty inVietnamese provinces and US market access shows that provinces that were more exposed to the UStariff cuts (greater access to the US market) experienced more rapid decreases in poverty. Likewise,Porto (2003) obtains similar results in Argentina’s case by revealing that domestic tariff reduction andbetter access to foreign markets has decreased poverty. As agriculture is the main source of employmentand income in most developing countries, growth in the export of agricultural products is likely to raiseemployment and income for rural or poor people and therefore to reduce poverty. My findings arealso in line with those of Christiaensen et al. (2011), who find that increases in agricultural GDP percapita are five times more powerful in reducing poverty than a similar increase in GDP per capita innon-agricultural sectors.
In contrast, the countries in which poverty increases have moved from being net exporters of agriculturalproducts to net importers over time: their agricultural trade balances declined and their agriculturaltrade deficit has increased after 2010. This could be associated with the fact that trade liberalizationhas exposed them to international competition, leading to the disappearance of their producers and anincrease in domestic taxes doesn’t offset the loss due to the production decline. As a large share of thepopulations in developing countries live in rural areas and depend on agriculture, a decline in agriculturalexports reduces their incomes and raises unemployment, with the according poverty increases. As mostcountries that benefit from an increase in trade taxes are those that lost out due to a shift from trade taxestowards domestic taxes under revenue neutrality, it seems that their firms, especially in the agriculturalsector, are less competitive and the protection should be profitable to them in order to maximize domesticwelfare over time (Melitz 2005).
Furthermore, my results show that the revenue-neutral shift from trade taxes towards domestic taxesaffects poverty through total tax revenue. An increase of 1 per cent in total tax revenue due to anincrease in domestic taxes reduces poverty from 0.36 per cent to 0.5 per cent. My results are in linewith those of Fujiwara (2013), Keen and Ligthart (2002), Hatzipanayotou et al. (1994), and Michaelet al. (1993), who show that a reduction in trade taxes with revenue-neutral increases in indirect taxes(e.g. VAT) increases welfare. There is also a dispersion of total tax revenues effects on poverty acrosscountries.
4.3 Robustness checks
Due to the relevance of China in the world economy, particularly in world trade, it is possible that Chinadrives my results, which could cast doubt on them. Moreover, in my sample, Lesotho has the highestshare of trade tax over GDP and can potentially also drive my results as an outlier. Hence, I test therobustness of my results by excluding both China and Lesotho from the sample. The results reportedin Tables A4 and A5 reveal that my results are not affected by China and Lesotho and accordingly areconsistent.
11

Figure 2: Domestic tax revenue coefficients heterogeneity
BGDBLZ BEN
BTN
BWA BFA BDICPV
CMR
CAF
CHL
COL
COM COG
CRI
CIV
DOM
EGY
SLV
ETH
FJI
GMBGHA
GTMGIN HND IND
IRN
KENLSO MDG MWIMYSMLIMUS
MNG
MAR
MOZNAM
NPL
NER PAK
PRY
PERPHLRWASTP SENSLE ZAFLKA TZA
THA
TGOTUN
UGA
URY
VENVNMZMB
ZWE
-20
-10
010
Dom
estic
tax
reve
nue
coef
ficie
nt
3.6 3.8 4 4.2 4.4 4.6Log of average domestic tax revenue/Total tax revenue (in %)
CCEMG model with three lags
Notes: I plot the country-specific coefficients for domestic tax revenue from the Chudik and Pesaran (2015) CCEMG modelwith three additional lags (column (3) in Table 3). The figure shows that the poverty effects of domestic tax revenue vary widelyacross countries. Twenty-five countries have negative coefficients while 33 countries have positive coefficients. Thecoefficients for four countries are equal to zero. Jordan has been excluded from the graph sample to ensure homogeneity.
Source: author’s creation based on the regression results.
4.4 The role of public goods
I am interested in the role of public goods in the relationship between a shift from trade taxes towardsdomestic taxes under revenue neutrality. Public goods such as public education and public health playan important role in poverty reduction in developing countries. In most developing countries there areregionally significant imbalances in education and health. For instance, rich people can afford privateeducation and health care while poor people rely more on public education and health care. Poor peoplehave worse health status on average than others, and public health spending tends to matter more to thepoor (Bidani and Ravallion 1997). Heltberg et al. (2001) find in Mozambique that public expenditureson health and education are likely to have significant poverty-reducing effects.
Most empirical works highlight the negative association between domestic taxation (income tax, VAT,etc.) and human capital (Lin 1998; Lucas 1990; Trostel 1993). A shift from taxes on international tradetowards domestic taxes may adversely affect poor people’s human capital accumulation and hence theirincome if there is no safety net to help them profit from public education. Tax revenues may reducepoverty if they are redistributed to benefit people with low earnings. Governments, in order to achievepoverty reduction or to reduce income inequality, might combine taxes and public spending to provideeasy access to public goods for poor people. Thus, the government redistributes tax revenues frompeople who are better off to those who are worse off. Hence, I investigate the role of public goodsprovision in the relationship between the shift from trade taxes towards domestic taxes under revenueneutrality.
12

I consider two kinds of public goods. First, government spending on education is used to proxy publicgoods. It consists of pointing out that government uses total tax revenue to finance public education.In doing so, government favours poor people having access to formal education and consequently ac-cumulation of human capital. There is evidence that countries with higher education expenditures havegreater economic performance. The endogenous growth theory provides a link between public educationexpenditures and long-term economic growth. This theory concludes that public education expenditurespromote human capital accumulation and therefore foster economic growth. Consequently, growth andhuman capital accumulation may reduce poverty.
Second, I use public health expenditures as an alternative proxy for public goods to assess the robustnessof my results using public education expenditures.
For the empirical estimation considering the role of public goods, I am constrained by the data avail-ability. I use data on public education and health expenditures from the IMF. These data are availablefor the 1985–2009 period for a sample of 90 countries. Due to the short temporal dimension of my data(25 years), I am unable to use Chudik and Pesaran’s (2015) estimator, which requires a longer temporaldimension. Accordingly, I carry out my estimation using, first, a two-way fixed effects estimator (2FE),second, the Blundell and Bond (1998) system-GMM estimator, and finally, the Pesaran and Smith (1995)MG estimator and Pesaran (2006) CCE MG estimator.
The role of public education and health expenditures is assessed by interacting the government publiceducation and health expenditures with trade tax revenue. The results for all the estimators reported inTables 4 and 5 indicate that the mean of the coefficient is not significant for both public education andhealth expenditures interaction terms with total tax revenues. The results hold when controlling for thegovernment total expenditures and population growth. My results are consistent with the non-significanteffect of public social spending (public education and public health spending) found by Castro-Lealet al. (1999). Examining the effect of public education and health spending on poverty in a group ofAfrican countries, Castro-Leal et al. (1999) show that these programmes favour not the poor, but thosewho are better-off.
The absence of the significant effects suggests that they may depend on country characteristics, comple-mentary policies such as labour market or employment policies, the pattern of education output, or thestructure of labour demand. For instance, a country may invest heavily in public education, but if theunemployment rate is high and individuals cannot find a job after graduation, the poverty level may notbe affected. In contrast, a country with a low unemployment rate, by investing more in education, canabsorb the new graduates and accordingly may reduce poverty. Furthermore, a country may benefit morefrom public education expenditures if the type of education financed suits well the patterns of demandin the labour market. For instance, Jung and Thorbecke (2003) show that in Tanzania, to maximize thebenefits from education expenditure, complementary factors are needed such as a high level of physicalinvestment, measures that improve the match between the pattern of educational output and the structureof effective demand for labour.
My results may suggest that, to clearly identify the role of public goods in the process of trade liberal-ization, I should consider the role of the labour market and country socioeconomic characteristics thatcan play a key role in the poverty–tax reforms nexus.
13

Table 4: The role of the public education expenditure in the trade tax reforms–poverty nexusDependent variable: poverty headcount ratio (in log)
(1) (2) (3) (4) (5) (6) (7) (8)2FE GMM MG CCEMG
L. Headcount (log) 0.860*** 0.860*** 1.027*** 0.928*** 0.377*** 0.203*** 0.323*** 0.154(0.0466) (0.0465) (0.0888) (0.124) (0.048) (0.057) (0.086) (0.117)
Tax revenue (log) –0.0952** –0.122** 0.146 –0.0396 –0.697 –0.155 –0.228 –0.043(0.0438) (0.0506) (0.204) (0.187) (0.705) (0.774) (0.416) (0.170)
Domestic tax (log) 0.0205 0.0234 –0.0428 –0.0192 –0.002 –0.143* 0.140* 0.059(percentage of total tax) (0.0318) (0.0307) (0.0503) (0.0752) (0.064) (0.078) (0.080) (0.130)Education (log) –0.0311 –0.0236 0.171 –0.0532 –0.561 –0.060 –0.124 0.046(percentage of total expenditure) (0.0469) (0.0511) (0.187) (0.167) (0.692) (0.793) (0.311) (0.192)Education * Tax revenue 0.0245 0.0286 –0.0564 0.0142 0.231 0.072 0.025 –0.011
(0.0216) (0.0217) (0.0655) (0.0572) (0.253) (0.283) (0.132) (0.079)Land pc (log) 0.0857 0.0871 –0.169 –0.243 –0.219 –0.612** 0.120 –0.363**
(0.102) (0.102) (0.198) (0.505) (0.224) (0.277) (0.205) (0.153)Capital pc (log) 0.0616 0.0592 –0.314 –0.0749 0.127 0.108 –0.104 –0.059
(0.0413) (0.0418) (0.438) (0.297) (0.233) (0.274) (0.206) (0.075)GDP pc (log) –0.240*** –0.234*** 0.100 –0.245 –0.607*** –0.724*** –0.397*** 0.205
(0.0725) (0.0727) (0.378) (0.267) (0.124) (0.189) (0.152) (0.299)Government expenditure 0.00184 7.90e–05 –0.003 0.010**(percentage of GDP) (0.00157) (0.00231) (0.002) (0.005)Population growth 0.00685 –0.0133 –0.090 –0.071
(0.00896) (0.0340) (0.062) (0.064)Constant –0.776** –0.803** –0.235 –1.119 2.871 1.135 0.625 –0.826
(0.319) (0.327) (1.676) (1.612) (2.869) (2.947) (2.727) (3.875)
Time FE Yes Yes Yes Yes Yes Yes Yes YesRMSE 0.0693 0.0546 0.0252 0.00458CD test 5.55 2.83 3.47 –1.617CD p-value 0.000 0.005 0.001 0.106Number of countries 83 83 83 83 70 68 70 68Observations 1,462 1,462 1,462 1,462 1,371 1,348 1,371 1,348
Notes: Robust standard errors in parentheses: *** p < 0.01, ** p < 0.05, * p < 0.1.CD test reports the Pesaran (2015) test for weak cross-sectional dependence; under the null hypothesis of weakcross-sectional dependence of the error term, the CD statistic is distributed ∼ N(0,1). RMSE is the root mean squared error.
Source: author’s calculations.
14

Table 5: The role of public health spending in the trade tax reforms–poverty nexusDependent variable: poverty headcount ratio (in log)
(1) (2) (3) (4) (5) (6) (7)2FE GMM MG CCEMG
L. Headcount (log) 0.901*** 0.900*** 1.024*** 1.043*** 0.381*** 0.359*** 0.197**(0.0236) (0.0235) (0.0868) (0.0823) (0.054) (0.070) (0.082)
Tax revenue (log) –0.0200 –0.0220 0.0508 0.0479 –0.221 0.218 0.038(0.0157) (0.0155) (0.0602) (0.0749) (0.245) (0.406) (0.107)
Domestic tax (log) 0.0307 0.0317 –0.0377 –0.0230 0.005 0.077 –0.041(percentage of total tax) (0.0259) (0.0261) (0.0581) (0.0568) (0.083) (0.081) (0.094)Health 0.0322 0.0364 –0.0182 0.0409 –0.210 0.302 0.065
(0.0254) (0.0259) (0.0481) (0.0698) (0.358) (0.604) (0.055)Health * Tax revenue –0.00406 –0.00466 –0.00233 –0.0195 0.041 –0.104 –0.020
(0.0124) (0.0123) (0.0263) (0.0309) (0.150) (0.226) (0.046)Land pc (log) –0.0235 –0.0160 –0.000913 0.0181 –0.129 –0.193 0.071
(0.0563) (0.0555) (0.0390) (0.0783) (0.241) (0.320) (0.109)Capital pc (log) 0.0516 0.0548 0.0311 0.000189 0.246 0.263 –0.078
(0.0350) (0.0353) (0.154) (0.143) (0.306) (0.327) (0.055)GDP pc (log) –0.188*** –0.194*** 0.00388 –0.00375 –0.654*** –0.755*** –0.359***
(0.0534) (0.0551) (0.0597) (0.115) (0.159) (0.268) (0.129)Government expenditure 0.000699 0.000820 –0.003*
(0.000711) (0.00181) (0.002)Population growth –0.00212 0.00230 –0.066
(0.00505) (0.0298) (0.097)Constant –0.844*** –0.885*** –0.0103 –0.254 –0.554 0.186 –0.585
(0.268) (0.277) (0.384) (0.826) (2.048) (2.718) (2.202)
Time FE Yes Yes Yes Yes Yes Yes YesRMSE 0.0564 0.0471 0.0173CD test 5.31 4.44 –0.88CD p-value 0.000 0.000 0.378Number of countries 85 85 85 85 81 68 81Observations 1,443 1,441 1,443 1,441 1,417 1,266 1,417
Notes: Robust standard errors in parentheses: *** p < 0.01, ** p < 0.05, * p < 0.1.CD test reports the Pesaran (2015) test for weak cross-sectional dependence; under the null hypothesis of weakcross-sectional dependence of the error term, the CD statistic is distributed ∼ N(0,1). RMSE is the root mean squared error.Due to missing values in public health spending data, I am unable to implement the Chudik and Pesaran (2015) estimator.
Source: author’s calculations.
15

5 Conclusion
The replacement of taxes on international trade with domestic taxes after trade liberalization policiesadopted by developing countries in the 1980s to finance anti-poverty policies necessary to achievethe Millennium Development Goals (MDGs) has been a concern for developing countries these pastdecades. Trade liberalization is one of these strategies through which poverty could be reduced. Devel-oping countries rely heavily on taxes on international trade that they use for social spending or for publicgoods financing. Then, switching from taxes on international trade to local taxes may have poverty andinequality implications because this change affects social spending or public goods provision. In this pa-per, I investigate the effects of reductions in taxes on international trade revenues on poverty in develop-ing countries and the role that public goods can play in this relationship. I adopt empirical specificationsthat allow for heterogeneity across countries.
I first find evidence that taxes on international trade are negatively associated with poverty, implying thatan increase in taxes on international trade reduces poverty on average in developing countries. However,the effect is heterogeneous across countries, indicating that poverty decreases in one group of countrieswhile it increases in another group. Categorizing the two groups of countries (countries in which povertydecreases relatively to those in which poverty increases), I find that countries that benefit from the taxeson international trade are, on average, over time net exporters of agricultural products, while those thatlose out have shifted from being net exporters of agricultural products to net importers. Second, I showthat a shift from taxes on international trade to domestic taxes under revenue-neutrality increases povertyon average. The effects also vary largely across countries; some countries benefit while others lose out.The group of countries that benefit in terms of poverty reduction are those that have consolidated theircomparative advantage in agriculture as agricultural trade balances increase on average over time. Incontrast, countries that lose out have moved from being net exporters to net importers of agriculturalproducts on average over time. My results also suggest that the shift from taxes on international tradetowards domestic taxes significantly reduces poverty through the total tax revenue on average, but theeffect is heterogeneous across countries. Finally, I show that public education and health expendituresdo not play a significant role in the relationship between trade tax reforms and poverty under revenue-neutrality.
My results suggest that for developing countries to benefit from tariff liberalization they must imple-ment policies that promote the agricultural sector as well as agricultural export-led policies. In fact,agricultural employment and agricultural share in GDP is higher in developing countries. Also, as it isclearly identified that the poor pay more tax relative to their incomes, my results suggest that develop-ing countries might implement revenue redistribution policies that favour poor people—that is, allowthem to benefit more from redistributive policies. Further research in this area would consider the roleof income redistribution channels in the relationship between a shift from taxes on international tradetowards domestic taxes on poverty to clearly identify the relationship. Moreover, the role of labourmarket characteristics and the composition of the government’s public education expenditures should beexplored to clearly investigate the role of public goods provision in the relationship between trade taxreforms and poverty in developing countries.
16

References
Abe, K. (1992). ‘Tariff Reform in a Small Open Economy with Public Production’. InternationalEconomic Review, 33: 209–22.
Aizenman, J. and Y. Jinjarak (2009). ‘Globalisation and Developing Countries: A Shrinking Tax Base?’Journal of Development Studies, 45(5): 653–71.
Alavuotunki, K., M. Haapanen, and J. Pirttilä (2017). ‘The Consequences of the Value-Added Tax onInequality’. CESifo Working Paper 6318. CESinfo: Munich.
Anderson, J. (1996). ‘Trade Reform with a Government Budget Constraint’. Working Paper 5827.Cambridge, MA: National Bureau of Economic Research, Inc.
Andrews, D.W. (2005). ‘Cross-Section Regression with Common Shocks’. Econometrica, 73(5): 1551–85.
Arachi, G., V. Bucci, and A. Casarico (2015). ‘Tax Structure and Macroeconomic Performance’. Inter-national Tax and Public Finance, 22(4): 635–62.
Arnold, J.M., B. Brys, C. Heady, A.A. Johansson, C. Schwellnus, and L. Vartia (2011). ‘Tax Policy forEconomic Recovery and Growth’. The Economic Journal, 121(550). F59–F80.
Bai, J. (2009). ‘Panel Data Models with Interactive Fixed Effects’. Econometrica, 77(4): 1229–79.
Baier, S.L., and J.H. Bergstrand (2001). ‘The Growth of World Trade: Tariffs, Transport Costs, andIncome Similarity’. Journal of International Economics, 53(1): 1–27.
Baunsgaard, T., and M. Keen (2010). ‘Tax Revenue and (or?) Trade Liberalization’. Journal of PublicEconomics, 94(9): 563–77.
Bidani, B., and M. Ravallion (1997). ‘Decomposing Social Indicators Using Distributional Data’. Jour-nal of Econometrics, 77(1): 125–39.
Blankenau, W. (2005). ‘Public Schooling, College Subsidies and Growth’. Journal of Economic Dy-namics and Control, 29(3): 487–507.
Blankenau, W.F., and N.B. Simpson (2004). ‘Public Education Expenditures and Growth’. Journal ofDevelopment Economics, 73(2): 583–605.
Blankenau, W.F., N.B. Simpson, and M. Tomljanovich (2007). ‘Public Education Expenditures, Taxa-tion, and Growth: Linking Data to Theory’. The American Economic Review, 97(2): 393–97.
Blundell, R., and S. Bond (1998). ‘Initial Conditions and Moment Restrictions in Dynamic Panel DataModels’. Journal of Econometrics, 87(1): 115–43.
Castro-Leal, F., J. Dayton, L. Demery, and K. Mehra (1999). ‘Public Social Spending in Africa: Do thePoor Benefit?’. World Bank Research Observer, 14(1): 49–72.
Chaney, T. (2008). ‘Distorted Gravity: The Intensive and Extensive Margins of International Trade’.American Economic Review, 98(4): 1707–21.
Christiaensen, L., L. Demery, and J. Kuhl (2011). ‘The (Evolving) Role of Agriculture in PovertyReduction: An Empirical Perspective’. Journal of Development Economics, 96(2): 239–54.
17

Chudik, A. and M.H. Pesaran (2015). ‘Common Correlated Effects Estimation of Heterogeneous Dy-namic Panel Data Models with Weakly Exogenous Regressors’. Journal of Econometrics, 188(2):393–420.
Chudik, A., M.H. Pesaran, and E. Tosetti (2011). ‘Weak and Strong Cross-Section Dependence andEstimation of Large Panels’. The Econometrics Journal, 14(1): C45–C90.
Coakley, J., A.-M. Fuertes, and R. Smith (2002). ‘A Principal Components Approach to Cross-SectionDependence in Panels’. In 10th International Conference on Panel Data, Berlin, 5–6 July 2002.
Devarajan, S., D.S. Go, and H. Li (1999). ‘Quantifying the Fiscal Effects of Trade Reform’. PolicyResearch Working Paper 2162. Washington, DC: World Bank.
Ditzen, J. (2016). ‘xtdcce2: Estimating Dynamic Common Correlated Effects in Stata’. TechnicalReport. Stata Users Group.
Dutt, P., I. Mihov, and T. VanZandt (2013). ‘The Effect of WTO on the Extensive and the IntensiveMargins of Trade’. Journal of International Economics, 91(2): 204–19.
Easterly, W., and S. Rebelo (1993). ‘Fiscal Policy and Economic Growth’. Journal of Monetary Eco-nomics, 32(3): 417–58.
Emran, M.S. (2005). ‘Revenue-Increasing and Welfare-Enhancing Reform of Taxes on Exports’. Jour-nal of Development Economics, 77(1): 277–92.
Emran, M.S., and J.E. Stiglitz (2005). ‘On Selective Indirect Tax Reform in Developing Countries’.Journal of Public Economics, 89(4): 599–623.
Ericsson, N.R., D.F. Hendry, and G.E. Mizon (1998). ‘Exogeneity, Cointegration, and Economic PolicyAnalysis’. Journal of Business & Economic Statistics, 16(4): 370–87.
Falvey, R. (1994). ‘Revenue Enhancing Tariff Reform’. Review of World Economics, 130(1): 175–90.
Fischer, R.D. (2001). ‘The Evolution of Inequality after Trade Liberalization’. Journal of DevelopmentEconomics, 66(2): 555–79.
Fujiwara, K. (2013). ‘A Win–Win–Win Tariff: Tax Reform Under Imperfect Competition’. Review ofInternational Economics, 21(5): 857–67.
Gordon, R., and W. Li (2009). ‘Tax Structures in Developing Countries: Many Puzzles and a PossibleExplanation’. Journal of Public Economics, 93(7-8): 855–66.
Greenaway, D., and C. Milner (1991). ‘Fiscal Dependence on Trade Taxes and Trade Policy Reform’.The Journal of Development Studies, 27(3): 95–132.
Hatzipanayotou, P., M.S. Michael, and S.M. Miller (1994). ‘Win–Win Indirect Tax Reform: A ModestProposal’. Economics Letters, 44(1–2): 147–51.
Heltberg, R., K. Simler, and F. Tarp (2001). ‘Public Spending and Poverty in Mozambique’. DiscussionPaper 2001/63. Helsinki: UNU-WIDER.
Jung, H.-S., and E. Thorbecke (2003). ‘The Impact of Public Education Expenditure on Human Capital,Growth, and Poverty in Tanzania and Zambia: A General Equilibrium Approach’. Journal of PolicyModeling, 25(8): 701–25.
Kaganovich, M., and I. Zilcha (1999). ‘Education, Social Security, and Growth’. Journal of PublicEconomics, 71(2): 289–309.
18

Kapetanios, G., M.H. Pesaran, and T. Yamagata (2011). ‘Panels with Non-Stationary Multifactor ErrorStructures’. Journal of Econometrics, 160(2): 326–48.
Keen, M. (1989). ‘Multilateral Tax and Tariff Reform’. The Economic Studies Quarterly, 40(3): 195–202.
Keen, M. (2008). ‘VAT, Tariffs, and Withholding: Border Taxes and Informality in Developing Coun-tries’. Journal of Public Economics, 92(10–11): 1892–906.
Keen, M., and J.E. Ligthart (2002). ‘Coordinating Tariff Reduction and Domestic Tax Reform’. Journalof International Economics, 56(2): 489–507.
Keen, M. and J.E. Ligthart (2005). ‘Coordinating Tariff Reduction and Domestic Tax Reform UnderImperfect Competition’. Review of International Economics, 13(2): 385–90.
Khattry, B. (2003). ‘Trade Liberalization and the Fiscal Squeeze: Implications for Public Investment’.Development and Change, 34(3): 401–24.
Khattry, B., and J.M. Rao (2002). ‘Fiscal Faux Pas? An Analysis of the Revenue Implications of TradeLiberalization’. World Development, 30(8): 1431–44.
Kreickemeier, U., and P. Raimondos-Møller (2008). ‘Tariff–Tax Reforms and Market Access’. Journalof Development Economics, 87(1): 85–91.
Krueger, A. (1985). Trade and Employment in Developing Countries Cambridge, MA: National Bureauof Economic Research.
Lahiri, S., and A. Nasim (2005). ‘Commercial Policy Reform in Pakistan: Opening Up the EconomyUnder Revenue Constraints’. International Tax and Public Finance, 12(6): 723–39.
LeGoff, M., and R.J. Singh (2014). ‘Does Trade Reduce Poverty? A View from Africa’. Journal ofAfrican Trade, 1(1): 5–14.
Lin, S. (1998). ‘Labor Income Taxation and Human Capital Accumulation’. Journal of Public Eco-nomics, 68(2): 291–302.
Lucas, R.E. (1990). ‘Supply-Side Economics: An Analytical Review’. Oxford Economic Papers, 42(2):293–316.
McCaig, B. (2011). ‘Exporting Out of Poverty: Provincial Poverty in Vietnam and US Market Access’.Journal of International Economics, 85(1): 102–13.
McCulloch, N., L.A. Winters, and X. Cirera (2001). Trade Liberalization and Poverty: A Handbook.Cambridge: Cambridge University Press.
McNabb, K. (2018). ‘Tax Structures and Economic Growth: New Evidence from the GovernmentRevenue Dataset’. Journal of International Development, 30(2): 173–205.
Melitz, M.J. (2005). ‘When and How Should Infant Industries be Protected?’. Journal of InternationalEconomics, 66(1): 177–96.
Michael, M.S., P. Hatzipanayotou, and S.M. Miller (1993). ‘Integrated Reforms of Tariffs and Con-sumption Taxes’. Journal of Public Economics, 52(3): 417–28.
Naito, T., and K. Abe (2008). ‘Welfare- and Revenue-Enhancing Tariff and Tax Reform Under ImperfectCompetition’. Journal of Public Economic Theory, 10(6): 1085–94.
19

Newbold, P., and C.W. Granger (1974). ‘Experience with Forecasting Univariate Time Series and theCombination of Forecasts’. Journal of the Royal Statistical Society: Series A (General), 137(2):131–46.
Paldam, M., and E. Gundlach (2012). ‘The Democratic Transition: Short-Run and Long-Run CausalityBetween Income and the Gastil Index’. The European Journal of Development Research, 24(1):144–68.
Pesaran, M.H. (2004). ‘General Diagnostic Tests for Cross Section Dependence in Panels’. DiscussionPaper 1240. Bonn: IZA.
Pesaran, M.H. (2006). ‘Estimation and Inference in Large Heterogeneous Panels with a MultifactorError Structure’. Econometrica, 74(4): 967–1012.
Pesaran, M.H. (2015). ‘Testing Weak Cross-Sectional Dependence in Large Panels’. EconometricReviews, 34(6–10): 1089–117.
Pesaran, M.H., and R. Smith (1995). ‘Estimating Long-Run Relationships from Dynamic Heteroge-neous Panels’. Journal of Econometrics, 68(1): 79–113.
Pesaran, M.H., and E. Tosetti (2011). ‘Large Panels with Common Factors and Spatial Correlation’.Journal of Econometrics, 161(2): 182–202.
Phillips, P.C., and D. Sul (2003). ‘Dynamic Panel Estimation and Homogeneity Testing Under CrossSection Dependence’. The Econometrics Journal, 6(1): 217–59.
Phillips, P.C., and D. Sul (2007). ‘Bias in Dynamic Panel Estimation with Fixed Effects, IncidentalTrends and Cross Section Dependence’. Journal of Econometrics, 137(1): 162–88.
Piggott, J., and J. Whalley (2001). ‘VAT Base Broadening, Self Supply, and the Informal Sector’. TheAmerican Economic Review, 91(4): 1084–94.
Porto, G. (2003). Trade Reforms, Market Access and Poverty in Argentina. Washington, DC: WorldBank.
Robertson, D., and J. Symons (2000). ‘Factor Residuals in SUR Regressions: Estimating Panels Allow-ing for Cross Sectional Correlation’. Technical Report. London: London School of Economics andPolitical Science.
Robertson, D., and J. Symons (2007). ‘Maximum Likelihood Factor Analysis with Rank-DeficientSample Covariance Matrices’. Journal of Multivariate Analysis, 98(4): 813–28.
Santos-Paulino, A.U. (2012). ‘Trade, Income Distribution and Poverty in Developing Countries: ASurvey’. Discussion Paper 207. Paris: UNCTAD.
Santos-Paulino, A.U. (2017). ‘Estimating the Impact of Trade Specialization and Trade Policy onPoverty in Developing Countries’. Journal of International Trade & Economic Development, 26:693–711.
Schneider, F., and D.H. Enste (2000). ‘Shadow Economies: Size, Causes, and Consequences’. Journalof Economic Literature, 38(1): 77–114.
Topalova, P. (2007). ‘Trade Liberalization, Poverty and Inequality: Evidence from Indian Districts’. InA. Harrison (ed.), Globalization and Poverty. Chicago, IL: University of Chicago Press.
Trostel, P.A. (1993). ‘The Effect of Taxation on Human Capital’. Journal of Political Economy, 101(2):327-50.
Zee, H.H. (1996). ‘Empirics of Crosscountry Tax Revenue Comparisons’. World Development, 24(10):1659–71.
20

Appendix
Table A1: List of countries
Algeria Cote d’Ivoire Lesotho RwandaArgentina Djibouti Liberia Sao Tome and PrincipeAzerbaijan Dominican Republic Madagascar SenegalBangladesh Ecuador Malawi Sierra LeoneBelize Egypt, Arab Rep. Malaysia Solomon IslandsBenin El Salvador Maldives South AfricaBhutan Ethiopia Mali Sri LankaBolivia Fiji Mauritania St. LuciaBotswana Gabon Mauritius SurinameBrazil Gambia, The Mexico Syrian Arab RepublicBurkina Faso Ghana Mongolia TanzaniaBurundi Guatemala Morocco ThailandCabo Verde Guinea Mozambique TogoCameroon Guinea-Bissau Myanmar TunisiaCentral African Republic Haiti Namibia TurkeyChad Honduras Nepal UgandaChile India Nicaragua UruguayChina Indonesia Niger UzbekistanColombia Iran, Islamic Rep. Nigeria Venezuela, RBComoros Jamaica Pakistan Viet NamCongo, Dem. Rep. Jordan Paraguay ZambiaCongo, Rep. Kenya Peru ZimbabweCosta Rica Lao PDR Philippines
21

Table A2: Variable definition and sources
Variable Description Source
Headcount Represents the poverty headcount ratio, which measures thepercentage of people living under US$1.90 a day at 2011international prices (percentage of the population)
World Bank poverty database andWDI (Povcalnet)
Trade tax Import and export duties (percentage of GDP) GRD, Baunsgaard and Keen(2010), and OECD
Domestic tax Measures the total tax revenue excluding trade tax revenue(percentage of GDP)
GRD, Baunsgaard and Keen(2010), and OECD
Total tax Measures the total tax revenue as the sum of trade tax rev-enue and domestic revenue (percentage of GDP)
GRD, Baunsgaard and Keen(2010), and OECD
Democracy Average of political rights and civil liberties of the Gastil in-dex. It ranges from 1 for democracy to 7 for dictatorship (seePaldam and Gundlach 2012)
Freedom House
Land pc Measures the agricultural area per capita in hectares FAO statisticsCapital pc Capital stock per capita at constant 2011 national prices
(US$)IMF
Education Government expenditure on education as a percentage ofgovernment total expenditures
IMF
Health Government expenditure on health as a percentage of gov-ernment total expenditures
IMF
Government expendi-tures
Government total expenditures as a percentage of GDP IMF
Population growth Measures the annual population growth rate WDI
Table A3: Cross-section dependenceCD p-value avg ρ |ρ|
Headcount 87.49 0.00 0.229 0.491Domestic tax 89.62 0.00 0.243 0.473Total tax 54.06 0.00 0.142 0.405Land pc 322.84 0.00 0.847 0.866Capital pc 53.59 0.00 0.143 0.650GDP pc 377.72 0.00 0.977 0.977Population growth 88.04 0.00 0.278 0.568Health 48.02 0.00 0.204 0.405Trade tax 202324.52 0.00 0.16 0.37Non-tax revenue 202324.52 0.05 0.01 0.31Education 255895.06 0.00 0.05 0.33Democracy 255895.06 0.00 0.07 0.37Government expenditure 255895.06 0.00 0.03 0.32
Notes: I use the Stata command xtcd which calculates the CD test for cross-sectional dependence of Pesaran (2004) underthe null hypothesis of strict cross-sectional independence. I present the average correlation and average absolute correlationcoefficients across the N(N−1) correlations between country i and all other countries. The null hypothesis of strictcross-sectional independence is rejected at the 1 per cent level for all variables except for the non-tax revenue variable, forwhich the null hypothesis is rejected at the 5 per cent level. This suggests the presence of cross-section dependence in eachdataset.For the variables trade tax, non-tax revenue, education expenditures, and government total expenditures, I use Stata routinextcdf to carry out the CD test for cross-sectional dependence due to some missing data leading to an unbalanced panel;accordingly, I cannot use the CD test for cross-sectional dependence xtcd.
Source: author’s calculations based on sources discussed in the text.
22

Figure A1: Evolution of agricultural trade balance trend by group of countries: heterogeneity effects of trade tax
020
0000
040
0000
060
0000
0
1980 1990 2000 2010 2020Year
Countries with negative coefficients
020
0000
040
0000
060
0000
0
1980 1990 2000 2010 2020Year
Countries with positive coefficients
Agricultural trade balance trend
Trade balance ExportImport
Notes: I plot the trend (average) of trade balance of agricultural products over the period 1980–2016 to identify the role ofcomparative advantage in agriculture in the heterogeneity effects across countries. The countries with negative coefficientsrefer to those that benefit from an increase in trade taxes in terms of poverty reduction. The countries with positive coefficientsare those in which an increase in taxes on international trade is associated with an increase in poverty. The figure shows thatcountries that experience a poverty-increasing effect of trade taxes have shifted from being net exporters to net importers ofagricultural products, while countries in which trade taxes are associated with a reduction in poverty remained, on average, netexporters of agricultural products over time.
Source: author’s calculations based on the FAO dataset.
23

Figure A2: Evolution of agricultural trade balance trend by group of countries: heterogeneity effects of domestic tax
020
0000
040
0000
0
1980 1990 2000 2010 2020Year
Countries with negative coefficients
020
0000
040
0000
0
1980 1990 2000 2010 2020Year
Countries with positive coefficients
Agricultural trade balance trend
Trade balance ExportImport
Notes: I plot the trend (average) of the trade balance of agricultural products over the period 1980–2016 to identify the role ofcomparative advantage in agriculture in the heterogeneity effects across countries of a shift from taxes on international tradetowards domestic taxes on poverty. The countries with negative coefficients refer those that benefit from an increase in tradetaxes in terms of poverty reduction. The countries with positive coefficients are those in which an increase in taxes oninternational trade is associated with an increase in poverty. The figure shows that countries that experience apoverty-increasing effect of trade taxes have shifted from being net exporters to net importers of agricultural products, whilecountries in which trade taxes are associated with a reduction in poverty consolidated their comparative advantage inagriculture as agricultural trade balance increased on average over time.
Source: author’s own calculations based on the FAO dataset.
24

Robustness checks
Table A4: Trade taxes incidence on poverty estimation excluding China and Lesotho from the sampleDependent variable: poverty headcount ratio (in log)
(1) (2) (3) (4) (5)MG CCEMG CCEMG with lags
CA additional lags First lag Second lag Third lagL. headcount 0.587*** 0.363*** 0.238*** 0.143 0.381***
(0.034) (0.044) (0.067) (0.169) (0.142)Trade tax –0.032* –0.034* –0.023 –0.138** 0.229(percentage of GDP) (0.017) (0.018) (0.050) (0.066) (0.414)Domestic tax –0.053*** –0.049** –0.133 –0.090 –1.193(percentage of GDP) (0.020) (0.025) (0.116) (0.086) (1.039)Capital pc 0.147 –0.068 –0.735 0.387 –0.646
(0.129) (0.147) (0.599) (0.573) (1.635)Land pc 0.050 –0.089 –0.197 –0.082 –4.199
(0.142) (0.162) (0.609) (0.705) (3.315)GDP pc –0.442*** –0.673*** –0.794** –2.084* 4.035
(0.099) (0.130) (0.337) (1.228) (5.169)Non-tax revenue –0.001 0.010 0.009 0.026 –0.381
(0.009) (0.012) (0.031) (0.062) (0.496)Constant –0.649 0.876 –14.109 –13.519 45.403
(0.639) (1.274) (10.237) (10.296) (52.121)
RMSE 0.0960 0.0682 0.0936 0.0857 0.0880CD test 9.840 2.304 3.84 1.28 2.24CD p-value 0.000 0.021 0.000 0.202 0.025Number of groups 79 79 64 62 61Observations 2,310 2,310 1,945 1,827 1,733
Notes: *** p < 0.01, ** p < 0.05, * p < 0.1. Standard errors in parentheses areconstructed non-parametrically following Pesaran and Smith (1995).All the regressors are in the log. The country-specific linear trend is included in eachmodel.CD test reports the Pesaran (2015) test for weak cross-sectional dependence; under thenull hypothesis of weak cross-sectional dependence of the error term, the CD statistic isdistributed ∼ N(0,1). RMSE is the root mean squared error.
Source: author’s calculations.
25

Table A5: Domestic taxes incidence on poverty estimation excluding China and Lesotho from the sampleDependent variable: poverty headcount ratio (in log)
(1) (2) (3) (4) (5)MG CCEMG CCEMG with lags
CA additional lags First lag Second lag Third lagL. headcount 0.582*** 0.398*** 0.277*** 1.036 0.180**
(0.035) (0.040) (0.053) (0.715) (0.084)Domestic tax 0.037 0.029 0.269 0.669* 0.085(percentage of total tax) (0.045) (0.048) (0.284) (0.401) (0.557)Tax revenue –0.038 –0.076* –0.343** –0.515* –0.427***(percentage of GDP) (0.037) (0.043) (0.143) (0.271) (0.127)Capital pc 0.141 –0.094 1.001* 4.055 –2.414**
(0.137) (0.149) (0.586) (3.484) (1.107)Land pc 0.035 0.183 0.360 0.611 0.429
(0.140) (0.151) (0.381) (1.537) (0.596)GDP pc –0.465*** –0.622*** –0.684** 0.224 –2.044***
(0.097) (0.118) (0.328) (2.831) (0.539)Non-tax revenue 0.003 0.015 0.012 –0.030 –0.073
(0.008) (0.015) (0.040) (0.167) (0.104)Constant –1.420* 1.055 –2.694 1.762 –4.250
(0.776) (2.022) (4.988) (3.792) (6.057)
RMSE 0.0957 0.0683 0.0927 0.0924 0.0956CD test 9.321 1.659 4.20 1.59 0.65CD p-value 0.000 0.097 0.000 0.112 0.514Number of countries 80 80 64 62 61Observations 2,326 2,326 1,945 1,827 1,733
Notes: p < 0.01, ** p < 0.05, * p < 0.1. Standard errors in parentheses are constructednon-parametrically following Pesaran and Smith (1995).All the regressors are in the log. The country-specific linear trend is included in each model.CD test reports the Pesaran (2015) test for weak cross-sectional dependence; under the nullhypothesis of weak cross-sectional dependence of the error term, the CD statistic isdistributed ∼ N(0,1). RMSE is the root mean squared error.
Source: author’s calculations.
26


