Page 1
WILD BIRD MORTALITY AND WEST NILE VIRUS SURVEILLANCE: BIASES
ASSOCIATED WITH DETECTION, REPORTING, AND CARCASS PERSISTENCE
by
MARSHA REBEKAH WARD
(Under the Direction of William R. Davidson)
ABSTRACT
Surveillance of dead wild birds is useful for early detection of West Nile virus (WNV)
activity. Objectives of this project were to assess detection, reporting, persistence, and fate of
dead birds in relation to WNV surveillance programs in Georgia. The project assessed detection
and reporting of dead crows (decoy surrogates) within urban and rural environments of DeKalb
County, a location with an intensive dead bird surveillance system. Both detection and reporting
were higher in the urban area. The project also assessed persistence and fate of American crow
(Corvus brachyrhynchos) and house sparrow (Passer domesticus) carcasses within similar urban
and rural environments. Carcass species, environmental category, and exposure duration
affected carcass persistence. Species composition of scavengers was similar in urban and rural
areas but “scavenging pressure” was greater in rural areas. This information was related to
interpretation of wild bird WNV surveillance data and the potential for WNV exposure among
scavengers.
INDEX WORDS: American crow, Carcass, Corvus brachyrhynchos, Detection, Fate, House
sparrow, Passer domesticus, Reporting, Scavenging, Persistence, West Nile virus
Page 2
WILD BIRD MORTALITY AND WEST NILE VIRUS SURVEILLANCE: BIASES
ASSOCIATED WITH DETECTION, REPORTING, AND CARCASS PERSISTENCE
by
MARSHA REBEKAH WARD
B.S., Shorter College, 1997
A Thesis Submitted to the Graduate Faculty of The University of Georgia in Partial Fulfillment
of the Requirements for the Degree
MASTER OF SCIENCE
ATHENS, GEORGIA
2004
Page 3
© 2004
Marsha Rebekah Ward
All Rights Reserved
Page 4
WILD BIRD MORTALITY AND WEST NILE VIRUS SURVEILLANCE: BIASES
ASSOCIATED WITH DETECTION, REPORTING, AND CARCASS PERSISTENCE
by
MARSHA REBEKAH WARD
Major Professor: William R. Davidson
Committee: Steven B. Castleberry David E. Stallknecht
Electronic Version Approved: Maureen Grasso Dean of the Graduate School The University of Georgia December 2004
Page 5
ACKNOWLEDGEMENTS
First, I would like to thank my major professor, Dr. W. R. Davidson, for his support over
the last few years. I would like to thank my committee members, Dr. S. B. Castleberry and Dr.
D. E. Stallknecht, for providing helpful advice throughout my time here and for reviewing my
thesis. I would also like to thank Dr. M. J. Conroy for assisting with my data analyses. I am also
very grateful for two exceptional people I came to know and love during my time here, my
boyfriend Justin C. Davis and my friend Jordona Doughty. I would never have made it without
their friendship and love. Last, but definitely not least, I thank my family for their continued
love and support throughout this journey.
iv
Page 6
TABLE OF CONTENTS
Page
ACKNOWLEDGEMENTS........................................................................................................... iv
LIST OF TABLES......................................................................................................................... vi
LIST OF FIGURES ...................................................................................................................... vii
CHAPTER
INTRODUCTION.................................................................................................................1
1 WILD BIRD MORTALITY AND WEST NILE VIRUS SURVEILLANCE: BIASES
ASSOCIATED WITH DETECTION, REPORTING, AND CARCASS
PERSISTENCE .........................................................................................................8
SUMMARY AND CONCLUSIONS ............................................................................................43
REFERENCES ..............................................................................................................................45
v
Page 7
LIST OF TABLES
Page
Table 1-1: Alternative models for predicting decoy detection and reporting in urban and rural
areas of DeKalb County, Georgia in 2003. ...................................................................32
Table 1-2: Alternative models for predicting crow and sparrow carcass persistence rates in urban
and rural areas of Clarke, Madison, and Oconee counties, Georgia in 2004 ................33
Table 1-3: Detection and reporting of crow decoys within 7 days in urban and rural areas of
DeKalb County, Georgia in 2003..................................................................................34
Table 1-4: Model selection results for models explaining influences of area and time on decoy
detection and reporting in DeKalb County, Georgia in 2003........................................35
Table 1-5: Results of crow carcass persistence trials in Clarke, Madison, and Oconee counties,
Georgia in 2004... ..........................................................................................................36
Table 1-6: Results of sparrow carcass persistence trials in Clarke, Madison, and Oconee counties,
Georgia in 2004... ..........................................................................................................37
Table 1-7: Model selection results for models explaining influences of species, area, time, and
days of exposure on carcass persistence rates in Clarke, Madison, and Oconee
counties, Georgia in 2004..............................................................................................38
Table 1-8: Documented scavenger visits to crow and sparrow carcasses in Clarke, Madison, and
Oconee counties, Georgia in 2004. ...............................................................................39
vi
Page 8
LIST OF FIGURES
Page
Figure 1: Land use areas and routes for decoy placement during crow decoy study in DeKalb
County, Georgia in July and September 2003 and location for crow and sparrow
carcass persistence and fate study in Clarke, Madison, and Oconee counties, Georgia
in July and September 2004 ..........................................................................................40
Figure 2: Model-averaged parameter estimates for crow and sparrow carcass persistence rates in
urban and rural areas in Clarke, Madison, and Oconee counties, Georgia in 2004 ......41
Figure 3: Exemplar photographs of scavenging species obtained during carcass persistence and
fate study in Clarke, Madison, and Oconee counties, Georgia in 2004. (a) Gray fox
(Urocyon cinereoargenteus). (b) Domestic cat (Felis catus). (c) Red-tailed hawk
(Buteo jamaicensis). (d) Coyote (Canis latrans). (e) Raccoon (Procyon lotor). (g)
Virginia opossum (Didelphis virginiana)......................................................................42
vii
Page 9
INTRODUCTION
West Nile virus (WNV), a member of the family Flaviviridae, is a human, equine, and
avian pathogen (Fields et al. 2001). The virus is indigenous to Africa, Asia, Europe, and
Australia (Campbell et al. 2002). It was first described in Uganda in 1937 (Smithburn et al.
1940) and was first recognized in North America in 1999 (CDC 2004a). Since 1999, WNV has
been documented across all of North America, resulting in the deaths of over 600 people and
tens of thousands of birds, horses, and other animals (Eidson et al. 2001a, CDC 2004a).
West Nile virus is maintained in nature in a mosquito-bird-mosquito transmission cycle
(Work et al. 1955, Taylor et al. 1956). Mosquitoes in the genus Culex are thought to be the main
WNV vectors (Bernard et al. 2001, Campbell et al. 2002). Birds have long been recognized as
amplifying hosts of WNV and are a critical component in the epidemiology of the virus (Work et
al. 1955). Other vertebrate hosts, such as humans and horses, are considered dead-end hosts for
WNV because they do not typically develop sufficient viremia to infect mosquitoes and maintain
the WNV transmission cycle (Peiris and Amerasinghe 1994, Bunning et al. 2002). Since WNV
depends on mosquitoes for transmission among its hosts, temperate epidemics often occur during
seasons of high temperature (i.e. summer and fall) when mosquito vector density is highest
(Marra et al. 2004).
West Nile virus and crows
Since 1999, published records have documented the occurrence of WNV in 226 avian
species in North America (Saito et al. 2004); however, according to the Centers for Disease
1
Page 10
Control, WNV infects at least 280 species of birds, of which at least 190 are native North
American species (CDC 2004a). In indigenous countries, WNV infections in birds are generally
asymptomatic with high-level viremias (Peiris and Amerasinghe 1994). In contrast, the strain of
WNV introduced into the United States is highly pathogenic to certain birds, most notably
species in the family Corvidae, which includes crows, jays, and magpies. Under laboratory
conditions, almost 100% of American crows (Corvus brachyrhynchos) experimentally infected
with WNV have died (McLean et al. 2001, Komar et al. 2003). High rates of mortality
associated with WNV also have been described in black-billed magpies (Pica hudsonia), blue
jays (Cyanocitta cristata), and fish crows (Corvus ossifragus) (Komar et al. 2003). Crows also
have been shown to be susceptible in field studies. In Illinois in 2002, 19 of 28 crows (68%)
tracked with radio-transmitters died of WNV (Yaremych et al. 2004). Crows also experienced
high death rates (estimated 40%) in Oklahoma within two months after the arrival of WNV
(Caffrey et al. 2003).
As crows are large-bodied, ubiquitous in all land use environments, and highly
susceptibility to disease, they are important indicators of WNV activity. In the United States in
2001, dead crows were the first indicators of WNV in 66% of the 359 counties reporting WNV
activity (CDC 2002b). Monitoring dead crows is advocated as a key component of WNV
surveillance systems (Eidson et al. 2001a, Eidson et al. 2001b, Watson et al. 2004).
West Nile virus surveillance using avian sentinels
As human and equine cases of WNV encephalitis generally are preceded by the
observance of bird morbidity and mortality, dead wild bird surveillance can play a critical role in
the early detection and, therefore, potential prevention of WNV transmission to humans (Guptill
2
Page 11
et al. 2003, Mostashari et al. 2003). Of the 359 counties in the United States reporting WNV
activity in 2001, 92% of the first cases were preceded by at least one report of a WNV-infected
bird (CDC 2002b). Because bird mortality was shown to be a sensitive method for WNV
surveillance in 2001, much WNV surveillance effort has focused on dead wild bird surveillance.
However, limitations exist to the extent of the usefulness of dead bird surveillance data. For
example, the number of dead birds reported in an area is a function of human density
(Theophilides et al. 2003). Dead bird reports also can be influenced by other associated human
factors, such as public awareness of the surveillance system, public interest, and current media
coverage (Eidson et al. 2001b). Also, due to the focus on human health and restricted budgets,
many public health departments quit monitoring dead birds after only a few local birds test
positive.
Carcass detection during wild bird mortality events
Although a count of carcasses often is the only information available to estimate disease
impacts in wild animals, such counts can be influenced by the accuracy and precision of search
methods, the time interval between mortality and the search, and the rate at which carcasses
decompose or are removed by scavengers (Wobeser and Wobeser 1992). Search methods for
carcasses have reported variable results. Linz et al. (1991) found that 81% of red-winged
blackbird (Agelaius phoeniceus) carcasses placed in cattail (Typha spp.) marsh plots were found
by organized searches. Similarly, in a study by Tobin and Dolbeer (1990), 75% of songbird
carcasses placed beneath orchard trees were found. In contrast, Stuzenbacher et al. (1986)
studied the effectiveness of search crews in locating dead ducks in a shallow Texas wetland and
found none of the birds placed in cover and only six (12%) of the highly visible carcasses. The
authors concluded that lack of carcasses recovered during intensive searches does not rule out
3
Page 12
extensive waterfowl mortality. Similarly, in a study by Cliplef and Wobeser (1993), only 32% of
marked dummy waterfowl carcasses in a wetland were recovered during searches. Three
different search methods for estimating the density of dead birds in an epizootic were evaluated
by Philibert et al. (1993). Birds were found during every search; however, they concluded that
that the number of birds found during most searches was less than needed to estimate density
accurately.
Morphological characteristics of carcasses can affect carcass search methods. For
example, Philibert et al. (1993) used clay models resembling western meadowlarks (Sturnella
neglecta) and Savannah sparrows (Passerculus sandwichensis) to study carcass detection
methods. Meadowlarks are larger and more brightly colored than sparrows, and as expected,
more meadowlarks (90%) were detected than sparrows (62%). Similarly, in a study by Linz et
al. (1991), fewer female red-wing blackbirds (78%) were found than males (83%), which are
larger and more brightly colored than females. Additionally, carcass searchers in a study by
Cliplef and Wobeser (1993) on waterfowl carcasses found more mallards (53%) than smaller
species of waterfowl (25%).
Estimation of carcass disappearance rates
The rate at which carcasses decompose or are removed by scavengers may bias mortality
estimates in wild bird populations. Factors such as the density and visibility of carcasses,
scavenger assemblages in the area, weather, and habitat characteristics may influence the
duration of carcass persistence (Wobeser and Wobeser 1992). Wobeser (1994) suggests that
approximately 50% of duck-sized carcasses disappear within four days and that approximately
75% of passerine bird carcasses may be removed within the first day.
4
Page 13
Stuzenbacher et al. (1986) suggests that wild animal carcasses are quickly assimilated
into the environment. In a study of 47 duck carcasses in a Texas wetland, all carcasses were
eventually consumed by predators and scavengers. Sixty-two percent of the carcasses were gone
in three days. Balcomb (1986) found rapid initial disappearance of songbird carcasses in
agricultural fields in Maryland. At one day after placement, 75% of all carcasses were gone.
Carcass losses were markedly greater during this first 24-hour period, demonstrating that the rate
of carcass disappearance was not uniform over the 5-day study period. Similarly, Wobeser and
Wobeser (1992) found that only 20% of chick carcasses in mixed-grass pasture remained after
one day. In contrast, Tobin and Dolbeer (1990) examined songbird carcass survival in cherry
and apple orchards and found mean survival times for carcasses were 8.2 days and 10.4 days,
respectively. However, none of the 25 carcasses placed in one of the study orchards were found
the next day, implying variable rates of persistence even within a single study.
Differences in carcass location within a particular environment can affect persistence.
Pain (1991) found that exposed duck carcasses on land persisted an average of 1.5 days, whereas
carcasses concealed by vegetation on land, and those in water, persisted and average of 3.3 and
7.6 days, respectively. Similarly, Stuzenbacher et al. (1986) found that duck carcasses in open
water persisted an average of 11.2 days, whereas carcasses with overhead cover or completely
exposed persisted an average of 2.6 days and 3.8 days, respectively. Linz et al. (1991) studied
red-winged blackbird carcasses in cattail marshes and found that scavenging activity differed
among marshes and was influenced by carcass density and depth of water.
Balcomb (1986) reported that 58% of songbird carcasses disappeared without leaving
observable remains and Tobin and Dolbeer (1990) found that 75% of bird carcasses were
removed completely. Of the 275 chick carcasses observed by Wobeser and Wobeser (1992),
5
Page 14
only two carcasses that had been in place for over 24 hours were found. These studies
demonstrate the need to investigate outbreaks quickly if a large proportion of birds are to be
detected.
An exception to a rapid rate of carcass disappearance may occur when a large number of
animals die within a short period of time in a small area, presumably by overloading existent
scavenging populations. For example, only one of 42 duck carcasses marked and observed
during a botulism outbreak was disturbed by scavengers during the four days after death (Cliplef
and Wobeser 1993).
The specific cause of the carcass removal is also of interest when studying carcass
persistence. A myriad of scavenging species, ranging from invertebrates to mammals, represent
potential sources of avian carcass disappearance, and these scavengers are likely to differ across
environmental settings. With WNV, such scavengers may actually become infected by
consuming WNV infected birds (McLean et al. 2001, Komar et al. 2003).
West Nile virus surveillance in Georgia
The Southeastern Cooperative Wildlife Disease Study (SCWDS) has conducted WNV
surveillance among wild birds in Georgia since 2000. West Nile virus was first detected in
Georgia in an American crow carcass submitted to SCWDS from Lowndes County on July 11,
2001. From January 1, 2001 to January 1, 2004, a total of 6,114 dead birds were submitted to
SCWDS for WNV testing (D. G. Mead, SCWDS, personal communication). Corvids made up
46% of all dead birds submitted. Eighteen percent of all dead birds submitted were crows, and
of these, 64% (700 of 1,087) were positive for WNV.
6
Page 15
Currently, interpretation of dead bird surveillance is unclear because there is little
information relative to detection and reporting of dead birds. For example, in DeKalb County,
Georgia in 2002, extensive and specific data on dead wild bird surveillance was collected by the
DeKalb County Board of Health as part of Georgia’s WNV monitoring. DeKalb County Board
of Health found more reported WNV positive dead birds in urban areas versus rural areas (J.
Willis, DeKalb County Board of Health, personal communication). Results suggested that WNV
was more prevalent in urban than in rural areas; however, because of potential biases in detection
and reporting associated with human density and/or anthropogenic land use variations, such
conclusions could not be confirmed.
Objectives
The objectives of this research were to assess detection, reporting, and carcass persistence
and fate in relation to WNV surveillance programs. First, I assessed the detection and reporting
of dead crows (decoy surrogates) in urban and rural environments in a location with an intensive
and organized dead bird surveillance system. Second, I assessed the temporal persistence and
fate of American crow and house sparrow (Passer domesticus) carcasses in urban and rural
environments. Carcasses of both crows and sparrows were used to determine if morphological
differences play a role in persistence and fate. The data from this study will provide important
information related to the interpretation of dead bird surveillance data and on the potential for
oral exposure to WNV among both avian and mammalian scavengers.
7
Page 16
1 Ward, M. R., D. E. Stallknecht, M. J. Conroy, and W. R. Davidson. To be submitted to Journal of Wildlife Diseases.
8
CHAPTER 1
WILD BIRD MORTALITY AND WEST NILE VIRUS SURVEILLANCE: BIASES
ASSOCIATED WITH DETECTION, REPORTING, AND CARCASS PERSISTENCE1
__________________________________
Page 17
ABSTRACT— Surveillance targeting dead wild birds, in particular American crows (Corvus
brachyrhynchos), plays a critical role in West Nile virus (WNV) surveillance in the United
States. Using crow decoy surrogates, detection and reporting of crow carcasses within urban and
rural environments of DeKalb County, Georgia were assessed for reporting biases that might
occur in the county’s WNV surveillance program. In each of two trials, 400 decoys were labeled
with reporting instructions and distributed along randomly chosen routes throughout designated
urban and rural areas within DeKalb County. Akaike’s Information Criterion (AIC) model
selection indicated that the model containing area best explained decoy detection and reporting.
The proportion of decoys detected in the urban area (0.6, SE=0.024) was approximately twice
that of the rural area (0.3, SE=0.023), and the proportion of decoys reported in the urban area
(0.3, SE=0.023) was approximately three times that of the rural area (0.1, SE=0.028). These
results suggest that human density and associated factors can substantially influence dead crow
detection and reporting and, thus, the perceived distribution of WNV. In a second study, the
persistence and fate of American crow and house sparrow (Passer domesticus) carcasses were
assessed in similar urban and rural environments in Clarke, Madison, and Oconee counties,
Georgia. Two separate trials using 96 carcasses of each species were conducted. For a portion
of the carcasses, motion and heat sensitive cameras were used to monitor scavenging species
visits. Most carcasses (82%) disappeared or were decayed by the end of the 6-day study.
Carcass persistence averaged 1.6 days in rural areas and 2.1 days in urban areas. Model
selection based on AIC indicated that the best model explaining carcass persistence rates
included species and number of days of exposure; however, the model including area and
number of days of exposure received approximately equal support. Carcass disappearance rates
were higher for rural areas and for sparrow carcasses. Six mammalian and one avian species
9
Page 18
were documented scavenging upon carcasses. Dead wild birds could represent potential sources
of oral WNV exposure to these scavenging species. Species composition of scavengers was
similar in urban and rural areas but “scavenging pressure” was greater in rural areas.
Key words: American crow, carcass, Corvus brachyrhynchos, detection, fate, house sparrow,
Passer domesticus, persistence, reporting, scavenging, West Nile virus
INTRODUCTION
Avian surveillance targeting dead wild birds can play a critical role in the early detection
of West Nile virus (WNV) in the United States (Eidson et al., 2001a; Guptill et al., 2003;
Mostashari et al., 2003). Although West Nile virus has been shown to infect at least 226 bird
species in North America (Saito et al., 2004), American Crows (Corvus brachyrhynchos) have
been the focus of much surveillance targeting dead birds, in part due to their increased
susceptibility to WNV disease (McLean et al., 2001; Caffrey et al., 2003; Komar et al., 2003;
Yaremych et al., 2004). Crows also are large-bodied and ubiquitous in all land use
environments, increasing their usefulness as a surveillance target. In many areas of the United
States, dead crow reports have preceded human cases and have proven to be a valuable tool in
predicting human cases (Eidson et al., 2001a; Eidson et al., 2001b; Watson et al., 2004).
However, passive surveillance relies on the public for detecting and reporting dead birds and,
thus, can be affected by human-related factors such as public awareness, public interest, media
coverage, and human density (Eidson et al., 2001b; Mostashari et al, 2003; Theophilides et al.,
2003).
10
Page 19
Carcass counts can provide valuable information; however, such counts can be influenced
by the accuracy and precision of search methods, the time interval between mortality and the
search, and the rate at which carcasses decompose or are removed by scavengers (Stutzenbaker
et al., 1986; Tobin and Dolbeer, 1990; Linz et al., 1991; Wobeser and Wobeser, 1992). Carcass
detection also can be affected by biological factors such as morphological characteristics of the
species. Bird carcasses that are larger and more brightly colored often are more easily detected
than smaller and drabber species (Linz et al., 1991; Cliplef and Wobeser, 1993; Philibert et al.,
1993). Factors such as the density and visibility of the carcasses, scavenger assemblages in the
area, weather, and habitat characteristics may influence the duration of carcass persistence and
cause variability in the rate at which carcasses disappear (Balcomb, 1986; Stutzenbaker et al.,
1986; Tobin and Dolbeer, 1990; Linz et al., 1991; Wobeser and Wobeser, 1992). However, even
with variable rates of persistence, in several studies the majority of carcasses completely
disappeared, demonstrating the need to investigate outbreaks as soon as possible (Balcomb,
1986; Tobin and Dolbeer, 1990; Wobeser and Wobeser, 1992). The specific cause of the carcass
removal also is of interest when studying carcass persistence. A myriad of scavenging species,
ranging from invertebrates to mammals, represent potential sources of avian carcass
disappearance, and these scavengers are likely to differ across environmental settings. With
WNV, such scavengers may actually become infected by consuming WNV infected birds
(McLean et al., 2001; Komar et al., 2003).
In DeKalb County, Georgia in 2002, extensive and specific data on dead wild bird
surveillance was collected by the DeKalb County Board of Health as part of Georgia’s WNV
monitoring. The DeKalb County Board of Health found more reported WNV positive dead birds
in urban areas versus rural areas (J. Willis, DeKalb County Board of Health, personal
11
Page 20
communication). These results suggested that WNV was more prevalent in urban than in rural
areas; however, because of potential biases in detection and reporting associated with human
density and/or anthropogenic land use variations, such conclusions could not be confirmed.
The objectives of this project were to assess detection, reporting, and carcass persistence
and fate in relation to WNV surveillance programs. The first objective was to assess the
detection and reporting of dead crows using decoy surrogates in urban and rural environments in
DeKalb County, Georgia, which possesses an active organized dead bird surveillance system.
Commercial crow decoy surrogates were used instead of actual crow carcasses due to the
potential for public concerns and for monitoring abilities. The second objective was to assess the
temporal persistence and fate of American crow and house sparrow (Passer domesticus)
carcasses in similar urban and rural environments near Athens, Clarke County, Georgia.
Carcasses of both crows and sparrows were used to determine if morphological differences play
a role in persistence and fate. Motion and heat sensitive cameras were used to identify
scavenging species on a portion of the carcasses.
MATERIALS AND METHODS
Decoy detection and reporting
Detection and reporting of crow decoys within urban and rural environments was
evaluated in DeKalb County, Georgia during July and September 2003. DeKalb County is
located in the Piedmont physiographic province of Georgia, has a population of approximately
674,000 people, and comprises approximately 694 km2 (Figure 1-1) (U.S. Census Bureau, 2004).
This study area was selected based on the existence of detailed spatial information relating to the
reporting of dead birds and an active organized dead bird surveillance system. Using major
12
Page 21
highways as boundaries, the highly urbanized and more rural portions of DeKalb County were
delineated and were separated by a minimum of approximately 5 km by an equivalent sized
“buffer zone” (Figure 1-1). DeKalb County is immediately east of metropolitan Atlanta,
Georgia, and the urban area included that portion of the county within the Interstate 285 (I-285)
perimeter of this major city. Specifically, the urban area in western DeKalb County was
bounded on the north and east by I-285 and on the south by Interstate 20. The more rural area
was the eastern portion of the county with Stone Mountain and Panola roads as the primary
western boundaries. The buffer zone was the area bounded by I-285 on the west and Stone
Mountain and Panola roads on the east.
The urban and rural areas were evaluated twice, once in July (trial 1) and again in
September (trial 2). July and September were chosen because they are the start and peak of the
WNV season in Georgia, respectively. For each trial, 200 decoys were placed in both urban and
rural land use areas, totaling 400 decoy placements per trial, and 800 decoy placements after
both trials had been completed.
Decoys were placed along 20 specified randomly selected routes in each area (Figure 1-
1). Using ArcView, 20 random points in each land use area were generated for each trial. From
each random point, the nearest point on the nearest road was chosen as a starting location. Each
route was driven, north-south or east-west depending on the road orientation, and 10 decoys were
deposited approximately one every 0.5 km, alternating between left and right sides of the road.
Decoys were placed within approximately 2 to 20 m of roads because of logistical considerations
when monitoring and collecting decoys when trials ended. At any point that a decoy could not
be placed at the 0.5 km distance along the route, it was placed at the nearest available point.
Routes usually encompassed multiple roads, depending on local road infrastructure. Routes for
13
Page 22
trials 1 and 2 were generated independently but there was minor overlap. For each decoy, the
date, decoy number, description of placement location, GPS coordinates, and digital photographs
were recorded.
Decoys were labeled with an individual identifying number and instructions for reporting,
including the telephone number routinely used for dead bird reports by the DeKalb County
Board of Health. DeKalb County Board of Health personnel recorded the date and decoy
number as the decoys were reported. Decoys were monitored at the end of seven days and were
categorized as detected and reported, missing but unreported, or still present but unreported. All
remaining decoys were removed at day seven. Reports received after seven days were excluded
from analysis because actual dead birds would not be suitable for diagnostic evaluation after this
time.
Analyses were conducted using the program SURVIV (White, 1983). We constructed a
global and four candidate models to determine the best approximating model relating decoy
detection and reporting to area type (urban or rural) and time (July or September) (Table 1-1).
Our global model included both variables and each candidate model included either area or
neither variable. Assumptions associated with these models included decoys still present had not
been found and decoys missing were found but not reported. Thus, the “detection” of decoys
was calculated by adding the number reported and the number missing but unreported. We used
the information-theoretic approach to model selection described in Burnham and Anderson
(2002). Akaike’s Information Criteria (AIC) values were calculated to evaluate and select the
most parsimonious model (Burnham and Anderson, 2002). We ranked all models according to
AIC values, with the lowest value representing the best approximating model. Akaike weights
(wi) were calculated to determine the weight of evidence in favor of each model (Burnham and
14
Page 23
Anderson, 2002). The model with the highest weight of evidence (range 0-1) is deemed the most
plausible given the data and set of candidate models.
Carcass persistence and fate
Persistence and fate of American crow and house sparrow carcasses were evaluated in the
vicinity of Athens, Georgia (Clarke County) in July and September 2004. Clarke, Madison, and
Oconee counties are located in the Piedmont province of Georgia approximately 50 km east of
DeKalb County (Figure 1-1). The Athens vicinity, including Clarke and portions of Madison
and Oconee counties, were divided into urban and rural areas designed to be similar to those
used in the decoy detection and reporting portion of this study. Urban and rural designations
were based on land uses derived from LANDSAT data (NRSAL IOE UGA, 2004).
American crow carcasses were donated by a crow hunting guide located in Milledgeville,
Georgia and were frozen within 24 hours after death. House sparrow carcasses were collected by
Southeastern Cooperative Wildlife Disease Study personnel and frozen within 24 hours after
death. Because actual dead birds were used for this portion of the study, sites used for carcass
placement were dependent on landowner permission and were not chosen randomly. Carcass
placement sites included locations such as neighborhood residential lots, parks, farms, and
forests. Each crow carcass was always paired with a house sparrow carcass. Smaller sites, such
as neighborhood residential lots, were used for the placement of one pair of carcasses. Sites
greater than 16.2 ha in size were allotted two pairs of carcasses; however, one 323.8 ha site was
allotted three pairs of carcasses. The minimum of 16.2 ha for two carcass pairs was chosen
arbitrarily but with the intention of ensuring spatial independence of the pairs. The crow and
sparrow carcasses of each pair were also spatially separated as far as possible (at least 40 m
apart) for each site. Often carcass placement on a particular site was dependent on landowner
15
Page 24
restrictions. When a second pair of carcasses was placed on a site, they were placed in a
different area within that site, as far apart as size or landowner preference would allow (at least
100 m apart).
Carcass persistence and fate was evaluated twice, once in July (trial 1) and once in
September (trial 2). For each trial, 48 carcasses of each species were placed in both urban and
rural land use areas, totaling 96 carcass placements per trial, and 192 carcass placements after
both trials had been completed. Carcass placement sites were used twice, once in July and once
in September. Each trial consisted of three independent carcass placement sessions in which 16
crow and 16 sparrow carcasses were used and evaluated for a period of six days. Subdivision
into the three sessions was done so that random events, such as extreme weather conditions,
would not bias data collection and so that a larger number of photographic records of carcass fate
could be obtained (see below).
For each carcass, the date, carcass number, site name and number, site category, and a
general description of the carcass placement location were recorded. Carcasses were monitored
daily for 6 days and the date, carcass number, site name, site category, and carcass presence or
absence was recorded. Once a carcass was determined to be missing, monitoring ceased.
Carcasses were considered missing if they were no longer present or if they were damaged by
insects to the point that they would no longer be suitable for diagnostic evaluation. At the end of
6 days, carcasses were either removed or left in the environment, dependent on landowner
requests.
Data analyses were conducted using the known fate model of program MARK (White
and Burnham, 1999). We constructed a global and seven candidate models to determine the best
approximating model relating carcass persistence rates to species (crow and sparrow), area
16
Page 25
(urban and rural), day of exposure (0-6), and time (July and September) (Table 1-2). Our global
model included all four variables and each candidate model was a variation on the global model.
Persistence rates were calculated as proportions of dead birds remaining each day. We used the
information-theoretic approach to model selection described in Burnham and Anderson (2002).
Akaike’s Information Criteria (AICc) values for small samples were calculated to evaluate and
select the most parsimonious model (Burnham and Anderson, 2002). We ranked all models
according to AICc values, with the lowest value representing the best approximating model.
Akaike weights (wi) were calculated to determine the weight of evidence in favor of each model
(Burnham and Anderson, 2002). The model with the highest weight of evidence (range 0-1) is
deemed the most plausible given the data and set of candidate models. Model averaging was
used to incorporate model selection uncertainty directly into the parameter estimates using the
Akaike weights (Burnham and Anderson, 2002). We used wi values to weight the parameter
estimates and variances from each model.
Sixteen motion and heat sensitive trail cameras, model DeerCam (NonTypical, Inc., Park
Falls, WI), were used to monitor a subsample of the carcasses to obtain photographic evidence of
scavengers. Cameras were mounted vertically on a tree, approximately 0.3 m from the ground,
and were programmed to record date and time on each photograph and to reset every 15 seconds.
Carcasses were placed approximately 2 m away from the camera. Approximately half of the
carcasses were monitored by camera each week. More crow carcasses than sparrow carcasses
were monitored, approximately 12 crows and 4 sparrows per week, because most WNV
monitoring using wild birds is focused on crows. Cameras were collected either at the point the
carcass was determined to be missing or at the end of the 6-day monitoring period.
17
Page 26
Photographs were reviewed for each carcass and all species visiting each carcass were
recorded in chronological order and determined to be investigative or incidental (i.e. walking
by). The last known scavenging species visiting each carcass before it was missing also was
noted. The fate of the carcass was determined to be “known” if photographs depicted either of
two scenarios: 1) a scavenger removing or scavenging upon the carcass or 2) a scavenger as the
last known species visiting the carcass before it was missing. “Scavenging pressure” for urban
and rural environments was estimated based on the combined number of visits of scavenging
species per camera night.
RESULTS
Decoy detection and reporting
The proportion of decoys categorized as detected and reported, missing but unreported, or
still present but unreported are presented in Table 1-3. The models indicated no difference
between trials, so the results of both trials were combined. The model containing only the area
variable best approximated (95% probability) decoy detection and reporting (Table 1-4) and
indicated that both detection and reporting were lower in the rural area than in the urban area.
This model was 19 times more likely than the next approximating model, and 100 times more
likely than the remaining three models which received no empirical support ( i > 7, wi ≤ 0.01).
The estimates from the best approximating model indicated that the proportion of decoys
detected in the urban area (0.6, SE=0.024, 95% CI: 0.557 to 0.653) was approximately twice that
of the rural area (0.3, SE=0.023, 95% CI: 0.248 to 0.337). The estimates from the best
approximating model indicated that the proportion of decoys reported in the urban area (0.3,
18
Page 27
SE=0.029, 95% CI: 0.217 to 0.329) was approximately three times that of the rural area (0.1,
SE=0.028, 95% CI: 0.048 to 0.158).
There were 12 decoys reported after seven days that were excluded from analysis.
Almost all (11 of 12) of these reports were from the urban area. A total of 16 decoys categorized
as missing but unreported were found moved from their original location. Examples of these
“moved” decoys included placement on shrubs near houses, on a stick in a garden, and on a stick
in a back yard. In all cases, movements were noted as most likely due to human involvement;
however, none of the “moved” decoys were reported. Overall, 14 decoys in the urban area and 2
decoys in the rural area were considered “moved”.
Carcass persistence and fate
Overall, by the end of both trials, 71 of 96 (74%) of all crow carcasses were removed and
87 of 96 (91%) of all sparrow carcasses had been removed (Tables 1-5 and 1-6). Crow carcass
losses were 52% and 29% after day one and 65% and 48% after day two, in rural and urban
areas, respectively (Table 1-5). Sparrow carcass losses were 54% and 23% after day one and
75% and 67% after day two, in rural and urban areas, respectively (Table 1-6). Crow carcasses
persisted an average of 1.5 days in the rural area and 2.1 days in the urban area. Sparrow
carcasses persisted an average of 1.7 and 2.1 days in rural and urban areas, respectively.
The models indicated no difference between trials, so the results of both trials were
combined. The best approximating model (54% probability) estimating carcass persistence rates
contained species and days of exposure variables (Table 1-7) and indicated that crow and
sparrow carcasses differed in their persistence rates and that persistence rates were not consistent
over the days of exposure. Weight of evidence in favor of this model was only 1.2 times greater
than that of the next approximating model, indicating some uncertainty in selection of the best
19
Page 28
candidate model. The second best model (44% probability) contained area and days of exposure
variables (Table 1-7) and indicated that urban and rural areas differed in their persistence rates
and that persistence rates were not consistent over the days of exposure. The third best model
received only marginal support and the remaining five models received no empirical support ( i
> 7, wi ≤ 0.01).
Figure 1-2 shows the model-averaged estimates for the parameters used to model carcass
persistence rates over each day of exposure. Parameter estimates indicated that carcass losses
were greatest over the first day of exposure and that thereafter carcass persistence increased over
time. In the first day of exposure, persistence rates were lower in rural areas than urban areas.
Over the second through fourth days of exposure, sparrow carcasses persisted at lower rates than
crow carcasses and persistence did not appear to be greatly affected by area. Few changes in
persistence were noted over the final two days of exposure.
There were a total of 96 and 101 camera nights compiled monitoring crow carcasses for
rural and urban areas, respectively, which captured photographic evidence of seven scavenging
species (Table 1-8). Virginia opossums (Didelphis virginiana) accounted for most of the visits
in both rural (42%) and urban (52%) areas, followed by domestic cats (Felis catus) and raccoons
(Procyon lotor) for both areas (Table 1-8). Of the opossum visits, 50% of the rural visits and
43% of the urban visits resulted in the removal of the carcass, accounting for 64% of all
documented crow carcass removals. Raccoons accounted for 23% of all documented crow
carcass removals. Although insect damage (predominantly ants) was observed, none of the crow
carcasses were completely destroyed by insects. Overall, “scavenging pressure” for crow
carcasses was 40% (38 scavenger visits/96 camera nights) in the rural area and 27% (27
20
Page 29
scavenger visits/101 camera nights) in the urban area. Multiple scavengers were recorded
visiting an individual carcass 11 times in the rural area and 6 times in the urban area.
There were a total of 23 and 22 camera nights compiled monitoring sparrow carcasses for
rural and urban areas, respectively, which captured photographic evidence of two scavenging
species (Table 1-8). Insect activity (ants) destroyed 27% of the sparrow carcasses, including
21% and 33% in rural and urban areas, respectively. Overall, “scavenging pressure” for sparrow
carcasses was 17% (4 scavenger visits/23 camera nights) in the rural area and 14% (3 scavenger
visits/22 camera nights) in the urban area. Multiple scavengers were recorded visiting an
individual carcass one time in the rural area and one time in the urban area.
Forty-six of the 72 (64%) total recorded scavenger visits did not result in the removal of a
carcass. Examples of photographic evidence of scavenger visits are shown in Figure 1-3.
Incidental visits recorded to carcasses included one American robin (Turdus migratorius), one
ovenbird (Seiurus aurocapillus), one armadillo (Dasypus novemcinctus), two eastern chipmunks
(Tamias striatus), two eastern cottontail rabbits (Sylvilagus floridanus), 11 eastern gray squirrels
(Sciurus carolinensis), 33 white-tailed deer (Odocoileus virginianus), and two unknown species
where photographs were too blurred for identification.
DISCUSSION
Decoy detection and reporting
The reporting of dead wild birds has proven to be a valuable tool for monitoring WNV
activity and subsequently assessing the potential for human risk, as well as for guiding public
education and mosquito control programs (Eidson et al., 2001a; Eidson et al., 2001b; Guptill et
al., 2003; Watson et al., 2004). However, our study demonstrates that passive surveillance
21
Page 30
markedly underestimates the extent of total mortality of dead birds and, thus, the extent and
intensity of WNV activity. In this study, 43% of known “dead crows” were detected but only
10% were reported to the local public health agency. These results are generally in accord with
findings of prior studies evaluating active searches for bird carcasses. Searchers in a Texas
marsh located 6% of duck carcasses while 32% of dummy waterfowl carcasses were found in a
Saskatchewan, Canada wetland (Stutzenbacher et al., 1986; Cliplef and Wobeser, 1993).
However, Linz et al. (1991) reported a finding rate of 81% for red-winged blackbird (Agelaius
phoeniceus) carcasses in cattail (Typha spp.) marshes, and Tobin and Dolbeer (1990) reported
75% of songbird carcasses placed beneath orchard trees were found. Although 43% of our
decoys were found, only a small percentage was reported. Thus, the success of a dead bird
surveillance system depends not only on people detecting dead birds, but also on their
knowledge and interest in reporting them (Eidson et al., 2001a; Mostashari et al., 2003).
Based on prior dead bird surveillance in DeKalb County, the perceived distribution of
WNV was that more virus activity occurred in urban areas than rural areas. In our study, the
model receiving the most support indicated that decoys were more likely to be both detected and
reported in urban areas. The model indicated that urban detection was approximately twice and
that reporting was approximately three times that of the rural area when both areas had the same
number of distributed “dead crows”. Therefore, the same level of WNV activity is far more
likely to be detected in urban areas than in rural areas. This strongly suggests that human density
and associated factors should be considered when interpreting dead wild bird surveillance for
WNV.
In this study, the decoys categorized as still present but unreported were the best measure
of dead birds that were undiscovered. In the rural area, the majority of unreported decoys were
22
Page 31
in this category, which is consistent with the assumption that rural areas are less frequented by
humans and, thus, dead birds are less likely to be found (Eidson et al., 2001a, Guptill et al., 2003;
Mostashari et al., 2003). In contrast, unreported decoys in the urban area were approximately
evenly distributed between the still present and the missing but unreported categories. The
proportion of decoys detected but not reported was the best measure of non-reporting bias; and a
higher non-reporting bias occurred in the rural landscape. Thus, rural residents were less likely
to report a detected decoy than urban residents; however, the reasons for this differing behavioral
response are unknown.
There are several concerns with the interpretation and application of findings from the
present study. First, crow decoys were used instead of actual crow carcasses. Decoys may be
more or less likely to be picked up and investigated than an actual carcass and this may have
influenced study results. The movement of some decoys suggests human involvement and
indicates that decoys were not treated as real dead birds. The fact that none of these were
reported may demonstrate a lack of concern or knowledge regarding WNV surveillance.
Second, varied socioeconomic characteristics within the study area also may have influenced
results by creating a reporting bias. A paired comparison of decoys with actual dead crows
during this study could have provided information related to differing responses to simulated
versus real crows; however, the use of actual dead crow carcasses was not feasible during this
research.
The impacts of WNV on crow populations are not completely understood. Field studies
have demonstrated that WNV can severely impact local crow populations, reducing them by as
much as 40 to 68% (Caffrey et al., 2003; Yaremych et al., 2004). In an analysis of Christmas
Bird Count data from 1989 through 2002 that focused on ten resident species in areas of
23
Page 32
documented WNV activity, American crows and great horned owls (Bubo virginianus) showed
weak region-wide declines whereas most other species showed only local declines (Caffrey and
Peterson, 2003). Caffrey and Peterson (2003) were unable to demonstrate population level
conservation concerns for any of the species examined. Because the number of decoys was
known, the present study provided a unique opportunity to calculate how many unreported crow
decoys each reported decoy represented. Within the urban area, each decoy report represented
four unreported decoys whereas in the rural area, each decoy report represented 30 unreported
decoys. Using these ratios as guidelines, it would be possible to calculate crude estimates for the
total number of dead crows based on the number of dead crows that are reported. However,
estimation of mortality and determining the actual long term impacts of WNV on crow
populations or other avian communities will require additional study.
Carcass persistence and fate
In our study, most carcasses (82%) disappeared or were decayed within 6 days. Balcomb
(1986) reported that 92% of songbird carcasses were removed by scavengers within 5 days, and
of these, 58% were without observable remains. Tobin and Dolbeer (1990) found that 75% of
songbird carcasses were completely removed within 12 days, and an additional 12% had only
feathers remaining. Of 275 chick carcasses, only two carcasses that had been in place for over
24 hours were found (Wobeser and Wobeser, 1992). Intact carcasses are important for
diagnostic evaluation and, thus, mortality estimates may be limited by the fact that few persist
past a few days (Wobeser and Wobeser, 1992). Furthermore, this emphasizes the need to
investigate outbreaks quickly if a large proportion of birds are to be detected (Balcomb, 1986;
Tobin and Dolbeer, 1990; Wobeser and Wobeser, 1992).
24
Page 33
In our study, rural carcasses persisted approximately 1.6 days and urban carcasses
persisted an average of 2.1 days. Sixty-four percent of all carcasses were removed by day two.
These findings support the conclusions of Stuzenbacher et al. (1986), who stated that carcasses
are quickly incorporated into the environment. In their study of 47 duck carcasses in a Texas
wetland, 62% of the carcasses were gone in 3 days. Similarly, Balcomb (1986) found rapid
initial disappearance of songbird carcasses in agricultural fields in Maryland. At one day after
placement, 75% of all carcasses were gone. In contrast, Tobin and Dolbeer (1990) examined
songbird carcass survival in cherry and apple orchards and found mean survival times for
carcasses were 8.2 days and 10.4 days, respectively. However, none of 25 carcasses placed in
one of the study orchards were found the next day, implying variable rates of persistence even
within a single study. The rate of carcass removal can be highly variable and site specific;
therefore, it should be measured in an area before mortality estimates are made (Wobeser and
Wobeser, 1992).
In our study, two models received approximately equal support and these models
indicated that carcass persistence rates were affected by species and number of days of exposure
and by area and number of days of exposure, respectively. To incorporate model selection
uncertainty and the uncertainty associated with parameter estimates within each model, we used
model-averaged parameter estimates to examine carcass persistence rates. Parameter estimates
indicated that carcass losses were greatest over the first day of exposure and that thereafter
carcass persistence increased over time. Similar results were reported by Balcomb (1986), who
found that songbird carcass losses were markedly greater during the first 24-hour period and that
the rate of carcass disappearance was not uniform over a 5-day study period. Balcomb (1986)
suggested that high initial losses might be best explained by scavenger foraging behaviors. If
25
Page 34
scavengers maintain regular hunting territories or search routes, then carcasses will be quickly
detected within those areas; however, carcasses located outside of these territories will probably
disappear at slower rates (Balcomb, 1986). Our estimates also indicated that initially, rural areas
had higher disappearance rates than urban areas. This pattern might occur in areas with higher
scavenger density and, in our study, “scavenging pressure” was higher in rural areas. After the
initial 24-hour period, sparrow carcass persistence rates were lower than persistence rates of
crow carcasses. Small carcasses, such as sparrows, may have a wider range of potential
scavengers than larger species. Furthermore, because of their smaller mass, sparrow carcasses
may be more rapidly destroyed by insects and bacteria.
There was little variation in the composition of scavenging species or their visits between
urban and rural areas for crow carcasses. Since opossums and raccoons are common species and
also are well adapted to human environments, it was not surprising that they accounted for most
of the crow carcass removals. Domestic cats and insects were the major causes of sparrow
carcass removals, of which neither were major causes of crow carcass removals. The use of
cameras may have affected study results, and in particular may explain the high percentage of
scavenger visits (64%) that did not result in the removal of a carcass and the multiple scavenger
visits to individual carcasses. Camera flash and/or noise at the time of the photograph may have
startled scavengers. Wary species presumably would be less likely to remain with or return to
carcasses after being startled. For example, the coyote (Canis latrans) and red-tailed hawk
(Buteo jamaicensis) visits did not result in carcass removal. However, less cautious species such
as opossums, raccoons, and domestic cats may not be deterred by unusual events.
The entire host range of WNV, as well as all means of transmission of the virus in the
wild, remains to be completely understood. Under laboratory conditions, crows were
26
Page 35
experimentally infected with WNV by oral and contact transmission routes (McLean et al., 2001;
Komar et al. 2003). Infected crows were shown to have high viral loads in numerous organs,
which may increase the likelihood for oral transmission of WNV to scavengers (Komar et al.
2003). In our study, we documented six mammalian and one avian species scavenging carcasses
over a 6-day observation period. Freshly dead wild birds could represent potential sources of
oral WNV exposure to scavenging species, and this route of exposure could possibly increase the
prevalence of infection among scavengers in the wild.
ACKNOWLEDGEMENTS
We would like to thank the DeKalb County Board of Health, especially J. Willis, for
assistance with project design and the donation of personnel time to the project. We are grateful
to all those involved with the decoy placement and monitoring, especially C. Comer, G.
D’Angelo, R. Edalgo, and R. Gerhold. We are thankful to J. Tomlin for providing the crow
carcasses and to SCWDS personnel for providing the sparrow carcasses. We thank D. Osborn for
the cameras used in this project. This project would not have been possible without those who
allowed us to use their lands for carcass placement, and we are extremely grateful to all those
participants. This research was supported in part by a cooperative agreement (contract 427-93-
45142) with the Georgia Department of Human Resources and in part by the D. B. Warnell
School of Forest Resources, The University of Georgia. Additional project support was through
sponsorship of the Southeastern Cooperative Wildlife Disease Study (SCWDS), College of
Veterinary Medicine, The University of Georgia by the fish and wildlife agencies of Alabama,
Arkansas, Florida, Georgia, Kansas, Kentucky, Louisiana, Maryland, Mississippi, Missouri,
27
Page 36
North Carolina, Ohio, Puerto Rico, South Carolina, Tennessee, Virginia, and West Virginia.
Funds were provided to SCWDS by the Federal Aid to Wildlife Restoration Act (50 Stat. 917).
REFERENCES
BALCOMB, R. 1986. Songbird carcasses disappear rapidly from agricultural fields. Auk
103: 817-820.
BURNHAM, K. P., AND D. R. ANDERSON. 2002. Model selection and inference: a practical
information-theoretic approach, second edition. Springer-Verlag, New York, New York,
488 pp.
CAFFREY, C., T. J. WESTON, AND S. C. R. SMITH. 2003. High mortality among marked
crows subsequent to the arrival of West Nile virus. Wildlife Society Bulletin 31: 870-
872.
_____, AND C. C. PETERSON. 2003. Christmas bird count data suggest West Nile virus may
not be a conservation issue in northeastern United States. In American Birds: The 103rd
Christmas Bird Count, 2002-2003, pp 14-21. (8 November 2004;
www.audubon.org/bird/cbc/pdf/103_d-wnvanalysis.pdf).
CLIPLEF, D. J., AND G. WOBESER. 1993. Observations on waterfowl carcasses during a
botulism epizootic. Journal of Wildlife Diseases 29: 8-14.
EIDSON, M., L. KRAMER, Y. HAGIWARA, K. SCHMIT, AND W. STONE. 2001a. Dead
bird surveillance as an early warning system for West Nile virus. Emerging
Infectious Diseases 7: 631-636.
_____, N. KOMAR, F. SORHAGE, R. NELSON, T. TALBOT, F. MOSTASHARI, R.
MCLEAN, AND THE WEST NILE VIRUS AVIAN MORTALITY SURVEILLANCE
28
Page 37
GROUP. 2001b. Crow deaths as a sentinel surveillance system for West Nile virus in
the northeastern United States, 1999. Emerging Infectious Diseases 7: 615-620.
GUPTILL, S. C., K. G. JULIAN, G. L. CAMPBELL, S. D. PRICE, AND A. A. MARFIN.
2003. Early-season avian deaths from West Nile virus as warnings of human infection.
Emerging Infectious Diseases 9: 483-484.
KOMAR, N., S. LANGEVIN, S. HINTEN, N. NEMETH, E. EDWARDS, D. HETTLER, B.
DAVIS, R. BOWEN, AND M. BUNNING. 2003. Experimental infection of North
American birds with the New York 1999 Strain of West Nile virus. Emerging Infectious
Diseases 9: 311-322.
LINZ, G., J. E. DAVIS, JR., R. M. ENGEMAN, D. L. OTIS, AND M. L. AVERY. 1991.
Estimating survival of bird carcasses in cattail marshes. Wildlife Society Bulletin 19:
195-199.
MCLEAN, R. G., S. R. UBICO, D. E. DOCHERTY, W. R. HANSEN, L. SILEO, AND T. S.
MCNAMARA. 2001. West Nile virus transmission and ecology in birds. Annals of the
New York Academy of Science 951: 54-57.
MOSTASHARI, F., M. KULLDORFF, J. J. HARTMAN, J. R. MILLER, AND V.
KULASEKERA. 2003. Dead bird clusters as an early warning system for West Nile
virus activity. Emerging Infectious Diseases 9: 641-646.
NATURAL RESOURCES SPATIAL ANALYSIS LABORATORY (NRSAL), INSTITUTE OF
ECOLOGY (IOE), UNIVERSITY OF GEORGIA (UGA). 2004. Georgia Land Use
Trends. (20 June 2004; narsal.ecology.uga.edu/glut/maps_counties.html).
PHILIBERT, H., G. WOBESER, AND R. G. CLARK. 1993. Counting dead birds: examination
of methods. Journal of Wildlife Diseases 29: 284-289.
29
Page 38
SAITO, E. K., K. A. CONVERSE, C. J. LEMANSKI, AND D. E. DOCHERTY. 2004. Avian
West Nile virus surveillance at the NWHC: A 5-year summary. In Proceedings of the
American Association of Zoo Veterinarians, American Association of Wildlife
Veterinarians, and Wildlife Disease Association Joint Conference, C. K. Baer (ed.). San
Diego, California, p. 216.
STUZENBAKER, C. D., K. BROWN, AND D. LOBPRIES. 1986. Special report: an
assessment of the accuracy of documenting waterfowl die-offs in a Texas coastal marsh.
In Lead poisoning in wild waterfowl—A workshop, J. S. Feierabend and A. B. Russell
(eds.). National Wildlife Federation, Washington, D. C., pp. 88-95.
THEOPHILIDES, C. N., S. C. AHEARN, S. GRADY, AND M. MERLINO. 2003. Identifying
West Nile virus risk areas: the Dynamic Continuous-Area Space-Time System.
American Journal of Epidemiology 157: 843-854.
TOBIN, M. E., AND R. A. DOLBEER. 1990. Disappearance and recoverability of songbird
carcasses in fruit orchards. Journal of Field Ornithology 61: 237-242.
U. S. CENSUS BUREAU. 2004. Georgia Quick Facts: DeKalb County. (8 November 2004;
quickfacts.census.gov/qfd/states/13/13089.html).
WATSON, J. T., R. C. JONES, K. GIBBS, AND W. PAUL. 2004. Dead crow reports and
location of human West Nile virus cases, Chicago, 2002. Emerging Infectious Diseases
10: 938-940.
WHITE, G. C. 1983. Numerical estimation of survival rates from band-recovery and
biotelemetry data. Journal of Wildlife Management 47: 716-728.
_____, AND K. P. BURNHAM. 1999. Program MARK: Survival estimation from
populations of marked animals. Bird Study 46 Supplement, pp. 120-138.
30
Page 39
WOBESER, G. A., AND A. G. WOBESER. 1992. Carcass disappearance and estimation of
mortality in a simulated die-off of small birds. Journal of Wildlife Diseases
28: 548-554.
YAREMYCH, S. A., R. E. WARNER, P. C. MANKIN, J. D. BRAWN, A. RAIM, AND R.
NOVAK. 2004. West Nile virus and high death rate in American crows. Emerging
Infectious Diseases 10: 709-711.
31
Page 40
Table 1-1. Alternative models for predicting decoy detection and reporting in urban and rural
areas of DeKalb County, Georgia in 2003.
Decoy detection (D) and reporting (R) vary by area (a) and by time (July or September) (t).
{D(a*t) R(a*t)}
Decoy detection and reporting vary by area only, time has no effect.
{D(a) R(a)}
Decoy detection varies by area only, decoy reporting is unaffected by area or time.
{D(a) R(.)}
Decoy detection is unaffected by area or time, decoy reporting varies by area only.
{D(.) R(a)}
Decoy detection and reporting are unaffected either by area or time.
{D(.) R(.)}
32
Page 41
Table 1-2. Alternative models for predicting crow and sparrow carcass persistence rates in urban
and rural areas of Clarke, Madison, and Oconee counties, Georgia in 2004.
Carcass persistence varies by species (spp), area (a), time (July or September) (t), and days of
exposure (0-6) (e).
{S(spp*a*t*e)}
Carcass persistence varies by species, area, and time only.
{S(spp*a*t)}
Carcass persistence varies by species (spp) and days of exposure.
{S(spp*e)}
Carcass persistence varies by area (a) and days of exposure.
{S(a*e)}
Carcass persistence varies by days of exposure only.
{S(e)}
Carcass persistence varies by species only.
{S(spp)}
Carcass persistence varies by area only.
{S(a)}
Carcass persistence is unaffected by species, area, time, or days of exposure.
{S(.)}
33
Page 42
Table 1-3. Detection and reporting of crow decoys within 7 days in urban and rural areas of
DeKalb County, Georgia in 2003.
Decoys Placed Reported Still Present Missing/Unreported
Trial 1
Urban 200 34 (17%) 74 (37%) 92 (46%)
Rural 200 5 (2%) 146 (73%) 49 (25%)
Trial 2
Urban 200 32 (16%) 84 (42%) 84 (42%)
Rural 200 7 (3%) 137 (69%) 56 (28%)
Totals
Urban 400 66 (17%) 158 (39%) 176 (44%)
Rural 400 12 (3%) 283 (71%) 105 (26%)
34
Page 43
Table 1-4. Model selection results for models explaining influences of area and time on decoy
detection and reporting in DeKalb County, Georgia in 2003.
Model a Kb ln(likelihood) AIC i wic
{D(a) R(a)} 4 -20.90 49.8 0.00 0.95
{D(a*t) R(a*t)} 8 -19.82 55.6 5.80 0.05
{D(a) R(.)} 3 -28.32 62.6 12.80 0.00
{D(.) R(a)} 3 -61.08 128.2 78.40 0.00
{D(.) R(.)} 2 -68.50 141.0 91.20 0.00
a Abbreviations correspond to model candidates in Table 1-1.
b Number of estimating parameters in approximating model.
c Akaike weight.
35
Page 44
Table 1-5. Results of crow carcass persistence trials in Clarke, Madison, and Oconee counties,
Georgia in 2004.
Number remaining at daily checks after placement
Trial Area #Monitored 1 2 3 4 5 6
1 Rural 24 14 (58%) 10 (42%) 8 (33%) 7 (29%) 7 (29%) 7 (29%)
Urban 24 20 (83%) 14 (58%) 10 (42%) 10 (42%) 10 (42%) 8 (33%)
2 Rural 24 9 (38%) 7 (29%) 5 (21%) 4 (17%) 4 (17%) 4 (17%)
Urban 24 14 (58%) 11 (46%) 7 (29%) 6 (25%) 6 (25%) 6 (25%)
Total
Rural 48 23 (48%) 17 (35%) 13 (27%) 11 (23%) 11 (23%) 11 (23%)
Urban 48 34 (71%) 25 (52%) 17 (35%) 16 (33%) 16 (33%) 14 (29%)
36
Page 45
Table 1-6. Results of sparrow carcass persistence trials in Clarke, Madison, and Oconee
counties, Georgia in 2004.
Number remaining at daily checks after placement
Trial Area #Monitored 1 2 3 4 5 6
1 Rural 24 9 (38%) 6 (25%) 6 (25%) 4 (17%) 4 (17%) 4 (17%)
Urban 24 20 (83%) 11 (46%) 8 (33%) 4 (17%) 4 (17%) 4 (17%)
2 Rural 24 13 (54%) 6 (25%) 2 (8%) 0 (0%) 0 (0%) 0 (0%)
Urban 24 17 (71%) 5 (21%) 1 (4%) 1 (4%) 1 (4%) 1 (4%)
Total
Rural 48 22 (46%) 12 (25%) 8 (17%) 4 (8%) 4 (8%) 4 (8%)
Urban 48 37 (77%) 16 (33%) 9 (19%) 5 (10%) 5 (10%) 5 (10%)
37
Page 46
Table 1-7. Model selection results for models explaining influences of species, area, time, and
days of exposure on carcass persistence rates in Clarke, Madison, and Oconee counties, Georgia
in 2004.
Modela Kb AICc i wic
{S(spp*e)} 12 574.72 0.00 0.54
{S(a*e)} 12 575.11 0.39 0.44
{S(e)} 6 581.32 6.60 0.02
{S(spp*a*t*e)} 46 598.98 24.26 0.00
{S(spp*a*t)} 8 614.45 39.73 0.00
{S(spp)} 2 616.82 42.10 0.00
{S(a)} 2 623.18 48.46 0.00
{S(.)} 1 625.83 51.11 0.00
a Abbreviations correspond to model candidates in Table 1-2.
b Number of estimating parameters in approximating model.
c Akaike weight.
38
Page 47
Table 1-8. Documented scavenger visits to crow and sparrow carcasses in Clarke, Madison, and
Oconee counties, Georgia in 2004.a
Rural visitsb Consumedc Urban visitsb Consumedc
Crow
Coyote (Canis latrans) 1 (3%) 0 0 0
Domestic cat (Felis catus) 10 (26%) 1 9 (33%) 1
Domestic dog (Canis familiaris) 3 (8%) 0 1 (4%) 0
Gray fox (Urocyon cinereoargenteus) 0 0 1 (4%) 1
Raccoon (Procyon lotor) 7 (18%) 2 4 (15%) 3
Red-tailed hawk (Buteo jamaicensis) 1 (3%) 0 0 0
Virginia opossum (Didelphis virginiana) 16 (42%) 8 14 (52%) 6
Total 38 11 27 11
Sparrow
Domestic cat (F. catus) 3 (75%) 1 3 (33%) 2
Virginia opossum (D. virginiana) 1 (25%) 1 0 0
Total 4 2 3 2
a Data based on 96 and 101 crow carcass camera nights and 23 and 22 sparrow carcass
camera nights for rural and urban areas, respectively.
b Numbers in column represent number of visits (percent of total visits).
c Represent number of carcasses removed by corresponding scavenger.
39
Page 48
DeKalb
Figure 1-1. Land use areas and routes for decoy placement during crow decoy study in DeKalb
County, Georgia in July and September 2003 and location for crow and sparrow carcass
persistence and fate study in Clarke, Madison, and Oconee counties, Georgia in July and
September 2004.
40
Page 49
0.40
0.50
0.60
0.70
0.80
0.90
1.00
0 1 2 3 4 5 6
Days of Exposure
% C
arca
sses
Rem
aini
ng
Rural Crows
Urban Crows
Rural Sparrows
Urban Sparrows
Figure 1-2. Model-averaged parameter estimates for crow and sparrow carcass persistence rates
in urban and rural areas in Clarke, Madison, and Oconee counties, Georgia in 2004. Persistence
rates are based on the proportion of carcasses remaining from the preceding day. Error bars
represent one standard error.
41
Page 50
(a) (d)
(b) (e)
(c) (f)
Figure 1-3. Exemplar photographs of scavenging species obtained during carcass persistence
and fate study in Clarke, Madison, and Oconee counties, Georgia in 2004. (a) Gray fox (Urocyon
cinereoargenteus). (b) Domestic cat (Felis catus). (c) Red-tailed hawk (Buteo jamaicensis). (d)
Coyote (Canis latrans). (e) Raccoon (Procyon lotor). (g) Virginia opossum (Didelphis
virginiana).
42
Page 51
SUMMARY AND CONCLUSIONS
Surveillance of dead wild birds can be a valuable tool for monitoring WNV activity and
subsequently assessing the potential for human risk, as well as for guiding public education and
mosquito control programs (Eidson et al. 2001a, Eidson et al. 2001b, Guptill et al. 2003, Watson
et al. 2004). The success of a dead bird surveillance system depends not only on people
detecting dead birds, but also on their knowledge and interest in reporting them (Eidson et al.
2001a, Mostashari et al. 2003). Our study demonstrates that passive surveillance markedly
underestimates the extent of total mortality of dead birds and, thus, the extent and intensity of
WNV activity. Our findings also illustrate the need for active communication with the public to
optimize the use of dead wild birds as a surveillance tool.
Our study indicated that detection and reporting biases existed between urban and rural
landscapes in DeKalb County, Georgia in 2003. We found that urban areas were more likely to
detect as well as report crow decoys and presumably dead crows as well. Therefore, the same
level of WNV activity is far more likely to be detected in urban areas than in rural areas. The
observed biases strongly suggest that human density and associated factors should be considered
when interpreting dead wild bird surveillance for WNV.
In our study, most carcasses (82%) disappeared or were decayed by the end of the 6-day
study period. Intact carcasses are important for diagnostic evaluation and, thus, mortality
estimates may be limited by the fact that few persist (Wobeser and Wobeser 1992).
Furthermore, this emphasizes the need to investigate outbreaks quickly if a large proportion of
birds are to be detected (Balcomb 1986, Tobin and Dolbeer 1990, Wobeser and Wobeser 1992).
43
Page 52
Our study supported previous conclusions that carcasses are quickly incorporated into the
environment (Balcomb 1986, Stuzenbacher et al. 1986, Wobeser and Wobeser 1992). We found
that carcass species, environmental category, and exposure duration affected carcass persistence
rates. We found that crow and sparrow carcasses differed in persistence rates; specifically,
sparrows disappeared more rapidly than crows. Smaller carcasses may have a wider range of
potential scavengers than larger species and because of their smaller mass, may be more rapidly
destroyed by insects. We also found that rural areas had higher carcass disappearance rates than
urban areas; this appeared to be explained by higher “scavenging pressure” in our rural study
area. Last, we found that initial carcass losses were greatest over the first day of exposure but
thereafter persistence of remaining carcasses increased over time.
The entire host range of WNV, as well as all means of transmission of the virus in the
wild, remains to be completely understood. In our study, we documented six mammalian and
one avian species scavenging carcasses over a 6-day observation period. Dead wild birds, for
example crows, which develop high viral loads in numerous organs, could represent potential
sources of oral WNV infection to scavenging species (Komar et al. 2003).
This research demonstrated that landscape differences can affect detection and reporting
of dead birds. Carcass persistence can be affected by these same landscape differences, as well
as interspecific morphology and length of exposure. These variations are important concerns
relative to WNV surveillance and should be considered in interpretation of dead bird surveillance
data. It may be beneficial to assess areas for detection and reporting, as well as site-specific rates
of carcass removal, in order to more accurately estimate avian mortality or the extent of disease
occurrence.
44
Page 53
REFERENCES
Balcomb, R. 1986. Songbird carcasses disappear rapidly from agricultural fields. Auk 103:817-
820.
Bernard, K. A., J. G. Maffei, S. A. Jones, E. B. Kauffman, G. D. Ebel, A. P. Dupois II, K.
A. Ngo, D. C. Nicholas, D. M. Young, P. Shi, V. L. Kulaskera, M. Eidson, D. J. White,
W. B. Stone, NY State Surveillance Team, and L. K. Kramer. 2001. West Nile virus
infection in birds and mosquitoes, New York State, 2000. Emerging Infectious Diseases
7:679-685.
Bunning, M. L., R. A. Bowen, C. B. Cropp, K. G. Sullivan, B. S. Davis, N. Komar, M. S.
Godsey, D. Baker, D. L. Hettler, D. A. Holmes, B. J. Biggerstaff, and C. J. Mitchell.
2002. Experimental infection of horses with West Nile virus. Emerging Infectious
Diseases 8:380-386.
Campbell, G. L., A. A. Martin, R. S. Lanciotti, and D. J. Gubler. 2002. Reviews: West
Nile virus. Infectious Diseases 2:519-529.
Caffrey, C., T. J. Weston, and S. C. R. Smith. 2003. High mortality among marked crows
subsequent to the arrival of West Nile virus. Wildlife Society Bulletin 31:870-872.
Centers for Disease Control and Prevention (CDC). 2004a. West Nile Virus. (8 November
2004; www.cdc.gov/ncidod/dvbid/westnile/index.htm).
_____. 2004b. West Nile virus activity-United States, 2001. MMWR Morbidity and
Mortality Weekly Report 51:497-501.
45
Page 54
Cliplef, D. J., and G. Wobeser. 1993. Observations on waterfowl carcasses during a
botulism epizootic. Journal of Wildlife Diseases 29:8-14.
Eidson, M., L. Kramer, Y. Hagiwara, K. Schmit, and W. Stone. 2001a. Dead Bird
Surveillance as an Early Warning System for West Nile Virus. Emerging
Infectious Diseases 7:631-636.
_____, N. Komar, F. Sorhage, R. Nelson, T. Talbot, F. Mostashari, R. McLean, and the West
Nile Virus Avian Mortality Surveillance Group. 2001b. Crow deaths as a sentinel
surveillance system for West Nile virus in the northeastern United States, 1999.
Emerging Infectious Diseases 7:615-620.
Fields, B. N., P. M. Howley, D. E. Griffin, R. A. Lamb, M. A. Martin, B. Roizman, S. E.
Straus, and D. M. Knipe, editors. 2001. Fields – Virology. Lippincott Williams and
Wilkins Publishers, Portland, Oregon, USA.
Guptill, S. C., K. G. Julian, G. L. Campbell, S. D. Price, and A. A. Marfin. 2003. Early-season
avian deaths from West Nile virus as warnings of human infection. Emerging Infectious
Diseases 9:483-484.
Komar, N., S. Langevin, S. Hinten, N. Nemeth, E. Edwards, D. Hettler, B. Davis, R. Bowen, and
M. Bunning. 2003. Experimental infection of North American birds with the New York
1999 Strain of West Nile virus. Emerging Infectious Diseases 9:311-322.
Linz, G., J. E. Davis, Jr., R. M. Engeman, D. L. Otis, and M. L. Avery. 1991. Estimating
survival of bird carcasses in cattail marshes. Wildlife Society Bulletin 19:195-199.
Marra, P. P., S. Griffing, C. Caffrey, A. M. Kilpatrick, R. McLean, C. Brand, E. Saito, A. P.
Dupuis, L. Kramer, and R. Novak. 2004. West Nile virus and wildlife. Bioscience
54:393-402.
46
Page 55
McLean, R. G., S. R. Ubico, D. E. Docherty, W. R. Hansen, L. Sileo, and T. S. McNamara.
2001. West Nile virus transmission and ecology in birds. Annals of the New York
Academy of Science 951:54-57.
Mostashari, F., M. Kulldorff, J. J. Hartman, J. R. Miller, and V. Kulasekera. 2003. Dead bird
clusters as an early warning system for West Nile virus activity. Emerging Infectious
Diseases 9:641-646.
Pain, D. J. 1991. Why are lead-poisoned waterfowl rarely seen?: The disappearance of
waterfowl carcasses in the Camargue, France. Wildfowl 42:118-122.
Peiris, J. S., and F. P. Amerasinghe. 1994. West Nile Fever. Pages 139-148 In G. W. Beran
editor. Handbook of Zoonoses. CRC Press, Boca Raton, Florida, USA.
Philibert, H., G. Wobeser, and R. G. Clark. 1993. Counting dead birds: examination of
Methods. Journal of Wildlife Diseases 29:284-289.
Saito, E. K., K. A. Converse, C. J. Lemanski, and D. E. Docherty. 2004. Avian West Nile
virus surveillance at the NWHC: A 5-year summary. Page 216 In C. K. Baer, editor.
Proceedings of the American Association of Zoo Veterinarians, American Association of
Wildlife Veterinarians, and Wildlife Disease Association Joint Conference. San Diego,
California, USA.
Smithburn, K. C., T. P. Hughes, A. W. Burke, and J. H. Paul. 1940. A neurotropic virus
isolated from the blood of a native of Uganda. American Journal of Tropical
Medicine 20:471-492.
47
Page 56
Stuzenbaker, C. D., K. Brown, and D. Lobpries. 1986. Special report: an assessment of
the accuracy of documenting waterfowl die-offs in a Texas coastal marsh. Pages 88-95
In J. S. Feierabend and A. B. Russell, editors. Lead poisoning in wild waterfowl—A
workshop. National Wildlife Federation, Washington D.C., USA.
Taylor, R. M., T. H. Work, H. S. Hurlbut, and R. Rizk. 1956. A study of the ecology of
West Nile virus in Egypt. American Journal of Tropical Medicine and Hygiene
5:579-620.
Theophilides, C. N., S. C. Ahearn, S. Grady, and M. Merlino. 2003. Identifying West Nile virus
risk areas: the Dynamic Continuous-Area Space-Time System. American Journal of
Epidemiology 157:843-854.
Tobin, M. E., and R. A. Dolbeer. 1990. Disappearance and recoverability of songbird
carcasses in fruit orchards. Journal of Field Ornithology 61:237-242.
Watson, J. T., R. C. Jones, K. Gibbs, and W. Paul. 2004. Dead crow reports and location of
human West Nile virus cases, Chicago, 2002. Emerging Infectious Diseases 10:938-940.
Wobeser, G. A., and A. G. Wobeser. 1992. Carcass disappearance and estimation of
mortality in a simulated die-off of small birds. Journal of Wildlife Diseases
28:548-554.
_____. 1994. Investigation and management of disease in wild animals. Plenum
Press, New York, New York, USA.
Work, T. H., H. S. Hurlbut, and R. M. Taylor. 1955. Indigenous wild birds of the Nile
delta as potential West Nile virus circulating reservoirs. American Journal of Tropical
Medicine Hygiene 5:579-620.
48
Page 57
Yaremych, S. A., R. E. Warner, P. C. Mankin, J. D. Brawn, A. Raim, and R. Novak. 2004.
West Nile virus and high death rate in American crows. Emerging Infectious Diseases
10:709-711.
49

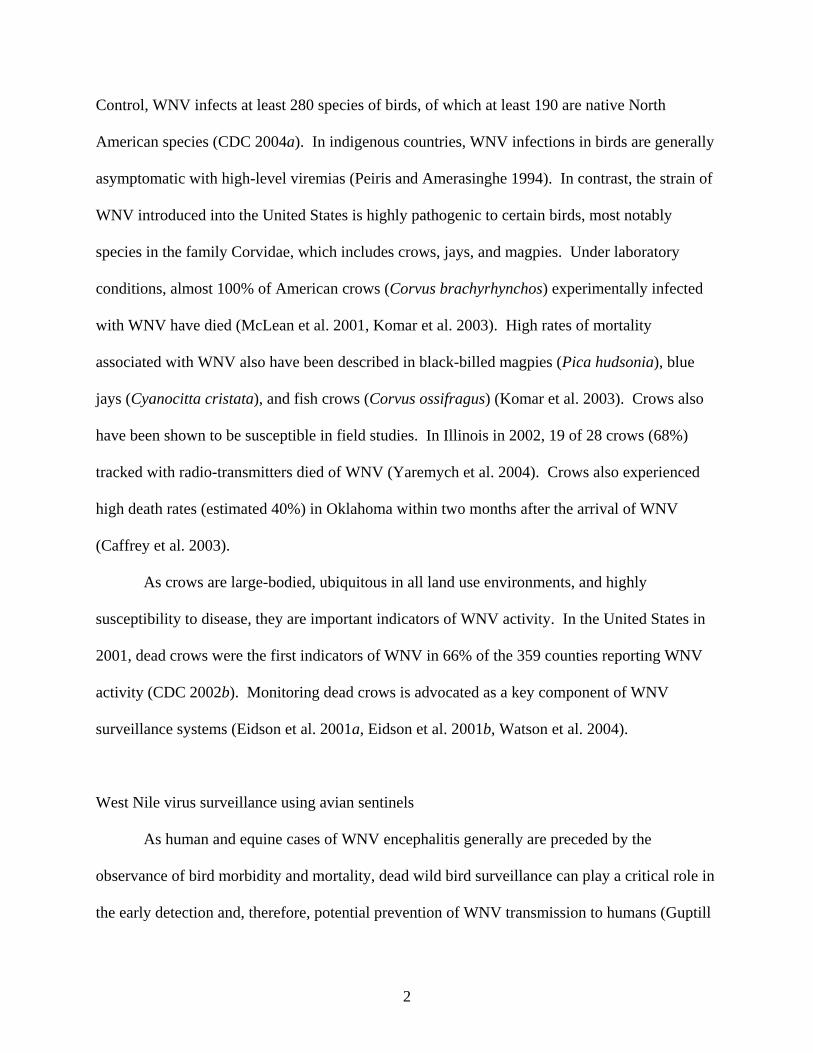
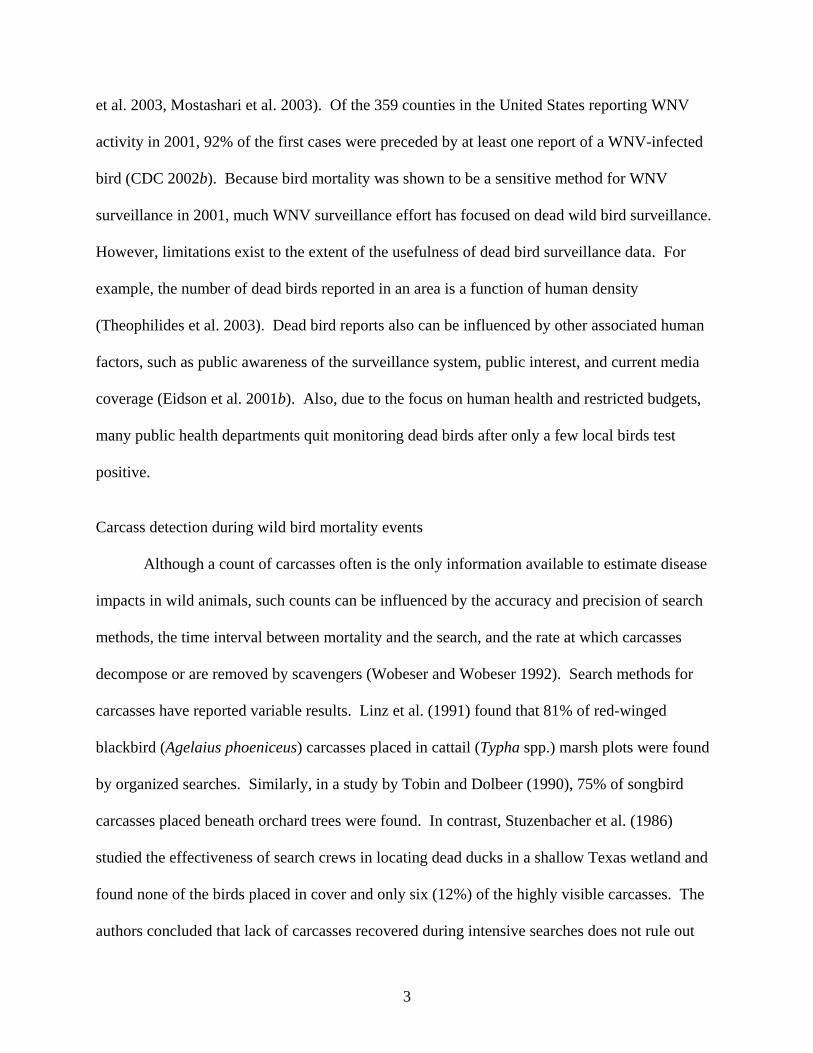
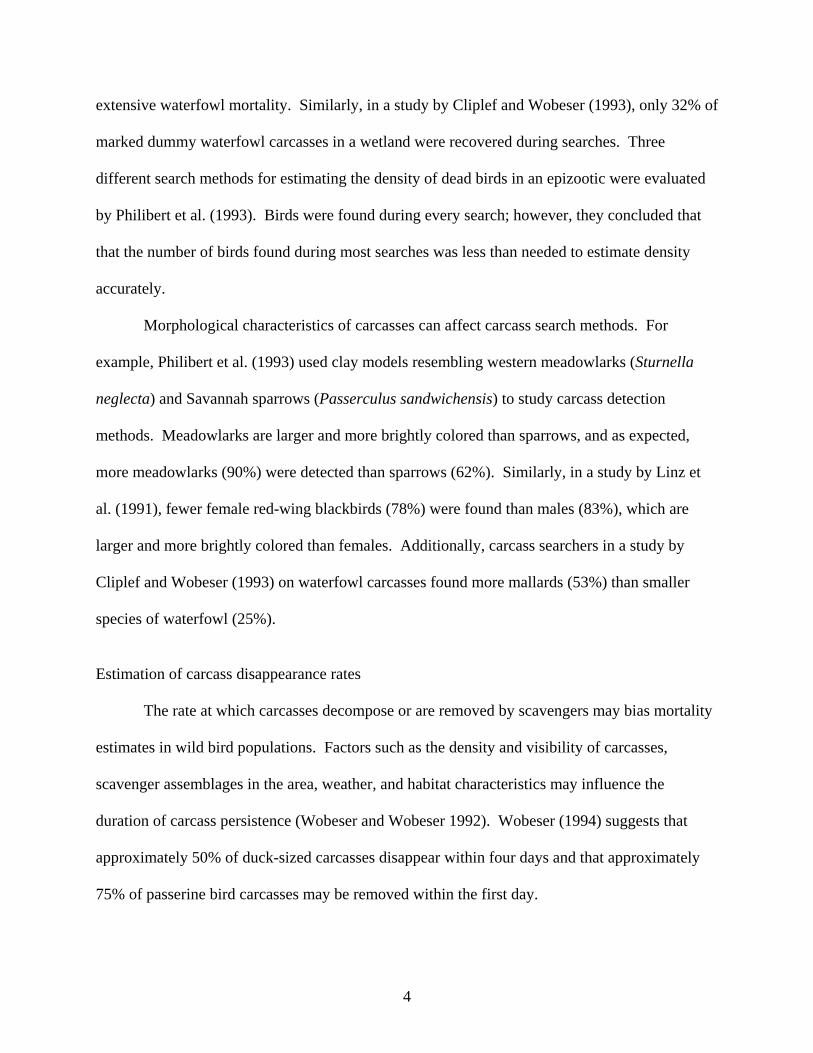
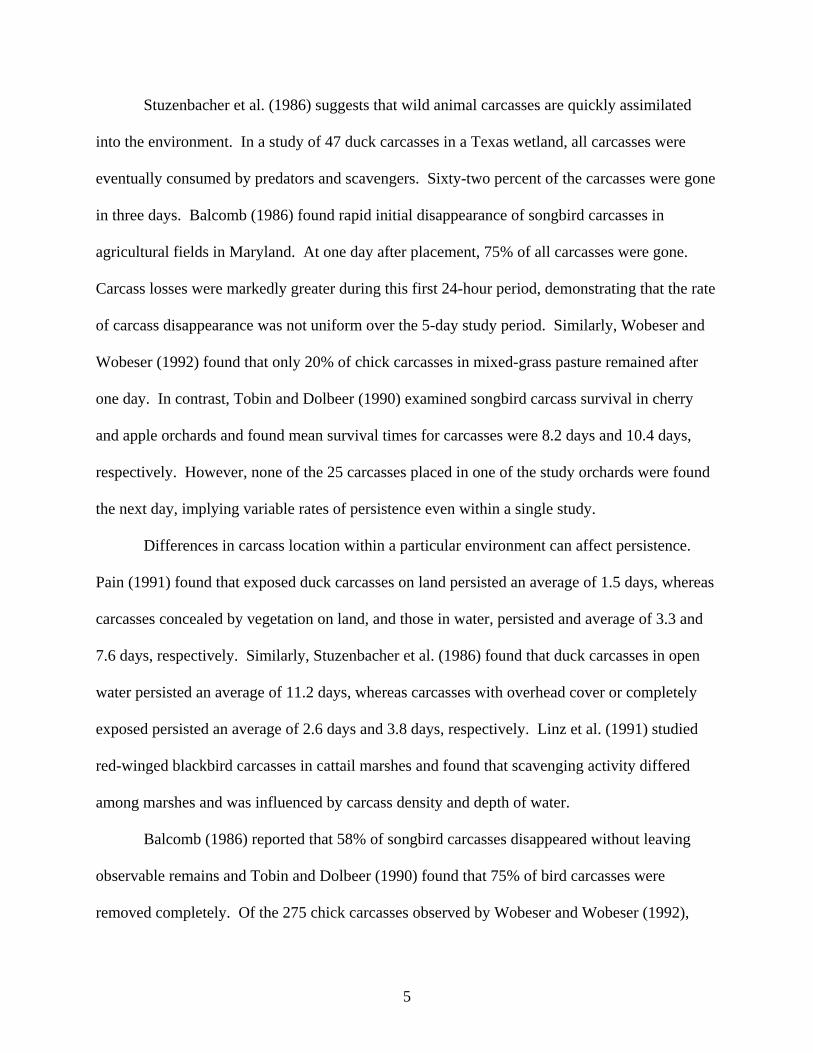

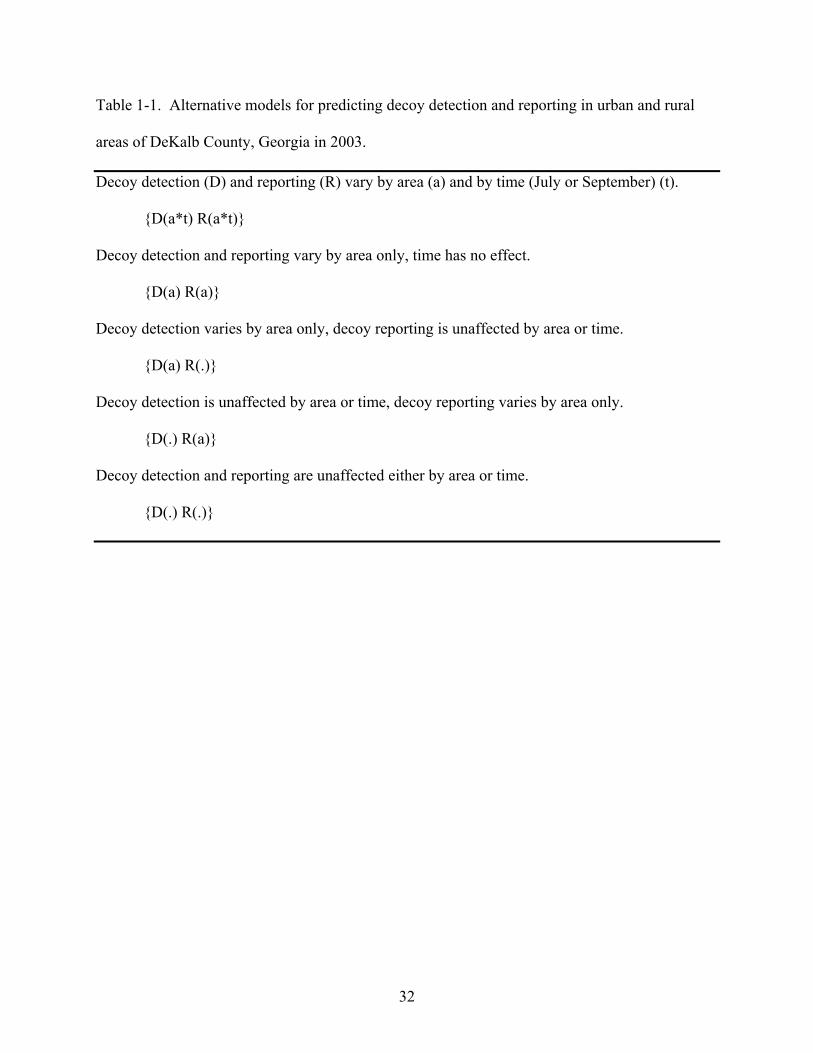
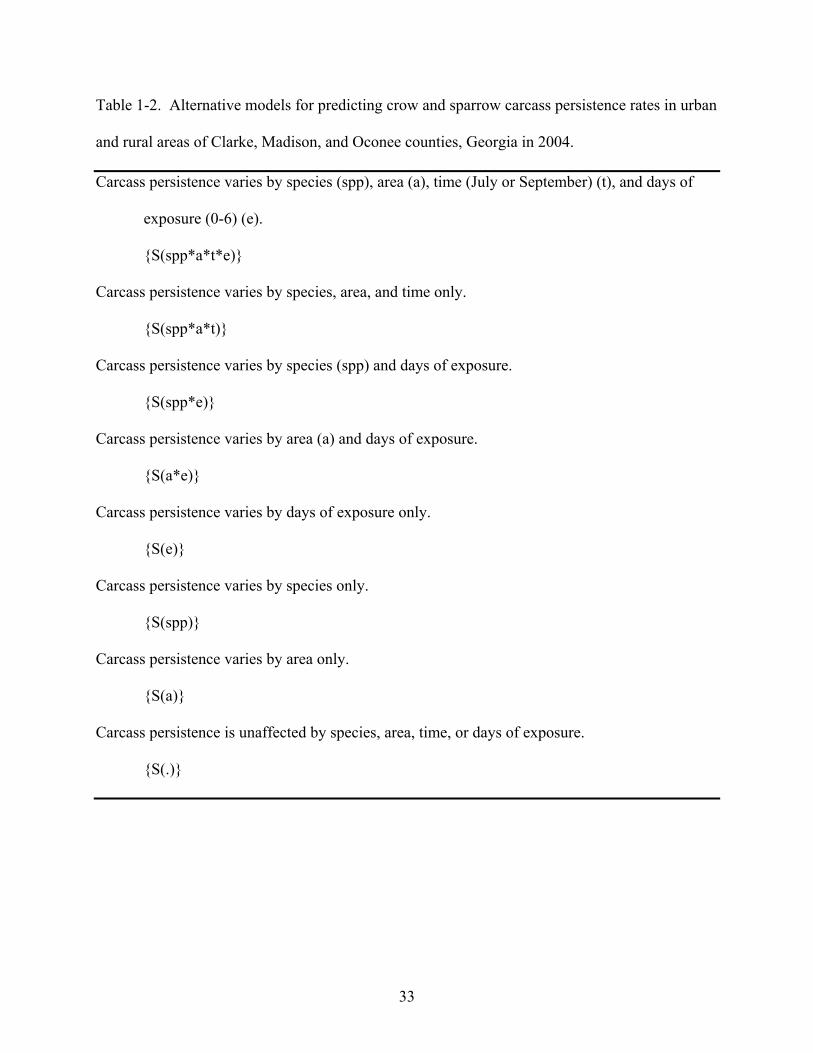
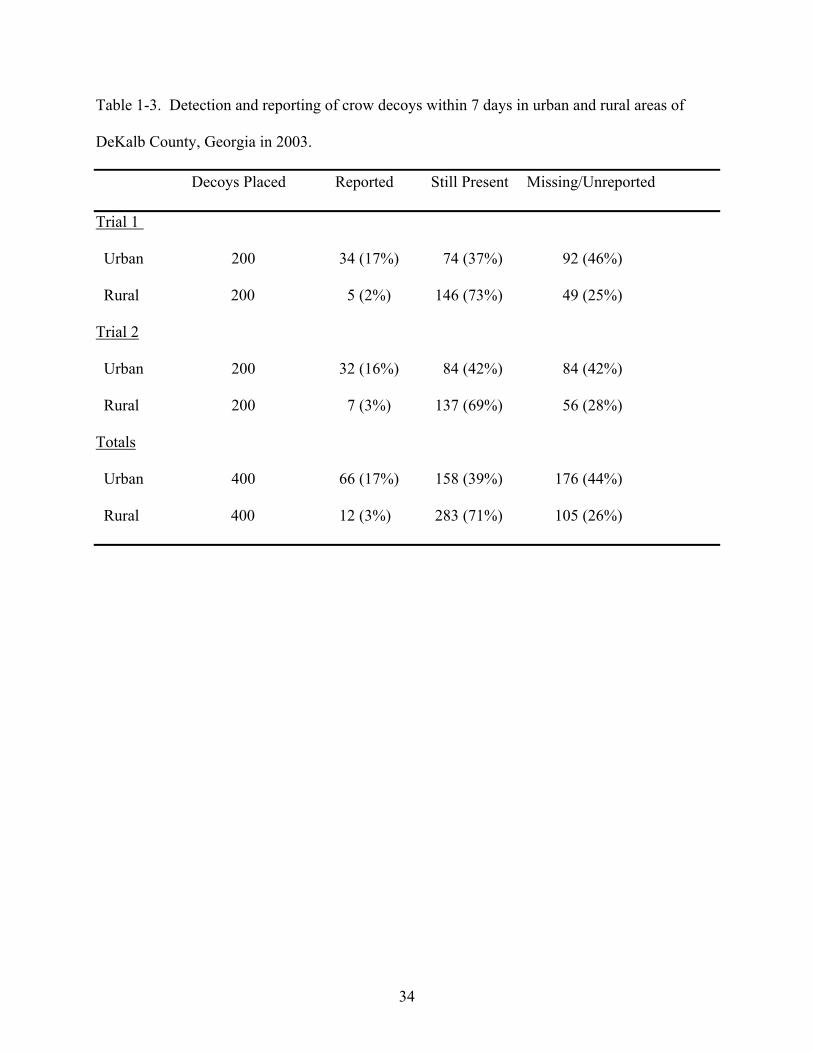
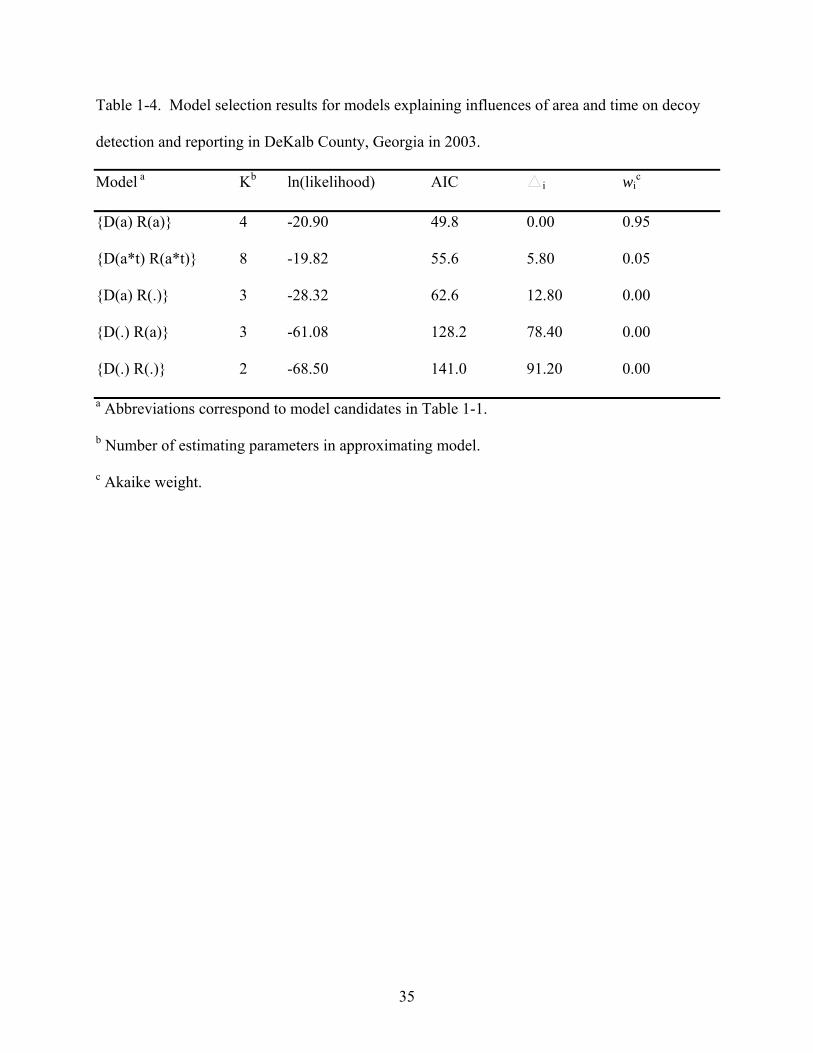
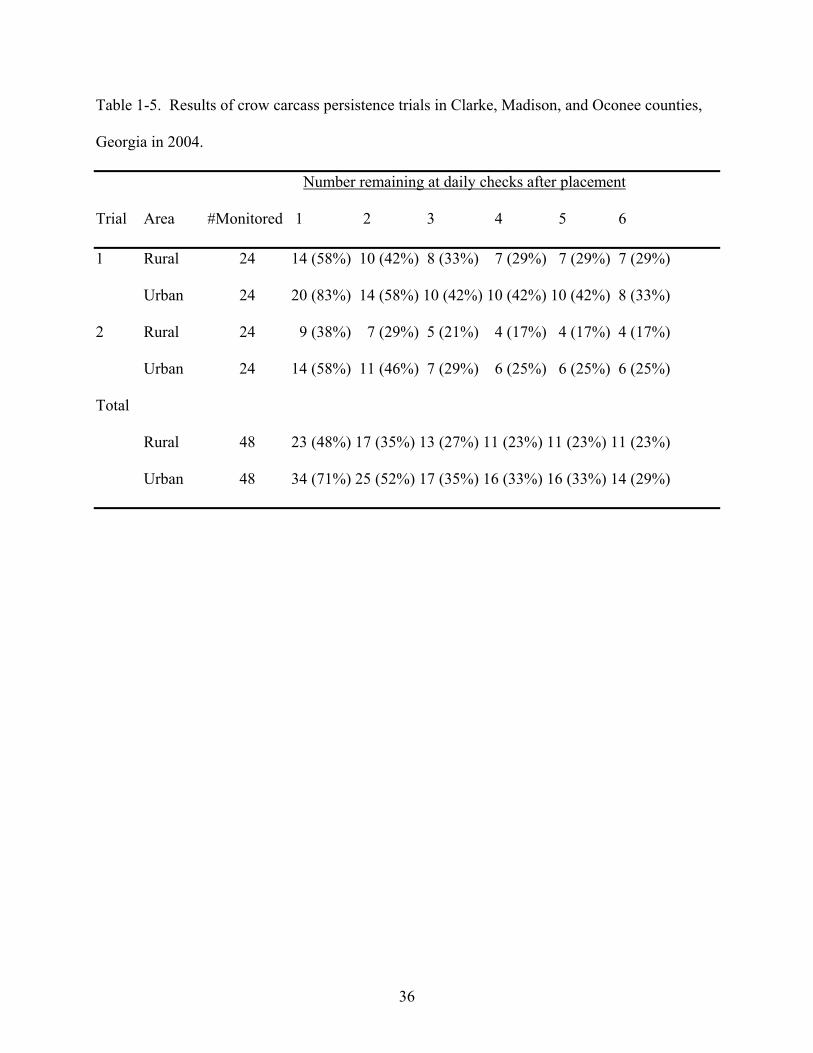
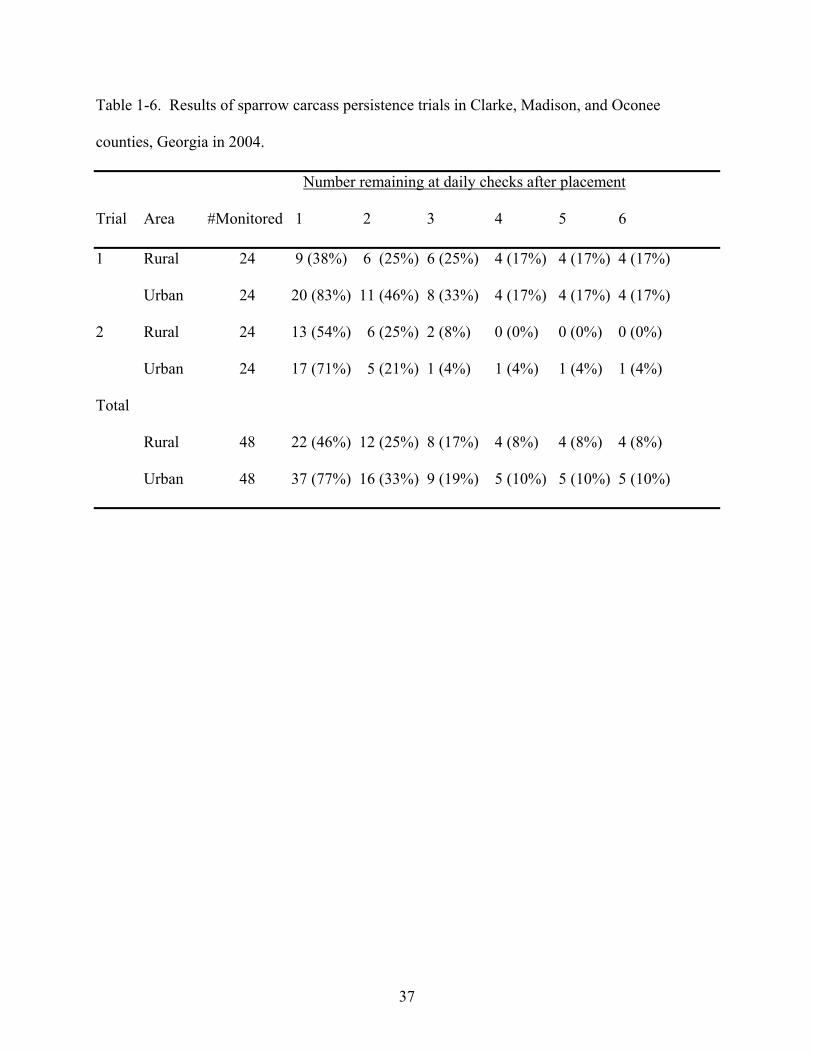
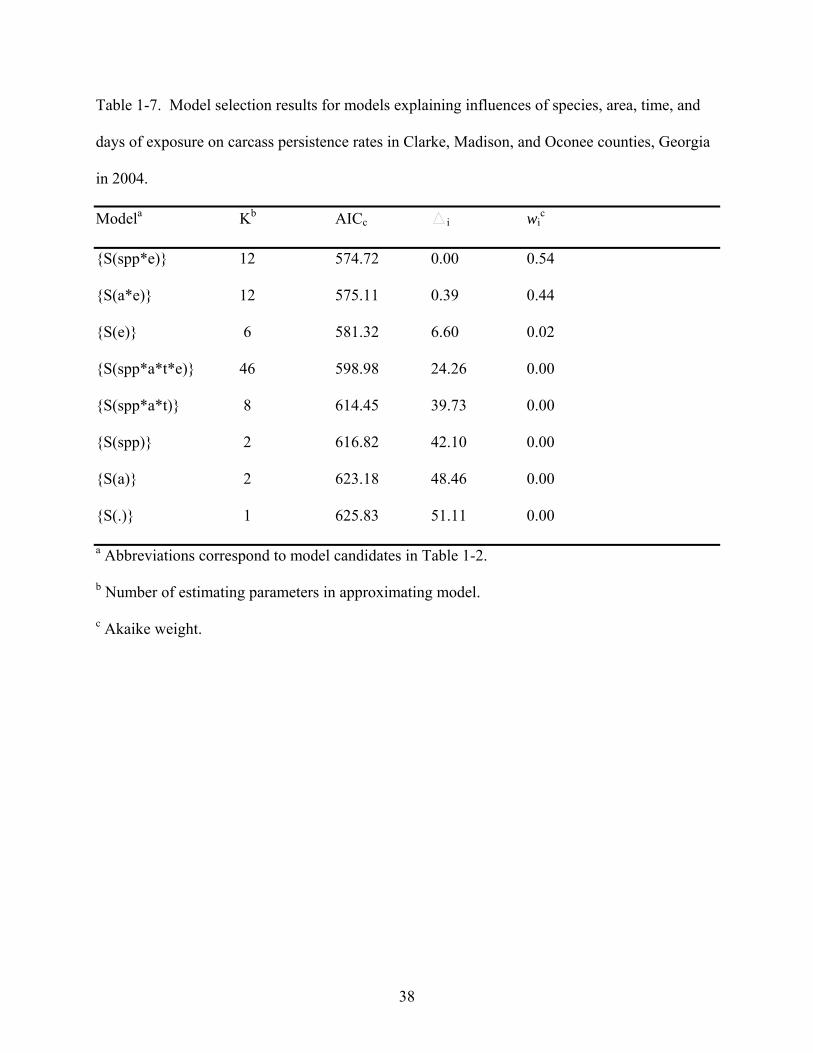
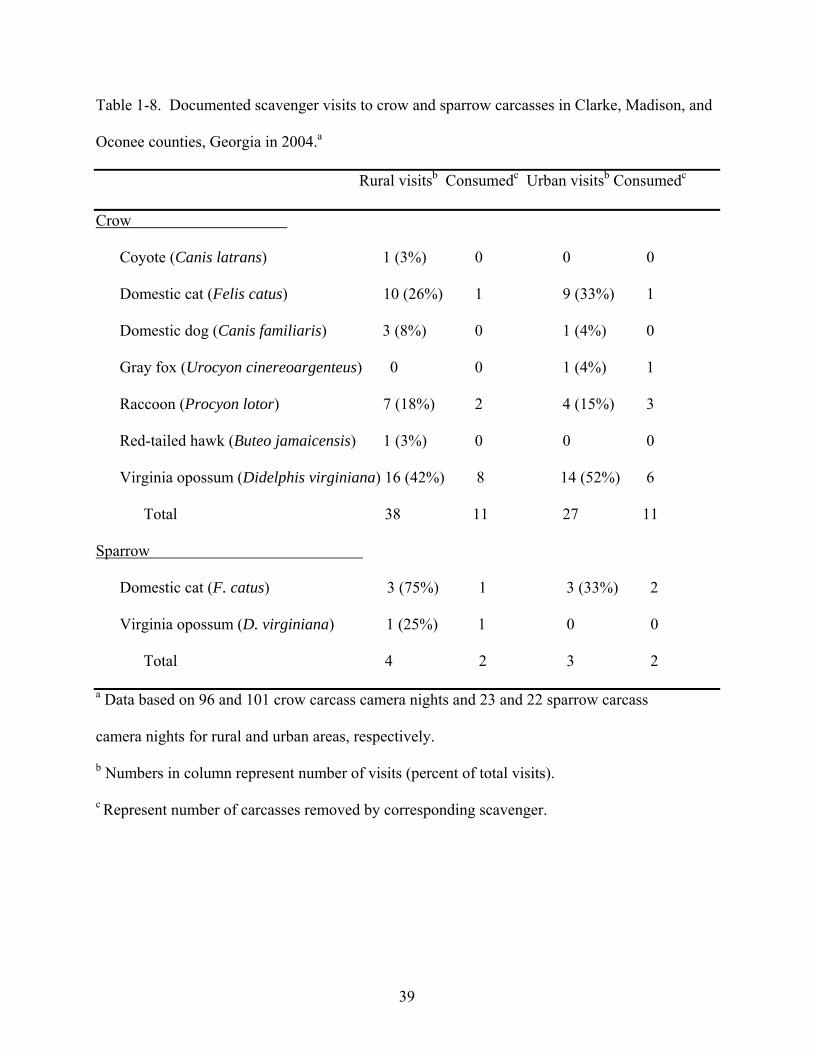
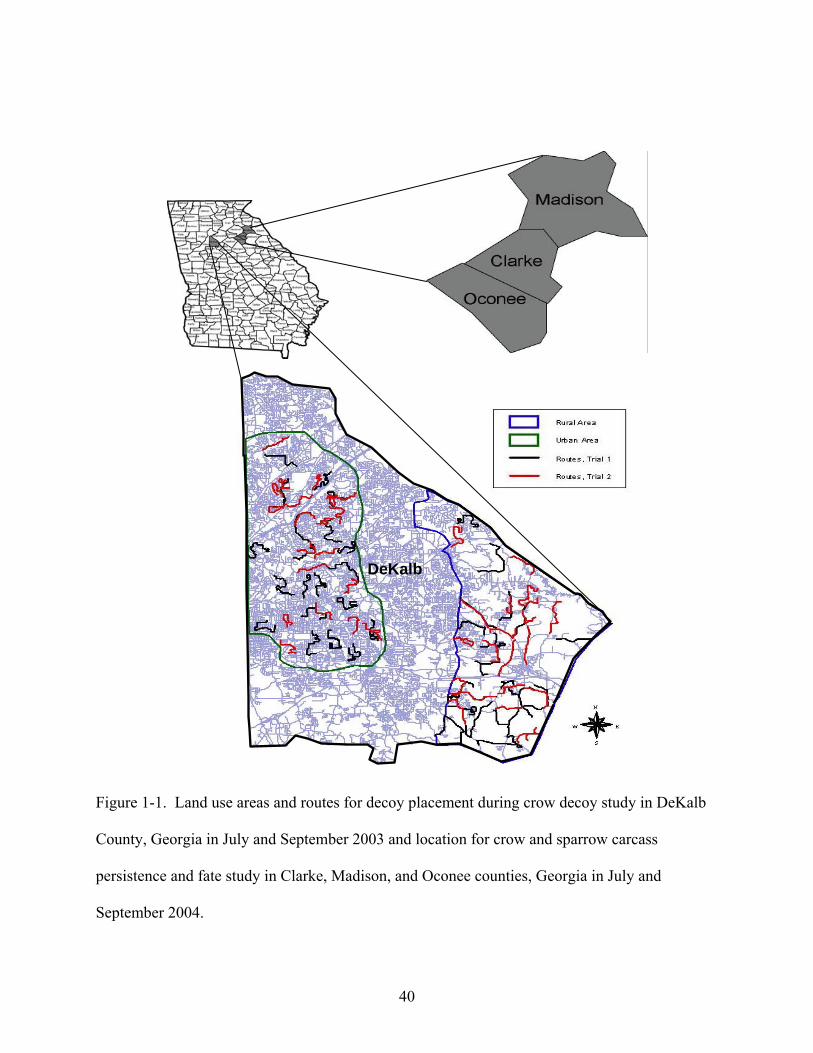
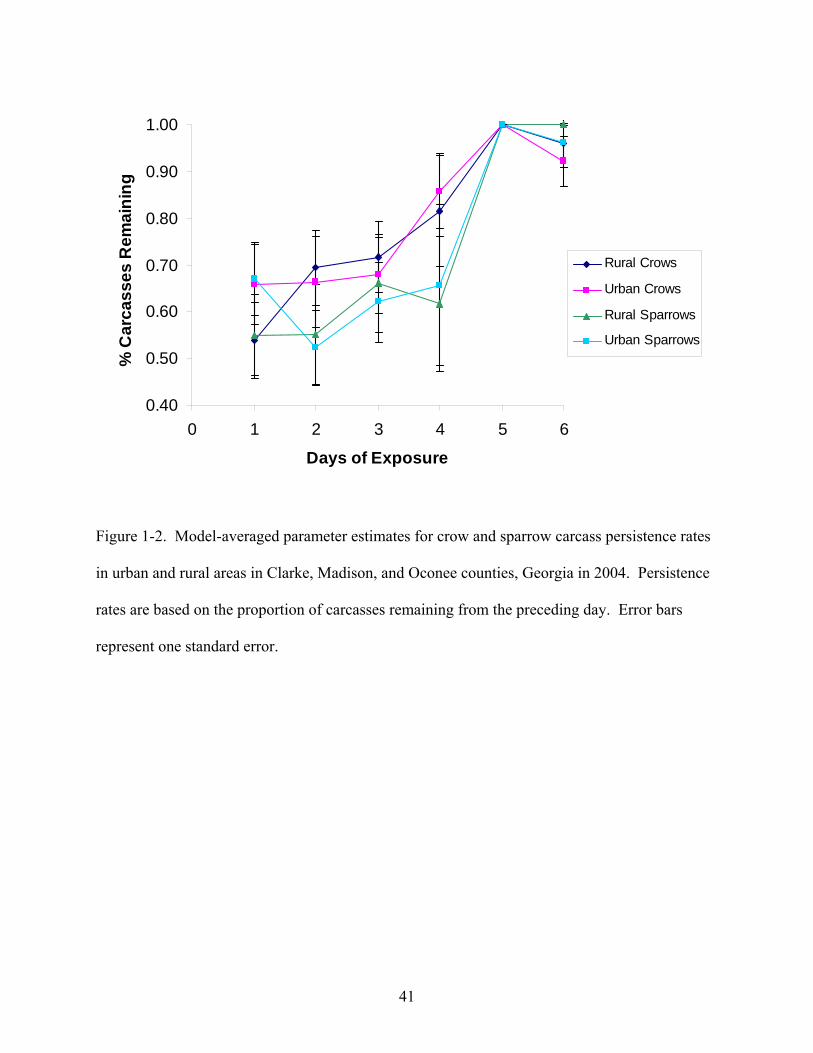
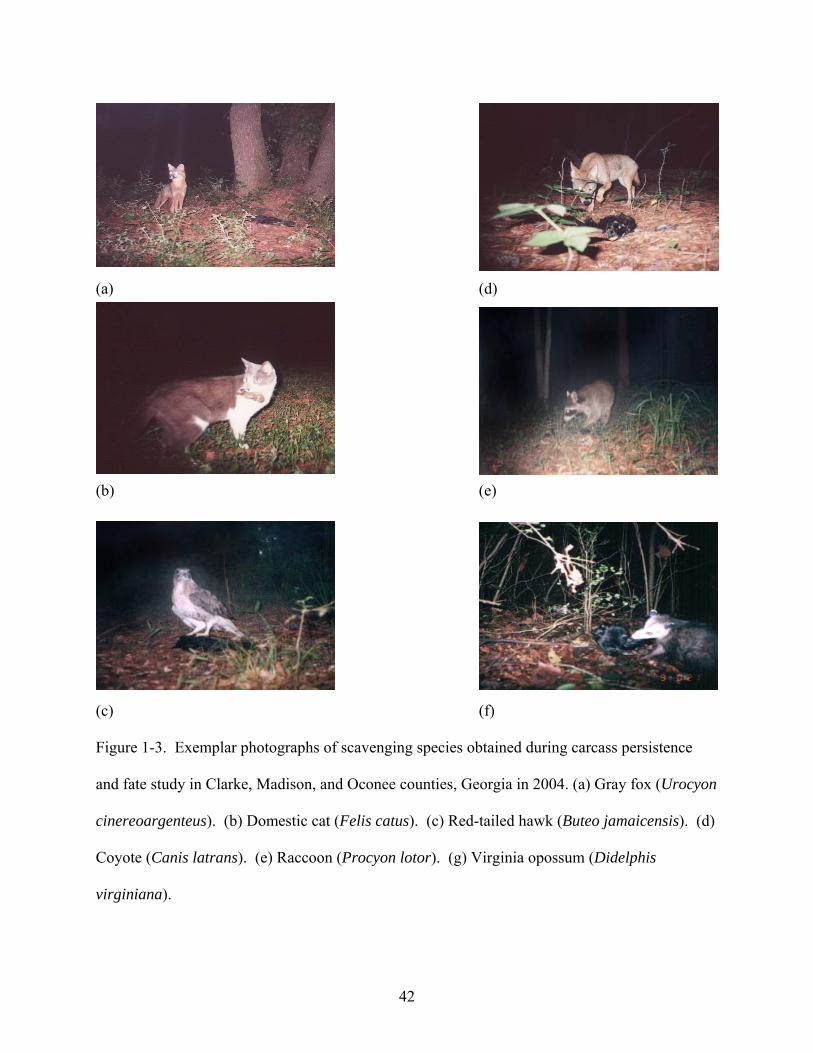


![Standard Technology Title: PRO-ACTIVE BIRD MORTALITY Unique … · 2018. 1. 20. · [1] Evaluating the bird electrocution risk of Eskom Distribution High (44 to 132 kV) and Medium](https://static.documents.pub/doc/80x56/610ad4ef2b9dc776f1546733/standard-technology-title-pro-active-bird-mortality-unique-2018-1-20-1-evaluating.jpg)


