25
Will Highly Selective TKIs Become First-Line Standard of Care? Joaquim Bellmunt European Kidney Cancer Symp – May 2013
Will Highly Selective TKIs Become
First-Line Standard of Care?
Joaquim Bellmunt
European Kidney Cancer Symp – May 2013
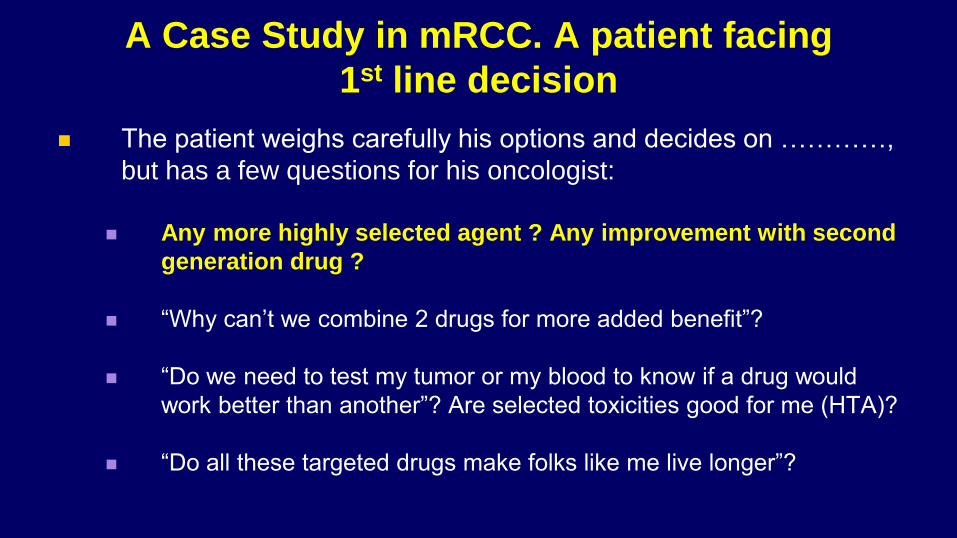
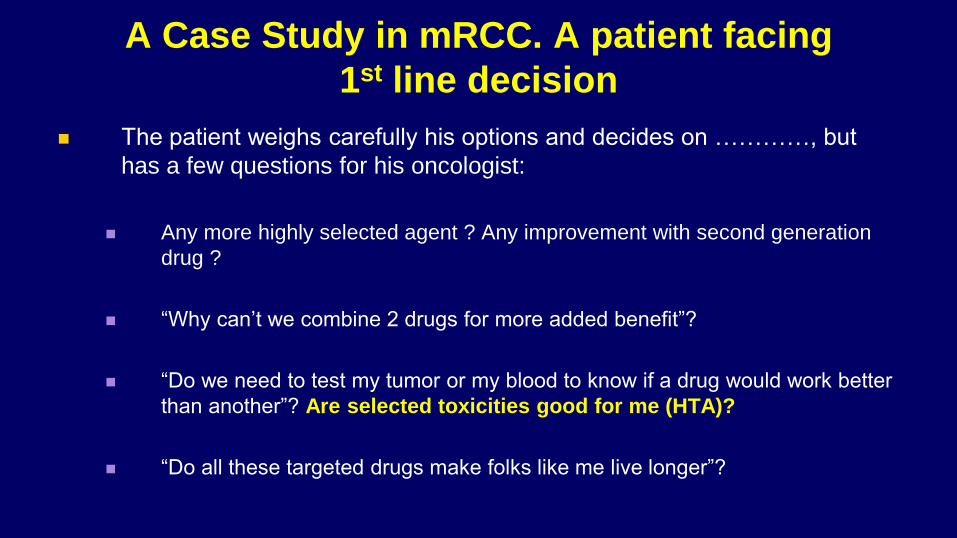
A Case Study in mRCC. A patient facing
1st line decision
The patient weighs carefully his options and decides on …………,
but has a few questions for his oncologist:
Any more highly selected agent ? Any improvement with second
generation drug ?
“Why can’t we combine 2 drugs for more added benefit”?
“Do we need to test my tumor or my blood to know if a drug would
work better than another”? Are selected toxicities good for me (HTA)?
“Do all these targeted drugs make folks like me live longer”?
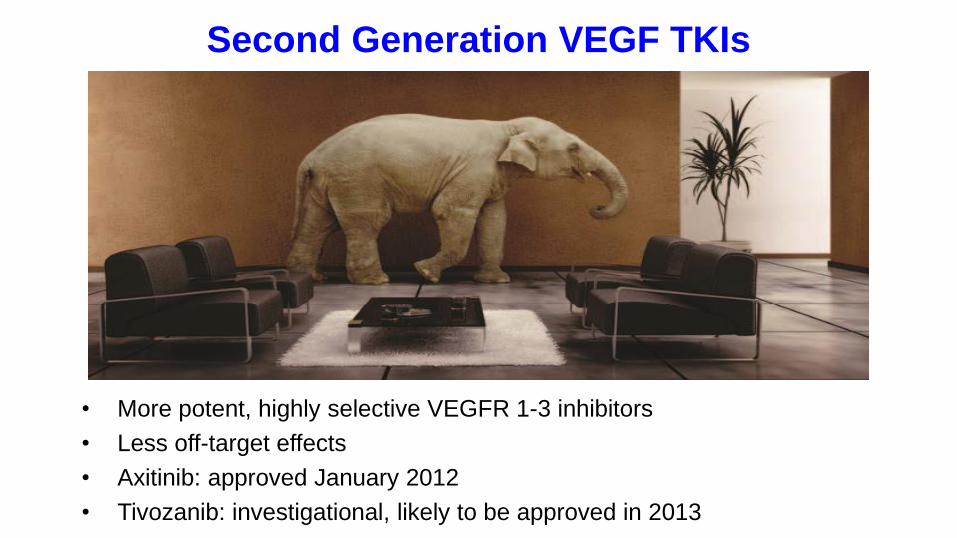
Second Generation VEGF TKIs
• More potent, highly selective VEGFR 1-3 inhibitors
• Less off-target effects
• Axitinib: approved January 2012
• Tivozanib: investigational, likely to be approved in 2013
4
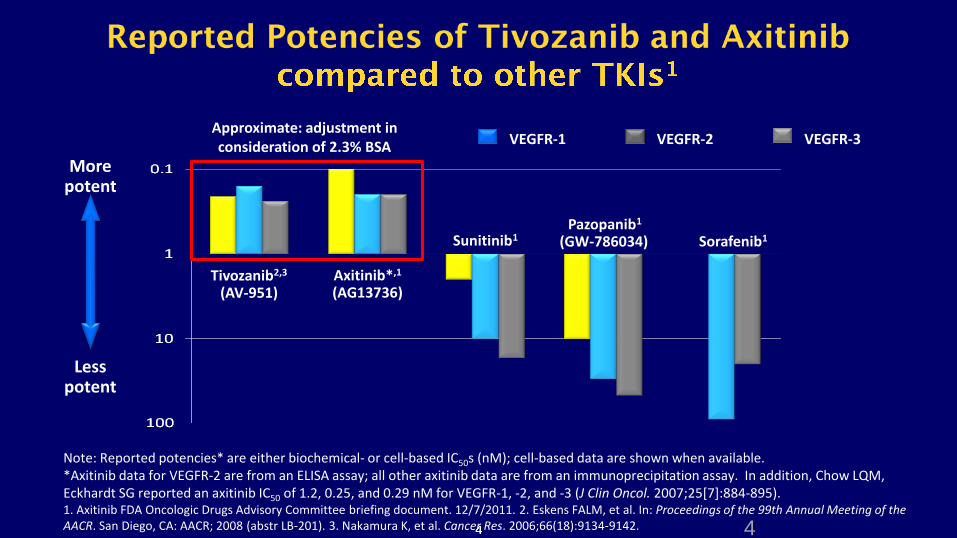
VEGFR-1 VEGFR-2 VEGFR-3
More potent
Less potent
Note: Reported potencies* are either biochemical- or cell-based IC50s (nM); cell-based data are shown when available. *Axitinib data for VEGFR-2 are from an ELISA assay; all other axitinib data are from an immunoprecipitation assay. In addition, Chow LQM, Eckhardt SG reported an axitinib IC50 of 1.2, 0.25, and 0.29 nM for VEGFR-1, -2, and -3 (J Clin Oncol. 2007;25[7]:884-895). 1. Axitinib FDA Oncologic Drugs Advisory Committee briefing document. 12/7/2011. 2. Eskens FALM, et al. In: Proceedings of the 99th Annual Meeting of the AACR. San Diego, CA: AACR; 2008 (abstr LB-201). 3. Nakamura K, et al. Cancer Res. 2006;66(18):9134-9142.
Sunitinib1 Sorafenib1
Axitinib*,1 (AG13736)
Pazopanib1 (GW-786034)
Tivozanib2,3 (AV-951)
Approximate: adjustment in consideration of 2.3% BSA
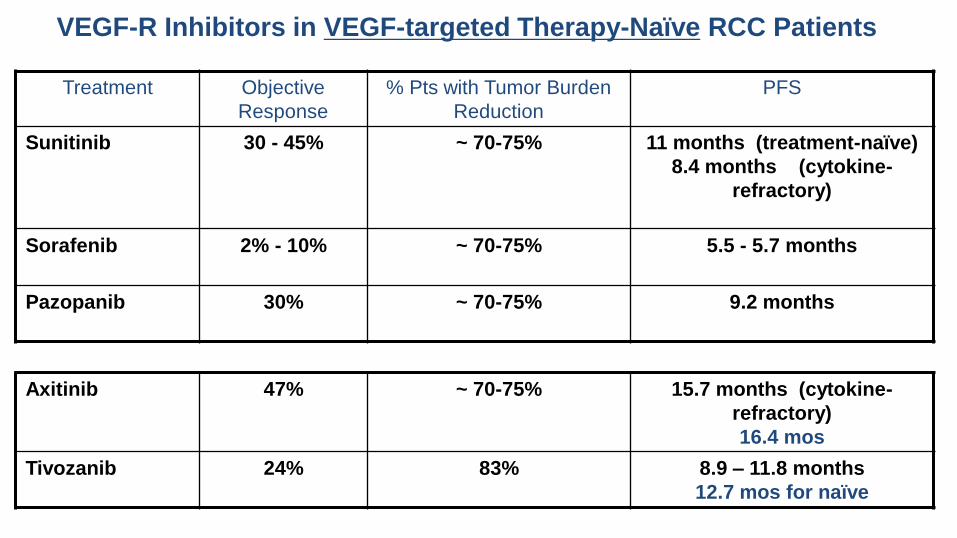
Treatment Objective
Response
% Pts with Tumor Burden
Reduction
PFS
Sunitinib 30 - 45% ~ 70-75% 11 months (treatment-naïve)
8.4 months (cytokine-
refractory)
Sorafenib 2% - 10% ~ 70-75% 5.5 - 5.7 months
Pazopanib 30% ~ 70-75% 9.2 months
VEGF-R Inhibitors in VEGF-targeted Therapy-Naïve RCC Patients
Axitinib 47% ~ 70-75% 15.7 months (cytokine-
refractory)
16.4 mos
Tivozanib 24% 83% 8.9 – 11.8 months
12.7 mos for naïve
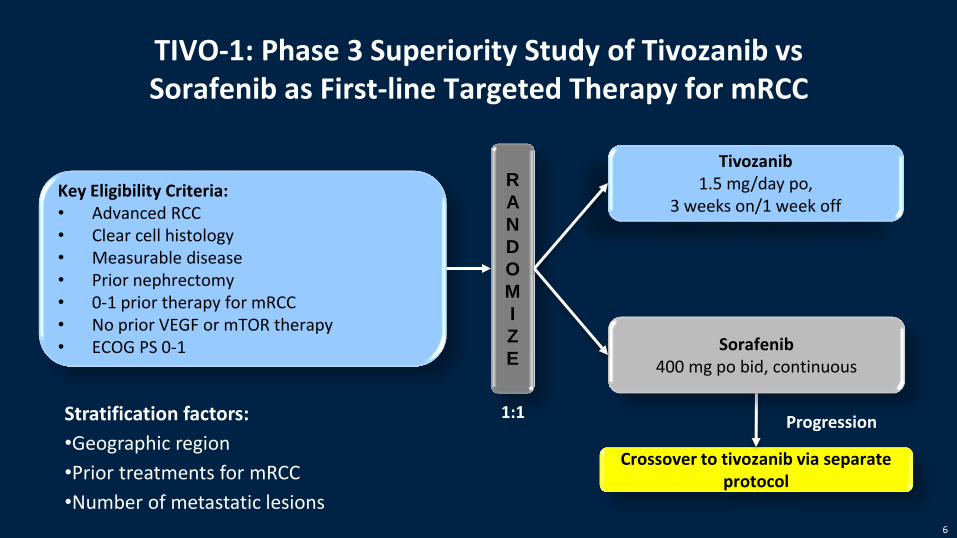
TIVO-1: Phase 3 Superiority Study of Tivozanib vs Sorafenib as First-line Targeted Therapy for mRCC
Crossover to tivozanib via separate protocol
Progression
Key Eligibility Criteria: • Advanced RCC • Clear cell histology • Measurable disease • Prior nephrectomy • 0-1 prior therapy for mRCC • No prior VEGF or mTOR therapy • ECOG PS 0-1
R
A
N
D
O
M
I
Z
E
Tivozanib 1.5 mg/day po,
3 weeks on/1 week off
Sorafenib 400 mg po bid, continuous
1:1 Stratification factors:
•Geographic region
•Prior treatments for mRCC
•Number of metastatic lesions 6
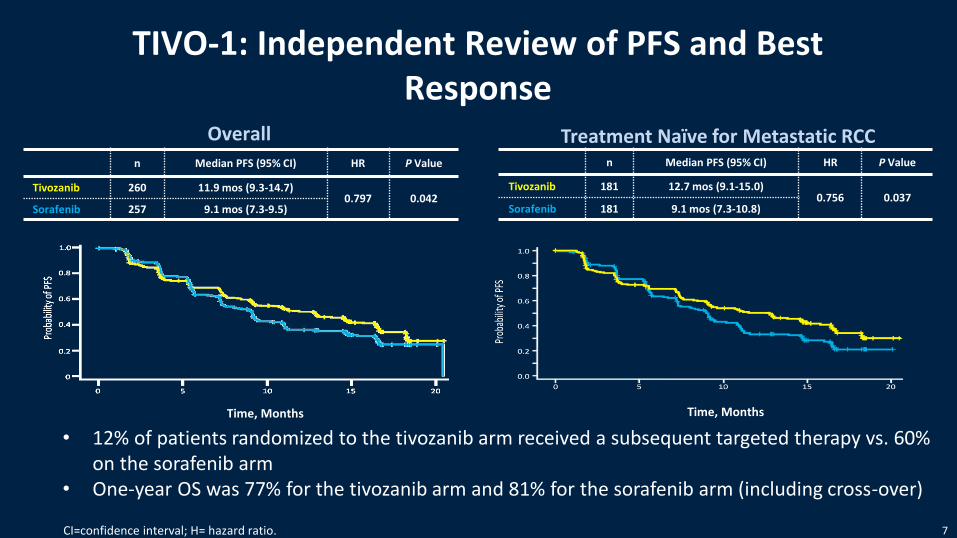
Overall
TIVO-1: Independent Review of PFS and Best Response
Treatment Naïve for Metastatic RCC
Time, Months
n Median PFS (95% CI) HR P Value
Tivozanib 260 11.9 mos (9.3-14.7) 0.797 0.042
Sorafenib 257 9.1 mos (7.3-9.5)
n Median PFS (95% CI) HR P Value
Tivozanib 181 12.7 mos (9.1-15.0) 0.756 0.037
Sorafenib 181 9.1 mos (7.3-10.8)
Time, Months
CI=confidence interval; H= hazard ratio.
• 12% of patients randomized to the tivozanib arm received a subsequent targeted therapy vs. 60% on the sorafenib arm
• One-year OS was 77% for the tivozanib arm and 81% for the sorafenib arm (including cross-over)
7
Tivozanib First-line mRCC Treatment
• Tivozanib efficacy demonstrated by improvement in PFS and ORR compared with sorafenib as initial targeted treatment for mRCC
• Tivozanib has a favorable safety profile
– Few dose reductions and discontinuations for AE’s
– Hypertension was the predominant toxicity
– Low incidence of ‘off-target’ Aes
• Tivozanib presents a potential first-line treatment option for mRCC
8
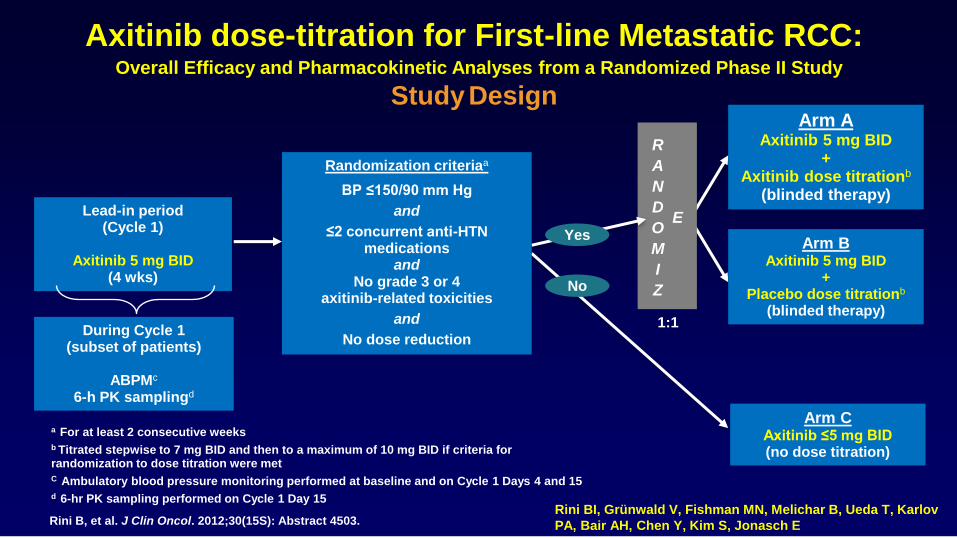
Axitinib dose-titration for First-line Metastatic RCC: Overall Efficacy and Pharmacokinetic Analyses from a Randomized Phase II Study
Study Design
1:1
Lead-in period (Cycle 1)
Axitinib 5 mg BID
(4 wks)
Arm C Axitinib ≤5 mg BID (no dose titration)
Arm B Axitinib 5 mg BID
+ Placebo dose titrationb
(blinded therapy)
Arm A Axitinib 5 mg BID
+ Axitinib dose titrationb
(blinded therapy)
R
A
N
D
O
M
I
Z
E
a For at least 2 consecutive weeks
b Titrated stepwise to 7 mg BID and then to a maximum of 10 mg BID if criteria for randomization to dose titration were met
C Ambulatory blood pressure monitoring performed at baseline and on Cycle 1 Days 4 and 15
d 6-hr PK sampling performed on Cycle 1 Day 15
During Cycle 1 (subset of patients)
ABPMc
6-h PK samplingd
Yes
No
Randomization criteriaa
BP ≤150/90 mm Hg
and
≤2 concurrent anti-HTN medications
and No grade 3 or 4
axitinib-related toxicities
and
No dose reduction
Rini B, et al. J Clin Oncol. 2012;30(15S): Abstract 4503. Rini BI, Grünwald V, Fishman MN, Melichar B, Ueda T, Karlov
PA, Bair AH, Chen Y, Kim S, Jonasch E
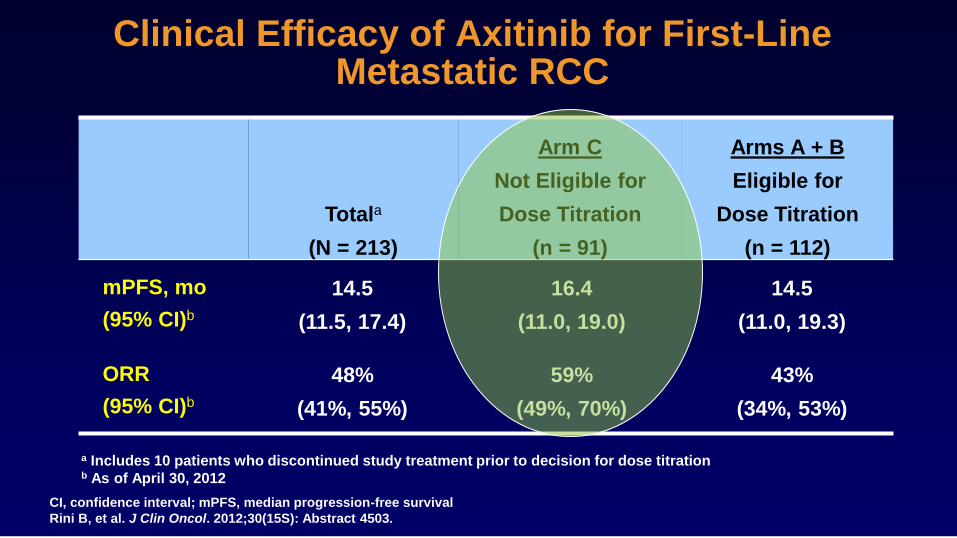
Clinical Efficacy of Axitinib for First-Line
Metastatic RCC
CI, confidence interval; mPFS, median progression-free survival
Rini B, et al. J Clin Oncol. 2012;30(15S): Abstract 4503.
Totala
(N = 213)
Arm C
Not Eligible for
Dose Titration
(n = 91)
Arms A + B
Eligible for
Dose Titration
(n = 112)
mPFS, mo
(95% CI)b
ORR
(95% CI)b
a Includes 10 patients who discontinued study treatment prior to decision for dose titration b As of April 30, 2012
14.5
(11.0, 19.3)
43%
(34%, 53%)
16.4
(11.0, 19.0)
59%
(49%, 70%)
14.5
(11.5, 17.4)
48%
(41%, 55%)
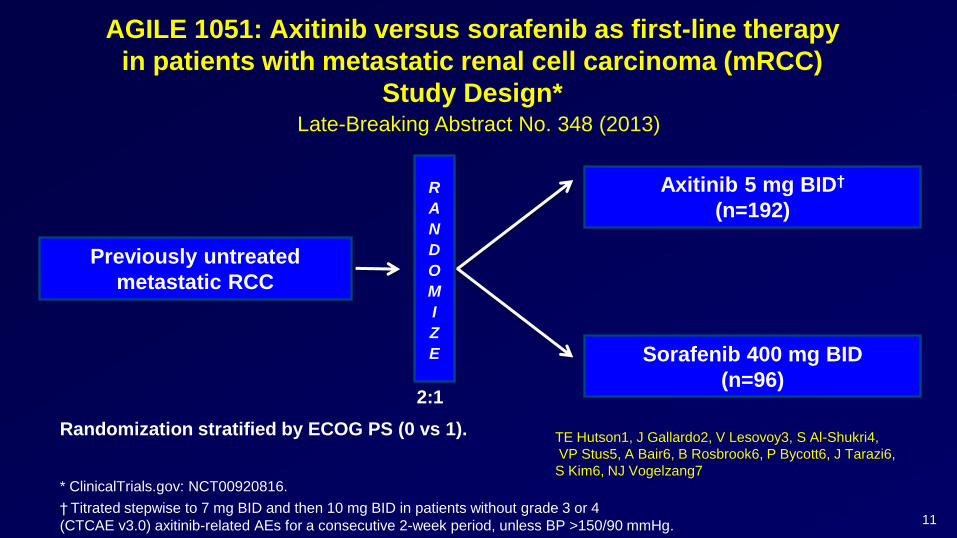
AGILE 1051: Axitinib versus sorafenib as first-line therapy
in patients with metastatic renal cell carcinoma (mRCC)
Study Design*
Previously untreated
metastatic RCC
R
A
N
D
O
M
I
Z
E
Axitinib 5 mg BID†
(n=192)
2:1
Sorafenib 400 mg BID
(n=96)
Randomization stratified by ECOG PS (0 vs 1).
* ClinicalTrials.gov: NCT00920816.
† Titrated stepwise to 7 mg BID and then 10 mg BID in patients without grade 3 or 4
(CTCAE v3.0) axitinib-related AEs for a consecutive 2-week period, unless BP >150/90 mmHg. 11
Late-Breaking Abstract No. 348 (2013)
TE Hutson1, J Gallardo2, V Lesovoy3, S Al-Shukri4,
VP Stus5, A Bair6, B Rosbrook6, P Bycott6, J Tarazi6,
S Kim6, NJ Vogelzang7
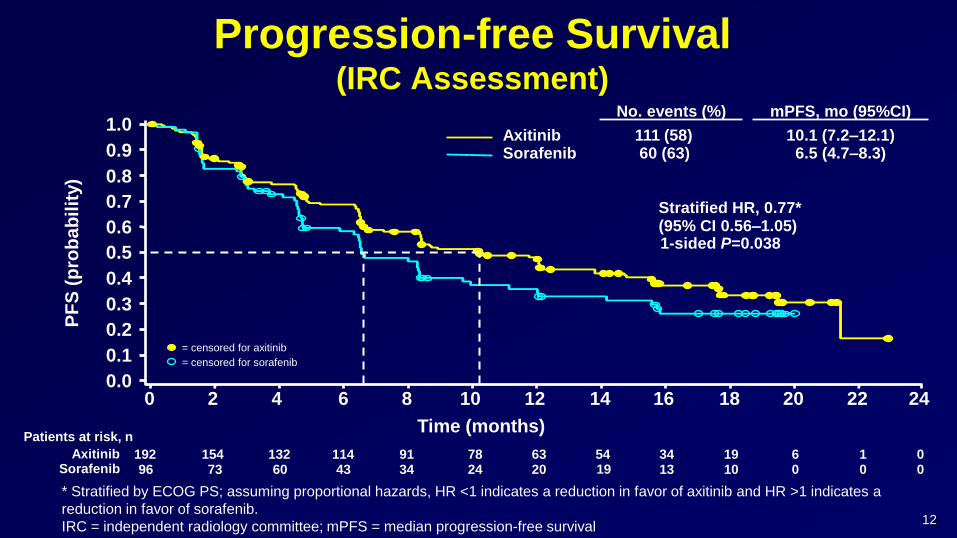
Progression-free Survival (IRC Assessment)
* Stratified by ECOG PS; assuming proportional hazards, HR <1 indicates a reduction in favor of axitinib and HR >1 indicates a
reduction in favor of sorafenib.
IRC = independent radiology committee; mPFS = median progression-free survival
1.0
0.9
0.8
0.7
0.6
0.5
0.4
0.3
0.2
0.1
0.0 0 2 4 6 8 10
Time (months)
12 14 16 18 20
PF
S (
pro
ba
bil
ity)
22 24
1-sided P=0.038
Stratified HR, 0.77* (95% CI 0.56–1.05)
Axitinib Sorafenib
No. events (%)
111 (58) 60 (63)
192 154 132 114 91 78 63 54 19 6 0 96 73 60 43 34 24 20 19 10 0 0
Patients at risk, n
Axitinib Sorafenib
34 13
1 0
= censored for axitinib
= censored for sorafenib
12
mPFS, mo (95%CI)
10.1 (7.2–12.1) 6.5 (4.7–8.3)
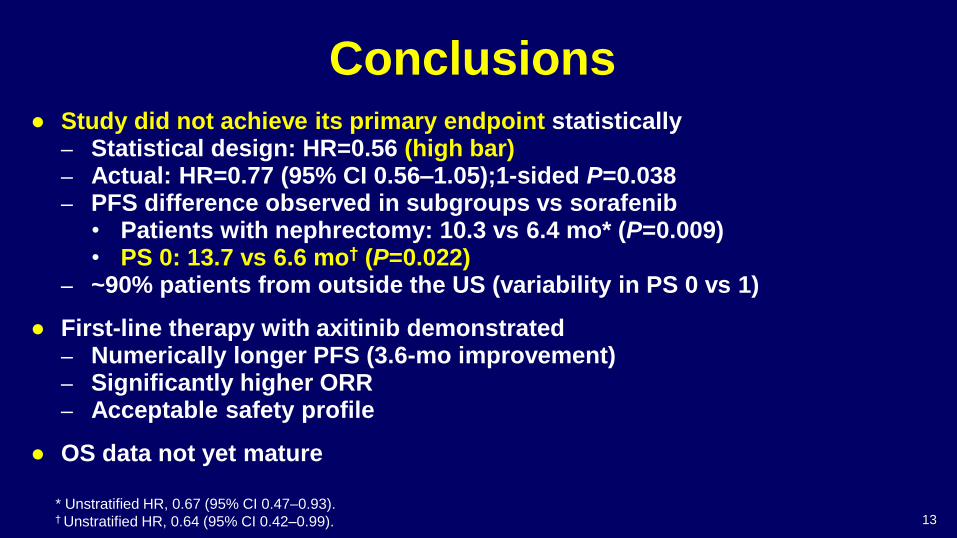
Conclusions ● Study did not achieve its primary endpoint statistically
– Statistical design: HR=0.56 (high bar) – Actual: HR=0.77 (95% CI 0.56–1.05);1-sided P=0.038 – PFS difference observed in subgroups vs sorafenib
• Patients with nephrectomy: 10.3 vs 6.4 mo* (P=0.009) • PS 0: 13.7 vs 6.6 mo† (P=0.022)
– ~90% patients from outside the US (variability in PS 0 vs 1)
● First-line therapy with axitinib demonstrated – Numerically longer PFS (3.6-mo improvement) – Significantly higher ORR – Acceptable safety profile
● OS data not yet mature
* Unstratified HR, 0.67 (95% CI 0.47–0.93). † Unstratified HR, 0.64 (95% CI 0.42–0.99). 13
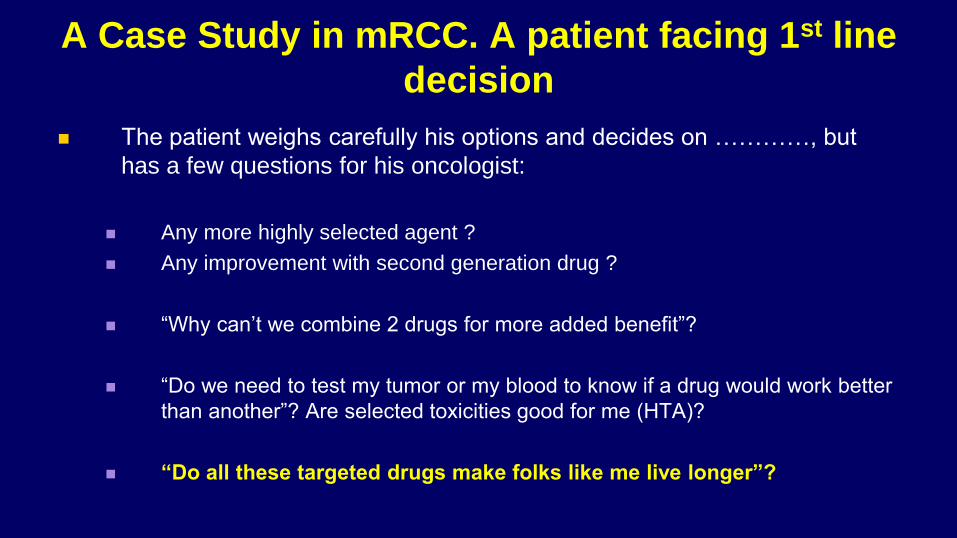
A Case Study in mRCC. A patient facing
1st line decision
The patient weighs carefully his options and decides on …………, but
has a few questions for his oncologist:
Any more highly selected agent ? Any improvement with second generation
drug ?
“Why can’t we combine 2 drugs for more added benefit”?
“Do we need to test my tumor or my blood to know if a drug would work better
than another”? Are selected toxicities good for me (HTA)?
“Do all these targeted drugs make folks like me live longer”?
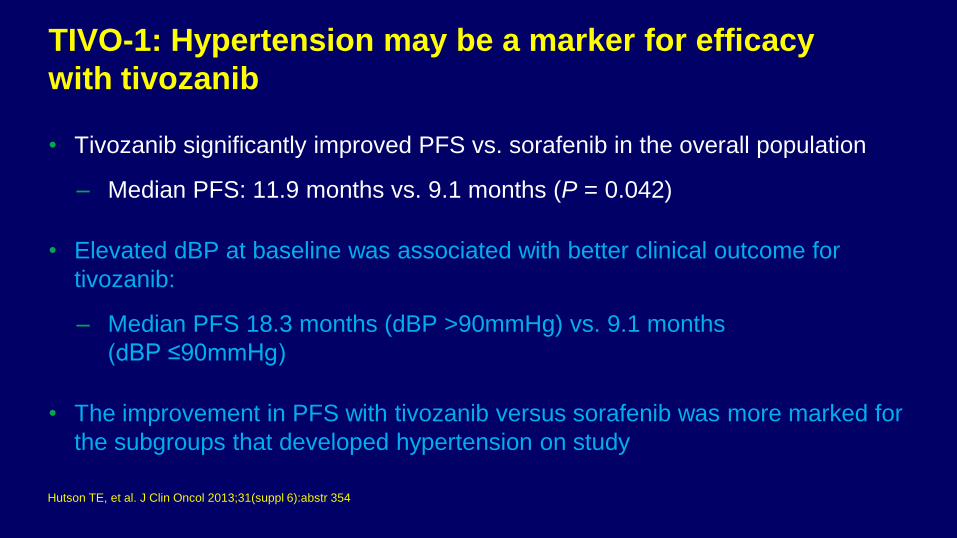
TIVO-1: Hypertension may be a marker for efficacy
with tivozanib
• Tivozanib significantly improved PFS vs. sorafenib in the overall population
– Median PFS: 11.9 months vs. 9.1 months (P = 0.042)
• Elevated dBP at baseline was associated with better clinical outcome for
tivozanib:
– Median PFS 18.3 months (dBP >90mmHg) vs. 9.1 months
(dBP ≤90mmHg)
• The improvement in PFS with tivozanib versus sorafenib was more marked for
the subgroups that developed hypertension on study
Hutson TE, et al. J Clin Oncol 2013;31(suppl 6):abstr 354
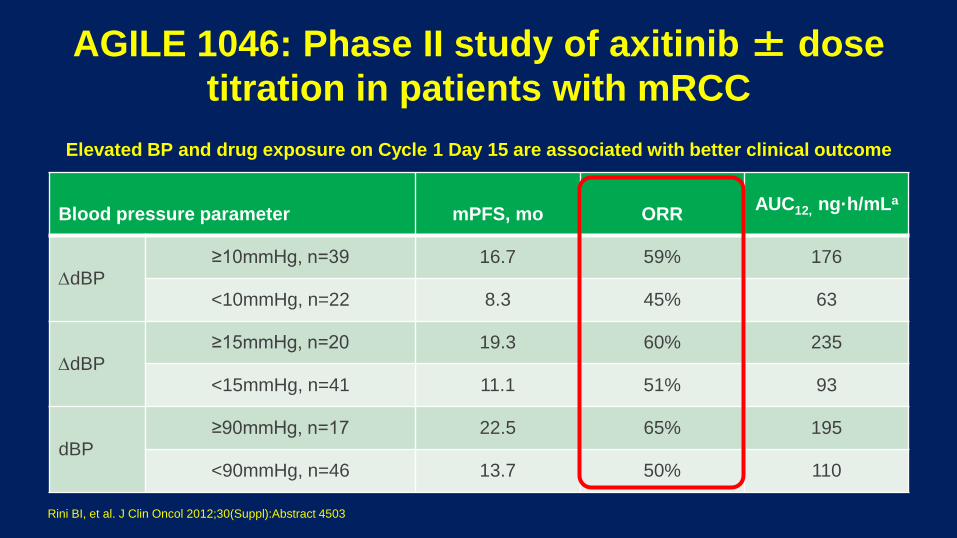
Blood pressure parameter
mPFS, mo
ORR
AUC12, ng·h/mLa
dBP ≥10mmHg, n=39 16.7 59% 176
<10mmHg, n=22 8.3 45% 63
dBP ≥15mmHg, n=20 19.3 60% 235
<15mmHg, n=41 11.1 51% 93
dBP ≥90mmHg, n=17 22.5 65% 195
<90mmHg, n=46 13.7 50% 110
AGILE 1046: Phase II study of axitinib ± dose
titration in patients with mRCC
Elevated BP and drug exposure on Cycle 1 Day 15 are associated with better clinical outcome
Rini BI, et al. J Clin Oncol 2012;30(Suppl):Abstract 4503
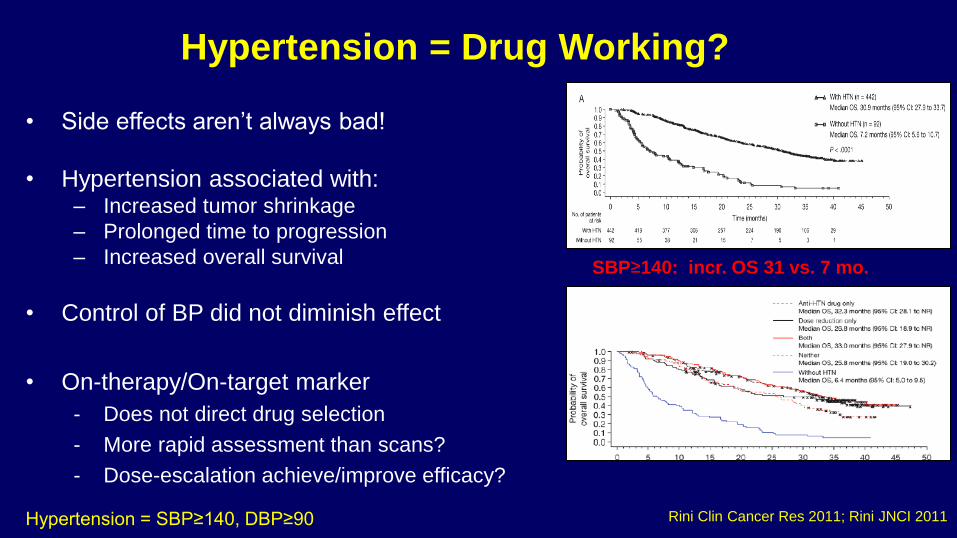
Hypertension = Drug Working?
• Side effects aren’t always bad!
• Hypertension associated with: – Increased tumor shrinkage
– Prolonged time to progression
– Increased overall survival
• Control of BP did not diminish effect
• On-therapy/On-target marker
- Does not direct drug selection
- More rapid assessment than scans?
- Dose-escalation achieve/improve efficacy?
SBP≥140: incr. OS 31 vs. 7 mo.
Rini Clin Cancer Res 2011; Rini JNCI 2011 Hypertension = SBP≥140, DBP≥90
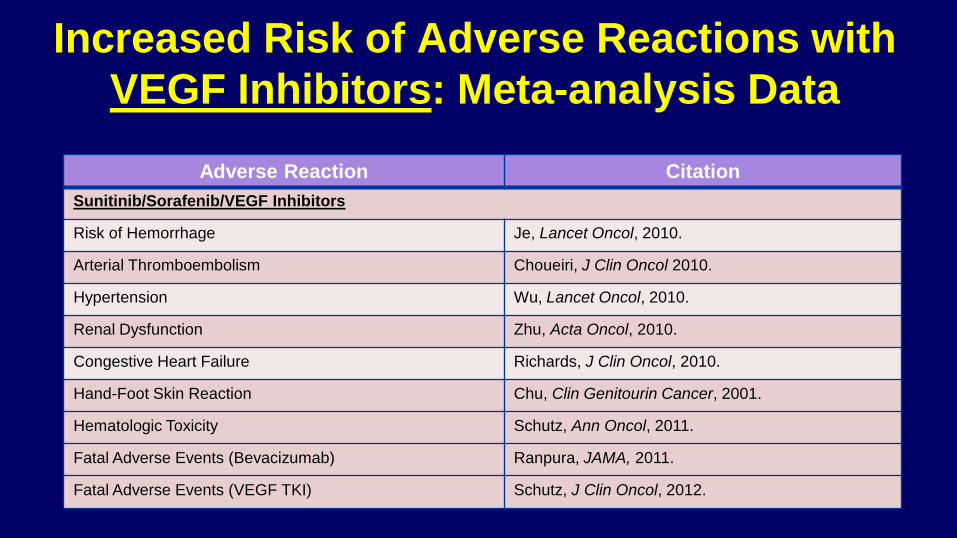
Increased Risk of Adverse Reactions with
VEGF Inhibitors: Meta-analysis Data
Adverse Reaction Citation
Sunitinib/Sorafenib/VEGF Inhibitors
Risk of Hemorrhage Je, Lancet Oncol, 2010.
Arterial Thromboembolism Choueiri, J Clin Oncol 2010.
Hypertension Wu, Lancet Oncol, 2010.
Renal Dysfunction Zhu, Acta Oncol, 2010.
Congestive Heart Failure Richards, J Clin Oncol, 2010.
Hand-Foot Skin Reaction Chu, Clin Genitourin Cancer, 2001.
Hematologic Toxicity Schutz, Ann Oncol, 2011.
Fatal Adverse Events (Bevacizumab) Ranpura, JAMA, 2011.
Fatal Adverse Events (VEGF TKI) Schutz, J Clin Oncol, 2012.
A Case Study in mRCC. A patient facing 1st line
decision
The patient weighs carefully his options and decides on …………, but
has a few questions for his oncologist:
Any more highly selected agent ?
Any improvement with second generation drug ?
“Why can’t we combine 2 drugs for more added benefit”?
“Do we need to test my tumor or my blood to know if a drug would work better
than another”? Are selected toxicities good for me (HTA)?
“Do all these targeted drugs make folks like me live longer”?
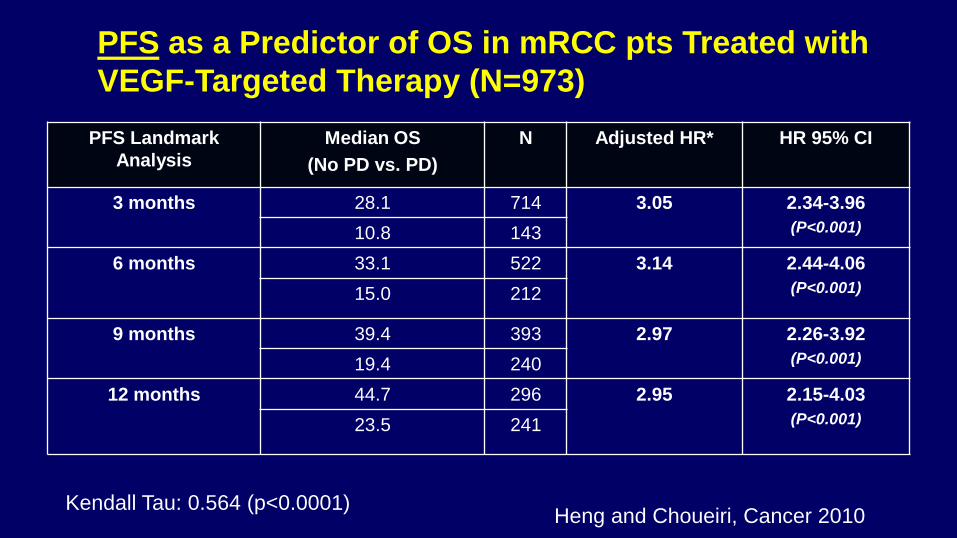
PFS Landmark
Analysis
Median OS
(No PD vs. PD)
N Adjusted HR* HR 95% CI
3 months 28.1 714 3.05 2.34-3.96
(P<0.001) 10.8 143
6 months 33.1 522 3.14 2.44-4.06
(P<0.001) 15.0 212
9 months 39.4 393 2.97 2.26-3.92
(P<0.001) 19.4 240
12 months 44.7 296 2.95 2.15-4.03
(P<0.001) 23.5 241
PFS as a Predictor of OS in mRCC pts Treated with
VEGF-Targeted Therapy (N=973)
Heng and Choueiri, Cancer 2010 Kendall Tau: 0.564 (p<0.0001)
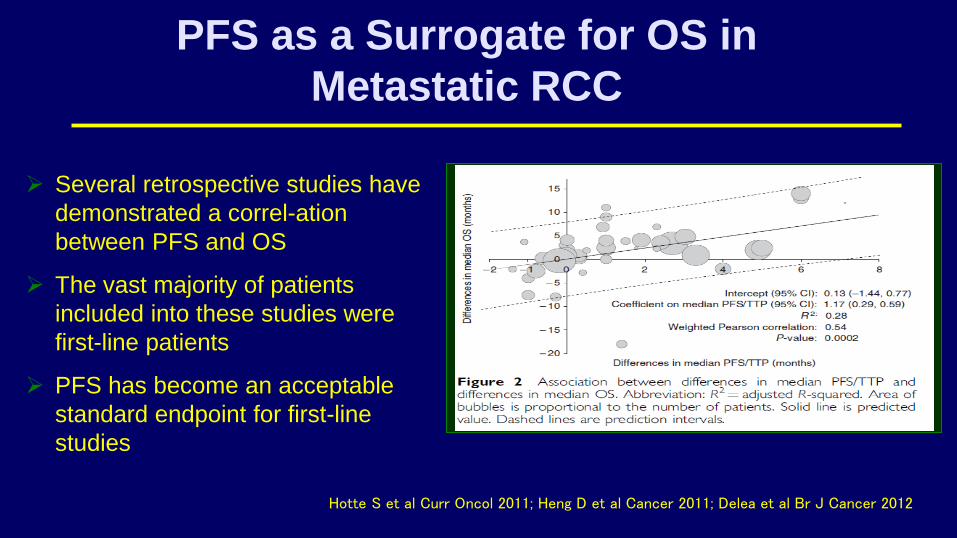
PFS as a Surrogate for OS in
Metastatic RCC
Hotte S et al Curr Oncol 2011; Heng D et al Cancer 2011; Delea et al Br J Cancer 2012
Several retrospective studies have
demonstrated a correl-ation
between PFS and OS
The vast majority of patients
included into these studies were
first-line patients
PFS has become an acceptable
standard endpoint for first-line
studies
“The difference between a surrogate
and a true end point…”
“…is like the difference between a check
and cash. You can often get the check
earlier, but then of course, it may bounce.”
Stephen Senn, Statistical Issues in Drug Development
(2008)
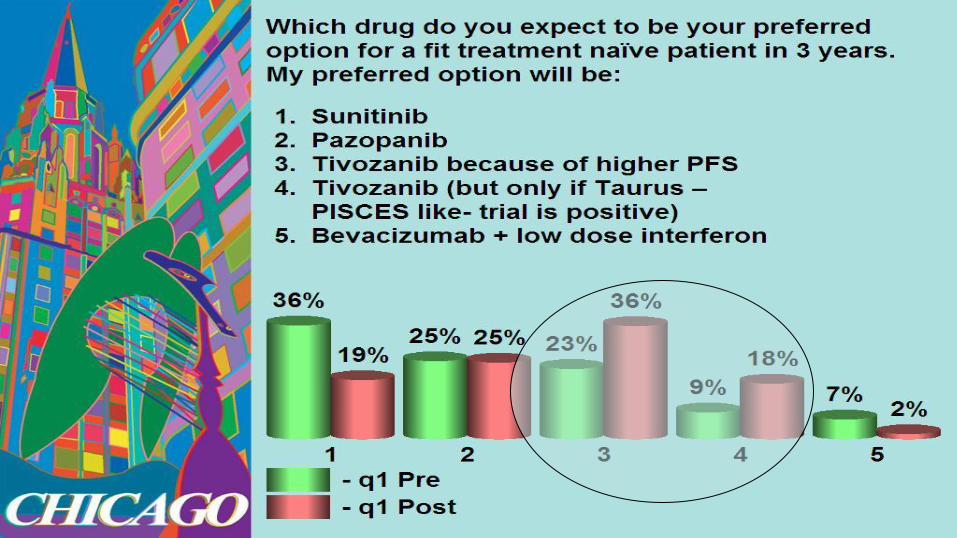
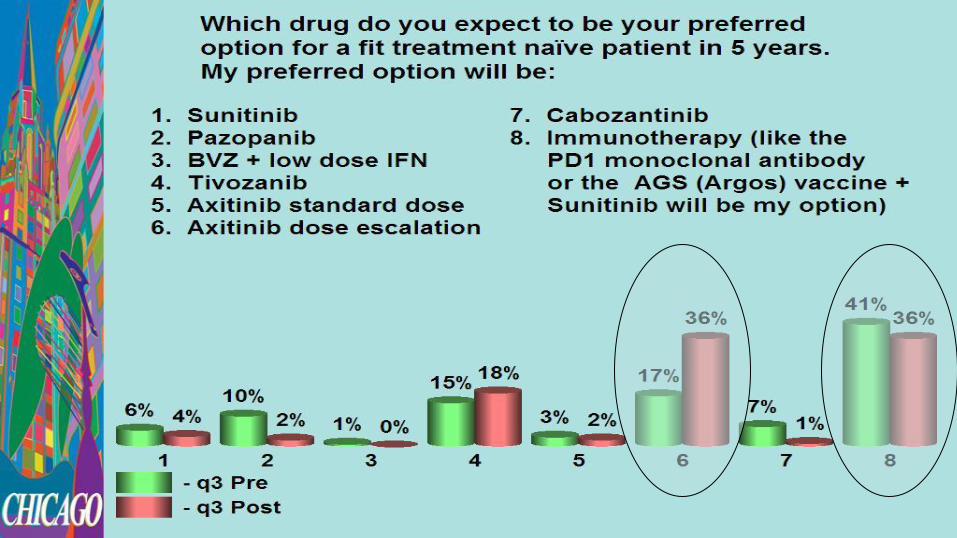
Audience Question
-KCS Chicago 2012-
What do you believe will have the
greatest impact on clinical practice
in the next 3-5 years?