Sponsored by William W. Hay Railroad Engineering Seminar “Engineering Strategy and Technology Overview” Kenneth Sito Senior Assistant Vice President Engineering Union Pacific Railroad Date: Friday, April 15, 2016 Time: Seminar Begins 12:20 pm Location: Newmark Lab, Yeh Center, Room 2311 University of Illinois at Urbana-Champaign
Transcript
Sponsored by
William W. Hay Railroad Engineering Seminar
“Engineering Strategy and Technology Overview”
Kenneth SitoSenior Assistant Vice President Engineering
Union Pacific Railroad
Date: Friday, April 15, 2016 Time: Seminar Begins 12:20 pm
Location: Newmark Lab, Yeh Center, Room 2311University of Illinois at Urbana-Champaign
2
Engineering
Strategy and Technology Overview
April 2016
3
• Safe operating conditions for employees, customers and communities
• Minimize train delay by reducing slow orders and maintenance footprint
• Cost effective results
Engineering Objectives
4
Infrastructure Strategies & Technologies
Rail• 6,735 curve miles inspected by geometry system & visual inspections.• 29,374 mainline miles inspected by geometry & DC systems. • Grinding performed by:
– 3 Loram 400 Series grinders– 1 Loram SG grinder
• 3,309 total wayside lubricators, 2,455 gage face & 854 top of rail
Roadbed• Geometry assessed with:
– 2 railbound evaluation cars, covering system 1-2 times/year– 5 Vista hyrail trucks serving Regions on high priority routes– 1 Vista unattended railcar platform (testing through mid-2016)
• Roadbed assessed with geometry systems, geotechnical inspections, chronic slow order history, ground penetrating radar (GPR) mounted on EC car
• Undercutting (BUC) program assessed with geometry systems, chronic slow order history, mud locations and ballast fouling model
• Precision Measurement Vehicles & Clearance hyrail platforms provide facility measurements for PTC & freight clearances
• Geotechnical engineering consultants provide most roadbed engineering design solutions
Major track systems overviewTies• 89 million wood ties assessed & replaced with strategic tie replacement (STR)• 11 million concrete ties assessed with geometry systems & visual inspection• 1 million composite ties assessed annually & replaced to minimize risk• 4,200 miles of concrete tie pads assessed with geometry systems & visual inspection
55
Capital Cycle
Predict & PreventAsset renewal strategy
Traffic Load MGT, Time, Environment
Trac
k Q
ualit
y
UP StandardMinimal Safety Standard
New Track
Slow Order
Renewal Event
Intervention Zone
Overall Goal is to extend asset life and reduce or eliminate Capital Cyclesto drive the lowest possible TCO.
66
Track Asset Life Cycle
Assess
Maintain/ Replace
PredictPrevent
Assessment and Life Cycle Asset ManagementProcess drives renewal to highest impact areas
Crosstie Technology ProgressionImplementation on UP
Wood Ties87MM (27k Miles)
Concrete10.2 MM (3900 Miles)
Composite1 MM
1998
9
Can we Sustain our Wood Tie Strategy?• Headwinds (Challenges)
– Quality of timber (Tie Life)– Environmental pressure on
creosote– Cost of solid sawn wood– Disposal Cost– Heavy Axle Load stresses– Renewal footprint demands
• Tailwinds (Opportunities)
– Borate can buy us time– Composite Ties have the
best long-term TCO for Wood Tie Replacement
– Composite Tie Quality is Critical
1010
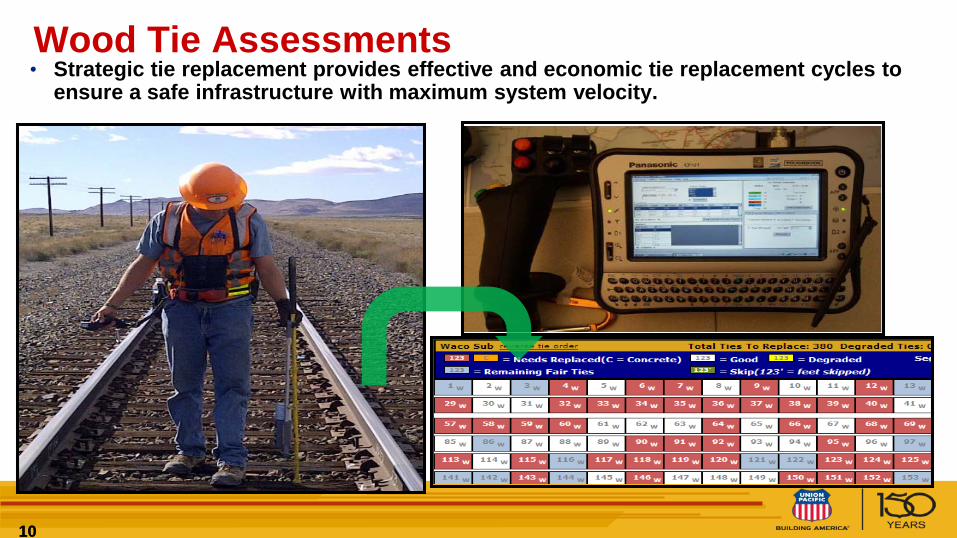
Wood Tie Assessments• Strategic tie replacement provides effective and economic tie replacement cycles to
ensure a safe infrastructure with maximum system velocity.
– Insulated
1111
• Additional Tie Life for Ties with Loose Spikes
• Plugging Compound Study concluded that plugging ties effectively extends the ties ability to retain spikes.
• Southern Region wood tie project will use plugging compound in 2016.
• Engineering is working on a portable plugging compound solution for surfacing gangs and with maintenance gangs.
• Approximately $2.00 per Tie
Wood Tie Plugging Compound – Extended Tie Life
12
Wood Borate Treated Ties•Borate Tie Summary
- Extends life of wood ties in high decay locations
- Extends Tie Cycles in High Decay Zones –Southern Region
- Eliminates Decay/Stack Burn Air Seasoning- Improves performance of creosote ties- Prevents Heartwood decay and corrosion around spikes
- Reduces use of creosote treatment- Started in 2014/2015- Plan to install 800,000 ties in 2016
13
Georgetown Aurora Xi Track Inspection System
* Collateral assessments include joint bar bolt counts, rail anchor evaluation, spike pattern compliance, OTM inventory
• Wood tie rating evaluation– Laser linescan & x-ray backscatter for 3-D
assessment of tie– Requires RFID & geolocation coordination to feed
UP tie assessment systems• 2016 Test Plan
– Georgetown in testing with RFID receivers– UP process to install RFID on track– Validation testing on the Southern Region
• 2017 Production target– 2017 tie assessment conducted with Aurora Xi
2016 Machine Vision Operating Plan
14
•Composite Ties- Reduce tie interventions- Pinebluff Sub install in 2001
has had no wood tie intervention for two cycles
- Makes hardwood available for other projects
- Disposal cost do not exists (refund credits)
- Have had over 150k failures because of manufacture quality.
Composite Tie Benefits
*Pine Bluff MP 384, Stamps, AR – 2001 Installation at Over 400 mgt
15
Current In-Track Testing Locations
• Test on multiple subdivisions– S. Morrill NO 2– Chester SIMN
• Three Vendors being tested– Axion– Carbonloc– Integrico
• Long term solution to volatility of wood tie market
• Eliminate Tie Interventions
Composite Ties
16
• Tiered Standards– Recessed Rail Seat Tie Testing– Bridge Approach
• Tie Pads
• Rail Seat Repair
• Specialty Tie Sourcing
• 14% of Mainline Ties are Concrete
• Concrete Tie Demand in 2016 will be about 300k to 350k
Concrete Tie Strategy
17
• Increased gage life (less insulator replacements)• Tie Spacing Tests – Increased Spacing
Recessed Rail Seat Tie Testing
Vossloh W40 Pandrol FERR
18
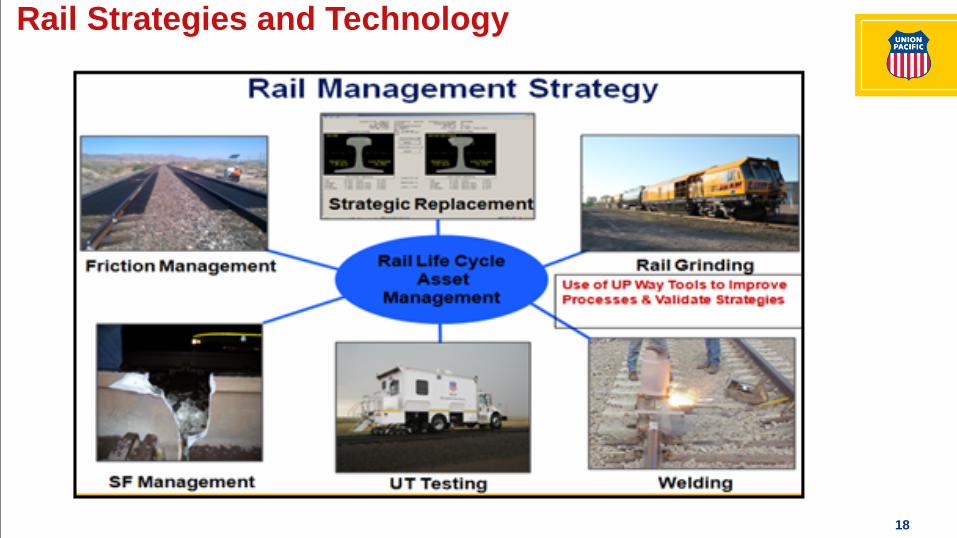
Rail Strategies and Technology
19
UPRR Rail Facts • CWR – Mainline:
– 3918 TM 5.5” Base Rail, Ave age 49 years old– 8851 TM 133# Rail, Ave age 24 years old– 10793 TM 136# Rail, Ave age 20 years old– 3796 TM 141# Rail, Ave age 7 years– 54,716 ML CWR Rail Miles
• Jointed – Mainline:– 1263 TM Jointed Rail
• Grinding: 22,261 miles groundin 2015
• DC testing: 134,422 miles • Top 3 DC defects:
– DF = 4927 total – 21.4%– SSC = 4370 total – 19%– DFW-B = 3692 total – 16.1% Lamella Structure of Rail
20
Strategic Rail Replacement- New Rail• New tangent rail driven by rail defects.• Different defect thresholds for route class.
– Critical Route = defects/mi/per year • Rail Replacement Logic (RRL) uses a 2 year
RRL fatigue defect average.
• Weighting factors for new tangent rail:– Rail Evaluation Index; RRL fatigue defects;
– BNSF invest significantly more than UP in weld QC
Track Welding Strategy and Technology
Electronic StraightedgeHead Alloy WeldsSpark less Rail Cutting
Induction Post HeatThermite Post Heat
Head Repair WeldsLong Rail
24
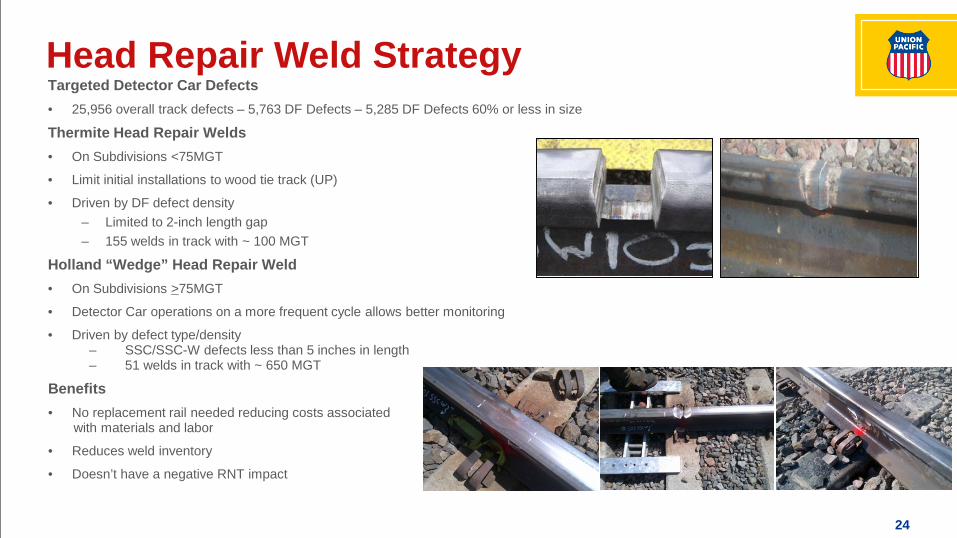
Targeted Detector Car Defects• 25,956 overall track defects – 5,763 DF Defects – 5,285 DF Defects 60% or less in size
Thermite Head Repair Welds• On Subdivisions <75MGT
• Limit initial installations to wood tie track (UP)
• Driven by DF defect density– Limited to 2-inch length gap– 155 welds in track with ~ 100 MGT
Holland “Wedge” Head Repair Weld• On Subdivisions >75MGT
• Detector Car operations on a more frequent cycle allows better monitoring
• Driven by defect type/density– SSC/SSC-W defects less than 5 inches in length– 51 welds in track with ~ 650 MGT
Benefits• No replacement rail needed reducing costs associated
with materials and labor
• Reduces weld inventory
• Doesn’t have a negative RNT impact
Head Repair Weld Strategy
25
Head Hardened Thermite Weld• Rail head more closely matches the hardness of the rail.
• Softer web and base allows flexing under traffic.
• 6 welds installed on South Morrill Sub. #2 track.– Study is in conjunction with TTCI to address surface batter – 2 initial welds installed with ~ 188 MGT and no issues
Additional Heat Affected Zone (HAZ) overlay process• Reduce surface batter on each side of weld
• Moves and narrows the “soft” HAZ
Perceived Benefit• Less surface flow and degradation resulting in extended weld longevity
Head Hardened Thermite Weld
Without HAZ Overlay With HAZ Overlay
26
Long Rail Initiative• Rail life is about 4 BGT• Weld life is about 1.5 to 2 BGT• Increase rail length from
80 ft. to 480 ft.
– Eliminates 55 Plant Welds per mile of rail
• Benefits
– Reduced Risk of Weld Defects
– Improved Rail Life– Reduced Maintenance– Improved Service
88% Weld Reduction
Standard 1440 ft CWR String17 Plant Welds
Long Rail 1440 ft CWR String2 Plant Welds
27
Long Rail – Welding Plant• UP Owned\Holland Operated Weld Plant
– The crane consists of 8 overhead trolley units, 4 spreader beams and 20 magnetic heads.
– Began welding in March 2015– First of its kind.– Holds 46,000 tons of rail in storage – Nearly 200 track
miles.– Designed to make four welds an hour.– Can weld two trains a week or 10 miles
28
UPRRFriction Management Program
29
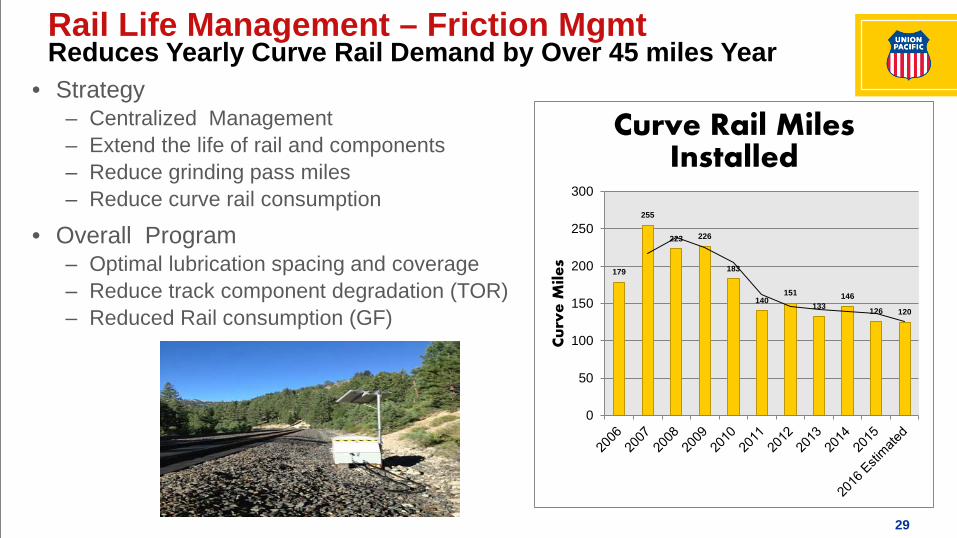
• Strategy– Centralized Management – Extend the life of rail and components– Reduce grinding pass miles– Reduce curve rail consumption
Rail Life Management – Friction MgmtReduces Yearly Curve Rail Demand by Over 45 miles Year
179
255
223 226
183
140151
133146
126 120
0
50
100
150
200
250
300
Cu
rve
Mile
s
Curve Rail Miles Installed
30
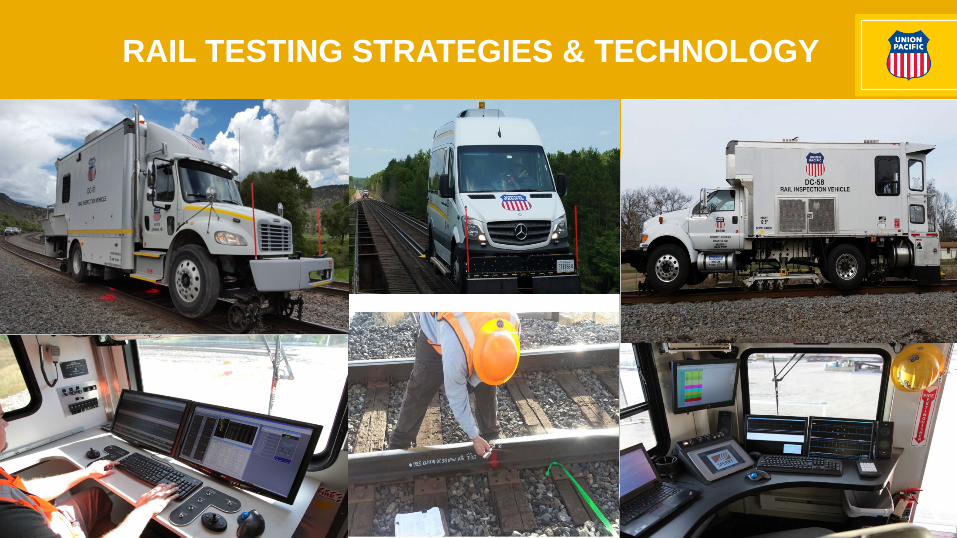
RAIL TESTING STRATEGIES & TECHNOLOGY
31
Vendors and TechnologyNordco - 12 DSP - UP Owned
• Pattern Recognition• Gage Wheel Technology• Line Scan Cameras• 4 w/ KLD Laser Rail Profile System
Sperry - 8 950/ 4 700 – UP Owned• Pattern Recognition• Gage Technology – X-Fire• Line Scan Cameras• 10 B Scan Walking Sticks
Sperry (2 Contract as needed)• Crossfire Wheel Technology –• Induction Technology Available
Representation of Sperry Gage Wheel Technology
Representation of Nordco’s Gage Wheel Technology
32
Small Platform Testing• Sperry Sprinter Van & Nordco Flex• 3 Sperry units on property 1/15.• 1 Additional in December 15. • 1 Nordco Flex – 10/15• Miles Per Hour Test Speed up to avg 7.8• Solid Defect Detection• New Carriage Designs• Vision Systems• Mainline, Yard, Industry Testing• 30% Lower Operating Cost
33
Yard & Industry Testing Strategy• Herzog unit in Kansas City, St Louis and Chicago.• Sperry Unit Started in LA – 10/15• Track Access from Anywhere. • Fully recordable testing platform. • Perfect platform for Yard and Industry tracks, CNRT,
Critical leads, etc.• Crew equipped with a Walking Stick to
better utilize production time – plug rails,Xovers, Ladder tracks, etc.
• 1 Unit on Each Region in 16• Sperry will sell units in 17• Contract Cost is 40% Less
Herzog
Sperry
34
High Speed / Non Stop Strategy
• Required a formal Waiver from the FRA. • Waiver provides 72 hour delay between test and
verification of suspect indications. • Detector car tests non stop at maximum
allowable speed and collects data (20 mph).• Test data is uploaded every 10 miles. • Post test results are transmitted back to field
verification team within 6 hours of upload.• Verification team travels via right of way or rail
to identified locations to hand verify. •As frequency of test progresses, anomalies,
track structure, etc. is overridden – reducesthe number of false positives – allows the D Carto increase test speeds, reduces / eliminates false hand verification.
• Results in faster cycles, smaller / less defects / reduction in slow orders, variability, etc.
• Coordinate with Network Planning to accurately fund and execute projects– Chronic Slow Order report– Future growth
• Understand risk to the network fluidity generated by landslides, rock slides, wash outs– Richmond Slide– Minnow Slide– Great Salt Lake Causeway– Neepas Slide– Rockfall mitigation
• Focus on building front line manager understanding of best practices– Culvert maintenance– Trench drains– Shear keys
Geotech Overview
36
Geotech OverviewGPR – Ground Penetrating Radar
• Assessment protocol being developed to drive decisions for the BUC undercutting program, approximately $23M in 2016
• The following metrics will combine to drive the undercutting decision process:– Fouling Index (from GPR)
• Remaining Ballast Life• Years since last ballast maintenance
– Route Classification• TIH, Passenger
– Yearly Tonnage– Surface and Line Slow Orders – Surface Quality Index (SQI)– Tie Type, Condition, Previous Cycle
37
June 2014
November 2014
Top zone
Deep zone
Intermediate
Top zone
Deep zone
Intermediate
Mud pumping section
Cleaned ballast section
GPR – Ground Penetrating RadarSpringfield Sub MP 256.5 Example from 2014