16
| Date post: | 31-Mar-2015 |
| Category: |
Documents |
| Upload: | porter-henning |
| View: | 227 times |
| Download: | 3 times |
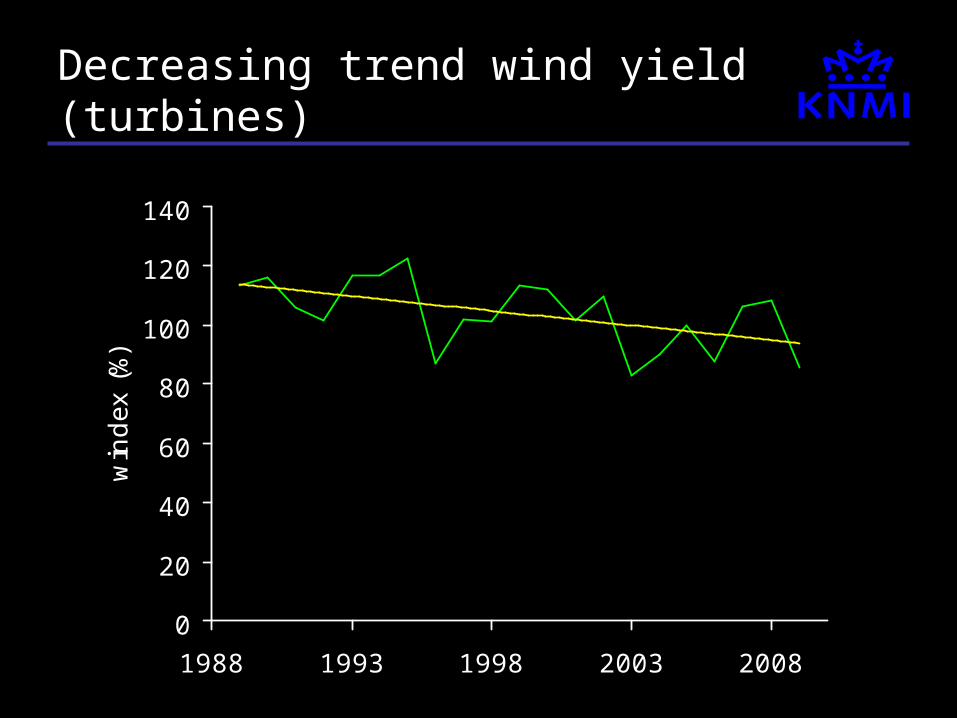
Decreasing trend wind yield (turbines)
0
20
40
60
80
100
120
140
1988 1993 1998 2003 2008
win
dex
(%
)
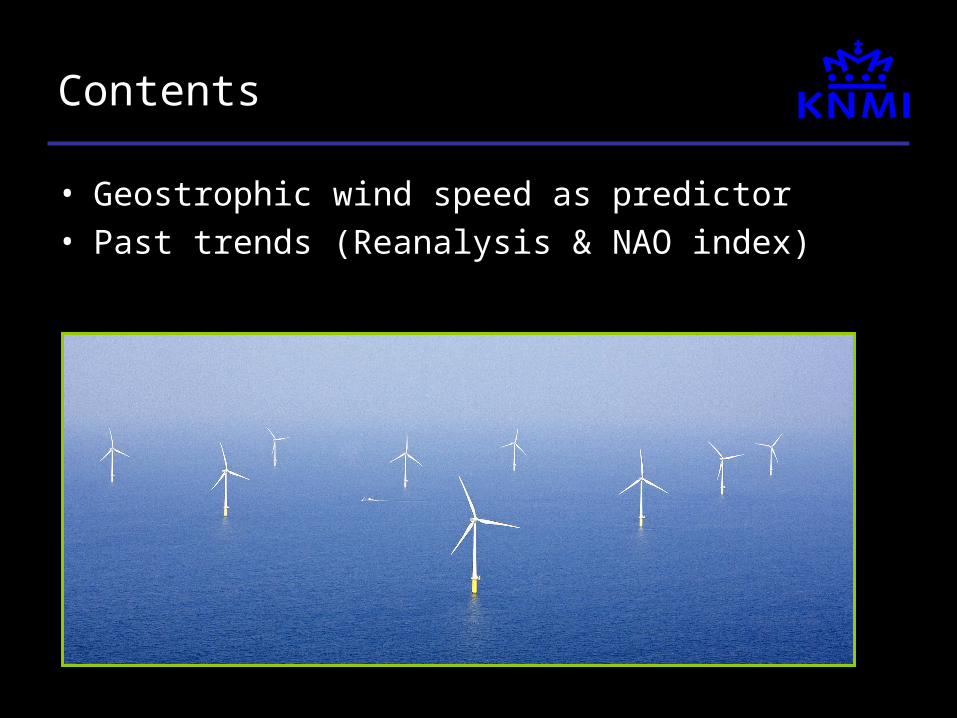
Contents
• Geostrophic wind speed as predictor• Past trends (Reanalysis & NAO index)
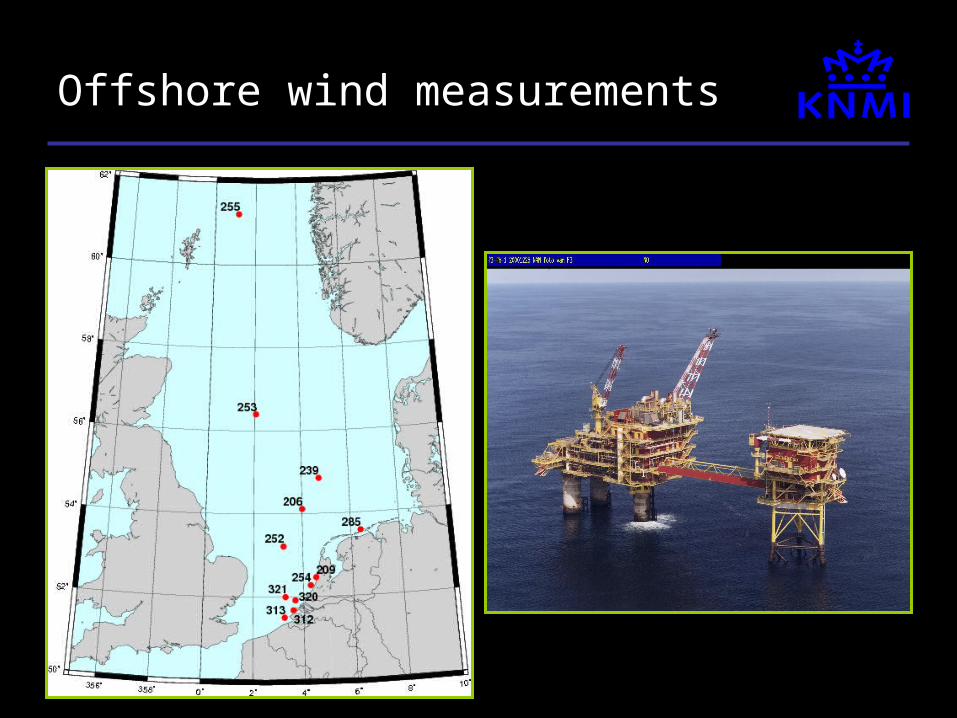
Offshore wind measurements
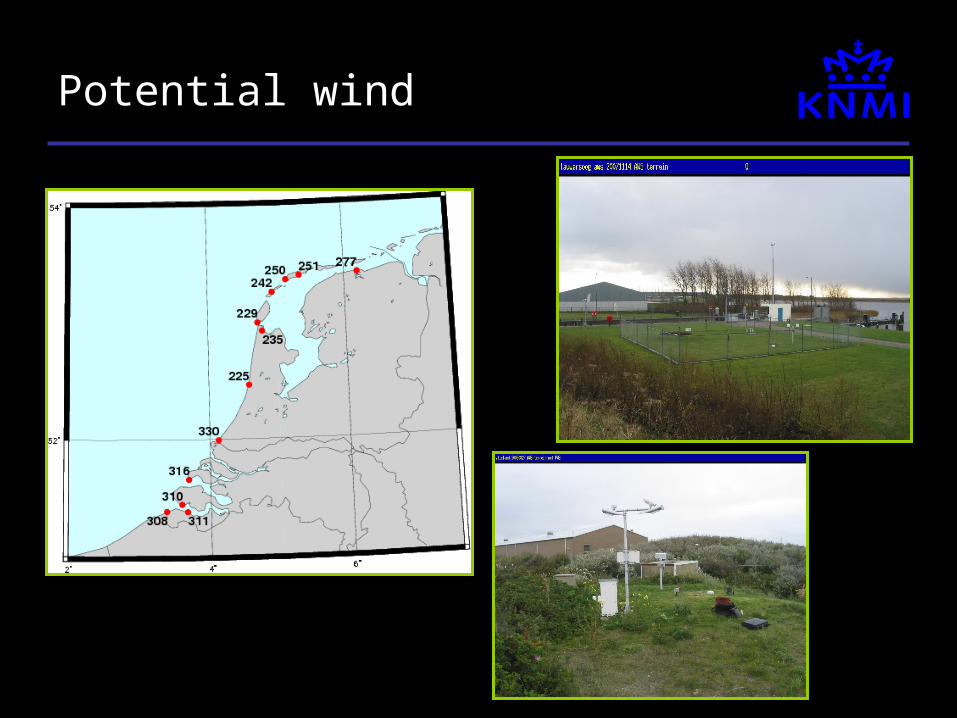
Potential wind
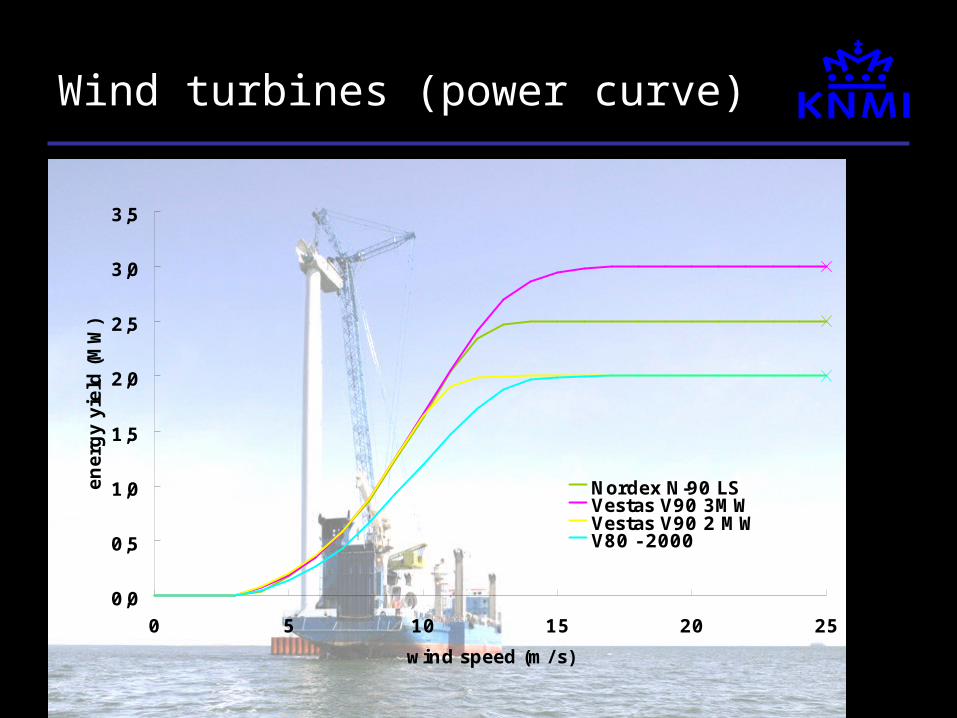
Wind turbines (power curve)
0,0
0,5
1,0
1,5
2,0
2,5
3,0
3,5
0 5 10 15 20 25
wind speed (m/ s)
energ
y y
ield
(M
W)
Nordex N-90 LSVestas V90 3MWVestas V90 2 MWV80 - 2000
Geostrophic wind speed
• ERA40 2.5 x 2.5 1958-2001• ERA Interim 1.5 x 1.5 1989-
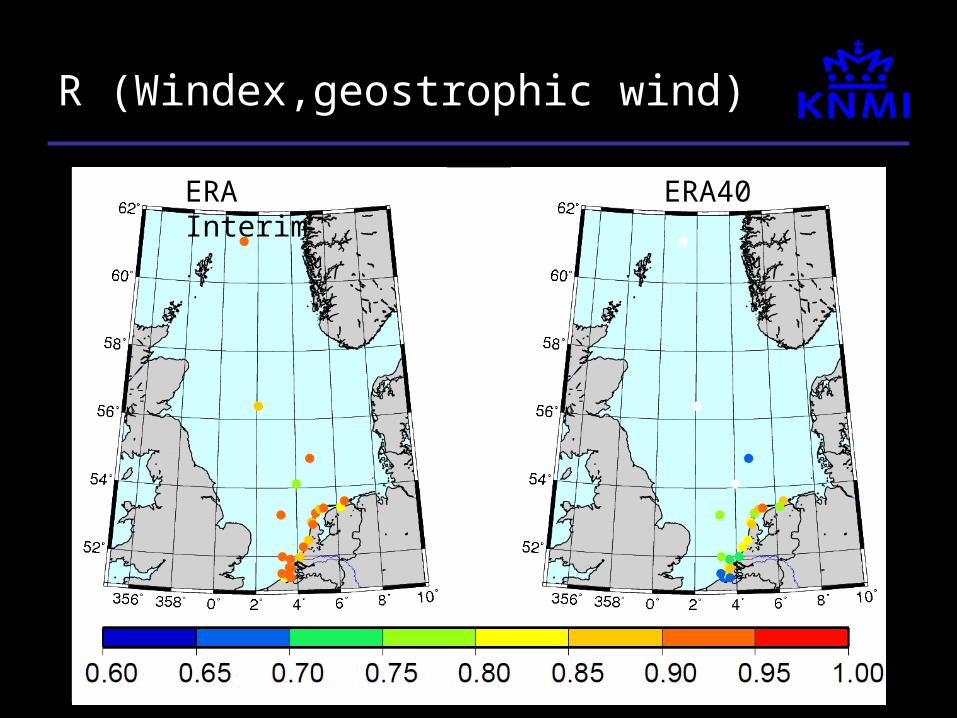
R (Windex,geostrophic wind)
ERA Interim ERA40
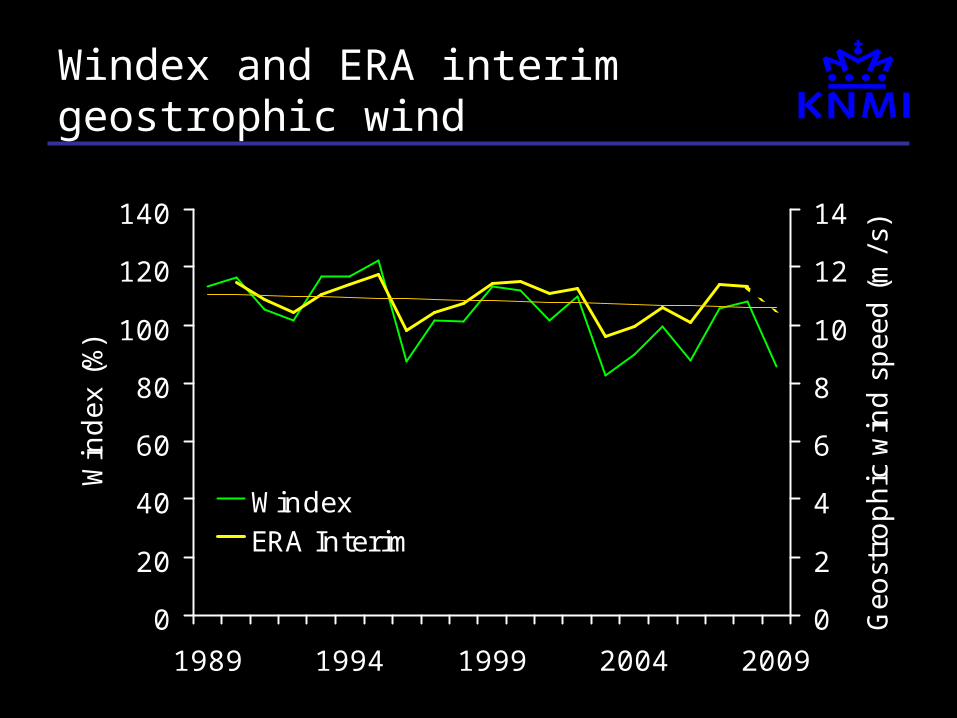
Windex and ERA interim geostrophic wind
0
20
40
60
80
100
120
140
1989 1994 1999 2004 2009
Win
dex
(%
)
0
2
4
6
8
10
12
14
Geo
stro
phic
win
d s
pee
d (m
/s)
WindexERA Interim
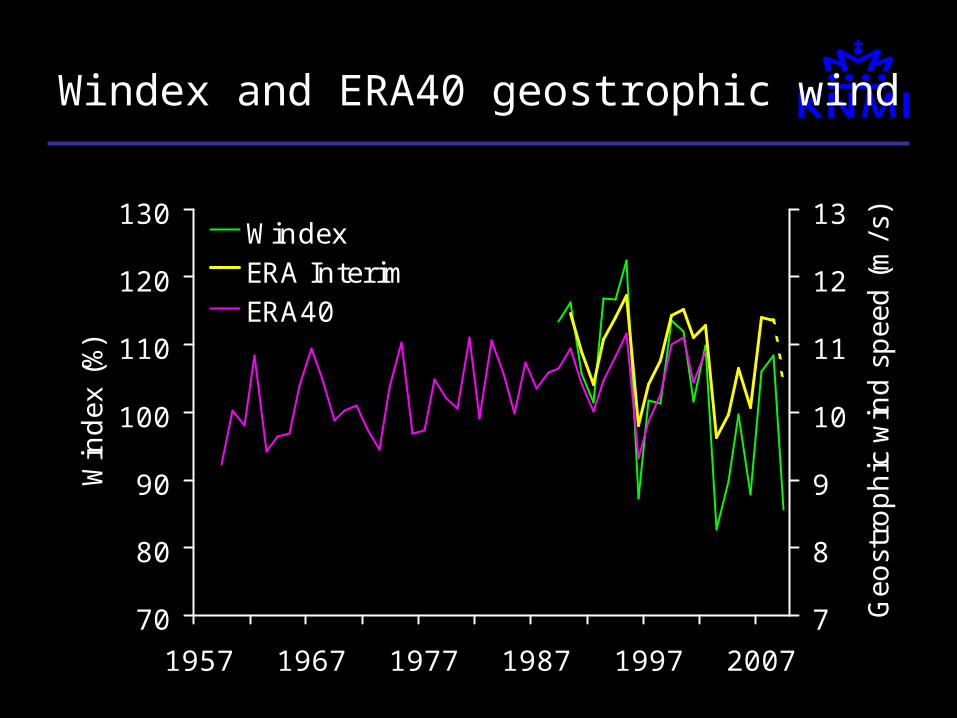
Windex and ERA40 geostrophic wind
70
80
90
100
110
120
130
1957 1967 1977 1987 1997 2007
Win
dex
(%
)
7
8
9
10
11
12
13
Geo
stro
phic
win
d s
pee
d (m
/s)
WindexERA InterimERA40
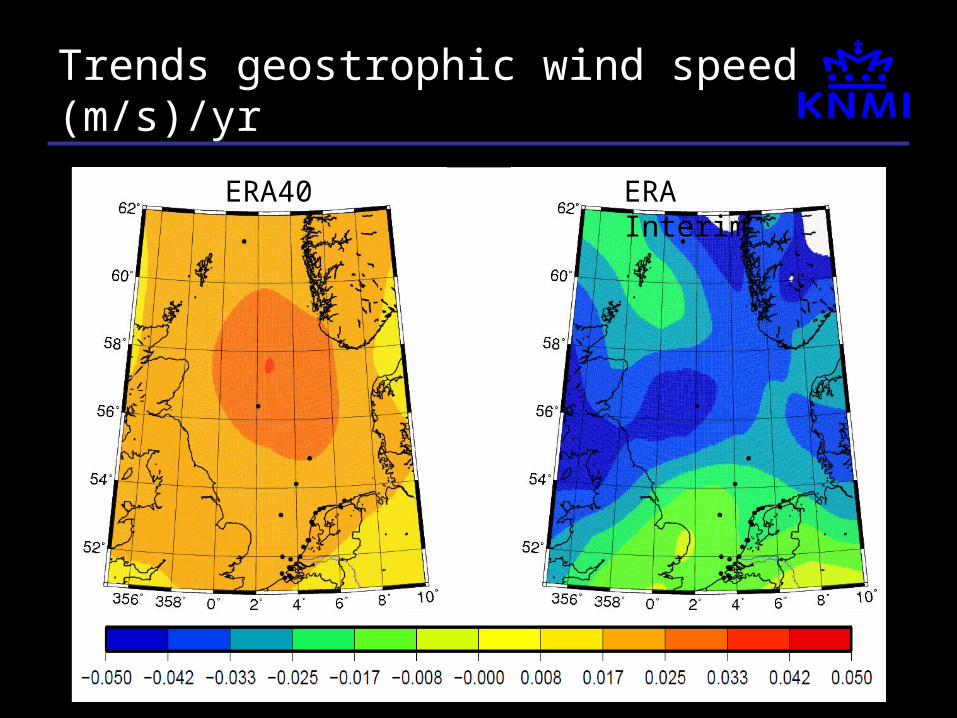
Trends geostrophic wind speed (m/s)/yr
ERA InterimERA40
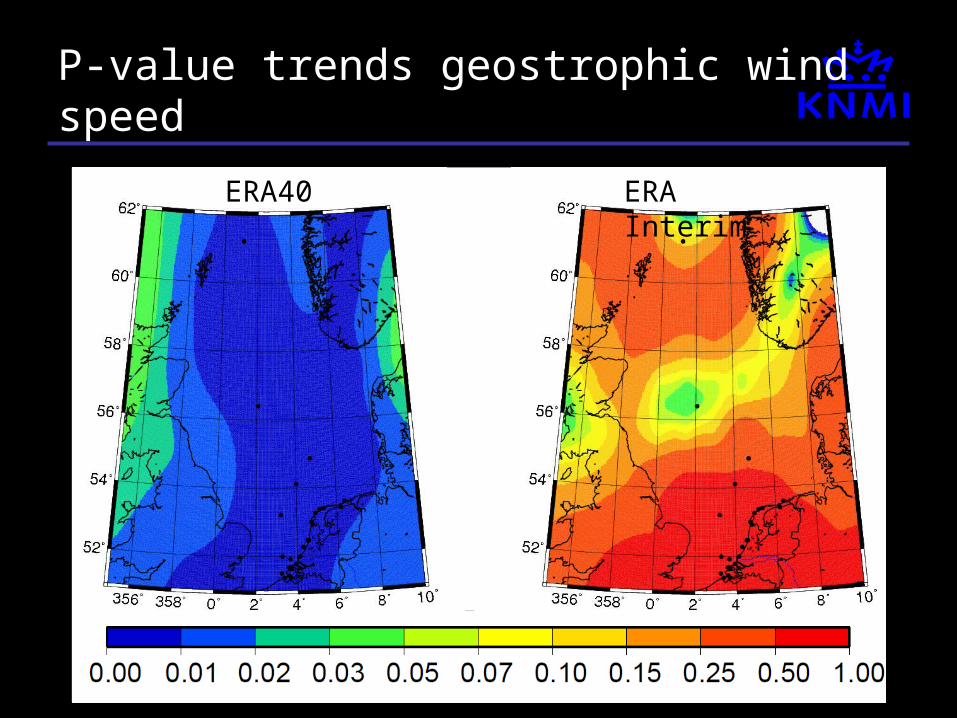
P-value trends geostrophic wind speed
ERA InterimERA40
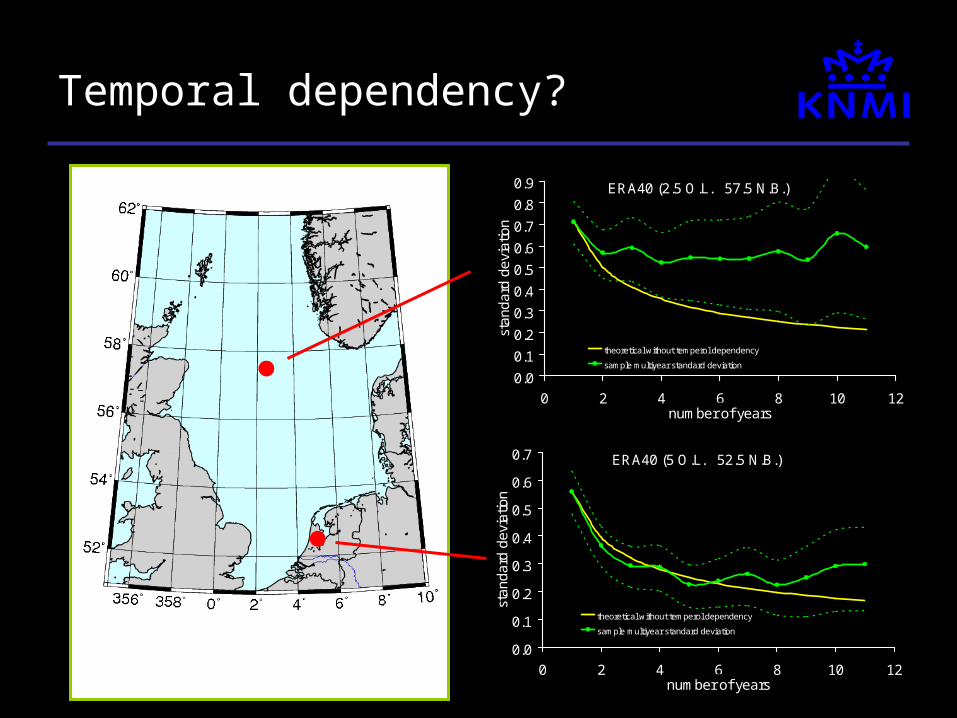
Temporal dependency?
ERA40 (5 O.L. 52.5 N.B.)
0.0
0.1
0.2
0.3
0.4
0.5
0.6
0.7
0 2 4 6 8 10 12number of years
sta
nd
ard
de
via
tion
theoretical without temperol dependency
sample multiyear standard deviation
ERA40 (2.5 O.L. 57.5 N.B.)
0.0
0.1
0.2
0.3
0.4
0.5
0.6
0.7
0.8
0.9
0 2 4 6 8 10 12number of years
sta
nd
ard
de
via
tion
theoretical without temperol dependency
sample multiyear standard deviation
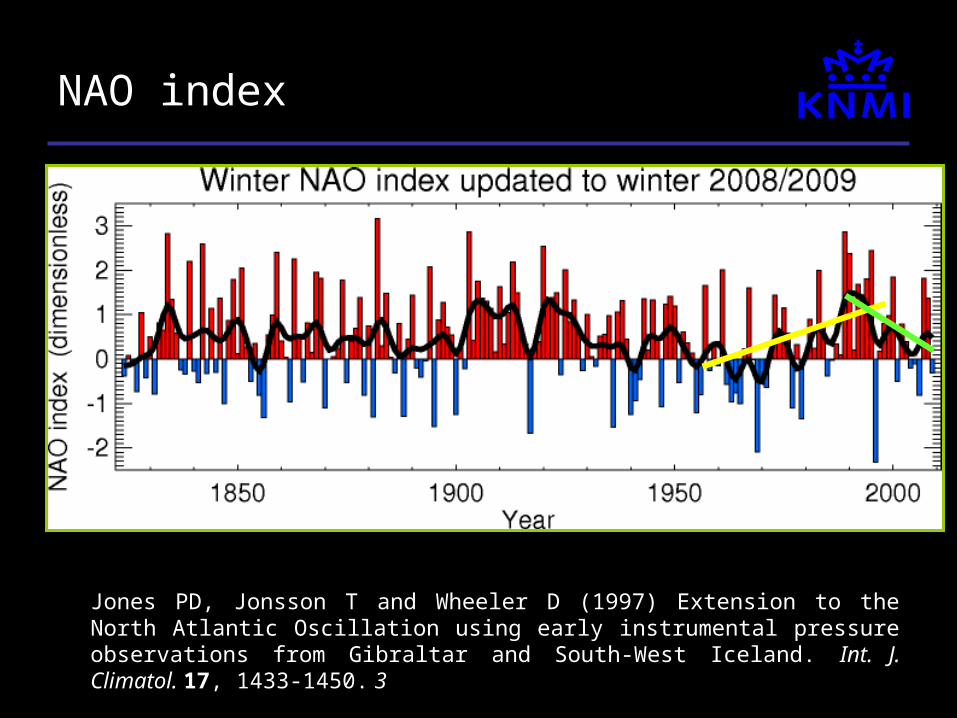
NAO index
Jones PD, Jonsson T and Wheeler D (1997) Extension to the North Atlantic Oscillation using early instrumental pressure observations from Gibraltar and South-West Iceland. Int. J. Climatol. 17, 1433-1450. 3
Conclusions
• Trends in wind yields are not caused by climatological trends
• Geostrophic wind speed and NAO index are good predictors for “relative” wind yields in the North Sea
• Is there temporal dependency (autocorrelation, persistence)?

What causes the increasing difference?
80
90
100
110
120
130
1989 1994 1999 2004 2009
Win
dex
(%
)
8
9
10
11
12
13
Geo
stro
phic
win
d s
pee
d (m
/s)
WindexERA Interim