15
© Vattenfall AB 1 Measuring Wind in Forest and Wind Resource Estimate! Måns Håkansson Thomas Stalin
| Date post: | 08-Aug-2015 |
| Category: |
Documents |
| Upload: | thomas-stalin |
| View: | 29 times |
| Download: | 2 times |

© Vattenfall AB 1
Measuring Wind in Forest and Wind Resource Estimate! Måns Håkansson Thomas Stalin

© Vattenfall AB
Background
• Wind Power is never easy • Little experience of wind power in Forest • Genuin uncertainty
– Wind resurse – Loads – Production
• Rapid installation 200-300 MW per year from 2010
• Generate knowledge ASAP
© Vattenfall AB
Three areas of work
• Wind measurements in forest
– Wind potential – Turbulens – Wind shear
• Two Testturbines at Rynningsnäs
– Nordex N90 80/100 height – Load Measurements
• Research program
– CFD, Lidar, COAMPS and Storm

© Vattenfall AB
Wind Measurements
Own measurements: • Five own masts on sites 100 to 140 meter • One research mast of 210 m instr. 7 levels • >10 Telecommaster, 90/72 meter, two levels, • >10 Sodar measurements

© Vattenfall AB
Measurement Grid South Sweden

© Vattenfall AB
Telecommast
Positiv • Fast instrumentation • No permit • Cost efficient • Measurement of wind speed
and direction, tempreture, air pressure and humidity
• Electricity for heated instruments
• Reference serie Negativ
• Distance to site • Larger uncertainty • Disturbance from other
equipment

© Vattenfall AB
Rynningsnäs

© Vattenfall AB
Wind Evaluation
• Nomal one years of measurement • Three years prefered • Summer equaly low wind speed • Winter that makes difference • Difficult to make normal year correction
– No reference series – No Wind turbine production – Large differense in wind index
– Swedish index – Danish index – NCAR
– How to compare with MIUU

© Vattenfall AB 27 March 2015
12
Normal year correction - results
Standard deviation
Annual production (MWh)
Danish 5.6% 4100
NCAR (production) 6.2% 3700
Single turbine (Målajord) 6.3% 3900
Swedish 7.1% 3600
NCAR (wind) 12.5% 3800

© Vattenfall AB
Sodar
• Test at Ryningsnäs together with 96 m measurement mast • From December –07 until June –08 • Wind speed, wind shear and turbulence data • Reliable 98-99%, data availability • 0,1 m/s less than mast measurements • Lidar method development, vary fragile and 4x cost.
10%
15%
20%
25%
30%
35%
0 5 10 15 20Wind speed (m/s)
Turb
ulen
ce in
tens
ity (%
)
IEC: A class
IEC: B class
Mast 97 m
Sodar 100 m
Sodar 125 m
Sodar 150 m

© Vattenfall AB
Ryningsnäs load measurements
• Nordex N90 80 and 100 m hub height • Strain gauges
– Blade roots – Main shaft – Tower top – Tower bottom
• PLC signals • Measurement mast 140 m • ECN instrumentation • Evaluate together with Nordex
– Compare with design loads and measured loads on prototype
– Power curve in forest

© Vattenfall AB
Computerised Fluid Dynamics
• Follow the development • Modells not accurate enough, round robin test • Indication of problem • Further time for method development
– Tree canopy model – Boundary conditions
• First test on flat forest together with Lidar measurements
• Dream to have CFD, together with wind measurement from site,
decribe the full wind field over the area.

© Vattenfall AB
STORM
• MM5 • Area 150 x 150 km • 1 km2 resolution • 48 hours prognosis two
times per day • Part of normal weather
prognosis • Compare with
measurements and evaluate
• Try all possible methods
© Vattenfall AB
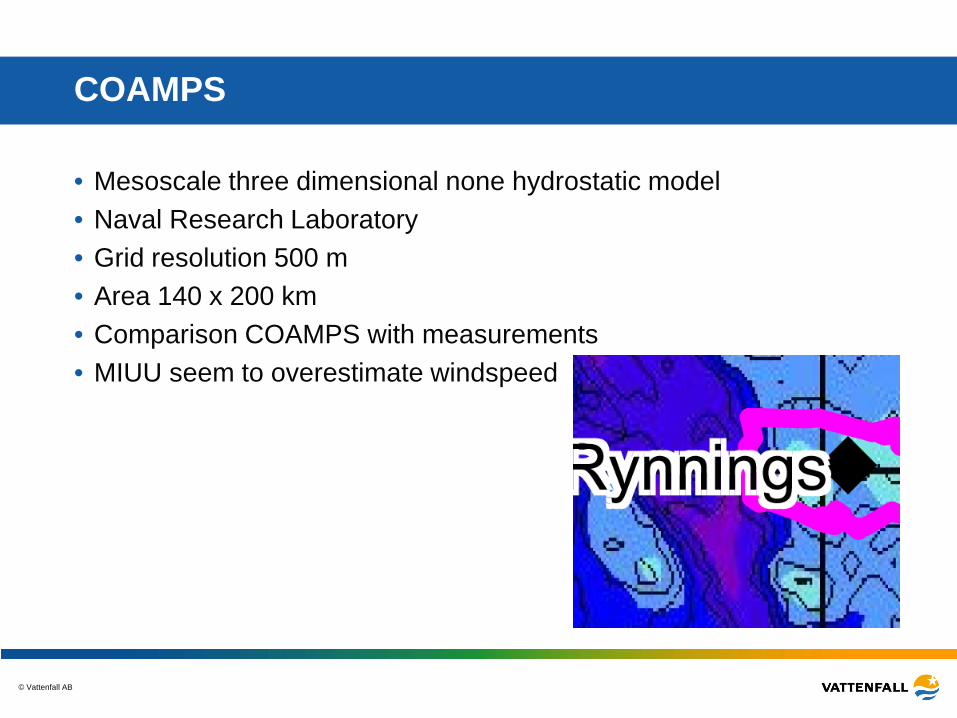
COAMPS
• Mesoscale three dimensional none hydrostatic model • Naval Research Laboratory • Grid resolution 500 m • Area 140 x 200 km • Comparison COAMPS with measurements • MIUU seem to overestimate windspeed

© Vattenfall AB
Future is Higher Towers
• Measurements show that the average yearly windspeeds in south of Sweden on 100 meter hub hight gives too low IRR
• Increase of hub hight to 140 meter gives 50% higher production
• With cost efficient towers it is possible to give better rate of return
• Steel Towers reached upper limit => – Hybrid concrete towers – Lattice or Hybrid lattice towers


