+ All Categories
Home > Documents > Wind power - sustainable power for the future · Wind power - sustainable power for the future Sept...

Wind power - sustainable power for the future · Wind power - sustainable power for the future Sept...

Date post: 20-Apr-2020
Category:
Upload: others
View: 2 times
Download: 0 times
Share this document with a friend
6
Wind power - sustainable power for the future Sept 2013 Contributed to www.skillsworkshop.org by Maria Veselova-Smith In this project you will: Plan a windmill farm Analyse a situation in Europe Write a report based on facts and your opinion September 2013. www.skillsworkshop.org L1-L2 Functional Maths Contributed by Maria Veselova-Smith
Transcript

Wind power - sustainable power for the

future

Sept 2013 Contributed to www.skillsworkshop.org by Maria Veselova-Smith

In this project you will:

Plan a windmill farm

Analyse a situation in Europe

Write a report based on facts and your opinion

September 2013. www.skillsworkshop.org

L1-L2 Functional Maths Contributed by Maria Veselova-Smith

Wind is a clean source of renewable energy. Wind is free and operational

costs are nearly zero once a turbine is built. The wind energy industry is

booming. Globally, generation more than quadrupled between 2006 and

2012. Industry experts predict that by 2050 one third of the world's

electricity will be provided by wind turbines.

Source: National Geographic 2013

James is a farmer in South-west England.

South-west England is one of the more exposed areas

of the UK, with average wind speeds only greater in

western Scotland. James decided to install wind

turbines that generate wind energy on some of his

farmland.

James needs to make a decision,

based on a wind rose, where to set his

wind turbines: in Avonmouth (near

Bristol) or in Plymouth.

The direction of

the wind is defined

as the direction

from which the

wind is blowing.

Questions:

1. What does the word

‘quadrupled’ mean?

2. In 2012 the global wind power

capacity reached 282 MW.

What was the global wind

power in 2006?

3. The fourth line includes the

phrase ‘one third’. Represent

‘one third’ using a diagram

and then using symbols.

Question 4: can you help him

to choose the best location?

Justify your answer.

Note: 1 megawatt (MW) = 1 000 Kilowatts (KW) = 1 000 000 watts (W)

Co

ntr

ibu

ted

by

Mar

ia V

ese

lova

-Sm

ith

September 2013. www.skillsworkshop.org

L1-L2 Functional Maths Contributed by Maria Veselova-Smith

James knows that 6KW wind turbines have a rotor spanning up to 65

metres in diameter. What is the maximum number of wind turbines he

will be able to install? In which ways can he locate them and not to

disturb neighbours?

2 cm

3

cm ....and another

way?

Scale 1:10000

By selling produced

energy to the energy

company I think I will

cover my expenses and

start earning money

after seven months. Am

I right?

Installation cost of a 6kW pole-mounted system £22,000

Energy generated per year by a 6KW pole-mounted system 10,000kWh

The energy supplier pays a set rate for each unit (or kWh) of

electricity generated.

21.65p/kWh

Additional rate paid by the energy supplier for each unit (or

kWh) exported back to the electricity grid.

4.64p/kWh

Maintenance cost per year £200

Co

ntr

ibu

ted

by

Mar

ia V

ese

lova

-Sm

ith

September 2013. www.skillsworkshop.org

L1-L2 Functional Maths Contributed by Maria Veselova-Smith

Going global.... UK wind power capacity 1990–2011

Source: Wikipedia, 2013 Questions:

5. Can you predict the wind power capacity in

the UK by 2020?

6. Is it more or less than official target of

28,000 MW?

7. What factors can change this prediction?

In 2012 wind generated energy provided 6% of the total

energy consumption.

Question 8:

Statistical information can be presented

using percentages or fractions. Rewrite the

sentence above using fractions instead of

percentages.

Germany, Spain and the UK are European leaders in wind power capacity.

In 2011 Germany generated 29,000 MW, while Spain generated 21,700 MW.

The UK produced around 6,000 MW in 2011

Source: The European wind energy association, 2013

The table below shows wind power as a share of the total electricity

production in the EU.

Question 9:

How can you explain, that

although Germany is a

leader in wind power

production, the largest

share of the total

electricity production is in

Denmark?

But:

Co

ntr

ibu

ted

by

Mar

ia V

ese

lova

-Sm

ith

September 2013. www.skillsworkshop.org

L1-L2 Functional Maths Contributed by Maria Veselova-Smith

You have learned about wind

power in the UK and Europe.

Imagine that you need to write

an article for a local newspaper.

The purpose of the publication is

to improve the public view of

wind turbines as a part of the

landscape.

Hints:

-Statistics is a powerful tool. Do you remember that data can be represented in various

ways?

-Why not try looking on-line for extra information?

-You can start from the following websites:

-http://www.funkidslive.com/features/curious-kate/curious-facts-about-wind-power/ - key

facts about wind energy

-http://www.ewea.org/statistics/ - the European Wind Energy Association

Co

ntr

ibu

ted

by

Mar

ia V

ese

lova

-Sm

ith

September 2013. www.skillsworkshop.org

L1-L2 Functional Maths Contributed by Maria Veselova-Smith

Teachers’ notes and answers:

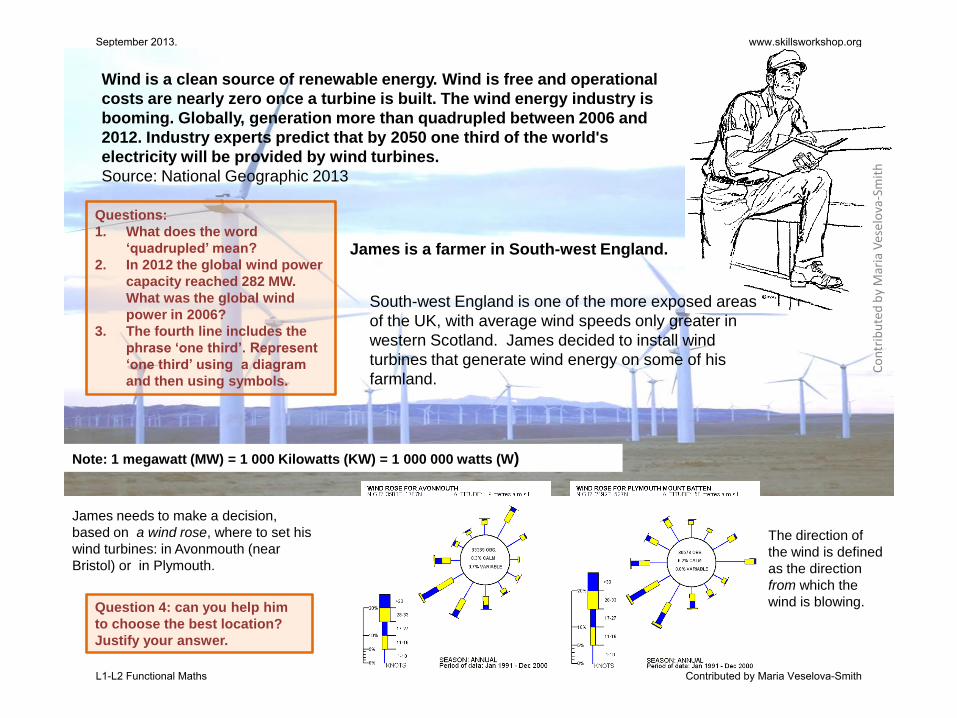
• Slide 2. Answers: 1. the word ‘quadrupled’ means 'four times’. 2. Total energy generated by wind turbines in 2006 was 70.5MW. If students round the number, they will be able to carry out division without a calculator. 3. Students are encouraged to draw different shapes for shading 1/3. 4. The farm at Plymouth would be more suitable because there are stronger winds as well as longer periods of wind.

• Slide 3. Students will probably draw grid of 3 by 4 wind turbines. However, is this the most efficient way of locating wind turbines? How to minimize the loss of the unused area? Students can draw and/or make calculations through triangles by using Pythagoras theorem or estimation (depending on previously taught knowledge).

Calculating income: watch for a common error of converting pence into pounds. In fact it will take approximately 7 years to cover his initial expenses as well as ongoing costs.

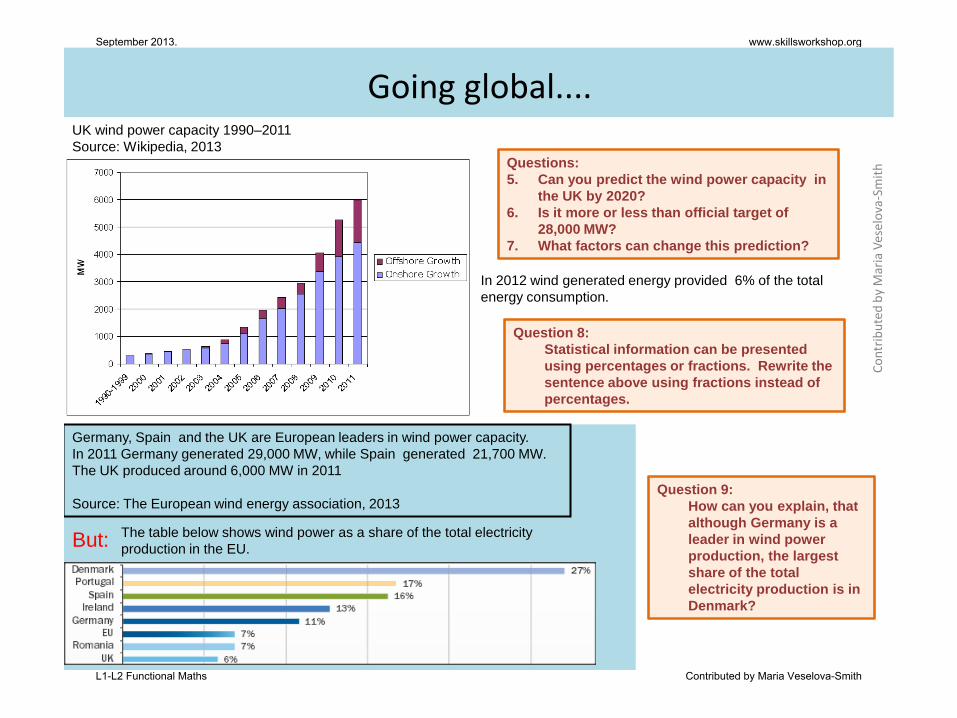
• Slide 4. Answers 5: Students might suggest absolute (additive) comparison between years , which results in a linear relationship (e.g. Increase of 2000 MW every two years). In fact, to find the rate of increase means to find relative (multiplicative) relationship . Different approaches are valid. Some students might find the rate of the last 9 years and apply it to find the 2020 wind capacity. Others, might find the rate of the last year (e.g. every year, it will increase by 1/5) and calculate year by year. Students should be aware about limitations of modelling (various factors might affect the rate in the future) 7. E.g. Political decisions, climate change, prices for other sources of energy .9. Although Denmark produces less wind power than Germany overall, the share compared to other sources of energy is higher than in Germany. Circular diagrams of individual countries can help.

• Slide 5. This is an opportunity for a cross-curricular activity. For example, English language teachers might want to develop written skills based on the discussed and discovered mathematics.

Co

ntr

ibu

ted

by

Mar

ia V

ese

lova

-Sm

ith

September 2013. www.skillsworkshop.org

L1-L2 Functional Maths Contributed by Maria Veselova-Smith


Recommended