American Institute of Aeronautics and Astronautics 1 Wind Tunnel Test of Gurney Flaps and T-Strips on an NACA 23012 Wing Michael A. Cavanaugh 1 Virginia Tech, Blacksburg, VA, 24061 Paul Robertson 2 Aeronautical Testing Service, Inc., Arlington, WA, 98223 and William H. Mason 3 Virginia Tech, Blacksburg, VA, 24061 A wind tunnel test was carried out on an aspect ratio 6 wing equipped with Gurney flaps and trailing edge T-strips. The test was conducted at the University of Washington Aeronautical Laboratory’s 8 x 12 foot low-speed wind tunnel at Reynolds numbers of 1.95x10 6 , 1.02x10 6 and 0.51x10 6 . The NACA 23012 test wing was unswept and untwisted with a 90 inch span and a constant chord of 15 inches. Gurney flap heights of 0.21%, 0.52%, 1.04%, 1.46%, 2.08%, 3.33%, 4.00% & 5.00% chord were tested on the model. T-strip heights of 0.42%, 1.04%, 1.67%, 2.08%, 2.92%, 4.17% & 5.00% chord were also tested. Results showed that Gurney flaps produced a positive increment in lift coefficient, a negative shift in the zero-lift angle of attack, and an increase in the wing maximum lift coefficient. T- strips produced an increase in the slope of the lift curve and an increase in maximum lift coefficient, but produced no shift in the wing zero-lift angle of attack. Gurney flaps produced a negative (nose-down) shift in the pitching moment curve and a rearward shift in the wing aerodynamic center. T-strips also produced a rearward shift in the wing aerodynamic center, but produced no increment in the pitching moment coefficient near zero lift. Both devices produced a drag increment that was non-linear with device height, larger Gurney flaps and T-strips producing a disproportionately larger drag increment. Nomenclature C L = coefficient of lift C Lmax = maximum lift coefficient C Lo = lift coefficient at zero angle of attack C Lα = lift curve slope, /deg C D = coefficient of drag C Do = coefficient of drag at zero lift coefficient C M = pitching moment coefficient C Mo = pitching moment coefficient at zero lift coefficient e = Oswald’s Efficiency Factor Re = Reynolds Number based on chord x/c ac = aerodynamic center location in percent wing chord x/c ref = moment reference center location in percent wing chord (25% chord for this test) α OL = zero-lift angle of attack, deg Δ = increment in a given coefficient 1 Graduate Student, Department of Aerospace and Ocean Engineering, Senior Member AIAA, [email protected]2 President, Aeronautical Testing Service, Inc., 18820 59 th Drive NE, Arlington, WA 98223, Senior Member AIAA. 3 Professor, Department of Aerospace and Ocean Engineering, Associate Fellow AIAA.
Transcript
American Institute of Aeronautics and Astronautics1
Wind Tunnel Test of Gurney Flaps and T-Strips on anNACA 23012 Wing
A wind tunnel test was carried out on an aspect ratio 6 wing equipped with Gurney flapsand trailing edge T-strips. The test was conducted at the University of WashingtonAeronautical Laboratory’s 8 x 12 foot low-speed wind tunnel at Reynolds numbers of1.95x106, 1.02x10⁶ and 0.51x10⁶. The NACA 23012 test wing was unswept and untwistedwith a 90 inch span and a constant chord of 15 inches. Gurney flap heights of 0.21%, 0.52%,1.04%, 1.46%, 2.08%, 3.33%, 4.00% & 5.00% chord were tested on the model. T-stripheights of 0.42%, 1.04%, 1.67%, 2.08%, 2.92%, 4.17% & 5.00% chord were also tested.Results showed that Gurney flaps produced a positive increment in lift coefficient, a negativeshift in the zero-lift angle of attack, and an increase in the wing maximum lift coefficient. T-strips produced an increase in the slope of the lift curve and an increase in maximum liftcoefficient, but produced no shift in the wing zero-lift angle of attack. Gurney flapsproduced a negative (nose-down) shift in the pitching moment curve and a rearward shift inthe wing aerodynamic center. T-strips also produced a rearward shift in the wingaerodynamic center, but produced no increment in the pitching moment coefficient nearzero lift. Both devices produced a drag increment that was non-linear with device height,larger Gurney flaps and T-strips producing a disproportionately larger drag increment.
Nomenclature
CL = coefficient of liftCLmax = maximum lift coefficientCLo = lift coefficient at zero angle of attackCLα = lift curve slope, /degCD = coefficient of dragCDo = coefficient of drag at zero lift coefficientCM = pitching moment coefficientCMo = pitching moment coefficient at zero lift coefficiente = Oswald’s Efficiency FactorRe = Reynolds Number based on chordx/cac = aerodynamic center location in percent wing chordx/cref = moment reference center location in percent wing chord (25% chord for this test)αOL = zero-lift angle of attack, degΔ = increment in a given coefficient
1 Graduate Student, Department of Aerospace and Ocean Engineering, Senior Member AIAA, [email protected] President, Aeronautical Testing Service, Inc., 18820 59th Drive NE, Arlington, WA 98223, Senior Member AIAA.3 Professor, Department of Aerospace and Ocean Engineering, Associate Fellow AIAA.
American Institute of Aeronautics and Astronautics2
I. Introduction
s part of a study into the use of micro trailing edge devices in aircraft preliminary design, a wind tunnel testwas carried out on an aspect ratio 6 wing equipped with Gurney flaps and trailing edge T-strips. A Gurney flap
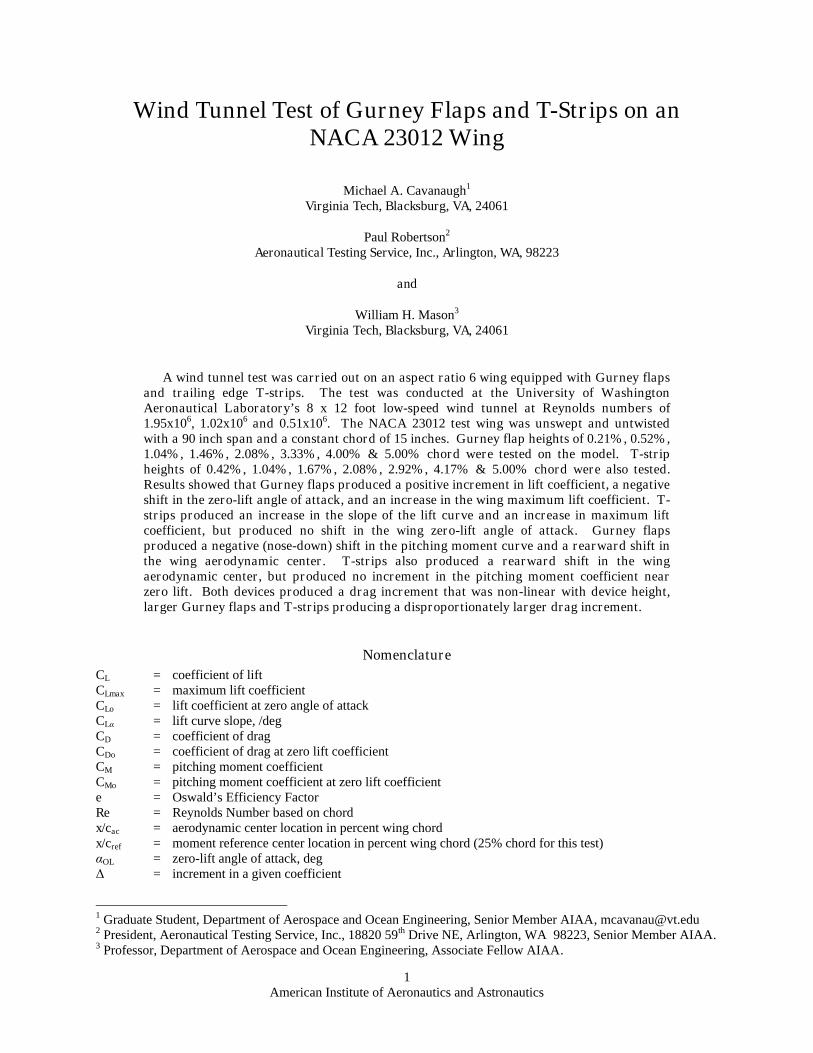
is simply a flat plate attached perpendicularly to the lower (pressure) surface of an airfoil or wing trailing edge. AT-strip is attached to both the upper and lower surfaces. Gurney flaps and T-strips are used to modify the liftingcharacteristics of the baseline airfoil or wing. The simplicity of these micro trailing edge devices is illustrated belowin Figure 1.
Gurney flaps are used to produce a lift increment (ΔCL) and to increase the maximum lift coefficient of two-dimensional airfoils and three-dimensional wings. Typical applications studied have been on the downforce wingsof racing automobiles1, in the cove of multi-element airfoils2 and on wind turbine blades3. In more recent studies,articulated Gurney flap-like devices have been used to tailor the spanwise loading of wings4 and rotor blades5.
Trailing edge T-strips have been used to improve the performance of aircraft vertical tails. An example is theuse of T-strips on the vertical tail/rudder of the Sino Swearingen SJ30-2 business jet to increase dutch roll damping6.Flight tests showed that a 1% chord T-strip on the lower third of the rudder increased dutch roll damping for theflaps up, 180 KIAS flight condition from essentially zero to 0.12, more than double the FAR 23 minimum.
A number of references exist reporting the results of wind tunnel tests of two-dimensional airfoils7,8 and three-dimensional wings9,10 equipped with Gurney flaps. Drawing general conclusions on the effects of Gurney flaps isdifficult because each of these tests was conducted on a model with a different airfoil section and different sizeGurney flaps, and each test was run at a different Reynolds number. What is required is a more comprehensive testfor a full range of Gurney flap heights at several different Reynolds numbers. The test described in this paper wasfor flap heights ranging from as small as 0.21% chord up to 5.0% chord, with the smaller Gurney flaps (0.21%,0.52%, 1.04% & 1.46% chord) being tested at Reynolds numbers of 0.51x10⁶, 1.02x10⁶ and 1.95x10⁶. The trendsseen in this test were similar to that found in previous Gurney flap wind tunnel tests. The contribution here is amore complete data set collected for a range of Gurney flap heights for Reynolds numbers from as low as 0.51x10⁶
on up to 1.95x10⁶.Despite being used on a number of aircraft vertical tails6,11, very little wind tunnel test data exists in the literature
on the effect of trailing edge T-strips. The only wind tunnel test data found was from Roesch & Vuillet12. This datawas for an NACA 5414 wing with a 5% chord T-strip tested at a Reynolds number of 0.75x10⁶. A 5% chord T-stripwould be too large for use on the vertical tail of an aircraft due to its high drag. This paper presents results for T-strips ranging from 0.42% up to 5.0% chord, with the smaller flaps (0.42%, 1.04% & 1.67% chord) being tested atReynolds numbers of 0.51x10⁶, 1.02x10⁶ and 1.95x10⁶.
II. Experimental Setup
The test was conducted at the University of Washington Aeronautical Laboratory’s (UWAL) Kirsten WindTunnel13 located in Seattle, Washington. The Kirsten Wind Tunnel is a closed circuit, double return type tunnelwith an 8 x 12 foot rectangular test section vented to the atmosphere. Model force and moment data is measured byan external balance located beneath the floor of the test section. For this test, the model wing was mounted atop theexternal balance using a yaw fork. The two forward arms of the yaw fork were attached to the model wing at thequarter chord location. This 25% chord location was also the model moment reference center. A single pitch arm,
Gurney flap
T-strip
Figure 1. Gurney Flap and Trailing Edge T-Strip Detail
American Institute of Aeronautics and Astronautics3
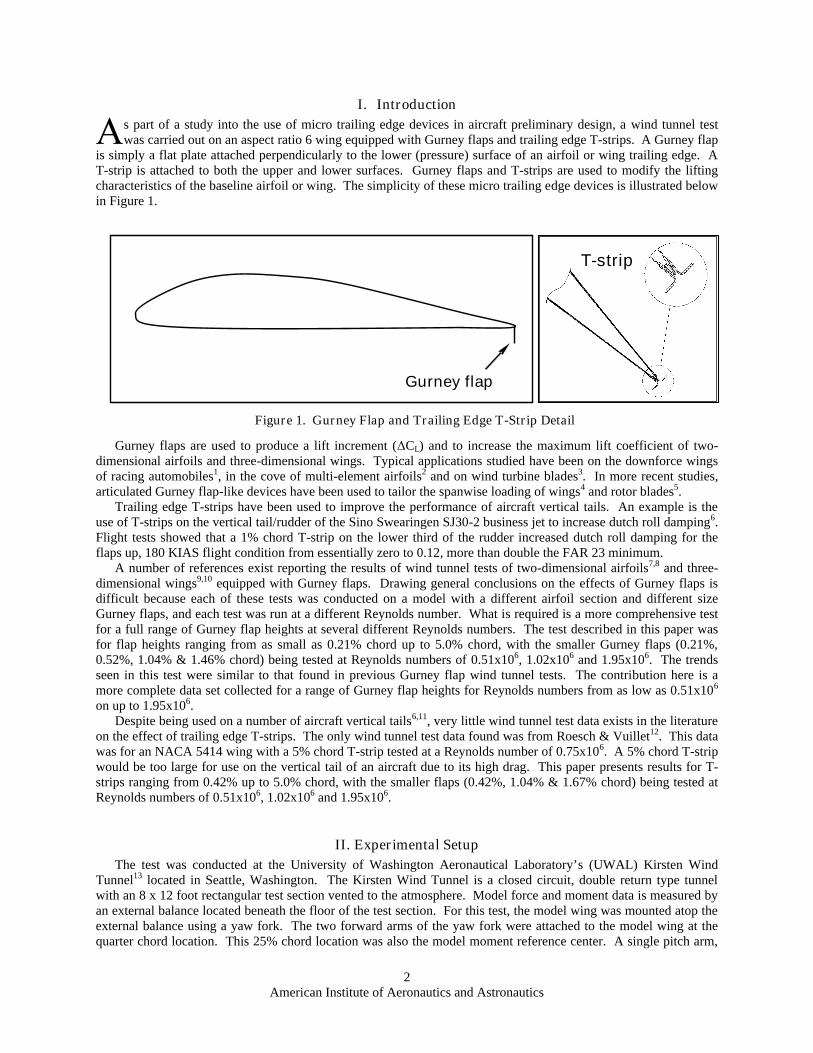
attached to the rear of the model, was used to adjust angle of attack. Model angle of attack was referenced to theairfoil chordline. The test wing is shown in Figure 2 mounted atop the external balance.
The baseline model was an unswept, untwisted, aspect ratio 6 wing built by Aeronautical Testing Service, Inc.Total span was 90 inches with a constant 15 inch chord. The airfoil section was an NACA 23012. The model centersection was machined from aluminum and spanned 86.4 inches. High density polyurethane foam wingtips of 1.8inch span each were attached to the ends of the wing. The NACA 23012 airfoil shape was machined into the firstinch of each wingtip. The outboard 0.8 inches closed out the wingtip with a half circular shape. The wingtip detailis shown in Figure 3. The Figure also shows a 5% chord Gurney flap attached to the model wing trailing edge.Model dimensional tolerances were quoted at ±0.005 inch.
Gurney flap heights of 0.21%, 0.52%, 1.04%, 1.46%, 2.08%, 3.33%, 4.00% & 5.00% chord were tested on themodel wing. Metal angles of standard sizes were mounted to the lower surface trailing edge of the wing to simulateGurney flaps. The mounted angles spanned the 86.4 inch center section of the wing. They did not extend to thewing tips. The percentage of wing span covered by the angles (Gurney flaps) was 96%. The angles were attachedto the underside of the wing using double-sided tape. The thickness of the double-sided tape was measured to beapproximately 0.003 inches. However, the double-sided tape was soft and appeared to lose thickness whencompressed. Aluminum tape was used as an additional means of securing the angles to the wing. The Gurney flapheights quoted above are the height of the angle alone. The thickness of the wing trailing edge (0.050”) and theheight of the double-sided tape were not included. The aluminum tape did not change the height of the Gurney flap.
Trailing edge T-strip heights of 0.42%, 1.04%, 1.67%, 2.08%, 2.92%, 4.17% & 5.00% chord were also tested onthe model. The same metal angles were mounted to the wing upper and lower surface trailing edges to simulate T-strips. The T-strip angles spanned the 86.4 inch center section of the model and did not extend into the wingtips.Double-sided tape was used to attach the angles to the wing trailing edge. Aluminum tape was used as an additionalmeans of securing the angles. The T-strip heights quoted above are based on the height of the upper and lowerangles alone. The model wing’s 0.050” trailing edge thickness and the height of the double-sided tape were notincluded. There was also a small loss in T-strip height because the wing upper and lower surfaces are not parallel atthe trailing edge. The NACA 23012 trailing edge closure angle is approximately 15.5°. This trailing edge anglecaused the upper and lower angles to tilt aft, causing a small loss in total T-strip height. This lost height was alsonot included in the T-strip chords (heights) reported above.
A single row of trip dots (0.0114” height, 0.150” spacing, 0.075” diameter) were applied along the wing 10%chordline on the upper and lower surfaces to fix the position of boundary layer transition from laminar to turbulentflow. The test was conducted at nominal dynamic pressures of 75, 20 & 5 lbs/ft2; corresponding to Reynoldsnumbers based on wing chord of 1.95x10⁶, 1.02x10⁶ and 0.51x10⁶, respectively. Trip sizing studies showed thatboundary layer transition was likely forward of the trip for the 75 and 20 lbs/ft2 runs. However, the trip was toosmall and too far forward to fix the position of boundary layer transition for the 5 lbs/ft2 runs.
Figure 3. Wing Tip DetailFigure 2. Wing Mounted in Test Section
American Institute of Aeronautics and Astronautics4
III. Experimental Results
Force and moment data was collected for the baseline wing, the baseline wing equipped with Gurney flaps andthe baseline wing equipped with trailing edge T-strips. Each configuration was run at Reynolds numbers of1.95x106, 1.02x10⁶ and 0.51x10⁶. The data presented in this paper has been corrected for weight tares, for the tare &interference of the mounting fork, for flow angularity in the test section, for blockage and for the effect of the tunnelwalls on the model’s aerodynamic characteristics.
The weight tare was applied to account for the offset of the model wing’s center of gravity from the balancemoment center. That weight tare was taken with the wind-off during Run 1. A UWAL provided tare was applied tolift, drag and pitching moment to account for the presence of the mounting fork on the data. That generic fork tarewas based on a UWAL model inversion test of a similar sized rectangular wing with an NACA 0015 airfoil section.The blockage correction was made to dynamic pressure using Shindo’s Simplified Tunnel Correction Method14 toaccount for the increased velocity in the test section due to the presence of the model. A small correction to the dragcoefficient was made to account for the rotation of the lift vector due to the -0.12° of upflow in the test section.Wall corrections were applied to angle of attack and drag coefficient to account for the proximity of the tunnel wallsto the model. The constraint of the flow field due to the tunnel walls makes the model wing appear to have a higheraspect ratio, and thus too little induced angle of attack and too little induced drag. Nominal turbulence intensity inthe test section is quoted in the tunnel Technical Guide13 as 0.72%.
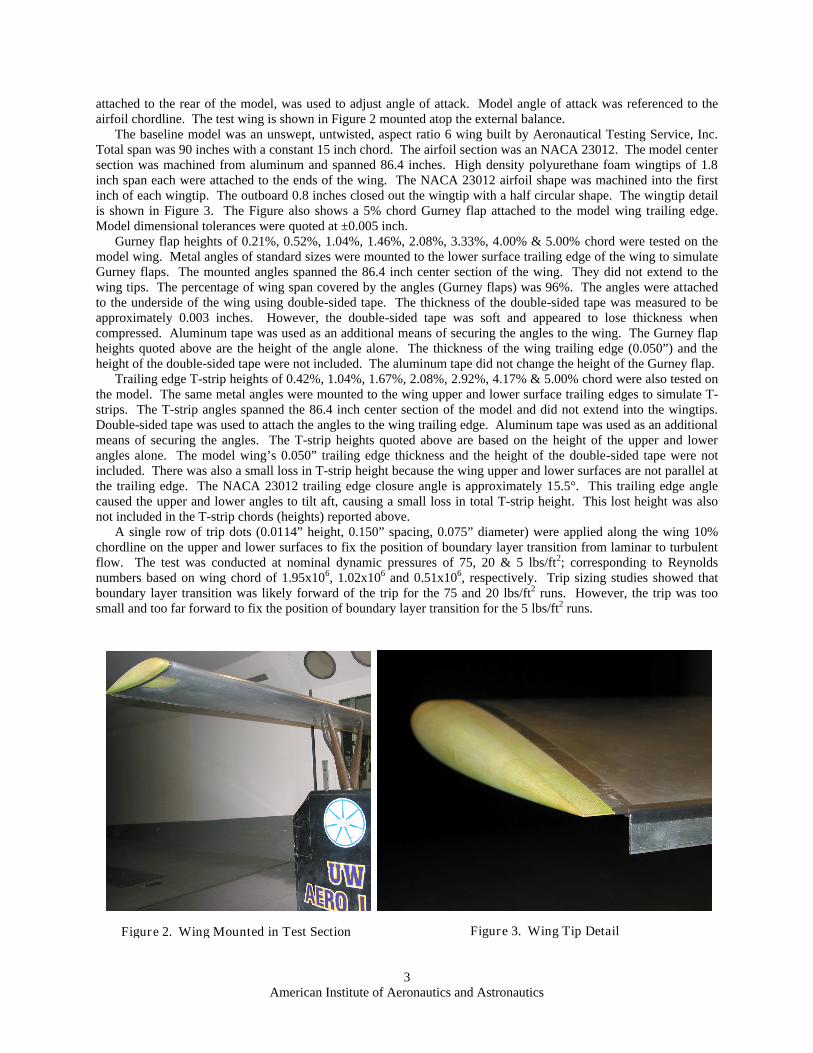
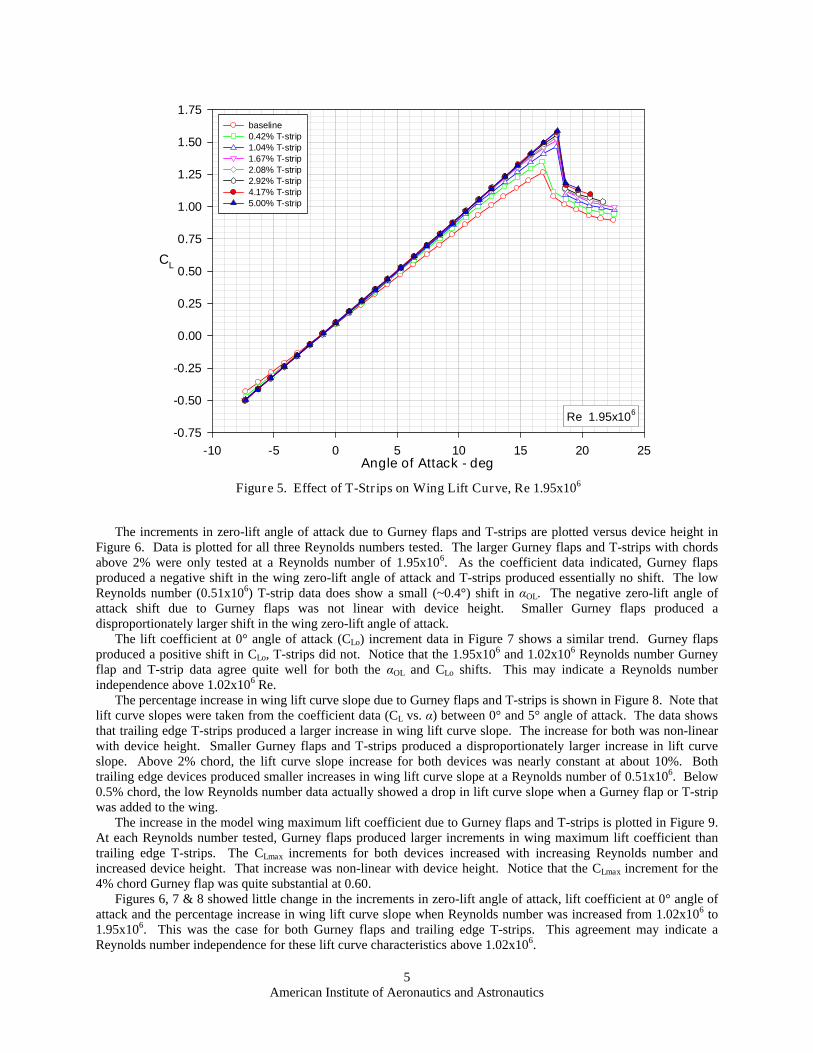
A. Effect of Gurney Flaps and T-Strips on Baseline Wing Lift CurveThe effect of Gurney flaps on the baseline wing lift curve is shown below in Figure 4. Figure 5 shows the effect
due to trailing edge T-strips. The coefficient data presented in Figures 4 and 5 was taken at a Reynolds number of1.95x106. The coefficient data shows that Gurney flaps produced a positive increment in lift coefficient, a negativeshift in the zero-lift angle of attack, and an increase in the wing maximum lift coefficient. Larger Gurney flapsproduced larger lift increments. T-strips produced an increase in the slope of the lift curve and an increase inmaximum lift coefficient. However, T-strips produced no shift in the wing zero-lift angle of attack.
Figure 4. Effect of Gurney Flaps on Wing Lift Curve, Re 1.95x10⁶
American Institute of Aeronautics and Astronautics5
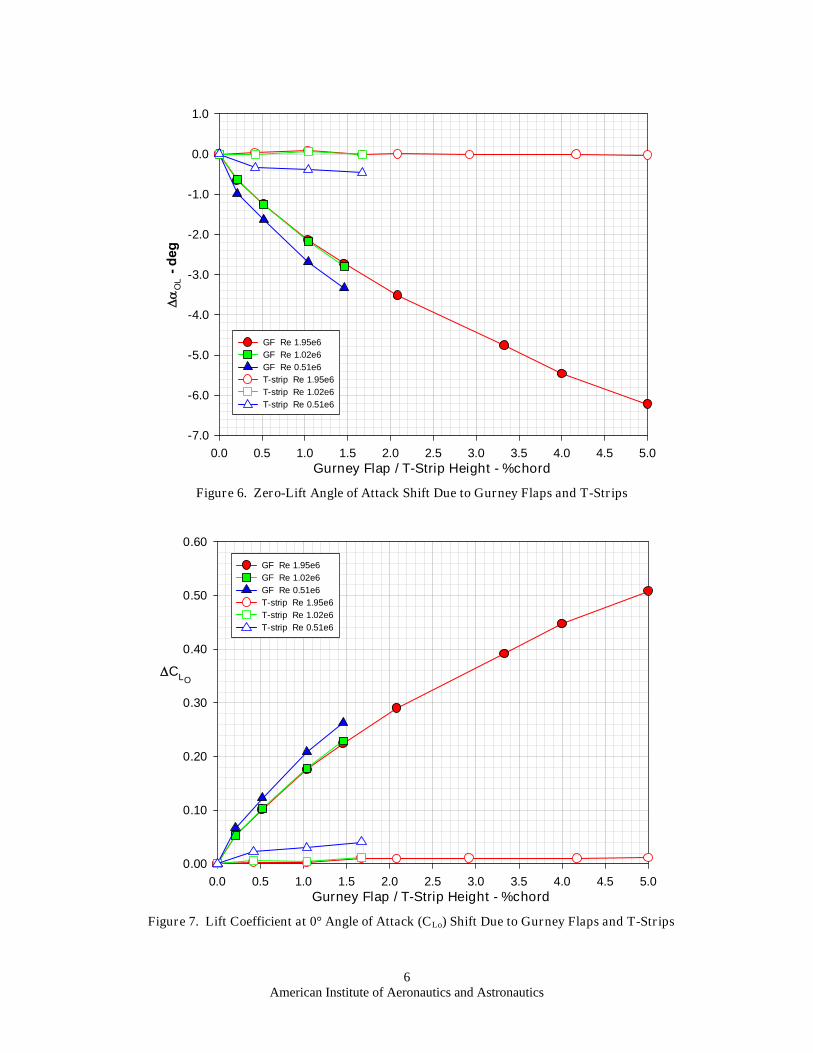
The increments in zero-lift angle of attack due to Gurney flaps and T-strips are plotted versus device height inFigure 6. Data is plotted for all three Reynolds numbers tested. The larger Gurney flaps and T-strips with chordsabove 2% were only tested at a Reynolds number of 1.95x10⁶. As the coefficient data indicated, Gurney flapsproduced a negative shift in the wing zero-lift angle of attack and T-strips produced essentially no shift. The lowReynolds number (0.51x10⁶) T-strip data does show a small (~0.4°) shift in αOL. The negative zero-lift angle ofattack shift due to Gurney flaps was not linear with device height. Smaller Gurney flaps produced adisproportionately larger shift in the wing zero-lift angle of attack.
The lift coefficient at 0° angle of attack (CLo) increment data in Figure 7 shows a similar trend. Gurney flapsproduced a positive shift in CLo, T-strips did not. Notice that the 1.95x10⁶ and 1.02x10⁶ Reynolds number Gurneyflap and T-strip data agree quite well for both the αOL and CLo shifts. This may indicate a Reynolds numberindependence above 1.02x10⁶ Re.
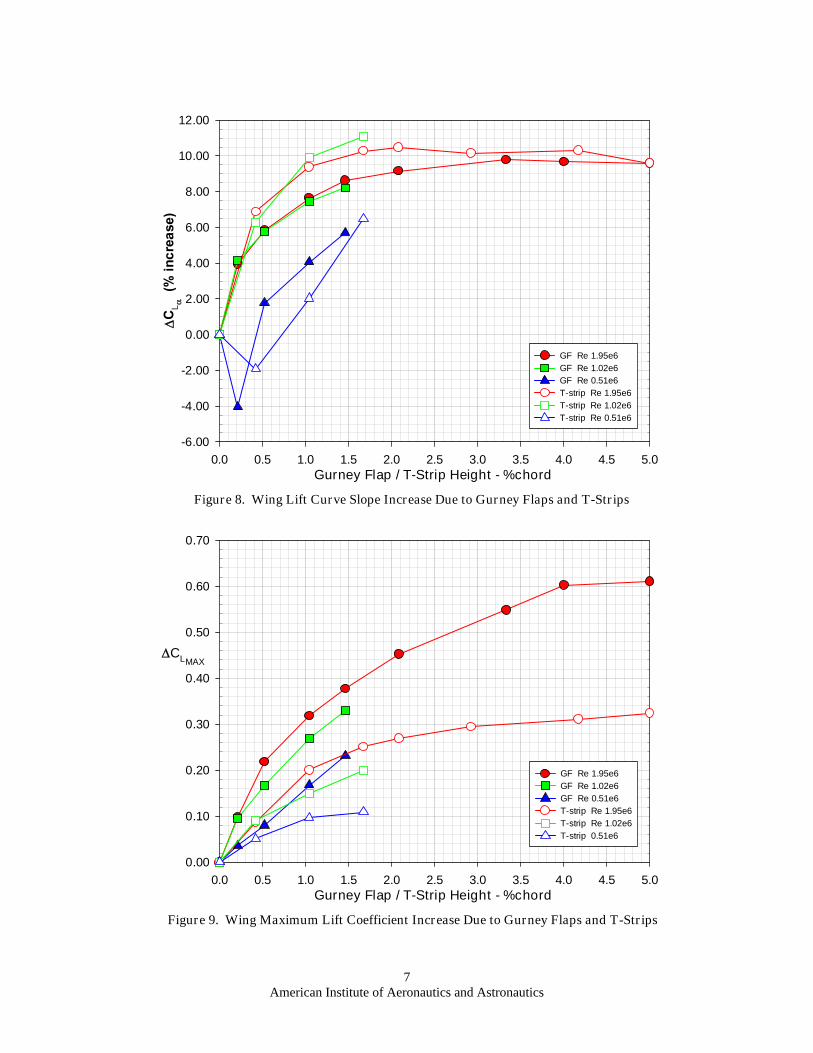
The percentage increase in wing lift curve slope due to Gurney flaps and T-strips is shown in Figure 8. Note thatlift curve slopes were taken from the coefficient data (CL vs. α) between 0° and 5° angle of attack. The data showsthat trailing edge T-strips produced a larger increase in wing lift curve slope. The increase for both was non-linearwith device height. Smaller Gurney flaps and T-strips produced a disproportionately larger increase in lift curveslope. Above 2% chord, the lift curve slope increase for both devices was nearly constant at about 10%. Bothtrailing edge devices produced smaller increases in wing lift curve slope at a Reynolds number of 0.51x10⁶. Below0.5% chord, the low Reynolds number data actually showed a drop in lift curve slope when a Gurney flap or T-stripwas added to the wing.
The increase in the model wing maximum lift coefficient due to Gurney flaps and T-strips is plotted in Figure 9.At each Reynolds number tested, Gurney flaps produced larger increments in wing maximum lift coefficient thantrailing edge T-strips. The CLmax increments for both devices increased with increasing Reynolds number andincreased device height. That increase was non-linear with device height. Notice that the CLmax increment for the4% chord Gurney flap was quite substantial at 0.60.
Figures 6, 7 & 8 showed little change in the increments in zero-lift angle of attack, lift coefficient at 0° angle ofattack and the percentage increase in wing lift curve slope when Reynolds number was increased from 1.02x10⁶ to1.95x106. This was the case for both Gurney flaps and trailing edge T-strips. This agreement may indicate aReynolds number independence for these lift curve characteristics above 1.02x10⁶.
Figure 9. Wing Maximum Lift Coefficient Increase Due to Gurney Flaps and T-Strips
American Institute of Aeronautics and Astronautics8
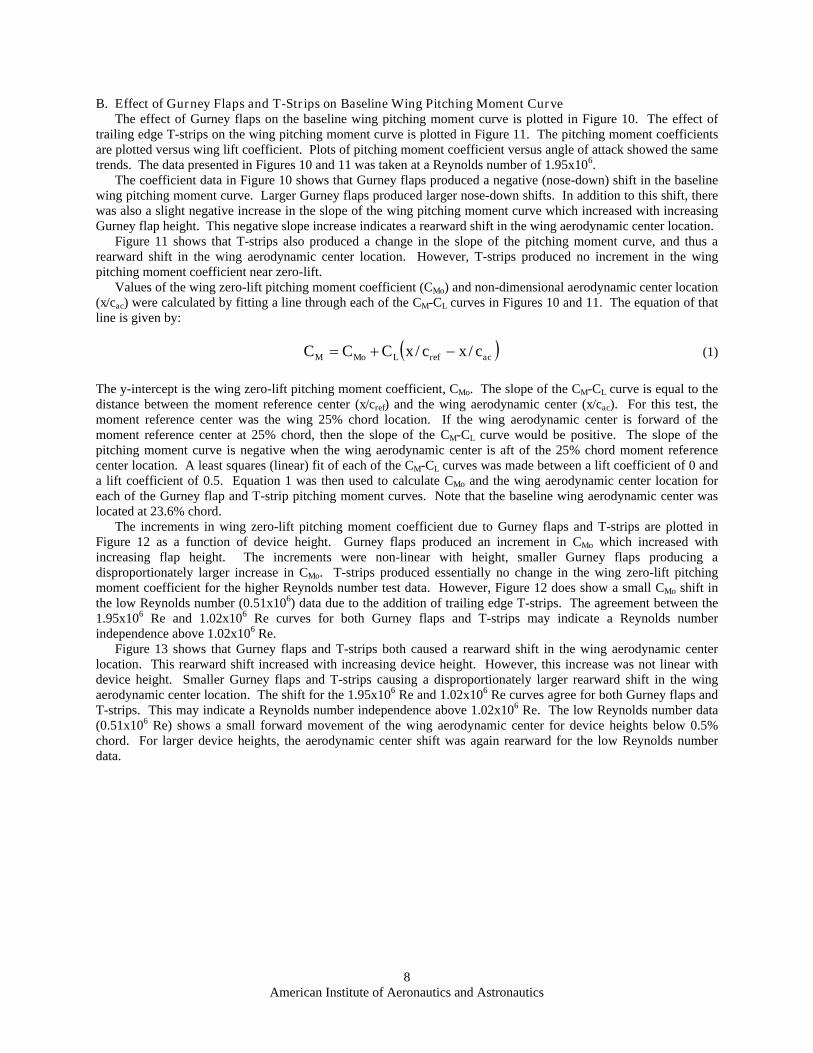
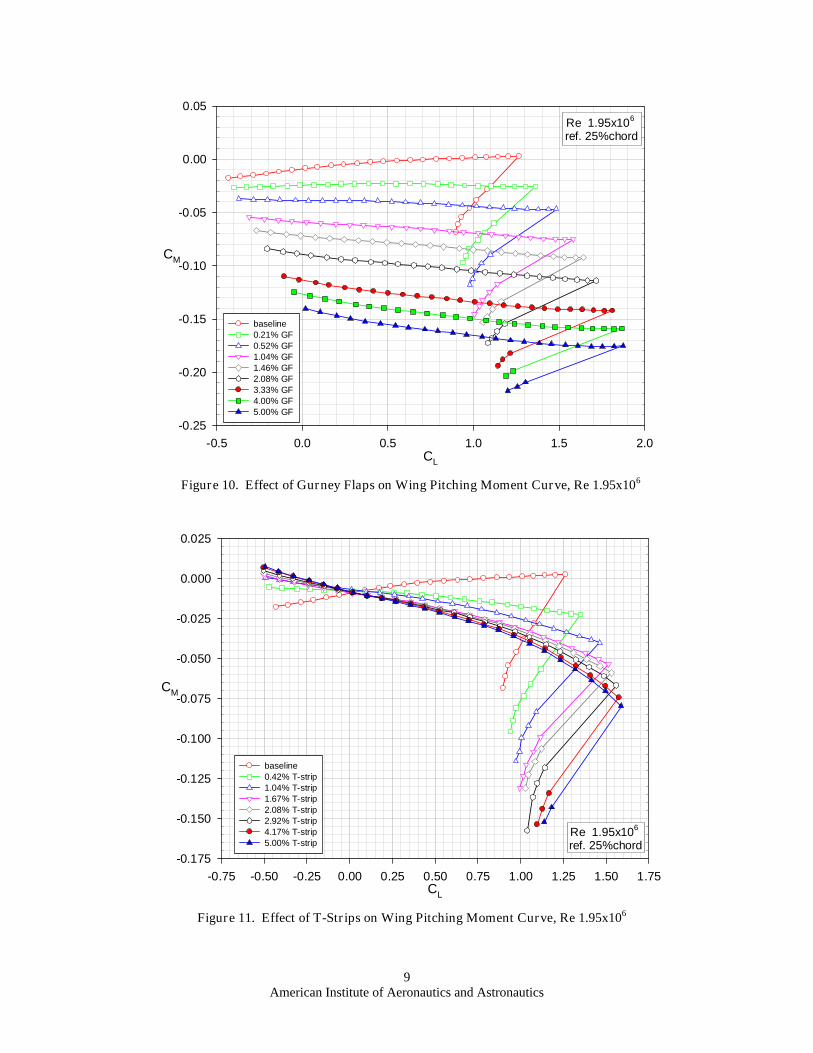
B. Effect of Gurney Flaps and T-Strips on Baseline Wing Pitching Moment CurveThe effect of Gurney flaps on the baseline wing pitching moment curve is plotted in Figure 10. The effect of
trailing edge T-strips on the wing pitching moment curve is plotted in Figure 11. The pitching moment coefficientsare plotted versus wing lift coefficient. Plots of pitching moment coefficient versus angle of attack showed the sametrends. The data presented in Figures 10 and 11 was taken at a Reynolds number of 1.95x10⁶.
The coefficient data in Figure 10 shows that Gurney flaps produced a negative (nose-down) shift in the baselinewing pitching moment curve. Larger Gurney flaps produced larger nose-down shifts. In addition to this shift, therewas also a slight negative increase in the slope of the wing pitching moment curve which increased with increasingGurney flap height. This negative slope increase indicates a rearward shift in the wing aerodynamic center location.
Figure 11 shows that T-strips also produced a change in the slope of the pitching moment curve, and thus arearward shift in the wing aerodynamic center location. However, T-strips produced no increment in the wingpitching moment coefficient near zero-lift.
Values of the wing zero-lift pitching moment coefficient (CMo) and non-dimensional aerodynamic center location(x/cac) were calculated by fitting a line through each of the CM-CL curves in Figures 10 and 11. The equation of thatline is given by:
acrefLMoM cxcxCCC // (1)
The y-intercept is the wing zero-lift pitching moment coefficient, CMo. The slope of the CM-CL curve is equal to thedistance between the moment reference center (x/cref) and the wing aerodynamic center (x/cac). For this test, themoment reference center was the wing 25% chord location. If the wing aerodynamic center is forward of themoment reference center at 25% chord, then the slope of the CM-CL curve would be positive. The slope of thepitching moment curve is negative when the wing aerodynamic center is aft of the 25% chord moment referencecenter location. A least squares (linear) fit of each of the CM-CL curves was made between a lift coefficient of 0 anda lift coefficient of 0.5. Equation 1 was then used to calculate CMo and the wing aerodynamic center location foreach of the Gurney flap and T-strip pitching moment curves. Note that the baseline wing aerodynamic center waslocated at 23.6% chord.
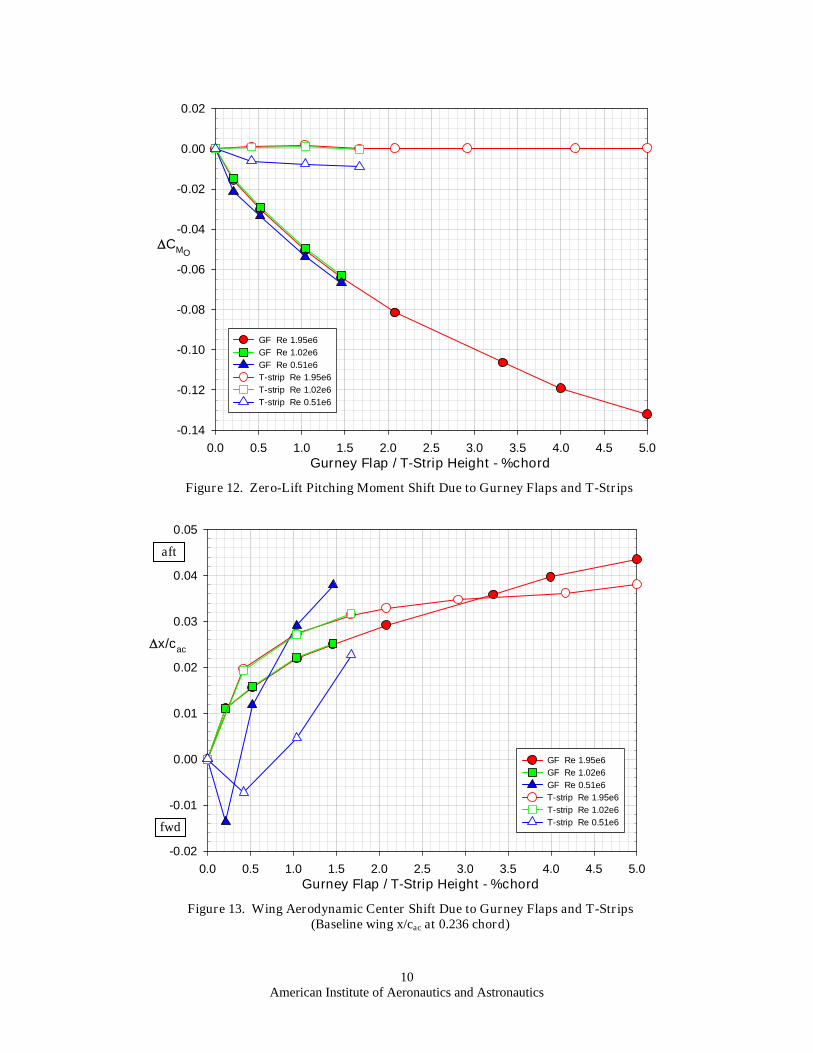
The increments in wing zero-lift pitching moment coefficient due to Gurney flaps and T-strips are plotted inFigure 12 as a function of device height. Gurney flaps produced an increment in CMo which increased withincreasing flap height. The increments were non-linear with height, smaller Gurney flaps producing adisproportionately larger increase in CMo. T-strips produced essentially no change in the wing zero-lift pitchingmoment coefficient for the higher Reynolds number test data. However, Figure 12 does show a small CMo shift inthe low Reynolds number (0.51x10⁶) data due to the addition of trailing edge T-strips. The agreement between the1.95x106 Re and 1.02x10⁶ Re curves for both Gurney flaps and T-strips may indicate a Reynolds numberindependence above 1.02x10⁶ Re.
Figure 13 shows that Gurney flaps and T-strips both caused a rearward shift in the wing aerodynamic centerlocation. This rearward shift increased with increasing device height. However, this increase was not linear withdevice height. Smaller Gurney flaps and T-strips causing a disproportionately larger rearward shift in the wingaerodynamic center location. The shift for the 1.95x10⁶ Re and 1.02x10⁶ Re curves agree for both Gurney flaps andT-strips. This may indicate a Reynolds number independence above 1.02x10⁶ Re. The low Reynolds number data(0.51x10⁶ Re) shows a small forward movement of the wing aerodynamic center for device heights below 0.5%chord. For larger device heights, the aerodynamic center shift was again rearward for the low Reynolds numberdata.
American Institute of Aeronautics and Astronautics9
Figure 13. Wing Aerodynamic Center Shift Due to Gurney Flaps and T-Strips(Baseline wing x/cac at 0.236 chord)
aft
fwd
American Institute of Aeronautics and Astronautics11
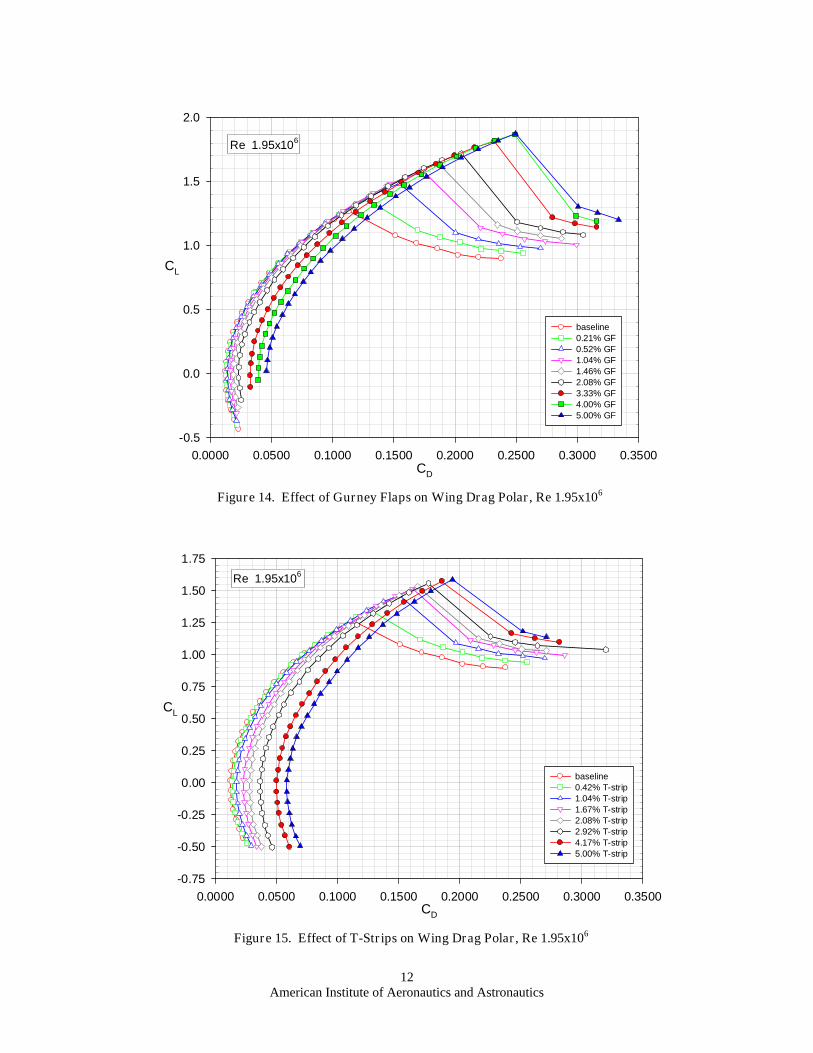
C. Effect of Gurney Flaps and T-Strips on Baseline Wing Drag PolarDrag polars (CD vs. CL) are plotted for the baseline wing equipped with Gurney flaps in Figure 14 and the
baseline wing equipped with trailing edge T-strips in Figure 15. The data contained in both plots was taken at aReynolds number of 1.95x10⁶. As expected, the addition of Gurney flaps and T-strips to the baseline wing produceda drag increment which shifted the polar to the right. The lift curve data showed that Gurney flaps and T-strips alsoincreased the wing maximum lift coefficient. This increase extends the drag polar to higher lift coefficients, beforethe non-linear break (to higher CD) occurs at stall.
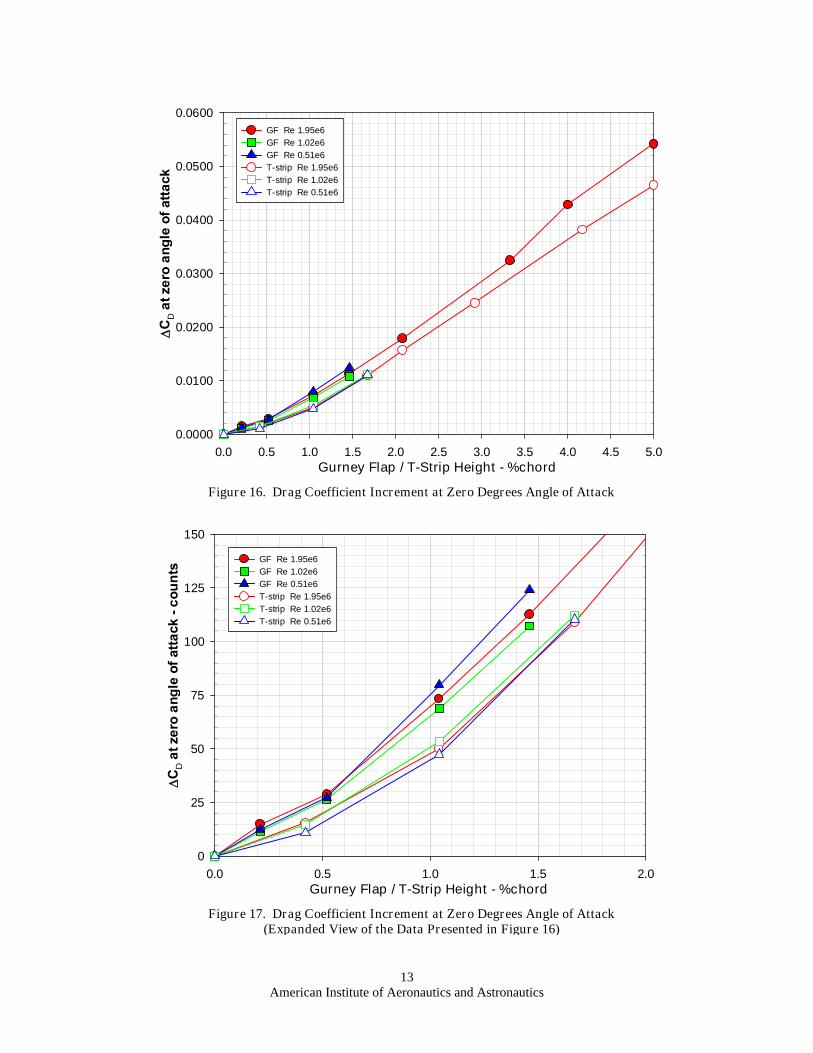
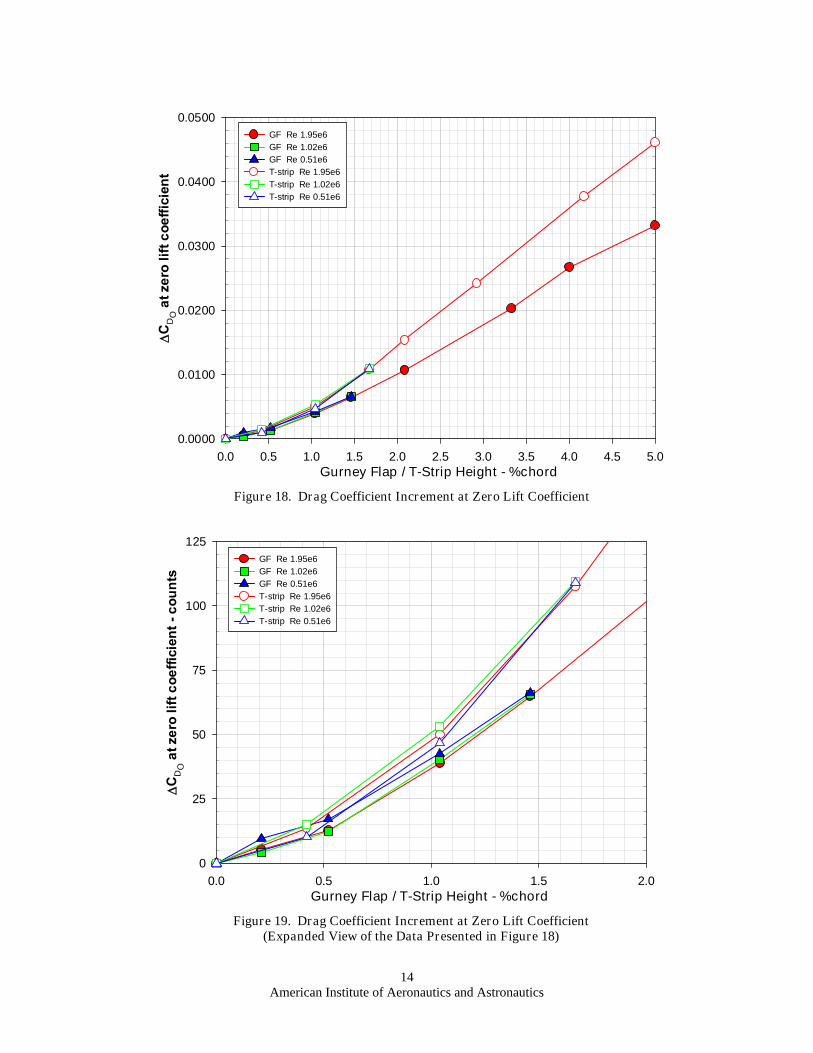
Drag coefficient increments at zero degrees angle of attack are plotted as a function of Gurney flap and T-stripheight in Figure 16. Figure 17 shows an expanded view of the same data for device heights below 2% chord. Thedata in Figure 17 is presented in drag counts. One drag count is equal to a drag coefficient of 0.0001. Dragcoefficient increments at zero wing lift coefficient (CDo) appear in Figure 18 as a function of Gurney flap and T-stripheight. Figure 19 shows an expanded view of the same data for device heights below 2% chord.
Comparison of Figures 17 and 19 shows that Gurney flaps have higher drag increments compared to T-stripswhen the increments are taken at a fixed 0° angle of attack. When the increments are taken at zero lift coefficient,Gurney flaps have the lower drag increment. This apparent drag decrease is due to the fact that Gurney flaps alsoproduce an increment in wing CL, and thus shift the drag polar (CD vs. CL) upward. At a lift coefficient of zero, thewing with the Gurney flap is operating at a lower (negative) angle of attack and thus has a lower drag increment thanthe same wing/Gurney flap combination at 0° angle of attack.
Figures 18 and 19 show that the zero-lift drag coefficient increment (ΔCDo) due to Gurney flaps and trailing edgeT-strips is not linear with device height. The larger flaps produced a disproportionately larger increase in drag. The5% chord T-strip added 461 drag counts to the baseline wing, a 472% increase in drag. Flaps below 0.5% chord hadmuch lower drag coefficient increments, on the order of 15 counts and less. The data also shows that the dragcoefficient increment due to Gurney flaps and T-strips does not appear to be a strong function of Reynolds number.Scatter at a given device height is on the order of 5 drag counts (ΔCDo), with no clear Reynolds number trendemerging from the data.
American Institute of Aeronautics and Astronautics12
Figure 19. Drag Coefficient Increment at Zero Lift Coefficient(Expanded View of the Data Presented in Figure 18)
American Institute of Aeronautics and Astronautics15
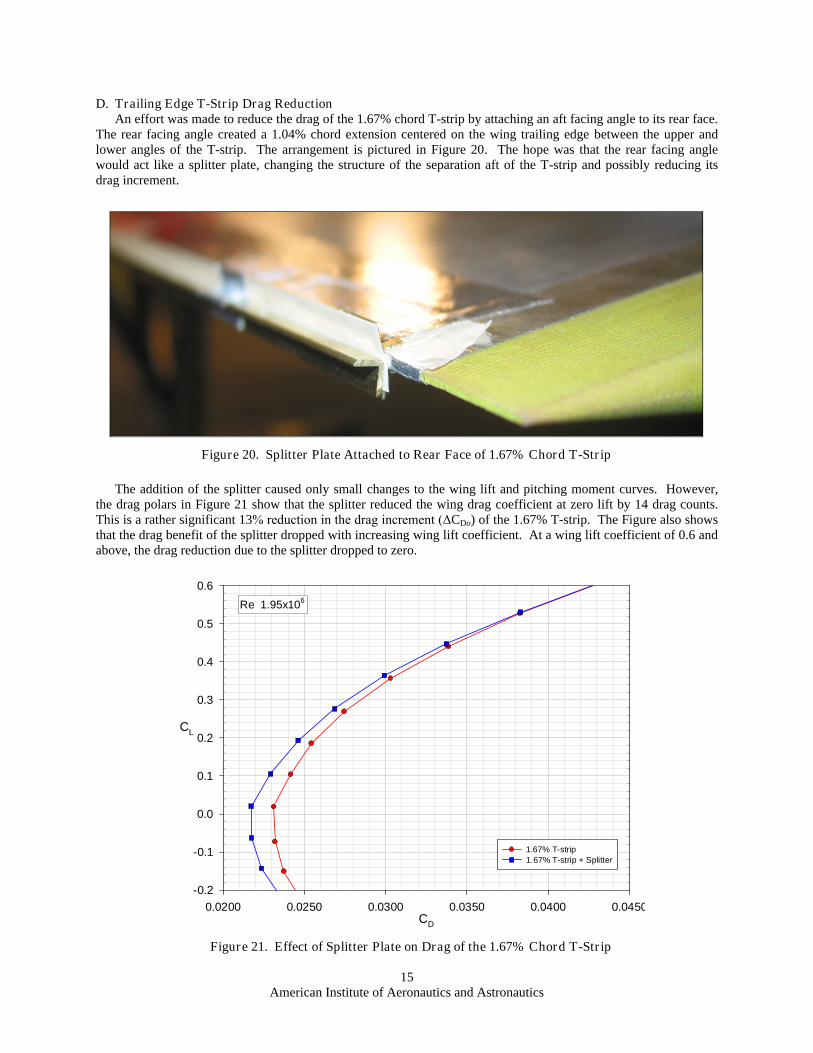
D. Trailing Edge T-Strip Drag ReductionAn effort was made to reduce the drag of the 1.67% chord T-strip by attaching an aft facing angle to its rear face.
The rear facing angle created a 1.04% chord extension centered on the wing trailing edge between the upper andlower angles of the T-strip. The arrangement is pictured in Figure 20. The hope was that the rear facing anglewould act like a splitter plate, changing the structure of the separation aft of the T-strip and possibly reducing itsdrag increment.
The addition of the splitter caused only small changes to the wing lift and pitching moment curves. However,the drag polars in Figure 21 show that the splitter reduced the wing drag coefficient at zero lift by 14 drag counts.This is a rather significant 13% reduction in the drag increment (ΔCDo) of the 1.67% T-strip. The Figure also showsthat the drag benefit of the splitter dropped with increasing wing lift coefficient. At a wing lift coefficient of 0.6 andabove, the drag reduction due to the splitter dropped to zero.
Figure 20. Splitter Plate Attached to Rear Face of 1.67% Chord T-Strip
CD
0.0200 0.0250 0.0300 0.0350 0.0400 0.0450
CL
-0.2
-0.1
0.0
0.1
0.2
0.3
0.4
0.5
0.6
1.67% T-strip1.67% T-strip + Splitter
Re 1.95x10⁶
Figure 21. Effect of Splitter Plate on Drag of the 1.67% Chord T-Strip
American Institute of Aeronautics and Astronautics16
IV. Discussion of Results
Significant research has gone into understanding the mechanism by which Gurney flaps change the liftingcharacteristics of two-dimensional airfoils and three-dimensional wings9,15,16,17. However, little research has goneinto understanding the effect of trailing edge T-strips. This despite the fact that these devices have beenimplemented on a number of aircraft vertical tails, sometimes with dramatic results6,11. The force and moment datafrom this test can be used in conjunction with previous Gurney flap flow field measurements to propose a “flowphysics” based model as to how trailing edge T-strips work.
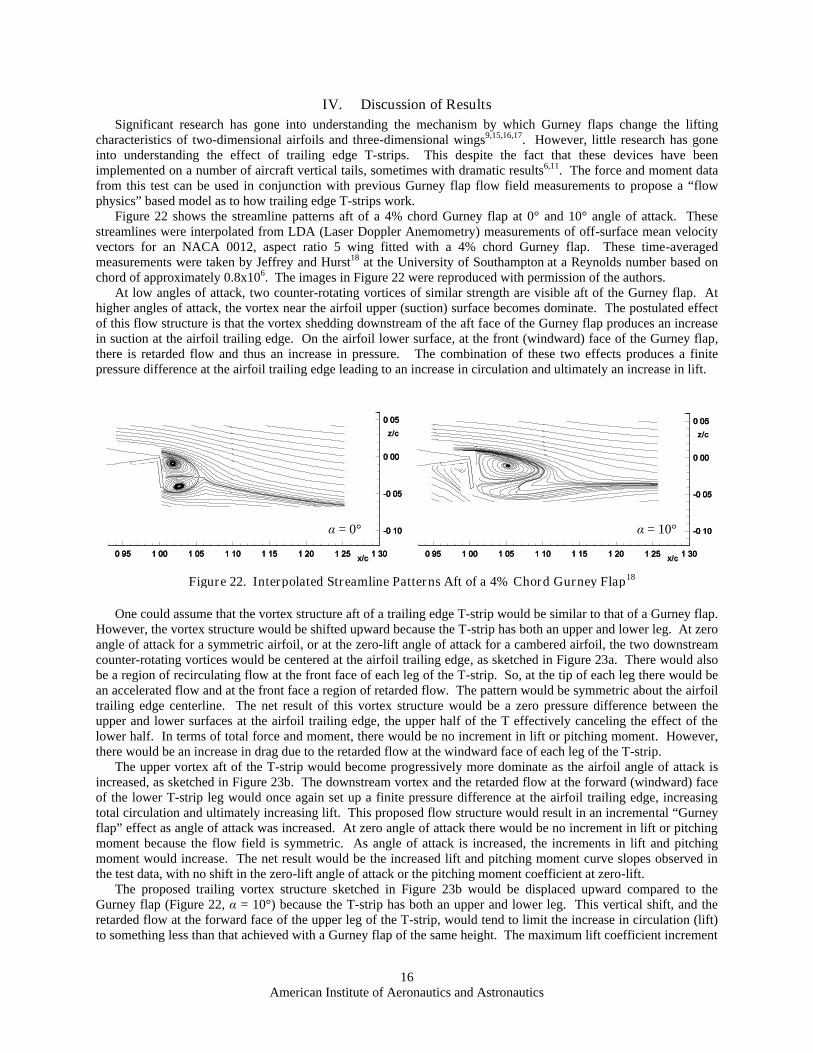
Figure 22 shows the streamline patterns aft of a 4% chord Gurney flap at 0° and 10° angle of attack. Thesestreamlines were interpolated from LDA (Laser Doppler Anemometry) measurements of off-surface mean velocityvectors for an NACA 0012, aspect ratio 5 wing fitted with a 4% chord Gurney flap. These time-averagedmeasurements were taken by Jeffrey and Hurst18 at the University of Southampton at a Reynolds number based onchord of approximately 0.8x10⁶. The images in Figure 22 were reproduced with permission of the authors.
At low angles of attack, two counter-rotating vortices of similar strength are visible aft of the Gurney flap. Athigher angles of attack, the vortex near the airfoil upper (suction) surface becomes dominate. The postulated effectof this flow structure is that the vortex shedding downstream of the aft face of the Gurney flap produces an increasein suction at the airfoil trailing edge. On the airfoil lower surface, at the front (windward) face of the Gurney flap,there is retarded flow and thus an increase in pressure. The combination of these two effects produces a finitepressure difference at the airfoil trailing edge leading to an increase in circulation and ultimately an increase in lift.
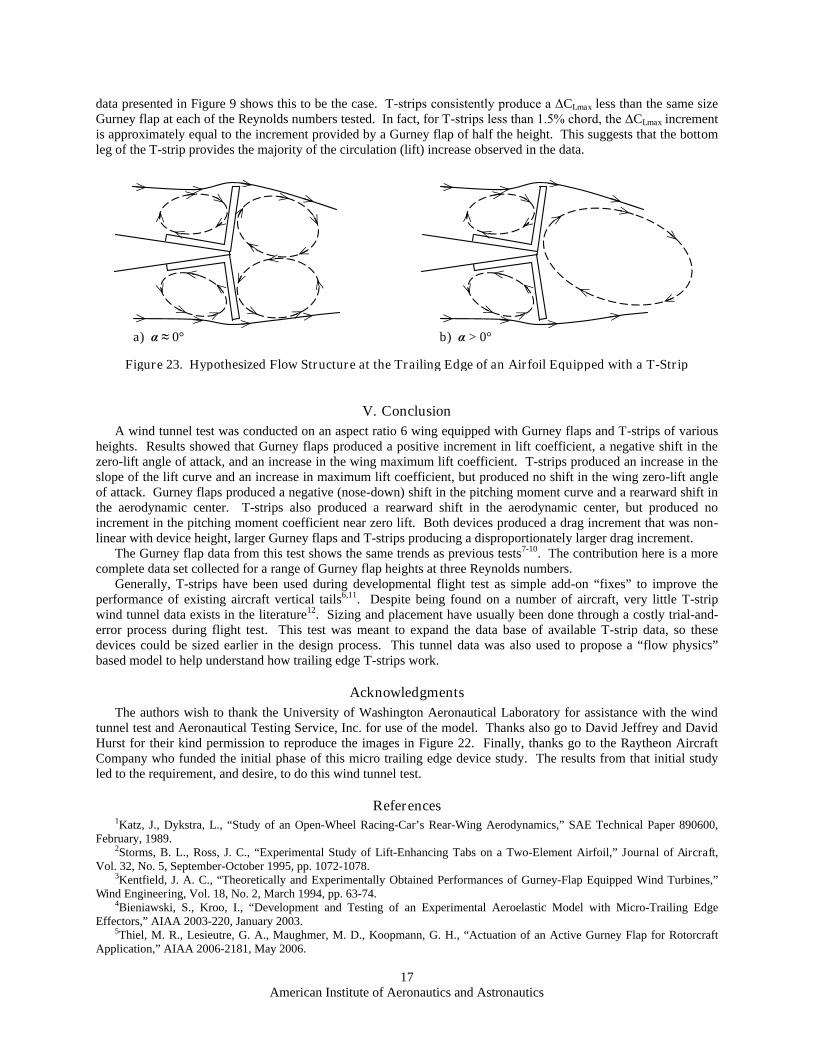
One could assume that the vortex structure aft of a trailing edge T-strip would be similar to that of a Gurney flap.However, the vortex structure would be shifted upward because the T-strip has both an upper and lower leg. At zeroangle of attack for a symmetric airfoil, or at the zero-lift angle of attack for a cambered airfoil, the two downstreamcounter-rotating vortices would be centered at the airfoil trailing edge, as sketched in Figure 23a. There would alsobe a region of recirculating flow at the front face of each leg of the T-strip. So, at the tip of each leg there would bean accelerated flow and at the front face a region of retarded flow. The pattern would be symmetric about the airfoiltrailing edge centerline. The net result of this vortex structure would be a zero pressure difference between theupper and lower surfaces at the airfoil trailing edge, the upper half of the T effectively canceling the effect of thelower half. In terms of total force and moment, there would be no increment in lift or pitching moment. However,there would be an increase in drag due to the retarded flow at the windward face of each leg of the T-strip.
The upper vortex aft of the T-strip would become progressively more dominate as the airfoil angle of attack isincreased, as sketched in Figure 23b. The downstream vortex and the retarded flow at the forward (windward) faceof the lower T-strip leg would once again set up a finite pressure difference at the airfoil trailing edge, increasingtotal circulation and ultimately increasing lift. This proposed flow structure would result in an incremental “Gurneyflap” effect as angle of attack was increased. At zero angle of attack there would be no increment in lift or pitchingmoment because the flow field is symmetric. As angle of attack is increased, the increments in lift and pitchingmoment would increase. The net result would be the increased lift and pitching moment curve slopes observed inthe test data, with no shift in the zero-lift angle of attack or the pitching moment coefficient at zero-lift.
The proposed trailing vortex structure sketched in Figure 23b would be displaced upward compared to theGurney flap (Figure 22, α = 10°) because the T-strip has both an upper and lower leg. This vertical shift, and theretarded flow at the forward face of the upper leg of the T-strip, would tend to limit the increase in circulation (lift)to something less than that achieved with a Gurney flap of the same height. The maximum lift coefficient increment
Figure 22. Interpolated Streamline Patterns Aft of a 4% Chord Gurney Flap18
α = 0° α = 10°
American Institute of Aeronautics and Astronautics17
data presented in Figure 9 shows this to be the case. T-strips consistently produce a ΔCLmax less than the same sizeGurney flap at each of the Reynolds numbers tested. In fact, for T-strips less than 1.5% chord, the ΔCLmax incrementis approximately equal to the increment provided by a Gurney flap of half the height. This suggests that the bottomleg of the T-strip provides the majority of the circulation (lift) increase observed in the data.
V. Conclusion
A wind tunnel test was conducted on an aspect ratio 6 wing equipped with Gurney flaps and T-strips of variousheights. Results showed that Gurney flaps produced a positive increment in lift coefficient, a negative shift in thezero-lift angle of attack, and an increase in the wing maximum lift coefficient. T-strips produced an increase in theslope of the lift curve and an increase in maximum lift coefficient, but produced no shift in the wing zero-lift angleof attack. Gurney flaps produced a negative (nose-down) shift in the pitching moment curve and a rearward shift inthe aerodynamic center. T-strips also produced a rearward shift in the aerodynamic center, but produced noincrement in the pitching moment coefficient near zero lift. Both devices produced a drag increment that was non-linear with device height, larger Gurney flaps and T-strips producing a disproportionately larger drag increment.
The Gurney flap data from this test shows the same trends as previous tests7-10. The contribution here is a morecomplete data set collected for a range of Gurney flap heights at three Reynolds numbers.
Generally, T-strips have been used during developmental flight test as simple add-on “fixes” to improve theperformance of existing aircraft vertical tails6,11. Despite being found on a number of aircraft, very little T-stripwind tunnel data exists in the literature12. Sizing and placement have usually been done through a costly trial-and-error process during flight test. This test was meant to expand the data base of available T-strip data, so thesedevices could be sized earlier in the design process. This tunnel data was also used to propose a “flow physics”based model to help understand how trailing edge T-strips work.
Acknowledgments
The authors wish to thank the University of Washington Aeronautical Laboratory for assistance with the windtunnel test and Aeronautical Testing Service, Inc. for use of the model. Thanks also go to David Jeffrey and DavidHurst for their kind permission to reproduce the images in Figure 22. Finally, thanks go to the Raytheon AircraftCompany who funded the initial phase of this micro trailing edge device study. The results from that initial studyled to the requirement, and desire, to do this wind tunnel test.
References1Katz, J., Dykstra, L., “Study of an Open-Wheel Racing-Car’s Rear-Wing Aerodynamics,” SAE Technical Paper 890600,
February, 1989.2Storms, B. L., Ross, J. C., “Experimental Study of Lift-Enhancing Tabs on a Two-Element Airfoil,” Journal of Aircraft,
Vol. 32, No. 5, September-October 1995, pp. 1072-1078.3Kentfield, J. A. C., “Theoretically and Experimentally Obtained Performances of Gurney-Flap Equipped Wind Turbines,”
Wind Engineering, Vol. 18, No. 2, March 1994, pp. 63-74.4Bieniawski, S., Kroo, I., “Development and Testing of an Experimental Aeroelastic Model with Micro-Trailing Edge
Effectors,” AIAA 2003-220, January 2003.5Thiel, M. R., Lesieutre, G. A., Maughmer, M. D., Koopmann, G. H., “Actuation of an Active Gurney Flap for Rotorcraft
Application,” AIAA 2006-2181, May 2006.
a) α ≈ 0° b) α > 0°
Figure 23. Hypothesized Flow Structure at the Trailing Edge of an Airfoil Equipped with a T-Strip
American Institute of Aeronautics and Astronautics18
6Cavanaugh, M. A., “The Use of Rudder Trailing Edge T-Strips to Improve Dutch Roll Damping,” AIAA 2003-5613, 2003.7Li, Y., Wang, J., Zhang, P., “Effects of Gurney Flaps on a NACA0012 Airfoil,” Flow, Turbulence and Combustion, Vol. 68,
No. 1, January 2002, pp. 27-39.8Storms, B. L., Jang, C. S., “Lift Enhancement of an Airfoil Using a Gurney Flap and Vortex Generators,” Journal of
Aircraft, Engineering Note, Vol. 31, No. 3, May-June 1994, pp. 542-547.9Jeffrey, D., Zhang, X., Hurst, D. W., “Aerodynamics of Gurney Flaps on a Single-Element High-Lift Wing,” Journal of
Aircraft, Vol. 37, No. 2, March-April 2000, pp. 295-301.10Myose, R., Papadakis, M., Heron, I., “The Effect of Gurney Flaps on Three-Dimensional Wings with and without Taper,”
SAE Technical Paper 965514, October 1996.11Fujino, M., Mahiko, K., Hosono, K., Yoshizaki, Y., “Initial Flight Testing of the HondaJet,” ICAS Paper 2004-4.10.1,
September 2004.12Roesch, P., Vuillet, A., “New Designs for Improved Aerodynamic Stability on Recent Aerospatiale Helicopters,” Vertica,
Vol. 6, No. 3, July 1982, pp. 145-164.13University of Washington, Kirsten Wind Tunnel Technical Guide, http://www.aa.washington.edu/uwal/14Shindo, S., “Simplified Tunnel Correction Method,” Journal of Aircraft, Engineering Notes, Vol. 32, No. 1, January 1995,
pp. 210-213.15Jang, C. S., Ross, J. C., Cummings, R. M., “Numerical Investigation of an Airfoil with a Gurney Flap,” Aircraft Design,
Vol. 1, No. 2, June 1998, pp. 75-88.16Neuhart, D. H., Pendergraft, O. C., “A Water Tunnel Study of Gurney Flaps,” NASA Technical Memorandum 4071, 1988.17Jeffrey, D. R. M., “An Investigation into the Aerodynamics of Gurney Flaps,” Ph.D. Dissertation, Department of
Aeronautics and Astronautics, University of Southampton, Southampton, U.K., July 1988.18Jeffrey, D. R. M., “Aerodynamics of the Gurney Flap,” AIAA 96-2418, June 1996.