Wind Turbine Generator System Pika T701 Duration Test Report Conducted by High Plains Small Wind Test Center Colby, KS November, 2015 Approval By: ______ November, 2015 _______ Ruth Douglas Miller, Lead Engineer, Date Review By: ___________________________________________________________ Ismael Mendoza , NWTC, Date
2. TEST SUMMARY.............................................................................................................................................. 5
3. TEST TURBINE CONFIGURATION..................................................................................................................... 6
4. TEST SITE DESCRIPTION.................................................................................................................................. 10
5. DESCRIPTION OF TEST EQUIPMENT ............................................................................................................... 12
6. TEST RESULTS ................................................................................................................................................ 15
TEST PERIOD............................................................................................................................................................................... 15
MONTHS OF OPERATION ……………………………………………………………………………………………………………………………………………………. 21
HOURS OF PRODUCTION ........................................................................................................................................................... 21
OPERATIONAL TIME FRACTION .................................................................................................................................................. 22
POWER DEGRADATION ............................................................................................................................................................. 22
OPERATIONAL TIME FRACTION................................................................................................................................................ 26
8. DEVIATIONS AND EXCEPTIONS................................................................................................................... 26
DEVIATIONS FROM THE STANDARD .................................................................................................................................... 26
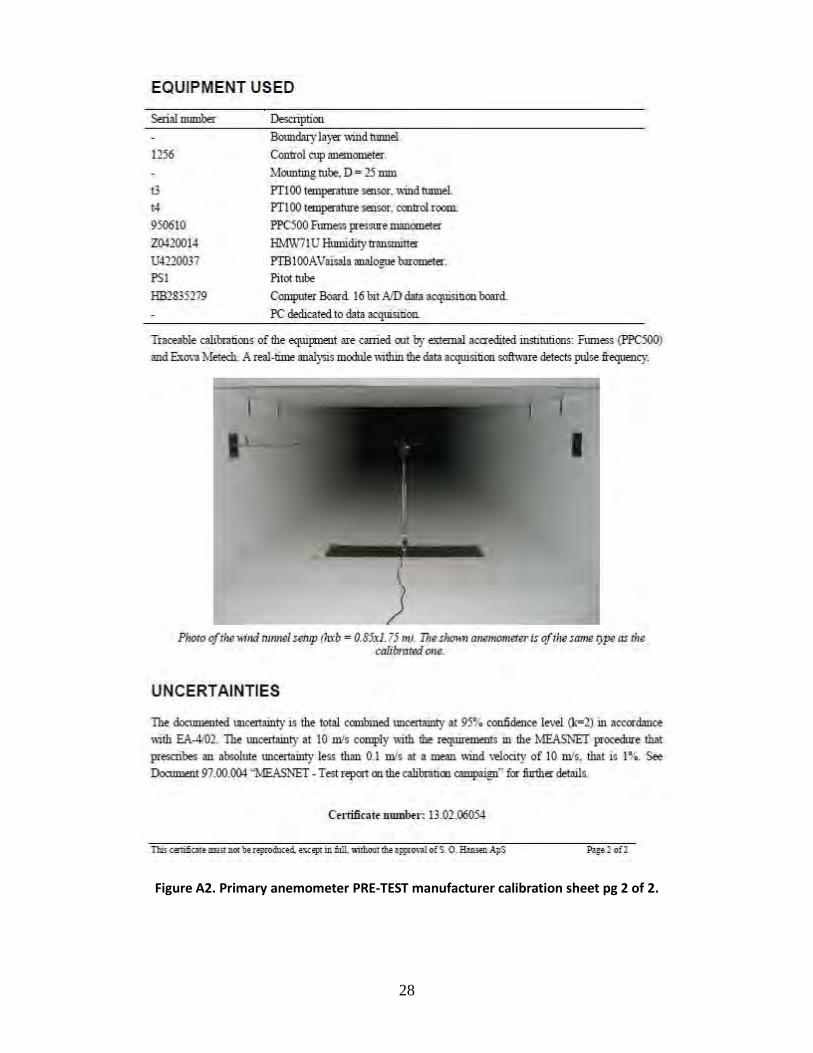
APPENDIX A: CALIBRATION DATA SHEETS FOR PIKA T701 TEST INSTRUMENTS ................................................. 27
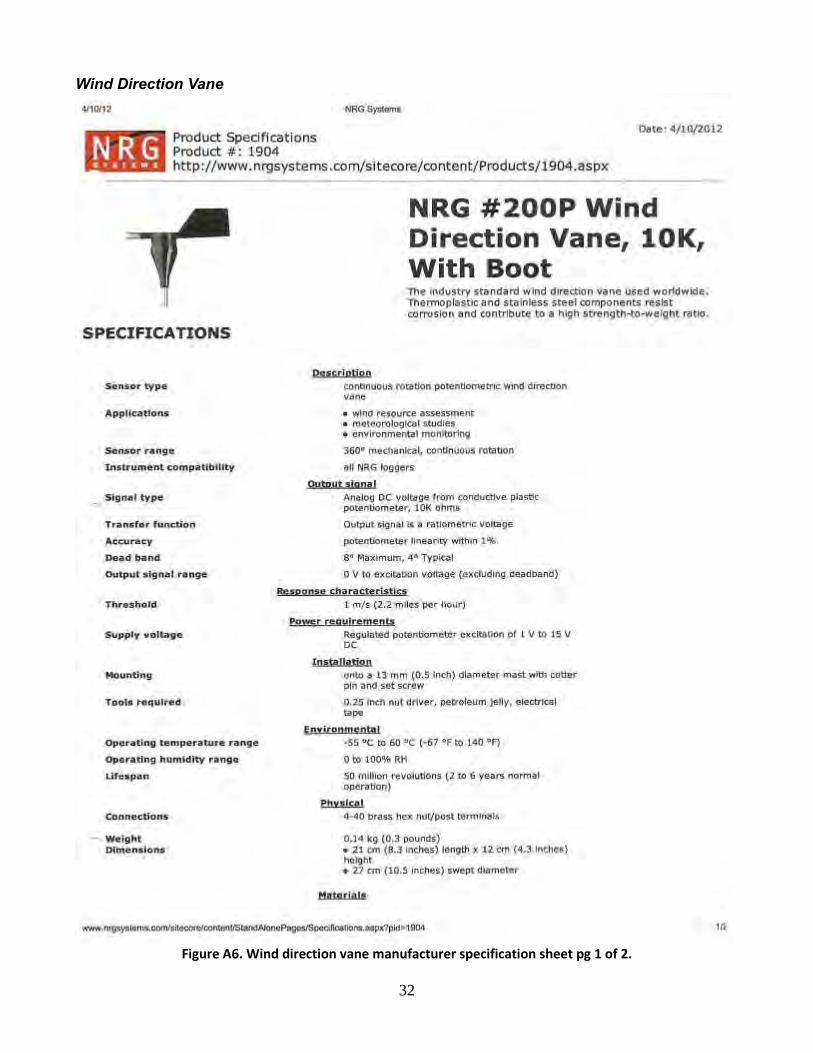
WIND DIRECTION VANE ........................................................................................................................................................... 32
TEMPERATURE PROBE............................................................................................................................................................... 34
POWER TRANSDUCER................................................................................................................................................................ 38
DAS MODULES ........................................................................................................................................................................... 43
APPENDIX B – PIKA T701 WIND TURBINE MAINTENANCE AND INSPECTION SCHEDULE ..……….……………….……….. 46
3
LIST OF FIGURES
Figure 1. Pika T701 turbine installed at High Plains Small Wind Test Center ............................................................. 7
Figure 2. Pika T701 rotor showing radius measurement ........................................................................................... 8
Figure 3. Wiring diagram for Pika T701 turbine and inverter installation, from Pika literature. …............................. 9
Figure 4. Aerial view of High Plains SWTC (Google Maps).......................................................................................... 10
Figure 5. Panoramic photo from Pika turbine base..................................................................................................... 10
Figure 6. High Plains SWTC Site Layout, to scale.. ...................................................................................................... 11
Figure 7. Wind rose for High Plains SWTC for the period May 2014-May 2015......................................................... 11
Figure 8. Aerial view of High Plains SWTC, from USDA/Google. ............................................................................... 12
Figure 9. Photographs and measurements of met tower and Pika T701 turbine on High Plains SWTC site. ……..….. 14
Figure 10. Photographs of tail and tail attachment to nacelle, at disassembly …………………………………………………….. 16
Figure 11. Photos of blades attached to hub, during disassembly ……………………………………………………………………….. 17
Figure 12. Photos of blade hub attached to nacelle, during disassembly …………………………………………………………….. 18
Figure 13. Photo of nacelle hub during disassembly ……………………………………………………………………………………………. 18
Figure 14. Photos of nacelle showing oil discharge ……………………………………………………………………………………………… 19
Figure 15. Photo of turbine shaft (behind blades) at disassembly ……………………………………………………………………….. 19
Figure 16. Photos of circuit board in nacelle, at disassembly ………………………………………………………………………………. 20
Figure 17. Close-up of yaw brushes and nacelle circuitry at disassembly ……………………………………………………………. 20
Figure A12. Power transducer manufacturer PRE-test calibration sheet pg 1 of 3.................................................... 38
Figure A13. Power transducer manufacturer PRE-test calibration sheet pg 2 of 3 ................................................... 39
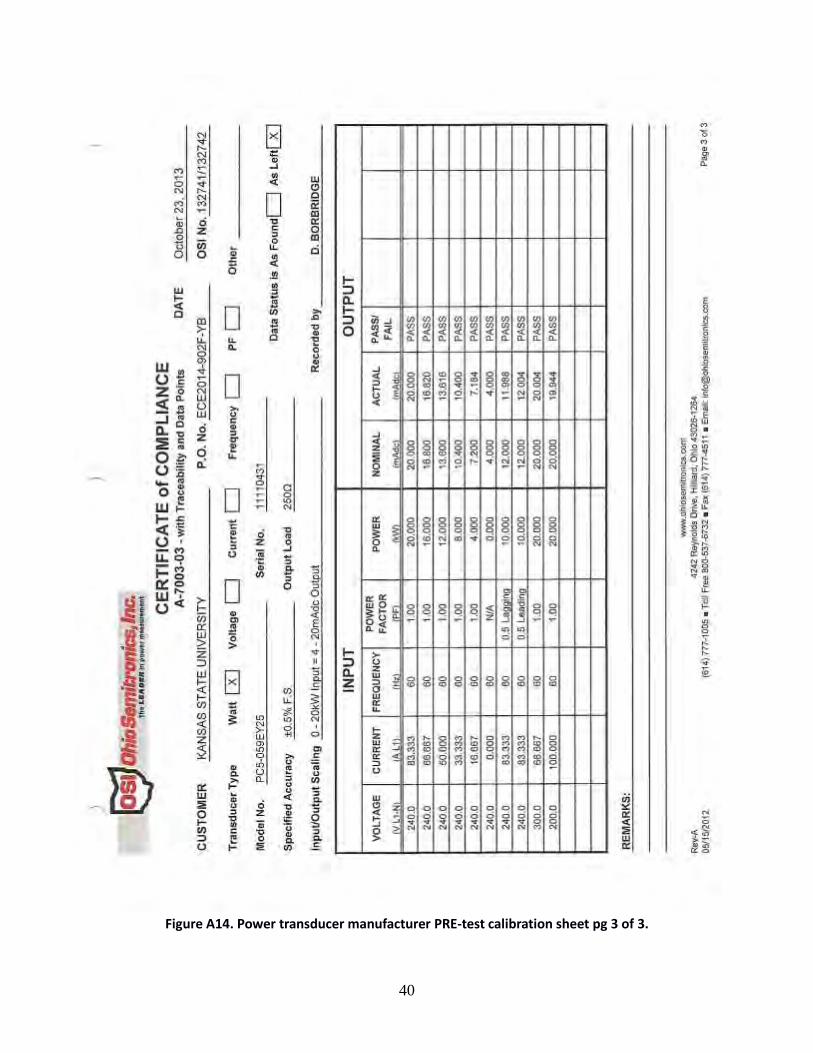
Figure A14. Power transducer manufacturer PRE-test calibration sheet pg 3 of 3.................................................... 40
Figure A15. Power transducer manufacturer POST-test calibration sheet showing out of cal., pg 1 of 2................. 41
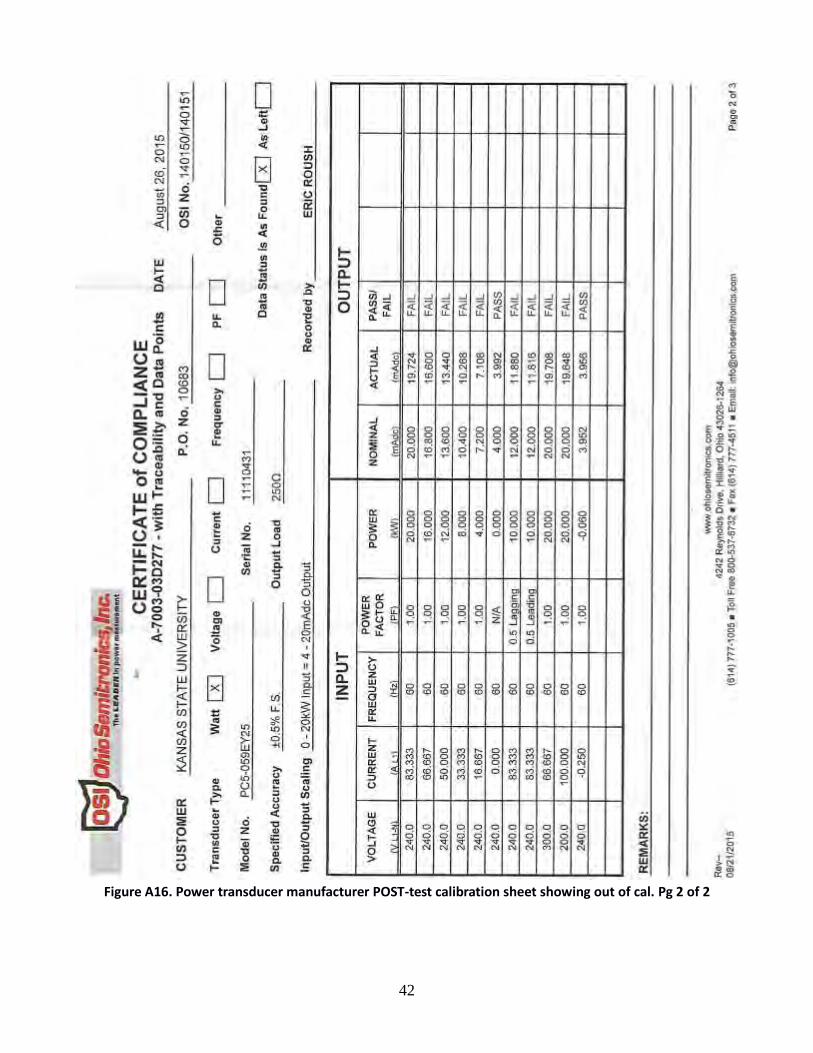
Figure A16. Power transducer manufacturer POST-test calibration sheet showing out of cal., pg 2 of 2................. 42
Figure A17. Voltage module (for temperature and pressure) manufacturer calibration certificate pg 1 of 1 .......... 43
Figure A18. Current module (for temperature and pressure) manufacturer calibration certificate pg 1 of 1 .......... 44
Figure A19. NI 9421 digital input module (for both anemometers) manufacturer data sheet pg 1 of 9. ................ 45
4
LIST OF TABLES
Table 1. Pika T701 Duration Test matrix .................................................................................................................... 5
Table 2. Pika T701 Duration test results .................................................................................................................... 5
Table 3. Summary of Pika T701 Published Specifications .......................................................................................... 6
Table 4. System Wiring Summary .............................................................................................................................. 9
Table 5. Structures on and near test site .................................................................................................................. 11
Table 6. Summary of Instrumentation for Pika T701 Tests ........................................................................................ 13
Table 7. Minimum hours of power production .......................................................................................................... 21
Table 8. Avg power production by month, December through February, with and without low power periods …... 23
5
1. Background The Pika Wind T701 1.4-kW wind turbine was tested in accordance with the American Wind Energy Association (AWEA) Small Wind Turbine Performance and Safety Standard (AWEA Standard 9.1 – 2009) and the International Electrotechnical Commission (IEC) 61400‐2 “Design requirements for small wind turbines,” specifically section 9.4 “Duration testing.” This test report refers to these procedures collectively as the Standard.
Testing of the Pika T701 was conducted under a contract as part of the US Department of Energy and National Renewable Energy Laboratory (DOE/NREL) Regional Test Center (RTC) program.
2. Test Summary The Pika T701 is a three bladed, Horizontal Axis Wind Turbine. It has a 3m diameter rotor resulting in a rotor swept area of 7.1 m2. The data presented in this report was collected during a power performance test conducted at High Plains Small Wind Test Center (“High Plains SWTC”) in Colby, KS from 17 July, 2014 through 13 May, 2015.
The purpose of the duration test was to assess the long-term performance of the Pika T701 wind turbine. This was done through monitoring reliable operation of the turbine over a period of at least 6 months. Reliable operation comprises of such factors as structural integrity, material degradation, protection of the wind turbine, and dynamic behavior of the wind turbine as designed by the manufacturer.
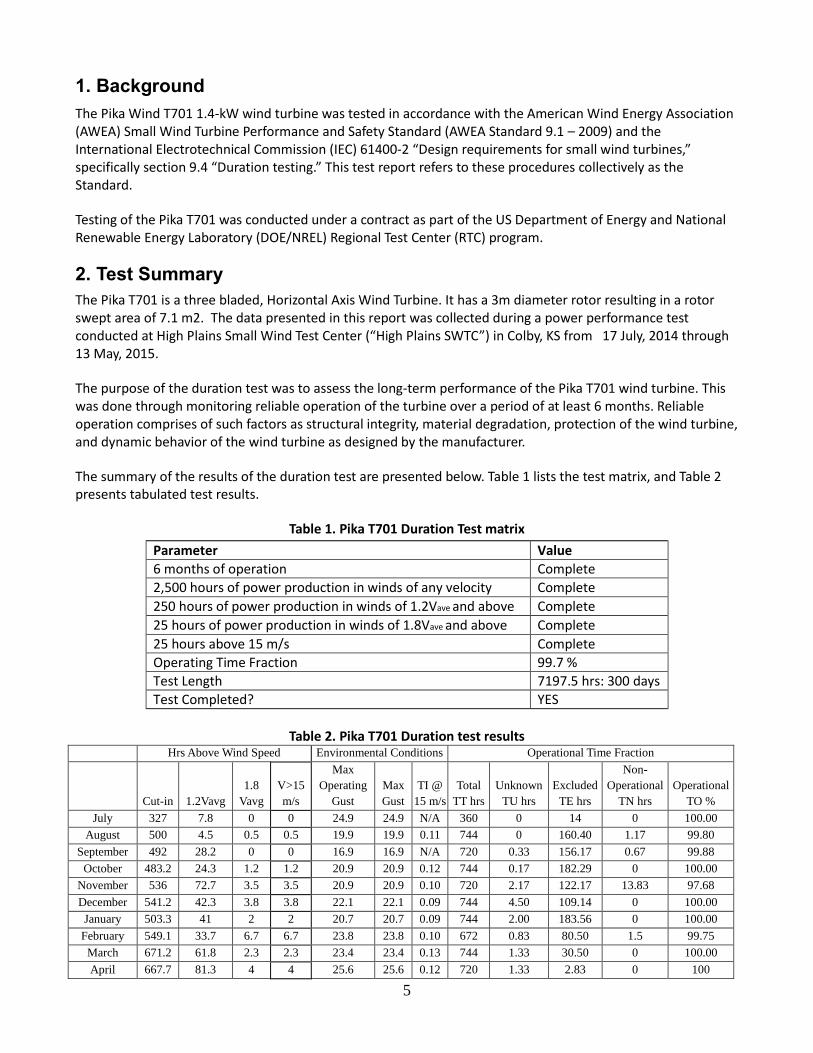
The summary of the results of the duration test are presented below. Table 1 lists the test matrix, and Table 2 presents tabulated test results.
Table 1. Pika T701 Duration Test matrix
Parameter Value
6 months of operation Complete
2,500 hours of power production in winds of any velocity Complete
250 hours of power production in winds of 1.2Vave and above Complete
25 hours of power production in winds of 1.8Vave and above Complete
25 hours above 15 m/s Complete
Operating Time Fraction 99.7 %
Test Length 7197.5 hrs: 300 days
Test Completed? YES
Table 2. Pika T701 Duration test results
Hrs Above Wind Speed Environmental Conditions Operational Time Fraction
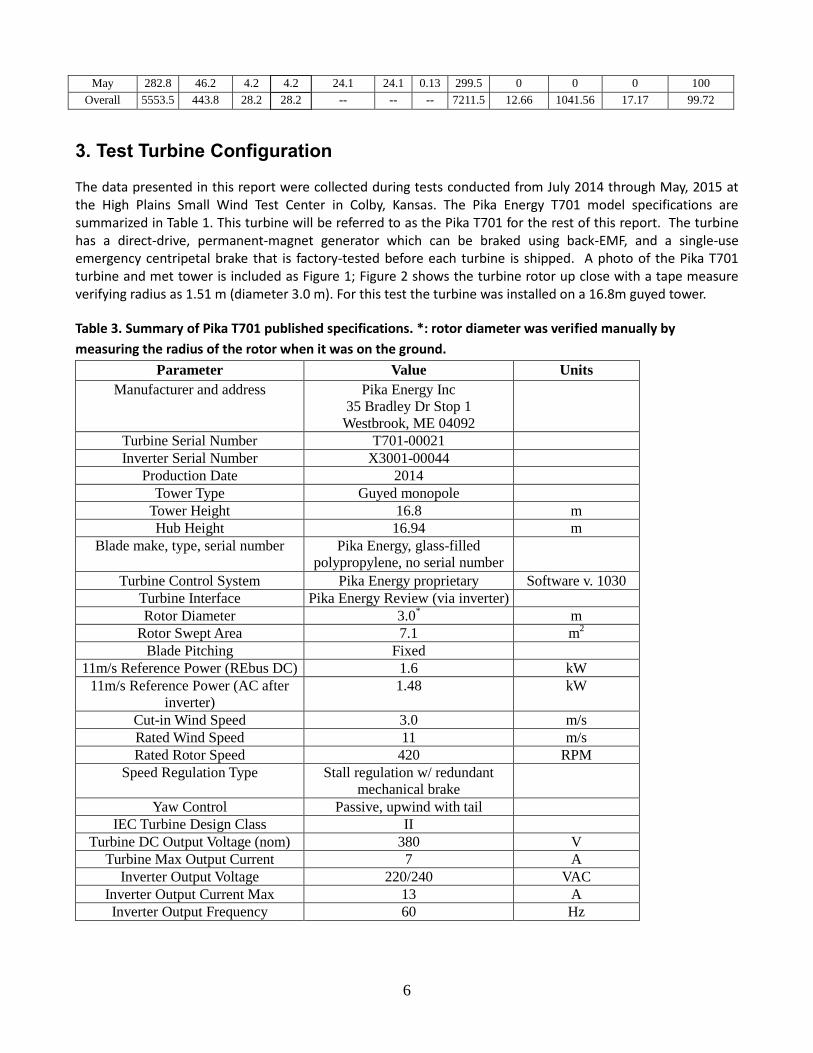
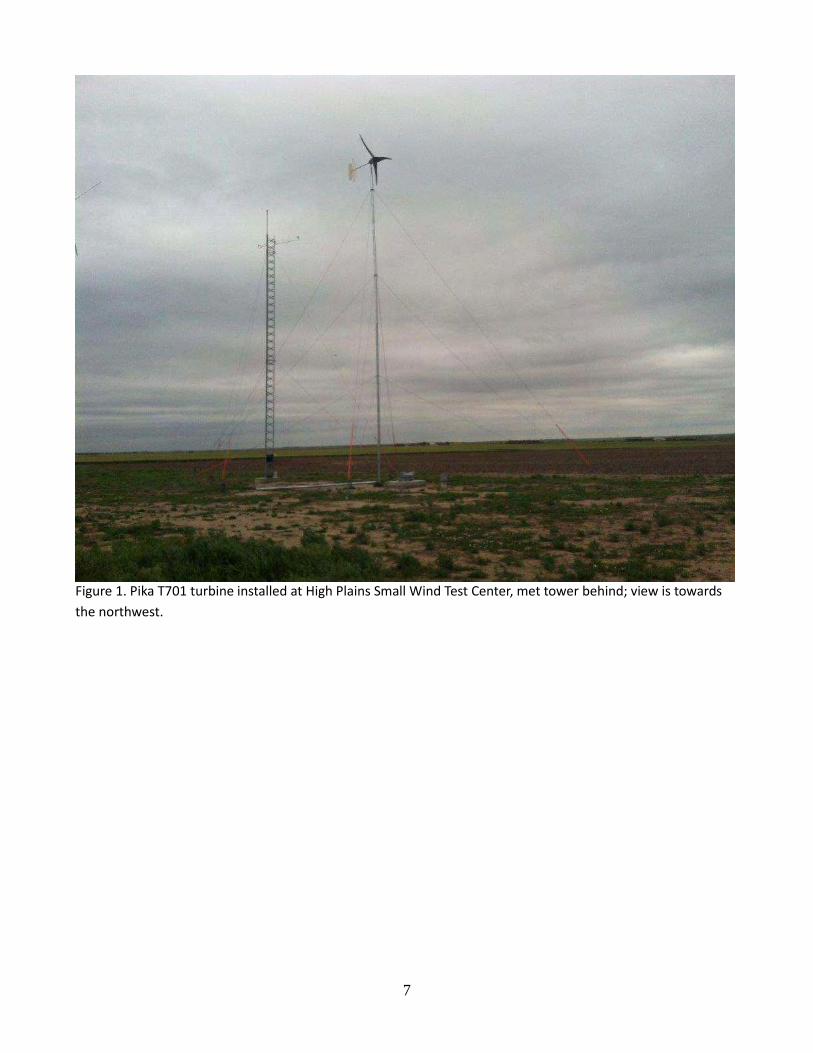
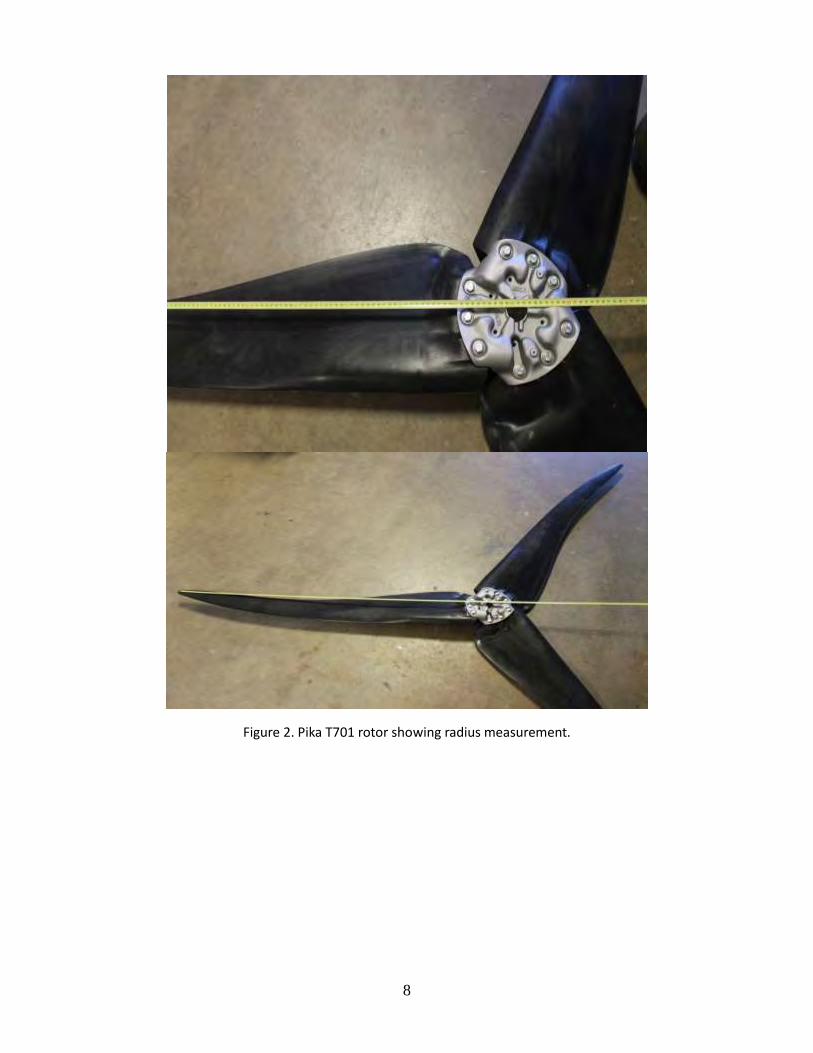
The data presented in this report were collected during tests conducted from July 2014 through May, 2015 at the High Plains Small Wind Test Center in Colby, Kansas. The Pika Energy T701 model specifications are summarized in Table 1. This turbine will be referred to as the Pika T701 for the rest of this report. The turbine has a direct-drive, permanent-magnet generator which can be braked using back-EMF, and a single-use emergency centripetal brake that is factory-tested before each turbine is shipped. A photo of the Pika T701 turbine and met tower is included as Figure 1; Figure 2 shows the turbine rotor up close with a tape measure verifying radius as 1.51 m (diameter 3.0 m). For this test the turbine was installed on a 16.8m guyed tower.
Table 3. Summary of Pika T701 published specifications. *: rotor diameter was verified manually by
measuring the radius of the rotor when it was on the ground.
Parameter Value Units
Manufacturer and address Pika Energy Inc
35 Bradley Dr Stop 1
Westbrook, ME 04092
Turbine Serial Number T701-00021
Inverter Serial Number X3001-00044
Production Date 2014
Tower Type Guyed monopole
Tower Height 16.8 m
Hub Height 16.94 m
Blade make, type, serial number Pika Energy, glass-filled
polypropylene, no serial number
Turbine Control System Pika Energy proprietary Software v. 1030
Turbine Interface Pika Energy Review (via inverter)
Rotor Diameter 3.0*
m
Rotor Swept Area 7.1 m2
Blade Pitching Fixed
11m/s Reference Power (REbus DC) 1.6 kW
11m/s Reference Power (AC after
inverter)
1.48 kW
Cut-in Wind Speed 3.0 m/s
Rated Wind Speed 11 m/s
Rated Rotor Speed 420 RPM
Speed Regulation Type Stall regulation w/ redundant
mechanical brake
Yaw Control Passive, upwind with tail
IEC Turbine Design Class II
Turbine DC Output Voltage (nom) 380 V
Turbine Max Output Current 7 A
Inverter Output Voltage 220/240 VAC
Inverter Output Current Max 13 A
Inverter Output Frequency 60 Hz
7
Figure 1. Pika T701 turbine installed at High Plains Small Wind Test Center, met tower behind; view is towards
the northwest.
8
Figure 2. Pika T701 rotor showing radius measurement.
9
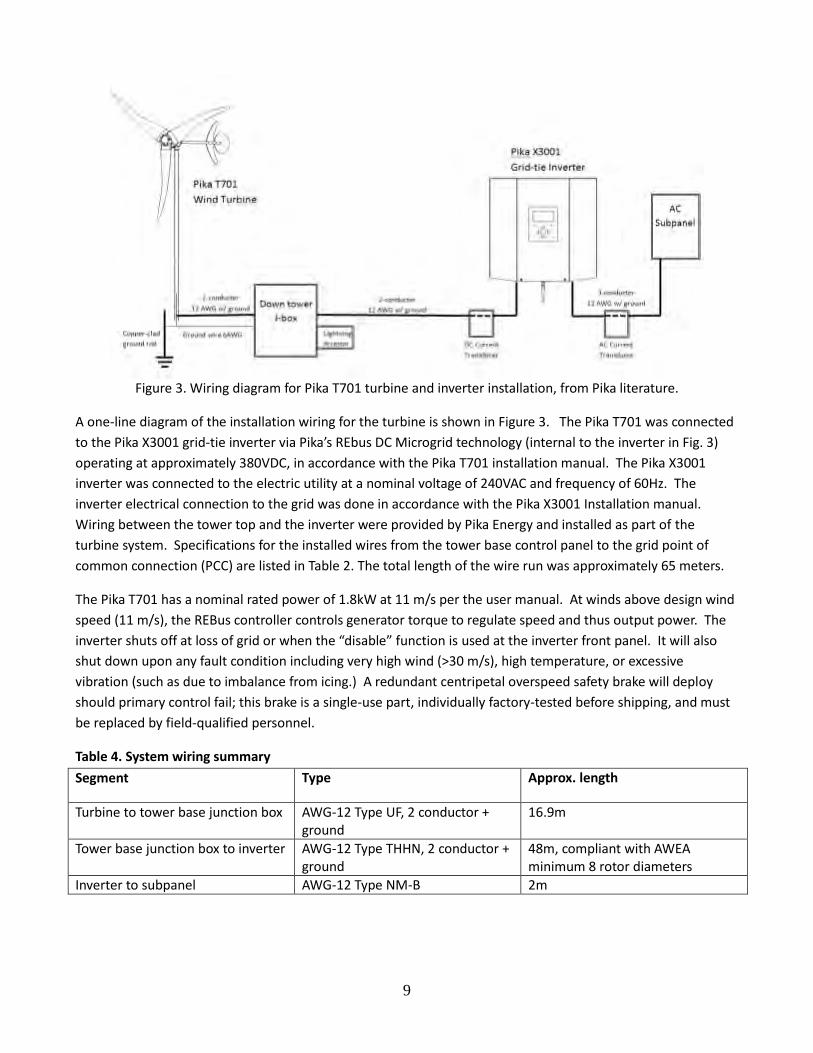
Figure 3. Wiring diagram for Pika T701 turbine and inverter installation, from Pika literature.
A one-line diagram of the installation wiring for the turbine is shown in Figure 3. The Pika T701 was connected
to the Pika X3001 grid-tie inverter via Pika’s REbus DC Microgrid technology (internal to the inverter in Fig. 3)
operating at approximately 380VDC, in accordance with the Pika T701 installation manual. The Pika X3001
inverter was connected to the electric utility at a nominal voltage of 240VAC and frequency of 60Hz. The
inverter electrical connection to the grid was done in accordance with the Pika X3001 Installation manual.
Wiring between the tower top and the inverter were provided by Pika Energy and installed as part of the
turbine system. Specifications for the installed wires from the tower base control panel to the grid point of
common connection (PCC) are listed in Table 2. The total length of the wire run was approximately 65 meters.
The Pika T701 has a nominal rated power of 1.8kW at 11 m/s per the user manual. At winds above design wind
speed (11 m/s), the REBus controller controls generator torque to regulate speed and thus output power. The
inverter shuts off at loss of grid or when the “disable” function is used at the inverter front panel. It will also
shut down upon any fault condition including very high wind (>30 m/s), high temperature, or excessive
vibration (such as due to imbalance from icing.) A redundant centripetal overspeed safety brake will deploy
should primary control fail; this brake is a single-use part, individually factory-tested before shipping, and must
be replaced by field-qualified personnel.
Table 4. System wiring summary
Segment Type Approx. length
Turbine to tower base junction box AWG-12 Type UF, 2 conductor + ground
16.9m
Tower base junction box to inverter AWG-12 Type THHN, 2 conductor + ground
48m, compliant with AWEA minimum 8 rotor diameters
Inverter to subpanel AWG-12 Type NM-B 2m
10
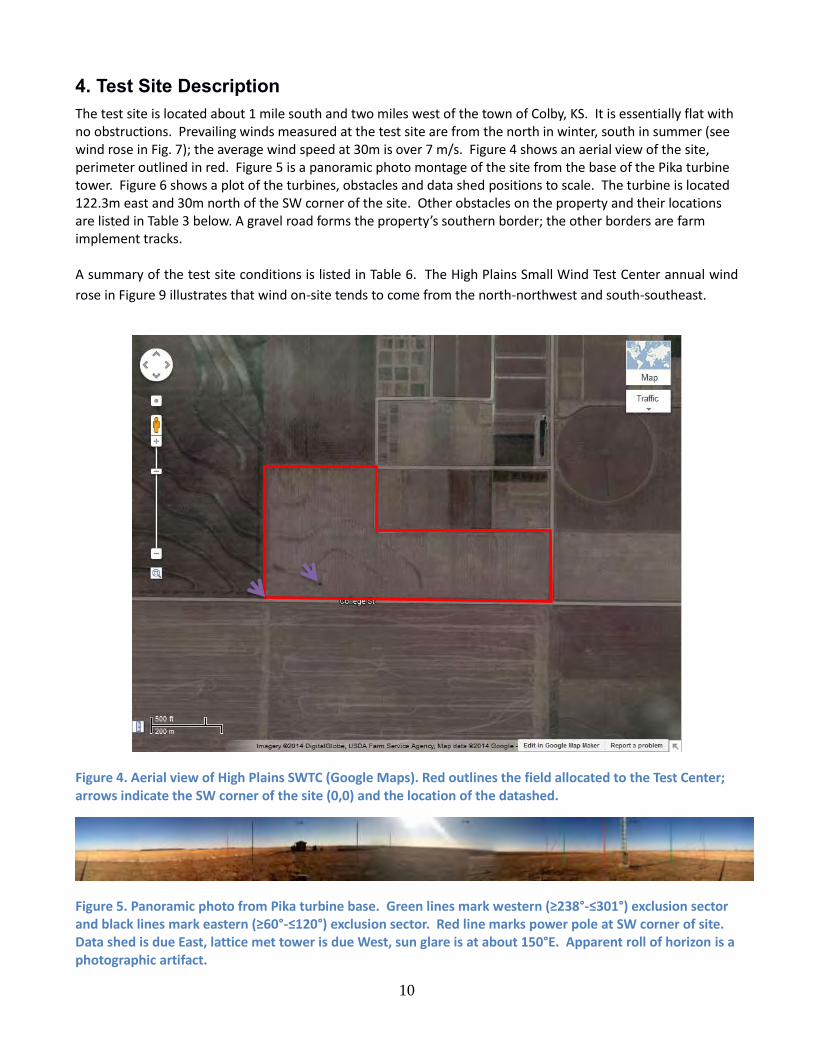
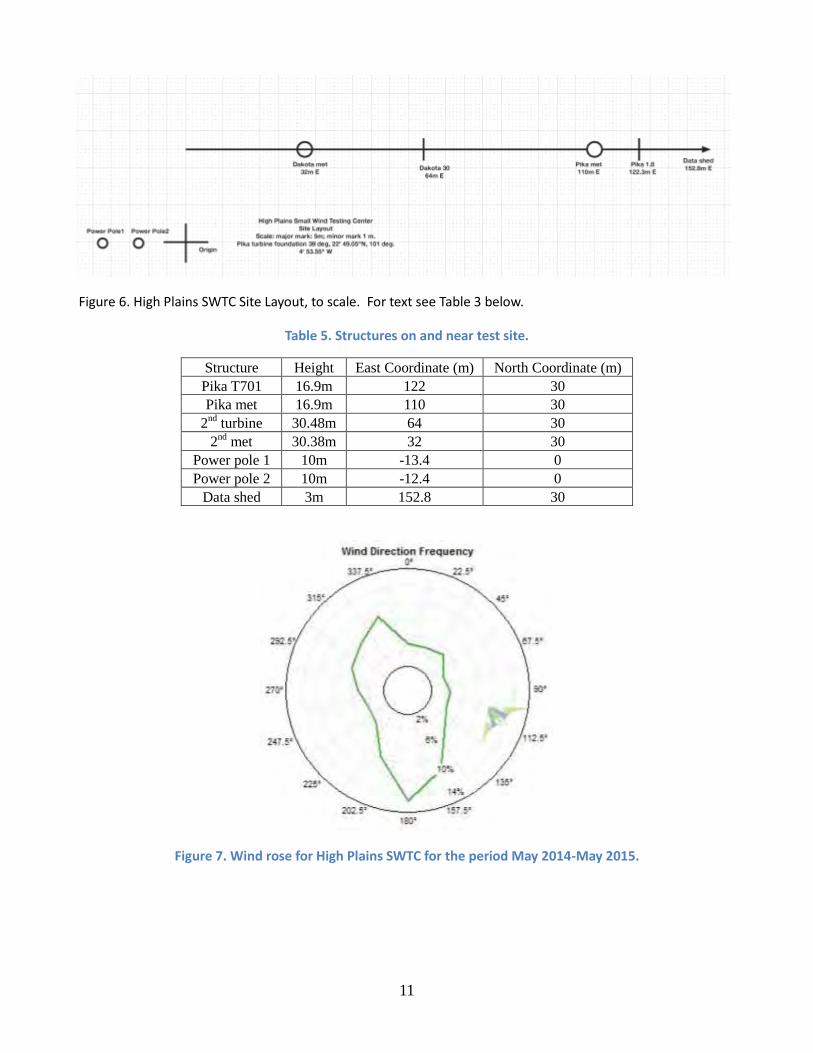
4. Test Site Description The test site is located about 1 mile south and two miles west of the town of Colby, KS. It is essentially flat with no obstructions. Prevailing winds measured at the test site are from the north in winter, south in summer (see wind rose in Fig. 7); the average wind speed at 30m is over 7 m/s. Figure 4 shows an aerial view of the site, perimeter outlined in red. Figure 5 is a panoramic photo montage of the site from the base of the Pika turbine tower. Figure 6 shows a plot of the turbines, obstacles and data shed positions to scale. The turbine is located 122.3m east and 30m north of the SW corner of the site. Other obstacles on the property and their locations are listed in Table 3 below. A gravel road forms the property’s southern border; the other borders are farm implement tracks. A summary of the test site conditions is listed in Table 6. The High Plains Small Wind Test Center annual wind
rose in Figure 9 illustrates that wind on-site tends to come from the north-northwest and south-southeast.
Figure 4. Aerial view of High Plains SWTC (Google Maps). Red outlines the field allocated to the Test Center; arrows indicate the SW corner of the site (0,0) and the location of the datashed.
Figure 5. Panoramic photo from Pika turbine base. Green lines mark western (≥238°-≤301°) exclusion sector and black lines mark eastern (≥60°-≤120°) exclusion sector. Red line marks power pole at SW corner of site. Data shed is due East, lattice met tower is due West, sun glare is at about 150°E. Apparent roll of horizon is a photographic artifact.
11
Figure 6. High Plains SWTC Site Layout, to scale. For text see Table 3 below.
Table 5. Structures on and near test site.
Structure Height East Coordinate (m) North Coordinate (m)
Pika T701 16.9m 122 30
Pika met 16.9m 110 30
2nd
turbine 30.48m 64 30
2nd
met 30.38m 32 30
Power pole 1 10m -13.4 0
Power pole 2 10m -12.4 0
Data shed 3m 152.8 30
Figure 7. Wind rose for High Plains SWTC for the period May 2014-May 2015.
12
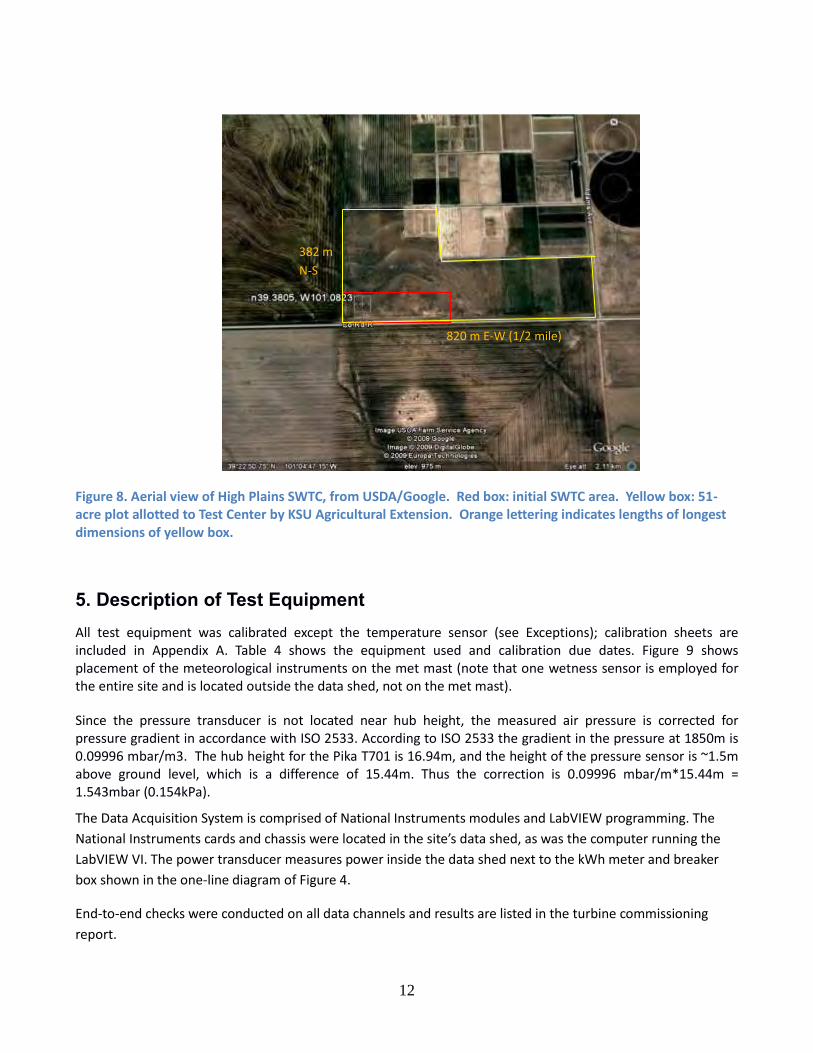
Figure 8. Aerial view of High Plains SWTC, from USDA/Google. Red box: initial SWTC area. Yellow box: 51-acre plot allotted to Test Center by KSU Agricultural Extension. Orange lettering indicates lengths of longest dimensions of yellow box.
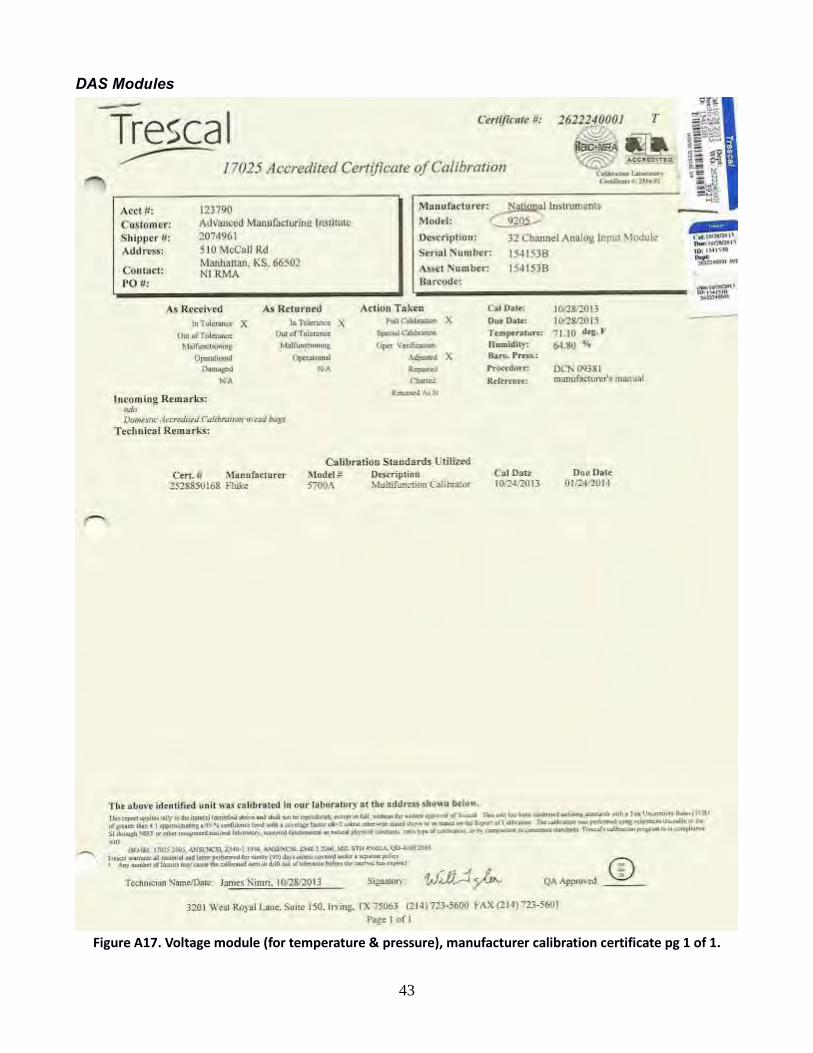
5. Description of Test Equipment All test equipment was calibrated except the temperature sensor (see Exceptions); calibration sheets are included in Appendix A. Table 4 shows the equipment used and calibration due dates. Figure 9 shows placement of the meteorological instruments on the met mast (note that one wetness sensor is employed for the entire site and is located outside the data shed, not on the met mast).
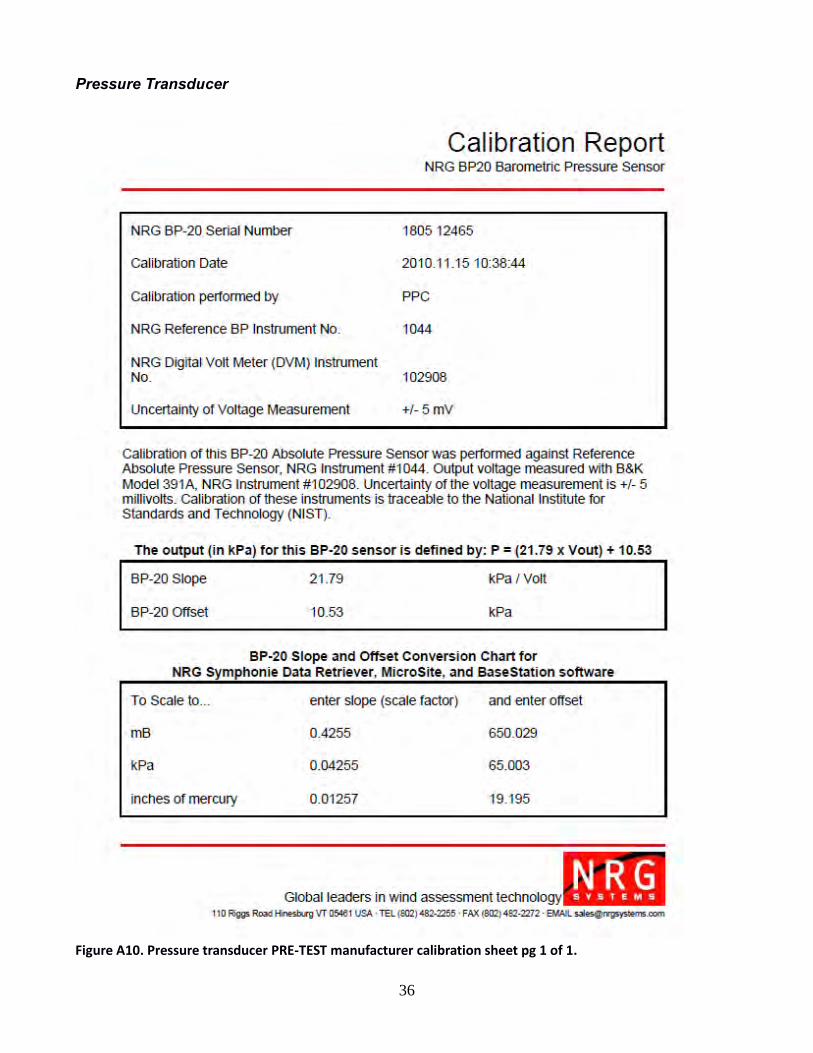
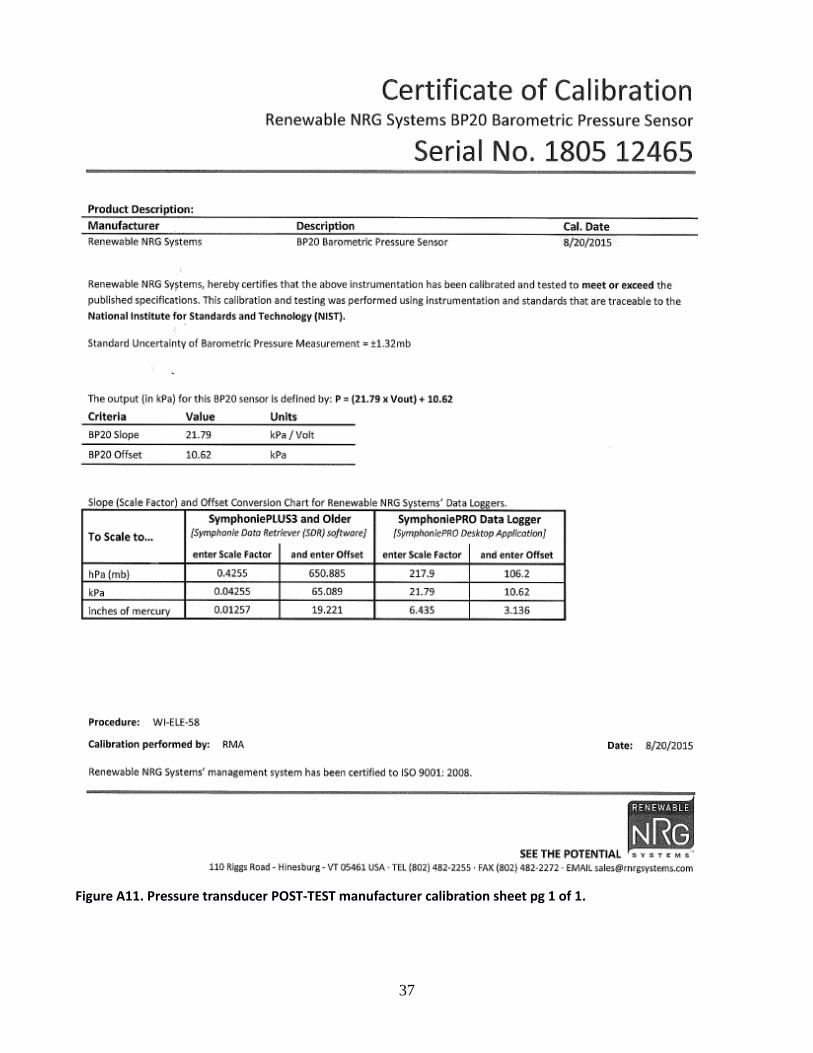
Since the pressure transducer is not located near hub height, the measured air pressure is corrected for pressure gradient in accordance with ISO 2533. According to ISO 2533 the gradient in the pressure at 1850m is 0.09996 mbar/m3. The hub height for the Pika T701 is 16.94m, and the height of the pressure sensor is ~1.5m above ground level, which is a difference of 15.44m. Thus the correction is 0.09996 mbar/m*15.44m = 1.543mbar (0.154kPa).
The Data Acquisition System is comprised of National Instruments modules and LabVIEW programming. The
National Instruments cards and chassis were located in the site’s data shed, as was the computer running the
LabVIEW VI. The power transducer measures power inside the data shed next to the kWh meter and breaker
box shown in the one‐line diagram of Figure 4.
End-to-end checks were conducted on all data channels and results are listed in the turbine commissioning
report.
820 m E-W (1/2 mile)
382 m
N-S
13
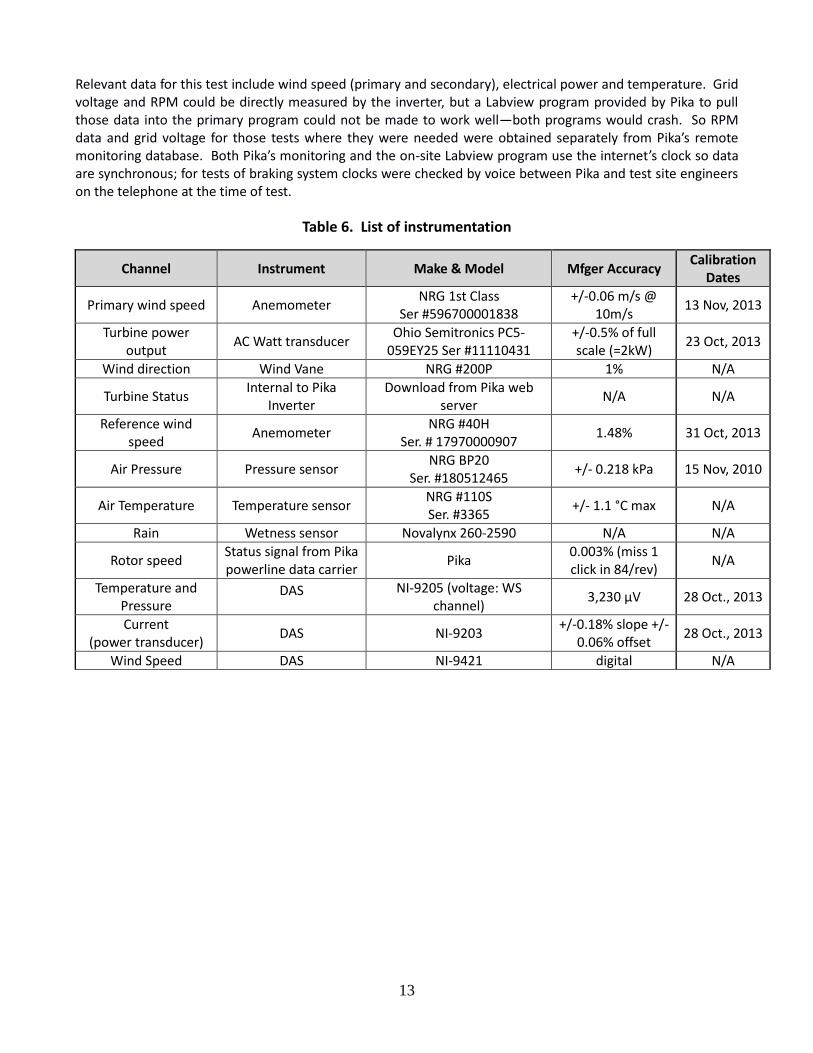
Relevant data for this test include wind speed (primary and secondary), electrical power and temperature. Grid voltage and RPM could be directly measured by the inverter, but a Labview program provided by Pika to pull those data into the primary program could not be made to work well—both programs would crash. So RPM data and grid voltage for those tests where they were needed were obtained separately from Pika’s remote monitoring database. Both Pika’s monitoring and the on-site Labview program use the internet’s clock so data are synchronous; for tests of braking system clocks were checked by voice between Pika and test site engineers on the telephone at the time of test.
Table 6. List of instrumentation
Channel Instrument Make & Model Mfger Accuracy Calibration
Dates
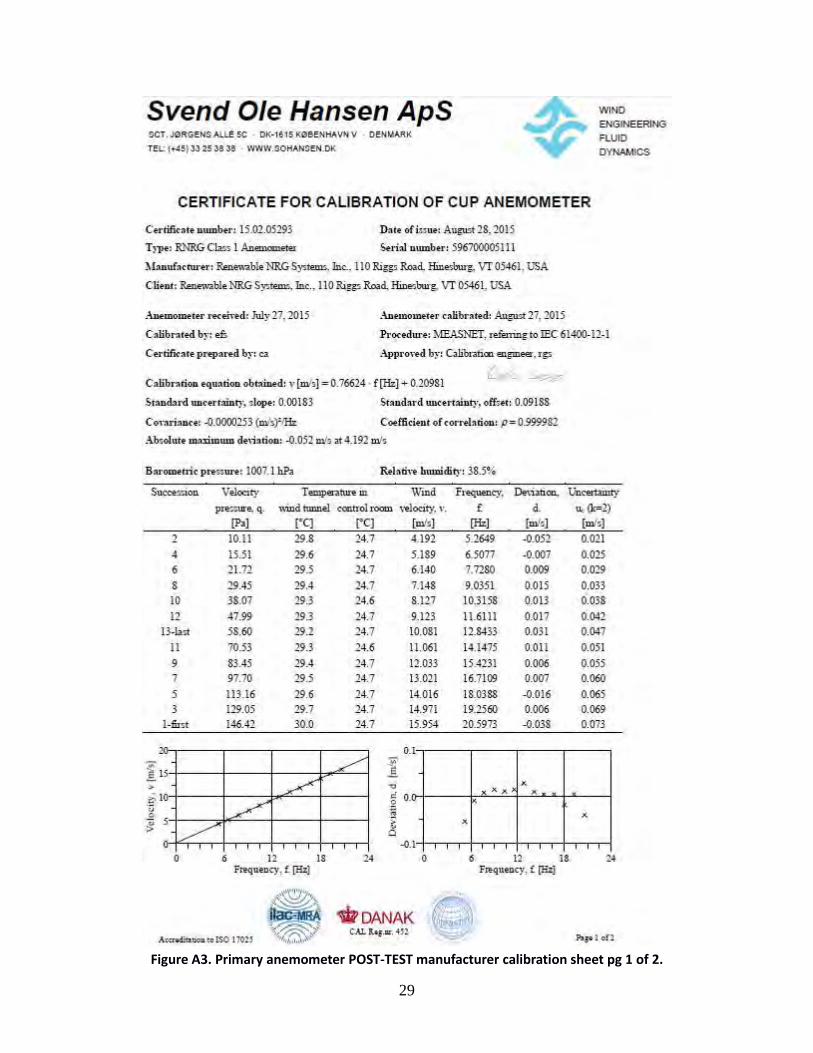
Primary wind speed Anemometer NRG 1st Class
Ser #596700001838 +/-0.06 m/s @
10m/s 13 Nov, 2013
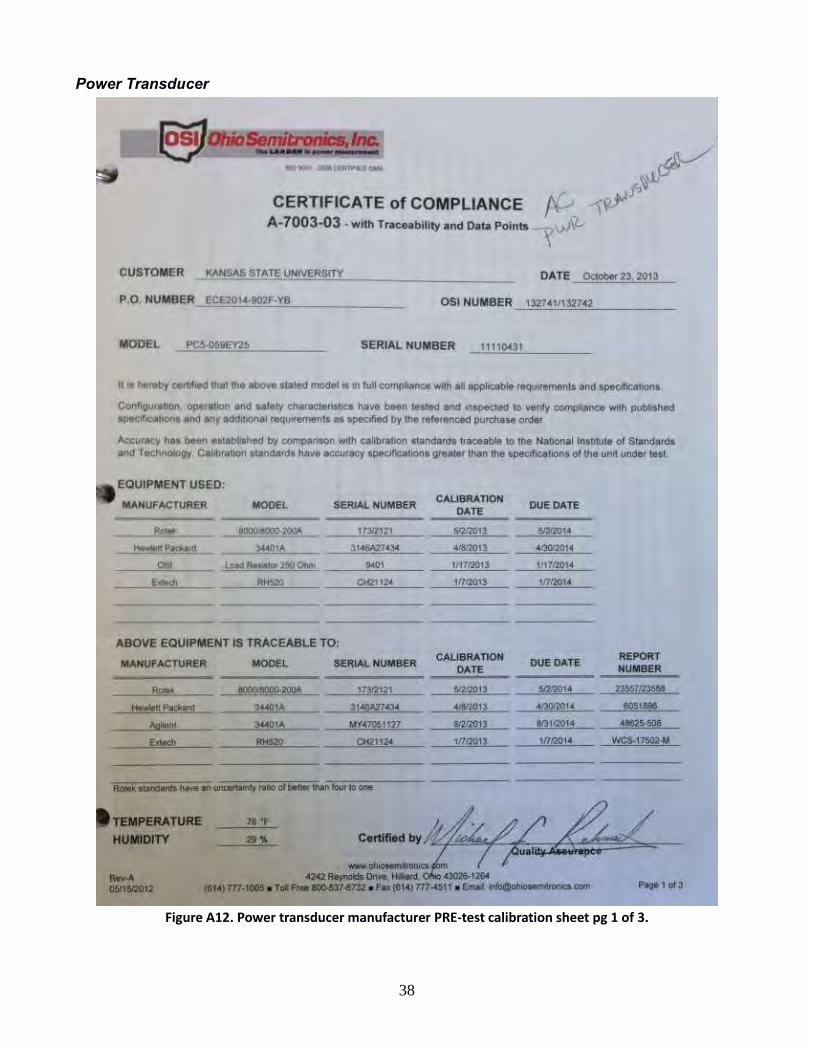
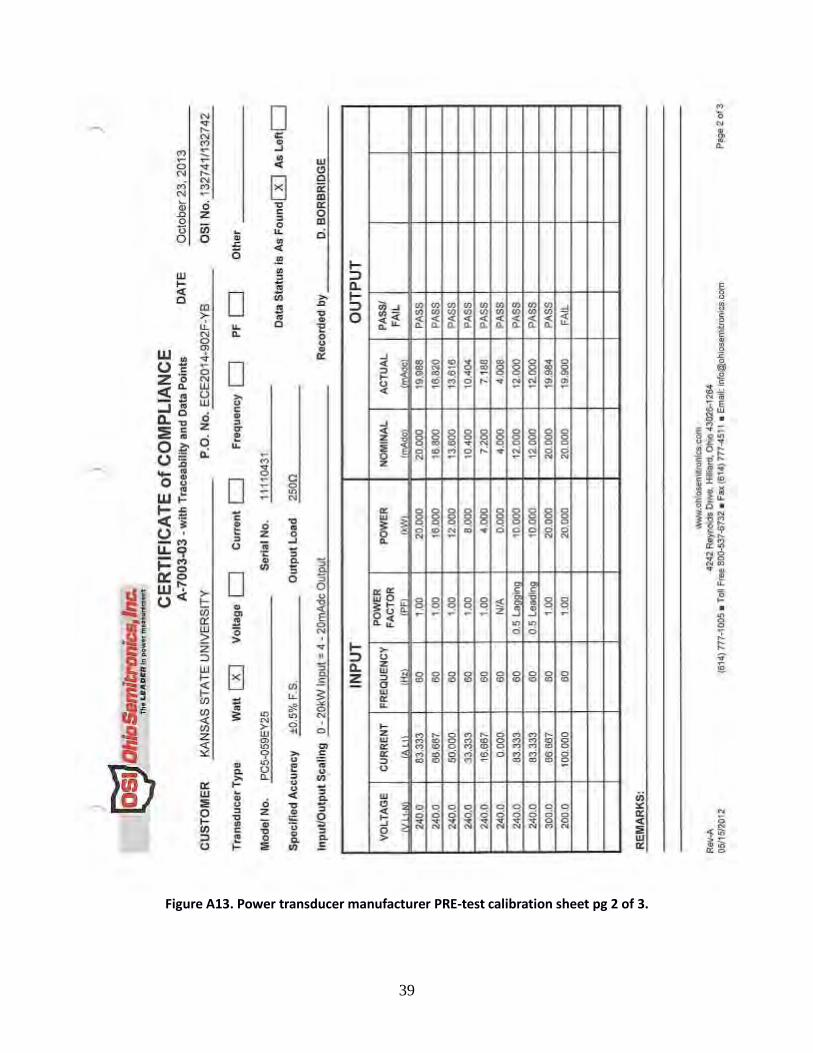
Turbine power output
AC Watt transducer Ohio Semitronics PC5-
059EY25 Ser #11110431 +/-0.5% of full scale (=2kW)
23 Oct, 2013
Wind direction Wind Vane NRG #200P 1% N/A
Turbine Status Internal to Pika
Inverter Download from Pika web
server N/A N/A
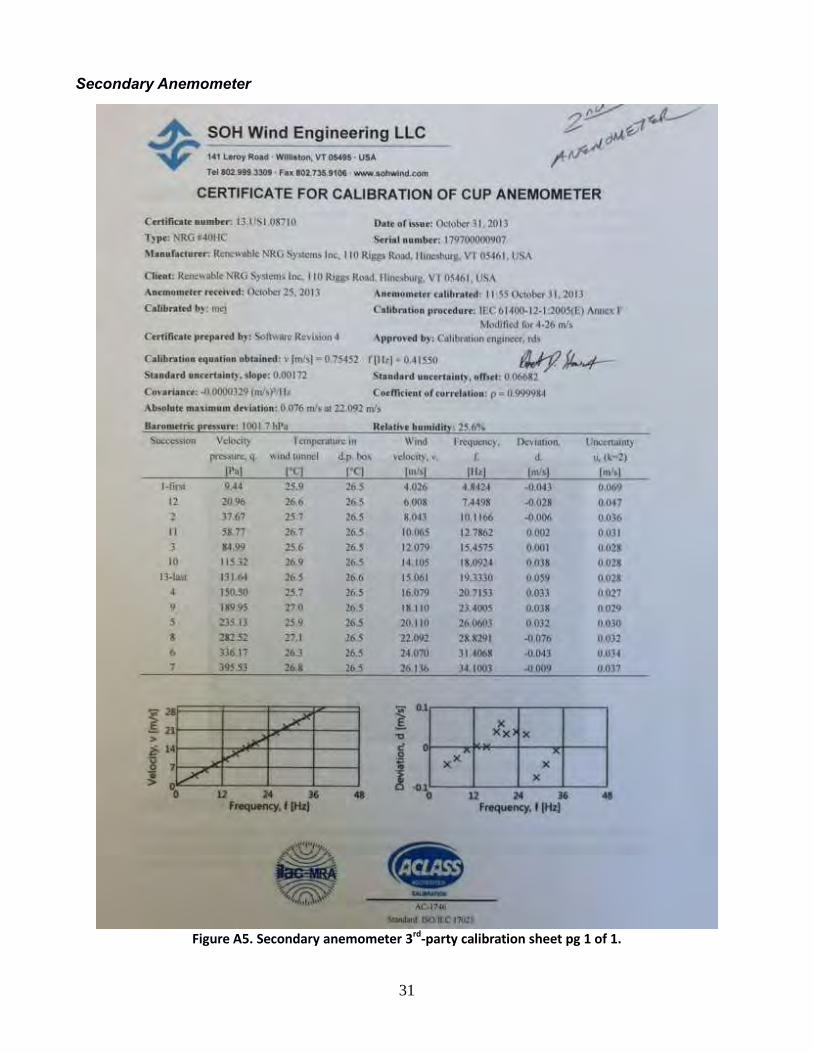
Reference wind speed
Anemometer NRG #40H
Ser. # 17970000907 1.48% 31 Oct, 2013
Air Pressure Pressure sensor NRG BP20
Ser. #180512465 +/- 0.218 kPa 15 Nov, 2010
Air Temperature Temperature sensor NRG #110S Ser. #3365
+/- 1.1 °C max N/A
Rain Wetness sensor Novalynx 260-2590 N/A N/A
Rotor speed Status signal from Pika powerline data carrier
Pika 0.003% (miss 1 click in 84/rev)
N/A
Temperature and Pressure
DAS NI‐9205 (voltage: WS channel)
3,230 µV 28 Oct., 2013
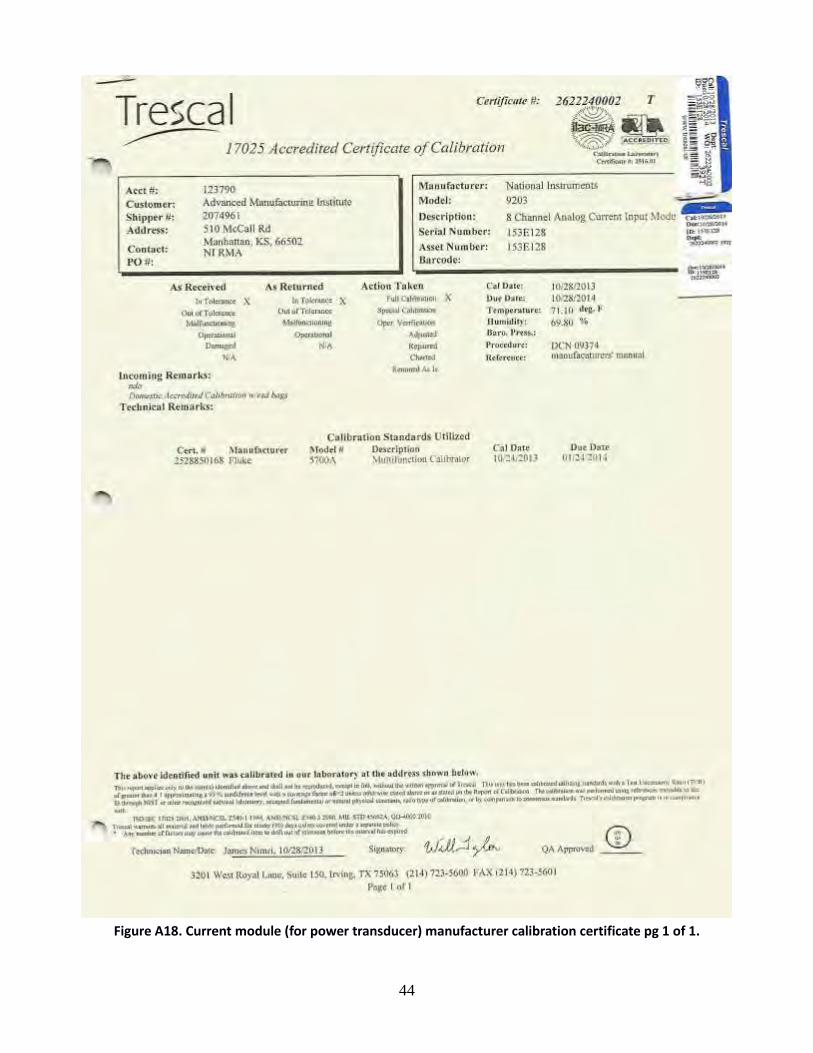
Current (power transducer)
DAS NI‐9203 +/-0.18% slope +/-
0.06% offset 28 Oct., 2013
Wind Speed DAS NI‐9421 digital N/A
14
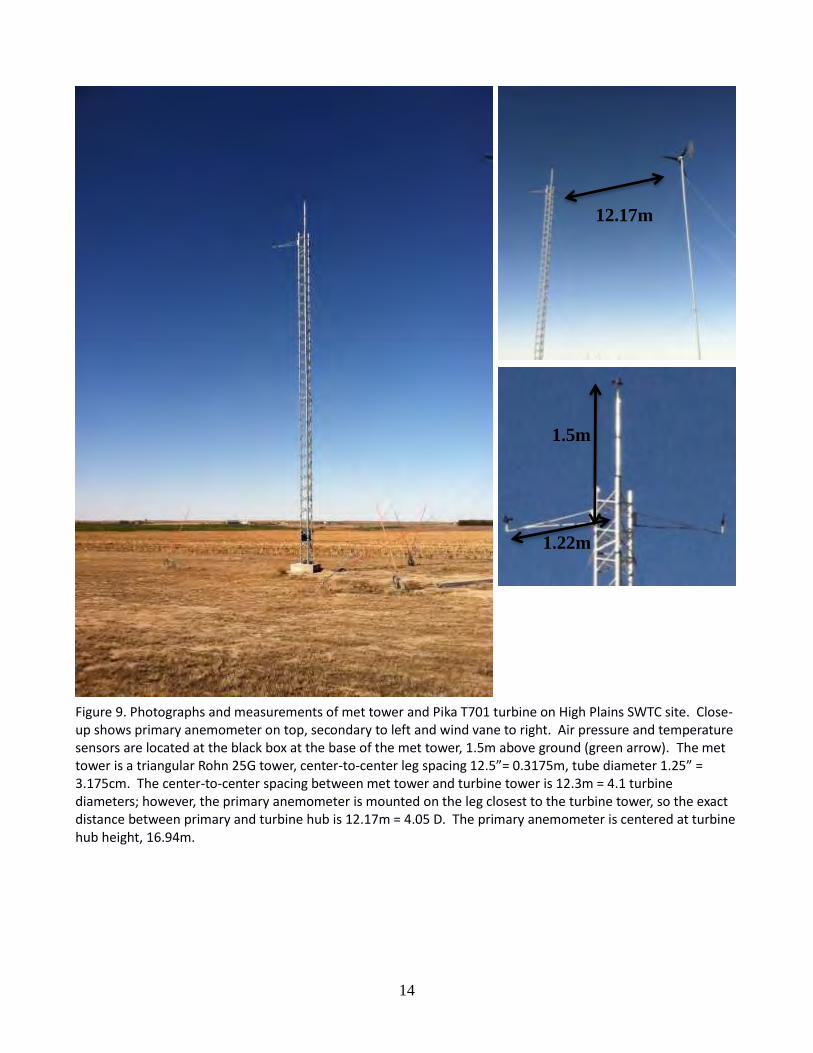
Figure 9. Photographs and measurements of met tower and Pika T701 turbine on High Plains SWTC site. Close-up shows primary anemometer on top, secondary to left and wind vane to right. Air pressure and temperature sensors are located at the black box at the base of the met tower, 1.5m above ground (green arrow). The met tower is a triangular Rohn 25G tower, center-to-center leg spacing 12.5”= 0.3175m, tube diameter 1.25” = 3.175cm. The center-to-center spacing between met tower and turbine tower is 12.3m = 4.1 turbine diameters; however, the primary anemometer is mounted on the leg closest to the turbine tower, so the exact distance between primary and turbine hub is 12.17m = 4.05 D. The primary anemometer is centered at turbine hub height, 16.94m.
1.5m
1.22m
12.17m
15
6. Test Results The T701 turbine was delivered to the test site on 17 July 2014 and was installed on that date. Installation was completed by Pika technicians in accordance with the Pika T701 Wind Turbine Installation & Service Manual. Pre-flight checks were completed and duration testing began at 1503 hours on 17 July 2014.
Table 2 shows the results of the duration test. Individual requirements of the duration test are discussed in the following subsections.
Test period
A total of twenty-five acoustic tests were run during the duration test time frame. Each acoustic test required
the turbine to be disabled and then enabled. The only turbine failure noted during this time frame was on 3
February 2015. After disabling the turbine through an AC breaker switch, difficulty was encountered in
enabling the turbine. This was determined to be an issue with the inverter, which was resolved.
During the duration test period, no unusual vibration or noise was detected. This included those twenty-five
periods when acoustical testing was in process. The following disassembly of the T701 system revealed no
significant wear as defined by IEC 61400-2, section 9.4.2.1. In addition, no corrosion or damage to the turbine
parts was noted in the disassembly process.
Post-Test Inspection
On Monday, 7/13/2015, Pika engineer Tony Nuzzo was at the High Plains Small Wind Test Site to lower and
dismantle the Pika T701 turbine. In accordance with IEC 61400-2 Section 9.4, the turbine was inspected for any
wear or damage that may affect the unit’s duration. Assisting in the procedures were Barry Kaaz, Local Test Site
Manager, and Derek Reilley, Alternative Energy Director at Colby Community College. Midwest Energy
technicians were also on site briefly to assist with the lowering of the tower and turbine. Per agreement with
Pika, the guyed tower and related components were stored at the test site. All dismantling was completed on
Monday. Tuesday, items were packed and removed in preparation for shipment. The turbine and related
components, inverter, and video camera were removed from the test site on 7/14/2015.
No significant wear, corrosion, or damage was noted to the turbine components. No items were noted during
the inspection that would appear to result in the loss of strength during the extrapolated lifetime of the
turbine. The pictures note a slight discharge at the bottom of the nacelle coming from two manufactured
holes. As the holes were incorporated into the turbine design, the discharge may be from anticipated normal
release of excess grease. Further inspection of the sealed nacelle would be needed to determine this. The
sealed nacelle was not opened for inspection at the site but this area was not opened for inspection prior to
installation and operation. Manufacturer agreed to forward pictures upon their disassembly of the turbine.
16
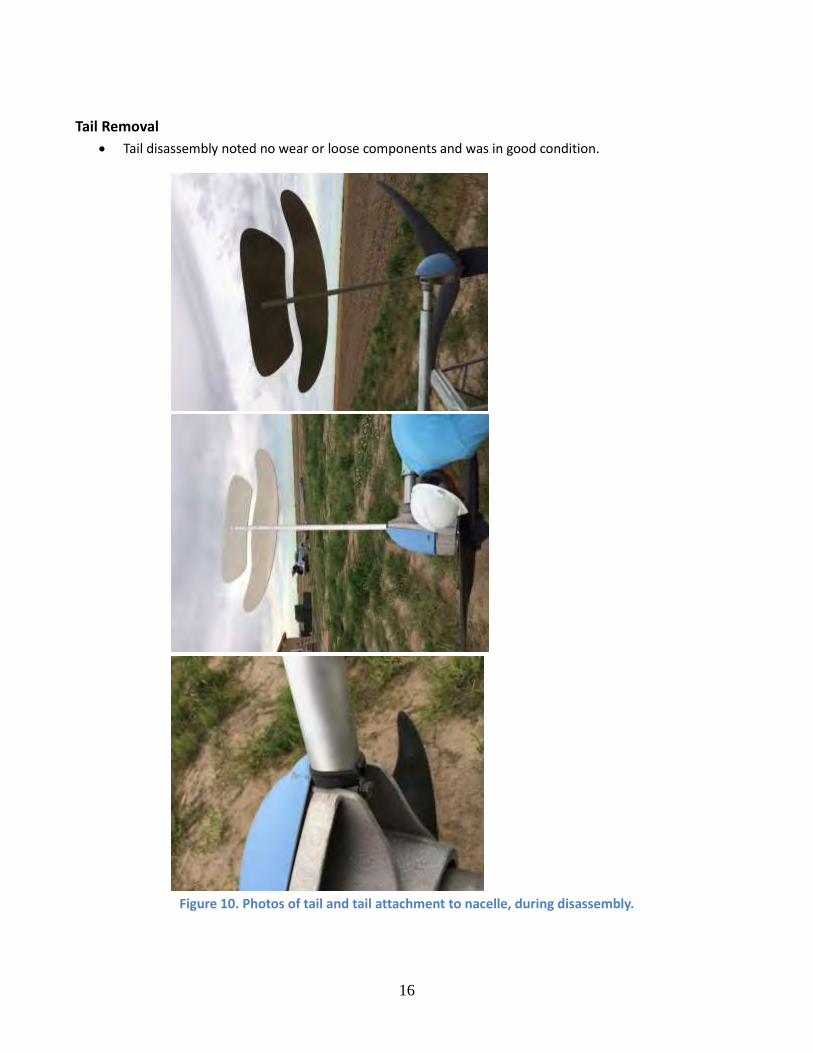
Tail Removal
Tail disassembly noted no wear or loose components and was in good condition.
Figure 10. Photos of tail and tail attachment to nacelle, during disassembly.
17
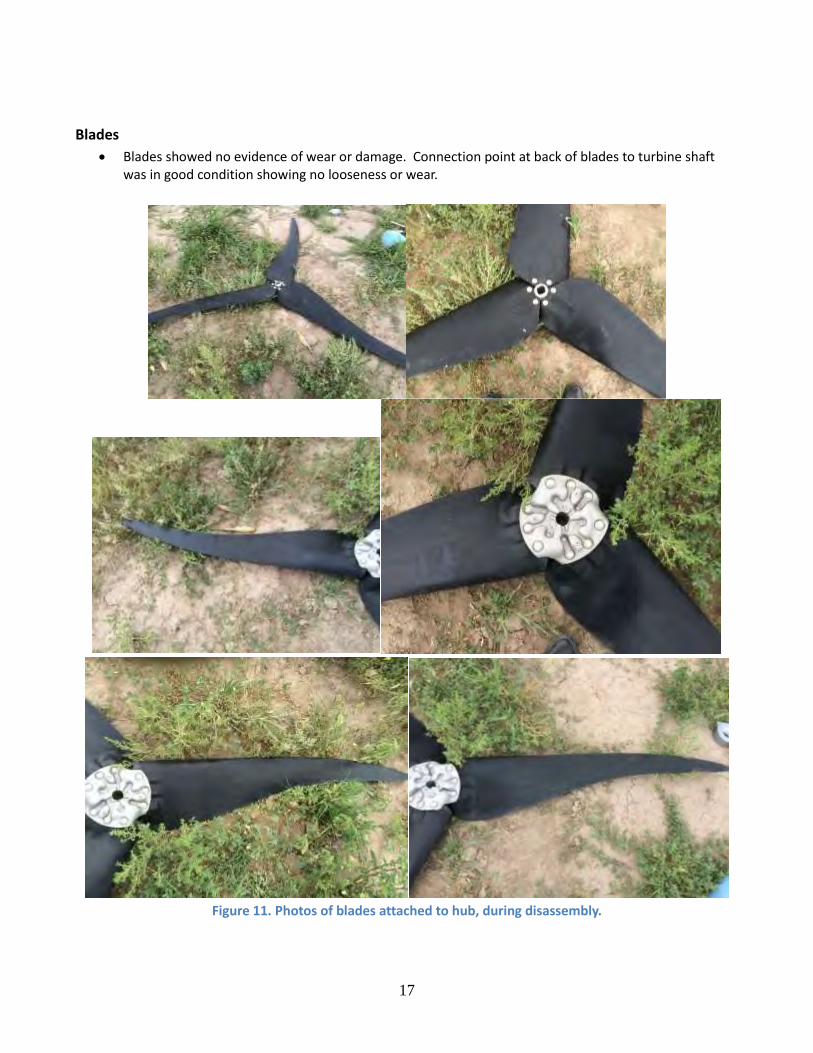
Blades
Blades showed no evidence of wear or damage. Connection point at back of blades to turbine shaft was in good condition showing no looseness or wear.
Figure 11. Photos of blades attached to hub, during disassembly.
18
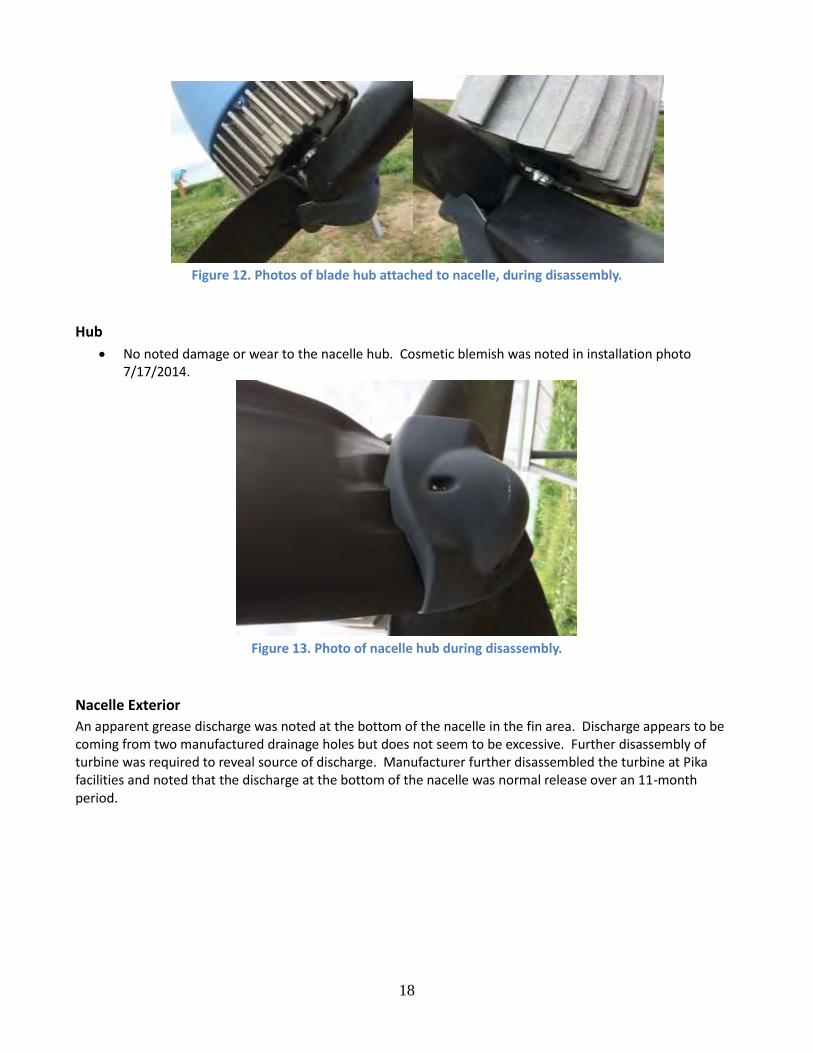
Figure 12. Photos of blade hub attached to nacelle, during disassembly.
Hub
No noted damage or wear to the nacelle hub. Cosmetic blemish was noted in installation photo 7/17/2014.
Figure 13. Photo of nacelle hub during disassembly.
Nacelle Exterior
An apparent grease discharge was noted at the bottom of the nacelle in the fin area. Discharge appears to be coming from two manufactured drainage holes but does not seem to be excessive. Further disassembly of turbine was required to reveal source of discharge. Manufacturer further disassembled the turbine at Pika facilities and noted that the discharge at the bottom of the nacelle was normal release over an 11-month period.
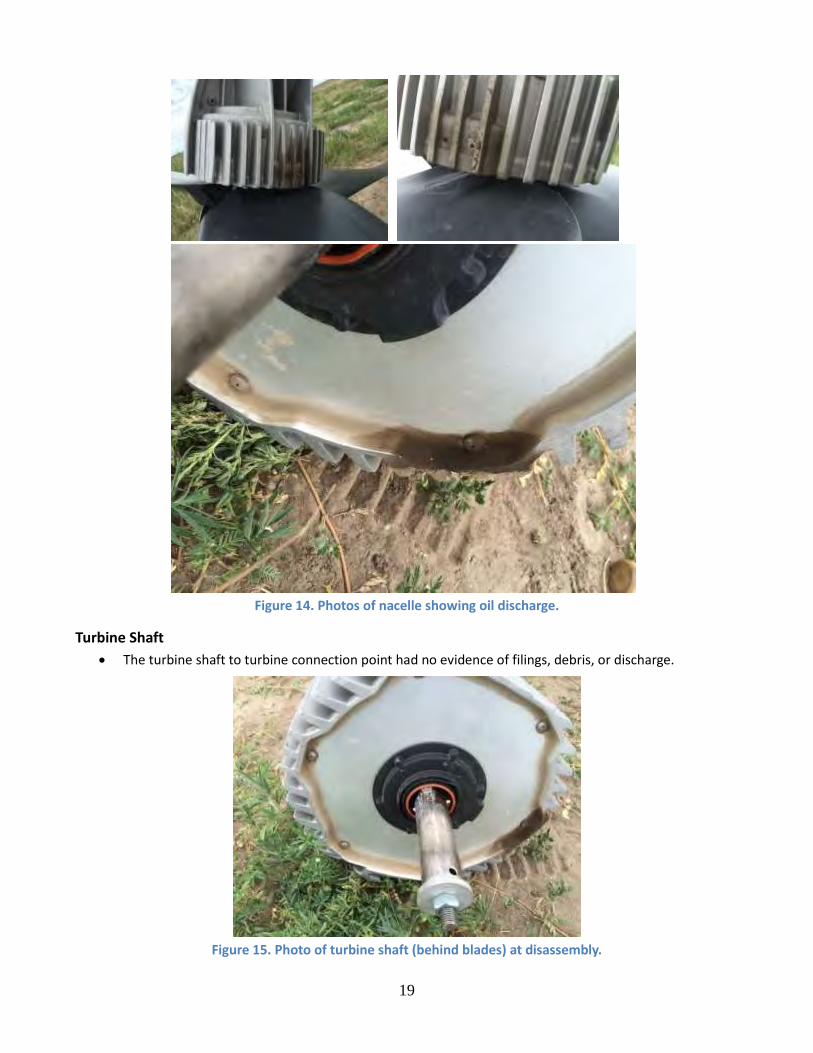
19
Figure 14. Photos of nacelle showing oil discharge.
Turbine Shaft
The turbine shaft to turbine connection point had no evidence of filings, debris, or discharge.
Figure 15. Photo of turbine shaft (behind blades) at disassembly.
20
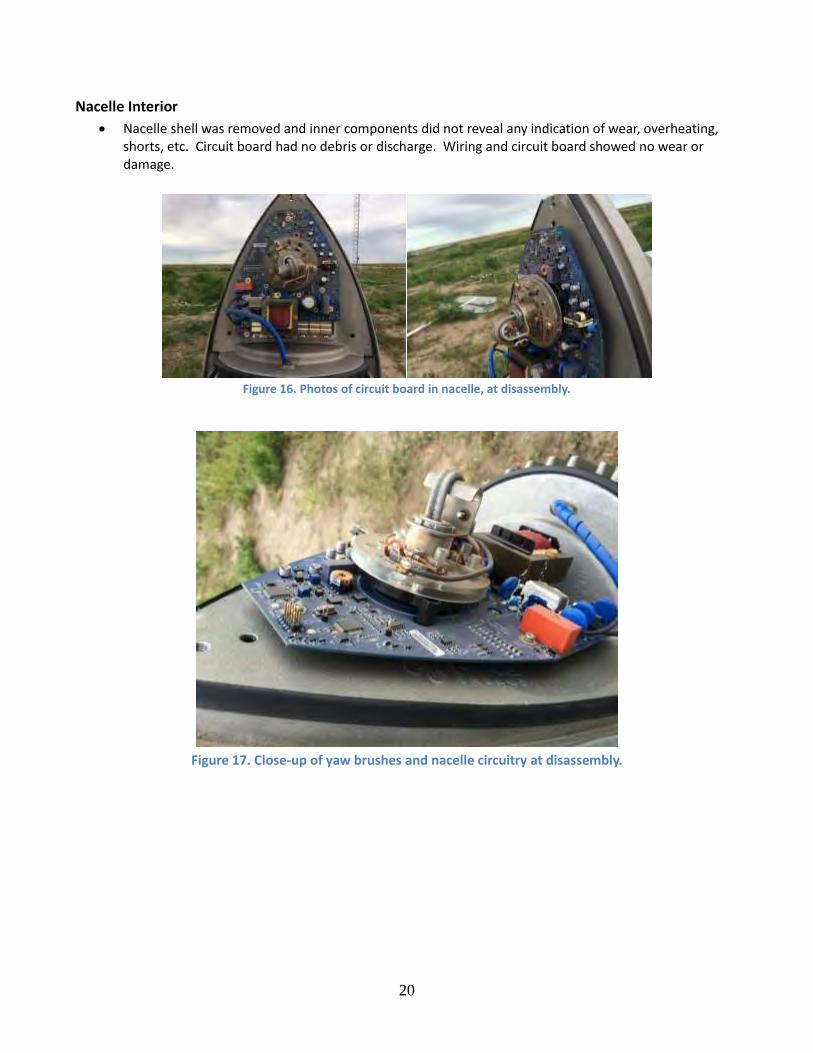
Nacelle Interior
Nacelle shell was removed and inner components did not reveal any indication of wear, overheating, shorts, etc. Circuit board had no debris or discharge. Wiring and circuit board showed no wear or damage.
Figure 16. Photos of circuit board in nacelle, at disassembly.
Figure 17. Close-up of yaw brushes and nacelle circuitry at disassembly.
21
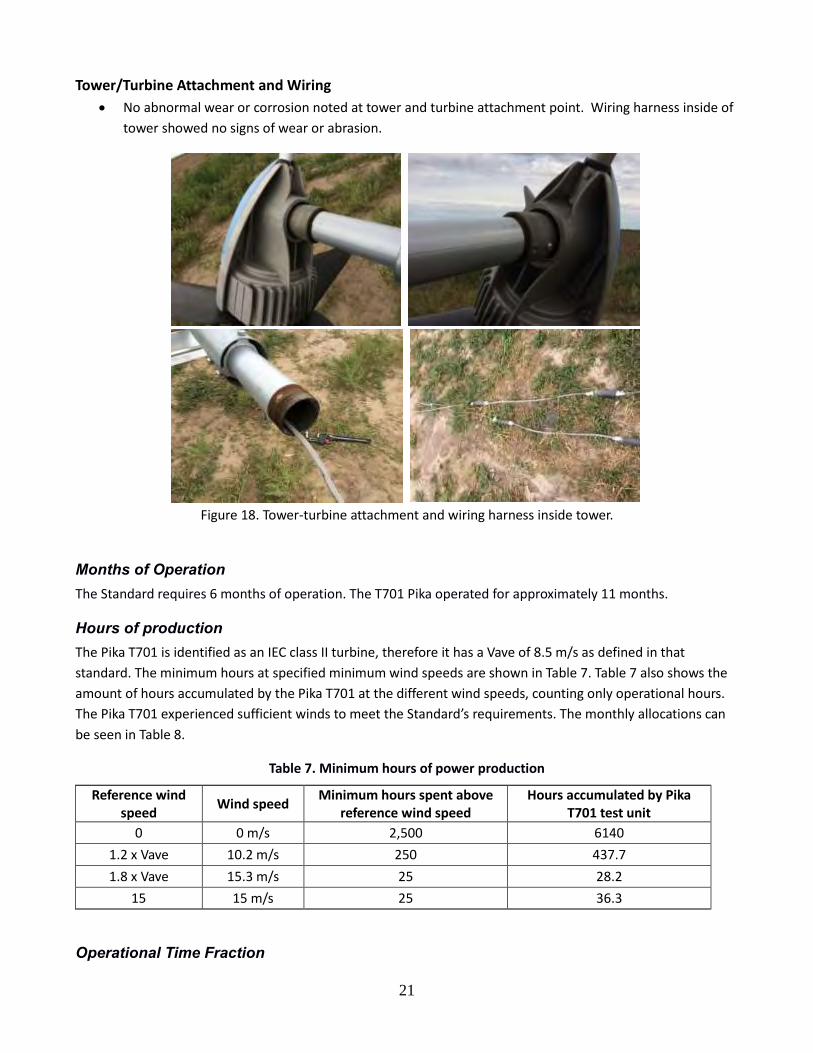
Tower/Turbine Attachment and Wiring
No abnormal wear or corrosion noted at tower and turbine attachment point. Wiring harness inside of
tower showed no signs of wear or abrasion.
Figure 18. Tower-turbine attachment and wiring harness inside tower.
Months of Operation The Standard requires 6 months of operation. The T701 Pika operated for approximately 11 months.
Hours of production The Pika T701 is identified as an IEC class II turbine, therefore it has a Vave of 8.5 m/s as defined in that
standard. The minimum hours at specified minimum wind speeds are shown in Table 7. Table 7 also shows the
amount of hours accumulated by the Pika T701 at the different wind speeds, counting only operational hours.
The Pika T701 experienced sufficient winds to meet the Standard’s requirements. The monthly allocations can
be seen in Table 8.
Table 7. Minimum hours of power production
Reference wind speed
Wind speed Minimum hours spent above
reference wind speed Hours accumulated by Pika
T701 test unit
0 0 m/s 2,500 6140
1.2 x Vave 10.2 m/s 250 437.7
1.8 x Vave 15.3 m/s 25 28.2
15 15 m/s 25 36.3
Operational Time Fraction
22
The duration test started on 17 July 2014 and continued until 13 May 2015. The operational time fraction, TO, was calculated as follows: TO = Tt-Tn-Tu-Te x 100% Tt-Tu-Te Where:
Tt=total time period under consideration;
Tn=time during which the turbine is known to be non-operational;
Tu=time during which the turbine status is unknown;
Environmental conditions The Standard requires reporting the average Turbulence Intensity (TI) at 15 m/s and the highest instantaneous wind speed during the test. The average TI at 15 m/s ±0.5 m/s for the test was 11%. The maximum instantaneous wind speed, based on 1Hz data, for the test was 25.6 m/s during May 2015. The maximum 10-minute average wind speed recorded was 18.4 m/s, in December 2014. AWEA requires a minimum of 25 hours of operation at wind speeds of 15 m/s or greater; the Pika T701 operated for 36 hours in this wind region over the course of this test. These overall values as well as the monthly values can be seen in Table 2.
Power degradation
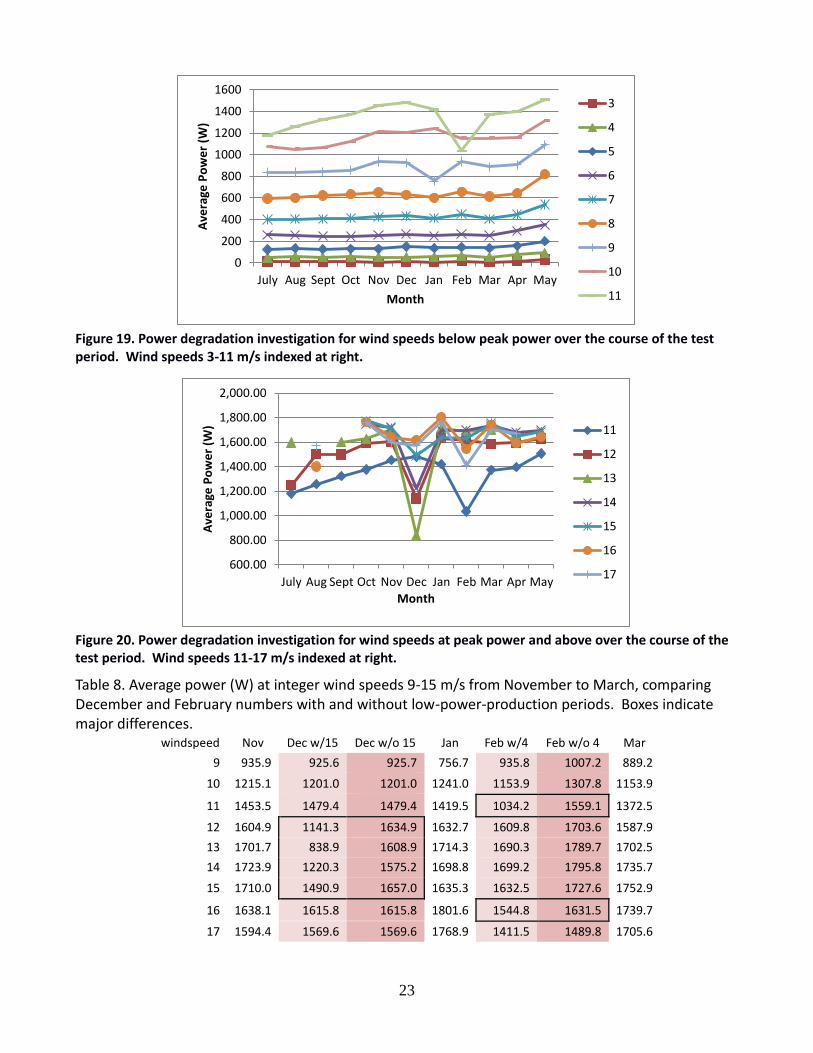
The Standard requires an analysis of power degradation during the test. The results of this analysis are shown in Figures 19 and 20, which plot the average measured power for each month by wind speed. The trend of increasing power at a given wind speed from July to December may be explained by the increasing air density associated with much colder temperatures.
The slight rise in power output near the end of test (May 2015) cannot be explained solely by the power transducer being out of calibration; the latter can account for only 1.5% change (see Uncertainty below). It may be due to May being only ½ month. The significant dips in power production at higher wind speeds in December and February are each due to a single time window during the particular month, in which the wind speed was relatively high but power production unaccountably low. These two windows were on December 15, from about midnight to 10:30 and on February 4th, from 9:30-15:50. The time runs of mean AC power produced vs. wind speed for the two windows are shown in Figs. 21 and 22. If these data are omitted from the monthly averages, the discrepancies in power produced seen in Figs 19 and 20 disappear. Table 8 gives these numbers. We conclude that there was no significant power degradation over the test period, and these periods of low power are a function of the controller programming; further discussion under Dynamic behavior below.
23
Figure 19. Power degradation investigation for wind speeds below peak power over the course of the test period. Wind speeds 3-11 m/s indexed at right.
Figure 20. Power degradation investigation for wind speeds at peak power and above over the course of the test period. Wind speeds 11-17 m/s indexed at right.
Table 8. Average power (W) at integer wind speeds 9-15 m/s from November to March, comparing December and February numbers with and without low-power-production periods. Boxes indicate major differences.
windspeed Nov Dec w/15 Dec w/o 15 Jan Feb w/4 Feb w/o 4 Mar
Dynamic behavior The standard requires that the turbine under test be observed for more than an hour total, and for more than 5 minutes each at wind speeds close to 5, 10, 15 and 20 m/s. Personnel on site observed the unit operating nearly every day over the course of the test and this requirement was surpassed as a result, with the exception of sustained winds at 20m/s, which were not recorded during the test. Additionally, observations around start‐up and in winds up to 16 m/s were made. The following observations were reported:
Observation in winds 6-11 m/s: No unusual noise or vibration observed.
Observation in high winds (over 12 m/s): No unusual noise or vibration observed.
Observations at cut‐out: The Pika T701 does not cut out completely in winds less than 30m/s; it regulates output power by slowing or stopping and then restarting. This shows up in 1-minute data as varying power output but is not visible in 10-minute data except in the reported minimum and maximum power measured at 1 Hz. No unusual behavior was observed in winds of 15 m/s and higher.
Observations in extreme temperature: physical observations and inspections of data reveal no unusual behavior during operation at temperatures down to -24°C or up to 42°C. The two low-power periods in December and February both occurred during periods of temperature near or below freezing; however, normal behaviour was seen during other periods with much lower temperatures.
Observations of unusual behavior: on 26 January, 2015, the Pika T701 was disabled at the inverter for background acoustic measurements. After 10 minutes it was enabled, but was observed to produce only 65W when it usually produces 300-400W at that wind speed. After disabling and enabling once more, the site operator called Pika, and Pika staff disabled and enabled the turbine twice more, remotely. After about 30 minutes the turbine power generation corrected itself on its own. During a final disabling and enabling locally at the end of acoustic testing on the same day, the Pika T701 behaved normally. This behavior matches the data observed during the December and February low-power periods noted above.
Greater details on operational observations for various conditions are presented in the Safety & Function test report.
25
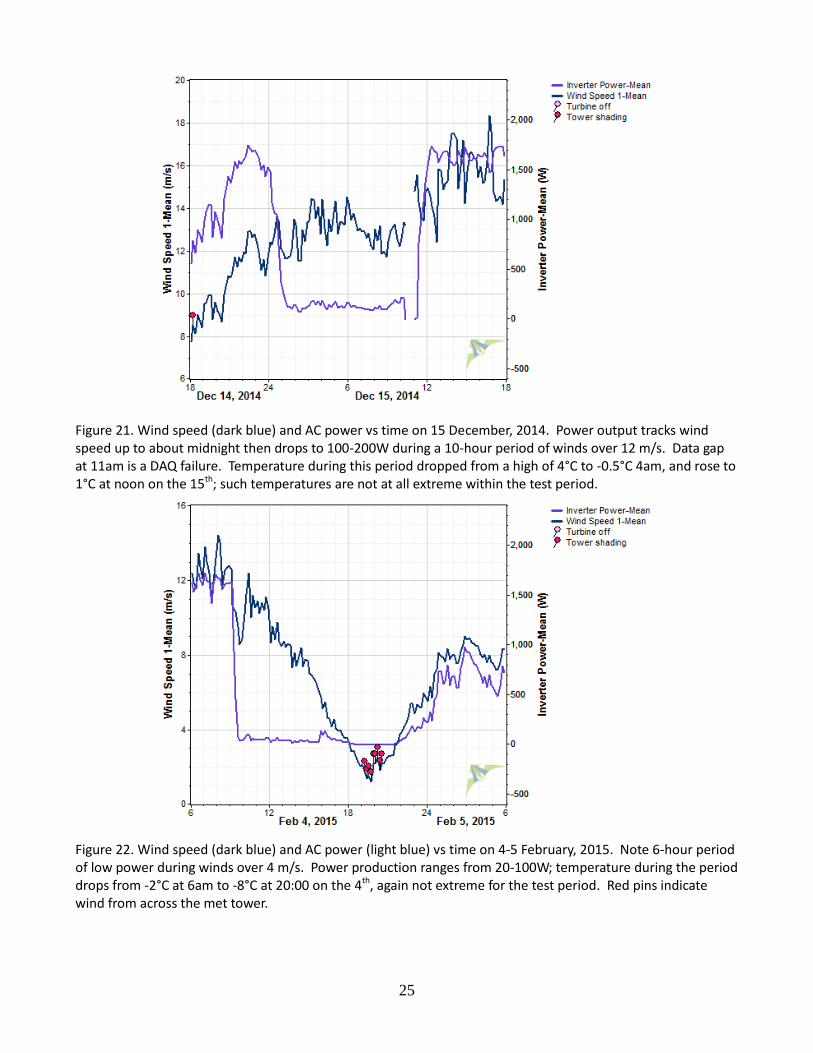
Figure 21. Wind speed (dark blue) and AC power vs time on 15 December, 2014. Power output tracks wind speed up to about midnight then drops to 100-200W during a 10-hour period of winds over 12 m/s. Data gap at 11am is a DAQ failure. Temperature during this period dropped from a high of 4°C to -0.5°C 4am, and rose to 1°C at noon on the 15th; such temperatures are not at all extreme within the test period.
Figure 22. Wind speed (dark blue) and AC power (light blue) vs time on 4-5 February, 2015. Note 6-hour period of low power during winds over 4 m/s. Power production ranges from 20-100W; temperature during the period drops from -2°C at 6am to -8°C at 20:00 on the 4th, again not extreme for the test period. Red pins indicate wind from across the met tower.
26
7. Uncertainty
Hours The turbine is not always producing power for the entire 10‐minute period whenever the average power for that period is positive. Around cut-in (~3 m/s) and in high wind speeds when the turbine is regulating power, there are periods within the 10 minutes when power production is zero.
We have put all time when the DAQ was not operating as TE, and also those time windows when 10-second data were collected, instead of 10-minute data, have been counted as TE. These are all short windows, while the turbine is being observed, and for 1/2 to 2/3 of that time the turbine was operating. Thus TE is overcounted.
For all flagged times (TE, TN and TU) no attempt has been made to be exact in flagging any particular interval, so an uncertainty of +/- 12 intervals, or two hours, is reasonable for these exclusions. The operating time in winds above 10.3, 15 and 15.3 m/s have been deliberately underestimated in the monthly statistics in Table 2 but are within 3 intervals, or 0.5 hour, for the test overall.
For the hours of power production above 10.3 and 15.3 m/s, the uncertainty in the wind speed is assumed to be the dominant factor. The uncertainty in wind speed at 15 m/s (see Power Performance report for calculations) is 0.4 m/s, so the minimum wind speed to ensure all data is above the required thresholds are 10.7 and 15.7 m/s, and 15 m/s rises to a maximum of 15.4 m/s. Using these new values the hours of power production reduce to 374.7 (above 10.7 m/s) and 18.2 (above 15.8 m/s); the latter is below 25 hours but the total operation over 15.4 m/s is 25.2 hrs.
Operational Time Fraction Any 10-minute data set with a fault results in the entire 10 minute period counted as non‐operational time (TN). This results in an overestimate of TN and a lower Operational Time Fraction. Thus, the reported Operational Time Fraction of 99.7% represents the lower bound, which meets the minimum requirement of 90%.
Environmental and Sensors The wind speed uncertainty is 3%, using the same methods and numbers as for the power performance report on the Pika T701.
The turbulence intensity calculation is based on measurements of wind speed and the standard deviation of wind speed. If both have similar uncertainties, the overall uncertainty is the product of the two, or 9%.
The power transducer tested out of calibration at the end of the test. The error between measured and expected output is 1.76% or less: see Figures A12-16.
8. Deviations and Exceptions
Deviations from the Standard Sustained wind speeds did not reach 20 m/s, and therefore no observations of dynamic behavior at 20 m/s were made.
The total operational hours over 1.8Vave = 15.3 m/s is less than 25 if an uncertainty of 3% is used for the measured 10-minute average wind speed. However, the total operating hours over 15 m/s is met in worst case.
27
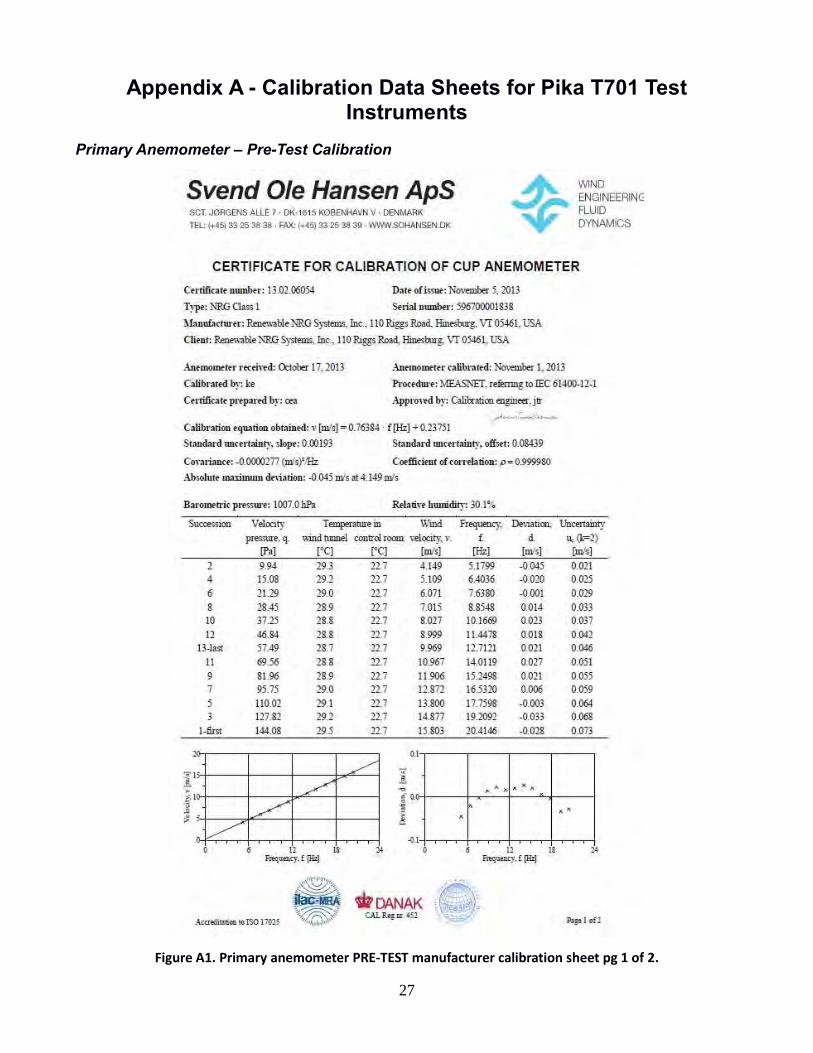
Appendix A - Calibration Data Sheets for Pika T701 Test Instruments
Figure A12. Power transducer manufacturer PRE-test calibration sheet pg 1 of 3.
39
Figure A13. Power transducer manufacturer PRE-test calibration sheet pg 2 of 3.
40
Figure A14. Power transducer manufacturer PRE-test calibration sheet pg 3 of 3.
41
Figure A15. Power transducer manufacturer POST-test calibration sheet showing out of cal. Pg 1 of 2
42
Figure A16. Power transducer manufacturer POST-test calibration sheet showing out of cal. Pg 2 of 2
43
DAS Modules
Figure A17. Voltage module (for temperature & pressure), manufacturer calibration certificate pg 1 of 1.
44
Figure A18. Current module (for power transducer) manufacturer calibration certificate pg 1 of 1.
45
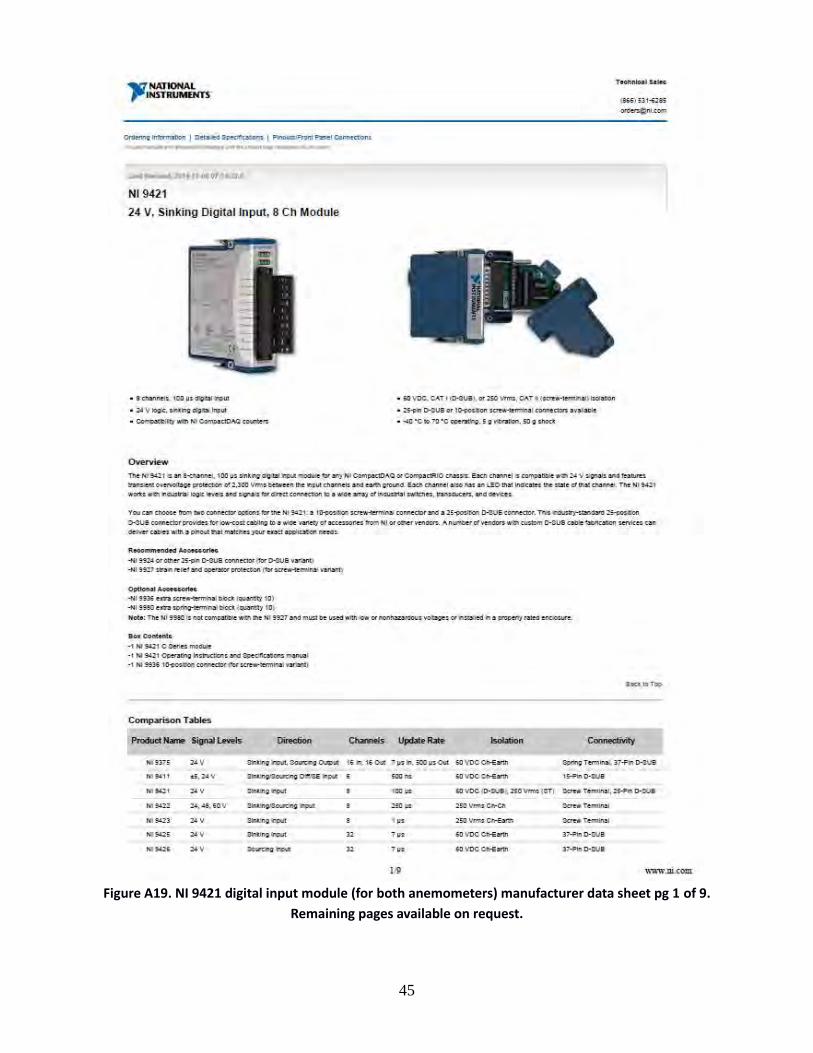
Figure A19. NI 9421 digital input module (for both anemometers) manufacturer data sheet pg 1 of 9.
Remaining pages available on request.
46
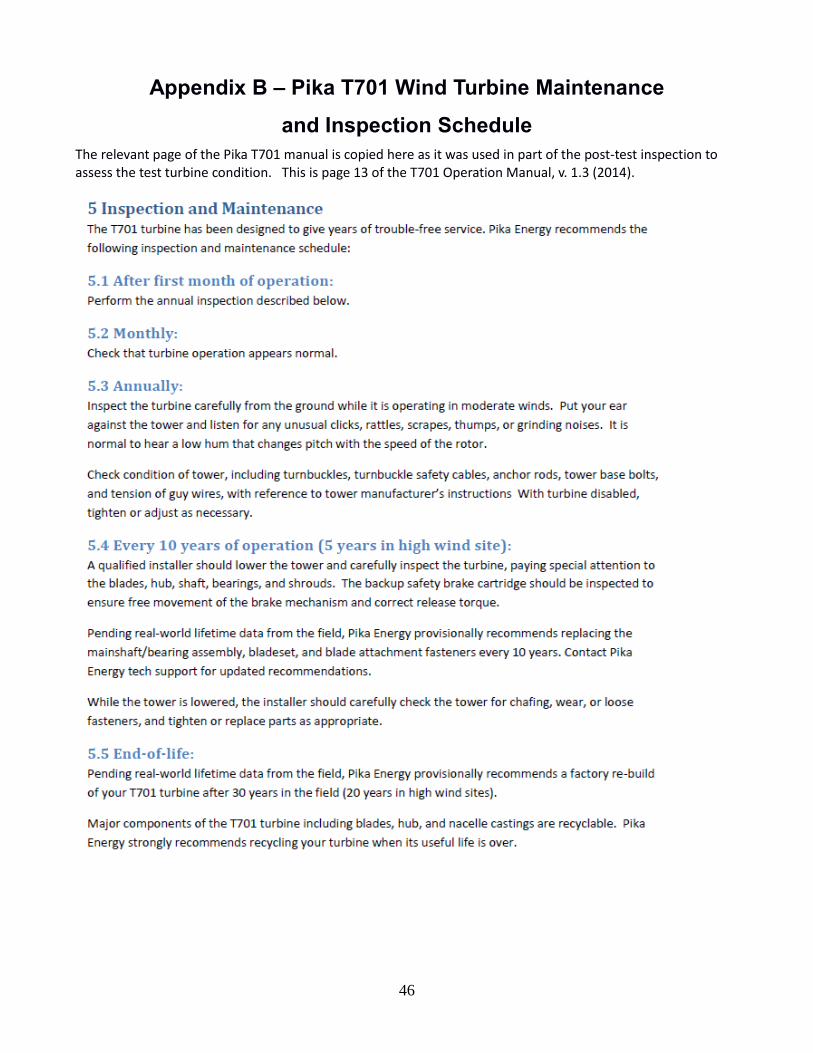
Appendix B – Pika T701 Wind Turbine Maintenance
and Inspection Schedule The relevant page of the Pika T701 manual is copied here as it was used in part of the post-test inspection to assess the test turbine condition. This is page 13 of the T701 Operation Manual, v. 1.3 (2014).