1 Wind Turbine Generator System Power Performance Test Report for the Bergey Excel-S/60 Wind Turbine with SH3052 Airfoil Blades in Golden, Colorado by National Wind Technology Center National Renewable Energy Laboratory 1617 Cole Boulevard Golden, Colorado 80401 Jeroen van Dam, Mark Meadors February 2003 April 2003 NREL/EL-500-33452 Wind Turbine Generator System Power Performance Test Report for the Bergey Excel-S/60 Wind Turbine with SH3052 Airfoil Blades Page 1 of 44
Transcript
1
Wind Turbine Generator System
Power Performance Test Report for the
Bergey Excel-S/60 Wind Turbine
with SH3052 Airfoil Blades in
Golden, Colorado
by
National Wind Technology Center National Renewable Energy Laboratory
1617 Cole Boulevard Golden, Colorado 80401
Jeroen van Dam, Mark Meadors
February 2003
April 2003 NREL/EL-500-33452
Wind Turbine Generator System Power Performance Test Report for the Bergey Excel-S/60 Wind Turbine with SH3052 Airfoil Blades Page 1 of 44
2
1.0 Table of Contents 1.0 TABLE OF CONTENTS ................................................................................................................... 2
2.0 TABLE OF TABLES.......................................................................................................................... 3
3.0 TABLE OF FIGURES........................................................................................................................ 3
7.1 Exceptions to Standard.................................................................................................................... 14
7.2 Exceptions to the Test Plan............................................................................................................. 14
APPENDIX A: PICTURES OF TEST SITE........................................................................................ 15
APPENDIX B: TEST PLAN.................................................................................................................. 19
Wind Turbine Generator System Power Performance Test Report for the Bergey Excel-S/60 Wind Turbine with SH3052 Airfoil Blades Page 2 of 44
3
2.0 Table of Tables Table 1. Performance at Sea Level Air Density, 1.225 kg/m3.................................................................... 7
Table 2. Performance at Site Average Density, 1.000 kg/m3 ..................................................................... 8
Table 3. Annual Energy Production at Sea Level Density, 1.225 kg/m3.................................................... 9
Table 4. Annual Energy Production at Site Average Density, 1.000 kg/m3 ............................................... 9
3.0 Table of Figures Figure 1. Power curve summary. ................................................................................................................ 5
Figure 2. Power curve at sea level density, 1.225 kg/m3. ......................................................................... 10
Figure 3. Coefficient of performance at sea level density, 1.225 kg/m3................................................... 11
Figure 4. Power curve at site average density, 1.000 kg/m3. .................................................................... 11
Figure 5. Scatter plot of power data.......................................................................................................... 12
Figure 6. Wind turbulence at the test site as a function of wind speed. ................................................... 12
Figure 7. Wind turbulence at the test site as a function of wind direction. .............................................. 13
Figure 8. Binned inverter efficiency as a function of the power produced by the wind turbine. ............. 13
Wind Turbine Generator System Power Performance Test Report for the Bergey Excel-S/60 Wind Turbine with SH3052 Airfoil Blades Page 3 of 44
4
4.0 Disclaimer This report was prepared as an account of work sponsored by an agency of the United States government. The test results documented in this report define the characteristics of the test article as configured and under the conditions tested.
Neither the United States government nor any agency thereof, nor any of their employees, makes any warranty, express or implied, or assumes any legal liability or responsibility for the usefulness of any information, apparatus, product, or process disclosed, or represents that its use would not infringe privately owned rights. They also do not assume legal liability or responsibility for the performance of the test article or any similarly named article when tested under other conditions or using different test procedures.
Neither Midwest Research Institute nor the U. S. government shall be liable for special, consequential, or incidental damages. Reference herein to any specific commercial product, process, or service by trade name, trademark, manufacturer, or otherwise does not necessarily constitute or imply its endorsement, recommendation, or favoring by the U.S. government or any agency thereof. The views and opinions of the authors expressed herein do not necessarily state or reflect those of the U.S. government or any agency thereof.
The National Renewable Energy Laboratory (NREL) is a national laboratory of the U. S. Department of Energy (DOE), and as an adjunct of the U. S. government, cannot certify wind turbines. The information in this report is limited to NREL’s knowledge and understanding as of this date.
This report may not be reproduced except in full without written permission from NREL.
5.0 Test Summary This report describes the results of a power performance test on a Bergey Excel-S/60 with a Gridtek-10 Inverter and SH 3052 airfoil blades. The test procedures were similar to those described in the test plan in Appendix B, with the exceptions described in Section 7.2
Figure 1 is a summary of the results of the power performance test. These results are normalized to sea level air density using wind speed correction. Further details of these results are given in Section 6.0 Results. Details on the test method, test site, and the turbine under test can be found in the test plan in Appendix B.
The test turbine was located at Site 1.4 of the National Wind Technology Center (NWTC) near Boulder, Colorado. The test started on March 19, 2002 and ended on April 8, 2002. During this time, 241.8 hours of data with the wind out of the acceptable wind directions (153° to 1°) and with the turbine available were collected. According to the standard, the quantity of data collected meets the requirement. The highest bin filled (with wind speed normalized to sea level density) was the 19.5 m/s bin; it meets the standard’s requirement.
Wind Turbine Generator System Power Performance Test Report for the Bergey Excel-S/60 Wind Turbine with SH3052 Airfoil Blades Page 4 of 44
5
Power Performance Test Bin Wind Bin Number CpBergey Excel\ Gridtek-10 Speed Power Data
(m/s) (kW) PointsSea-Level Density Power Curve 2.01 -0.06 129 -0.41
Wind Turbine Generator System Power Performance Test Report for the Bergey Excel-S/60 Wind Turbine with SH3052 Airfoil Blades Page 5 of 44
6
6.0 Results
6.1 Site Calibration Test No site calibration was performed.
6.2 Tabular Results of Power Performance Test Table 1 and Table 2 show the power performance of the Bergey Excel-S turbine with Gridtek-10 inverter with the wind speed normalized to air densities of sea level and average site conditions during the test. Table 3 and Table 4 indicate annual energy production of the turbine if it were to perform as measured during the test and operate with 100% availability and if the winds were to correspond to the Rayleigh wind speed distribution shown. Table 3 indicates the energy production expected at sea level. Table 4 shows energy production at the test site, assuming the annual average air density is the same as the average air density measured during the test. NREL calculated these production estimates using the method prescribed in the Standard and does not warranty actual performance.
Wind Turbine Generator System Power Performance Test Report for the Bergey Excel-S/60 Wind Turbine with SH3052 Airfoil Blades Page 6 of 44
7
Table 1. Performance at Sea Level Air Density, 1.225 kg/m3
Wind Turbine Generator System Power Performance Test Report for the Bergey Excel-S/60 Wind Turbine with SH3052 Airfoil Blades Page 9 of 44
10
6.3 Graphical Results Figure 2 gives the binned power curve for sea level air density. Figure 3 gives the power coefficient for the same conditions. Figure 4 gives the binned power curve for the site average air density (1.000 kg/m3). Figure 5 gives the scatter plot of the 10-minute statistics of measured inverter power. Figure 6 and Figure 7 give an indication of the wind conditions during the test period. Figure 8 gives a plot of inverter efficiency. The inverter has an efficiency of about 86% over most of the operating range.
Figure 2. Power curve at sea level density, 1.225 kg/m3.
-1
0
1
2
3
4
5
6
7
8
9
0 5 10 15 20 25Hub Height Wind Speed, m/s
Nor
mal
ized
Out
put P
ower
, kW
Wind Turbine Generator System Power Performance Test Report for the Bergey Excel-S/60 Wind Turbine with SH3052 Airfoil Blades Page 10 of 44
11
Figure 3. Coefficient of performance at sea level density, 1.225 kg/m3.
Figure 4. Power curve at site average density, 1.000 kg/m3.
-0.1
-0.05
0
0.05
0.1
0.15
0.2
0.25
0 2 4 6 8 10 12 14 16 18 20
Normalized Wind Speed, m/s
Cp
-1
0
1
2
3
4
5
6
7
8
9
0 5 10 15 20 25Hub Height Wind Speed, m/s
Nor
mal
ized
Out
put P
ower
, kW
Wind Turbine Generator System Power Performance Test Report for the Bergey Excel-S/60 Wind Turbine with SH3052 Airfoil Blades Page 11 of 44
12
Figure 5. Scatter plot of power data.
Figure 6. Wind turbulence at the test site as a function of wind speed.
-2
0
2
4
6
8
10
12
14
16
0 5 10 15 20 25 30Wind speed [m/s]
Pow
er [k
W]
MinMaxStdevMean
0
10
20
30
40
50
60
70
80
90
0 5 10 15 20 25 30
Wind speed [m/s]
Turb
ulen
ce In
tens
ity [%
]
Wind Turbine Generator System Power Performance Test Report for the Bergey Excel-S/60 Wind Turbine with SH3052 Airfoil Blades Page 12 of 44
13
Figure 7. Wind turbulence at the test site as a function of wind direction.
-20
0
20
40
60
80
100
0 2 4 6 8 10 12Wind turbine power [kW]
Inve
rter
effi
cien
cy [%
]
Figure 8. Binned inverter efficiency as a function of the power produced by the wind turbine.
0
10
20
30
40
50
60
70
80
90
135 180 225 270 315 360Wind direction [°]
Turb
ulen
ce In
tens
ity [%
]
Wind Turbine Generator System Power Performance Test Report for the Bergey Excel-S/60 Wind Turbine with SH3052 Airfoil Blades Page 13 of 44
14
7.0 Exceptions
7.1 Exceptions to Standard 1. The power transducer was not tested for compliance with IEC 60688.
2. The current transformers were not tested for compliance with IEC 60044.
3. The terrain does not meet the requirements of the IEC standard for variations within a distance of 4-8L from the test turbine.
7.2 Exceptions to the Test Plan No exceptions were made to the test plan.
Wind Turbine Generator System Power Performance Test Report for the Bergey Excel-S/60 Wind Turbine with SH3052 Airfoil Blades Page 14 of 44
15
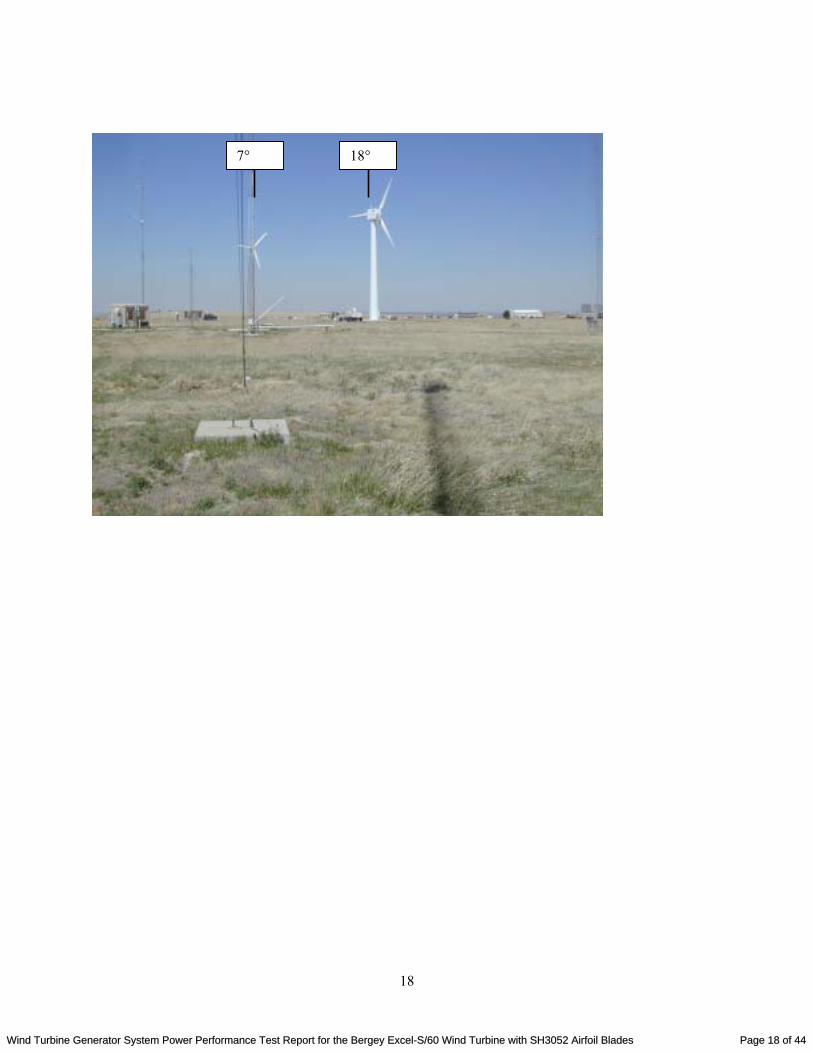
Appendix A: Pictures of Test Site Bearings are magnetic, which are 11° lower than bearings relative to true north.
180°
205° 246°
153°
Wind Turbine Generator System Power Performance Test Report for the Bergey Excel-S/60 Wind Turbine with SH3052 Airfoil Blades Page 15 of 44
16
246°
270°
Wind Turbine Generator System Power Performance Test Report for the Bergey Excel-S/60 Wind Turbine with SH3052 Airfoil Blades Page 16 of 44
17
322° 306°
360° 336°
Wind Turbine Generator System Power Performance Test Report for the Bergey Excel-S/60 Wind Turbine with SH3052 Airfoil Blades Page 17 of 44
18
18° 7°
Wind Turbine Generator System Power Performance Test Report for the Bergey Excel-S/60 Wind Turbine with SH3052 Airfoil Blades Page 18 of 44
19
Appendix B: Test Plan
Wind Turbine Generator System Power Performance Test Report for the Bergey Excel-S/60 Wind Turbine with SH3052 Airfoil Blades Page 19 of 44
1
Wind Turbine Generator System
Power Performance Test Plan for the
Bergey Excel-S/60 Wind Turbine
with SH3052 Airfoil Blades in
Golden, Colorado
Conducted by
National Wind Technology Center National Renewable Energy Laboratory
1617 Cole Boulevard Golden, Colorado 80401
for
Bergey Windpower Company, Inc. 2001 Priestley Avenue
Norman, Oklahoma 73069
Mark Meadors, Jeroen van Dam
December 2002
Wind Turbine Generator System Power Performance Test Report for the Bergey Excel-S/60 Wind Turbine with SH3052 Airfoil Blades Page 20 of 44
2
1 Table of Contents 1 TABLE OF CONTENTS ..................................................................................................................... 2 2 TABLE OF TABLES ........................................................................................................................... 2 3 TABLE OF FIGURES ......................................................................................................................... 2 4 TEST OBJECTIVE.............................................................................................................................. 3 5 BACKGROUND................................................................................................................................... 3 6 TEST TURBINE................................................................................................................................... 3 7 TEST SITE............................................................................................................................................ 5
7.1 GENERAL DESCRIPTION................................................................................................................... 5 7.2 EVALUATION OF OBSTRUCTIONS..................................................................................................... 7 7.3 EVALUATION OF TERRAIN ............................................................................................................... 8
8 POWER PERFORMANCE TEST ..................................................................................................... 9 8.1 DESCRIPTION OF TEST EQUIPMENT ................................................................................................. 9 8.2 TEST PREPARATIONS ..................................................................................................................... 11 8.3 MEASUREMENT PROCEDURES ....................................................................................................... 12
9 ANALYSIS METHODS..................................................................................................................... 13 10 UNCERTAINTY ................................................................................................................................ 16 11 REPORTING...................................................................................................................................... 17 12 EXCEPTIONS TO STANDARD PRACTICE................................................................................. 17 13 ROLES AND RESPONSIBILITIES................................................................................................. 17 APPENDIX A: INSTRUMENT CALIBRATION SHEETS 18
2 Table of Tables Table 1. Test Turbine Configuration and Operational Data ............................................................ 5 Table 2. Obstructions Close to the Bergey Excel Test Turbine ...................................................... 8 Table 3. Criteria for Acceptance of Test Site without Site Calibration Testing.............................. 8 Table 4. Equipment List for Power Performance Tests................................................................... 9 Table 5. Uncertainty in Power Performance Measurements ......................................................... 16 Table 6. Roles of Test Participants................................................................................................ 17
3 Table of Figures Figure 1. The Bergey Excel wind turbine ....................................................................................... 4 Figure 2. View of test turbine toward the prevailing wind direction (292°) ................................... 6 Figure 3. Plot plan of the test site .................................................................................................... 7 Figure 4. Layout of instrumentation for power performance tests ................................................ 10 Figure 5. Detail of instrument locations and mounting booms on the meteo tower...................... 11
Wind Turbine Generator System Power Performance Test Report for the Bergey Excel-S/60 Wind Turbine with SH3052 Airfoil Blades Page 21 of 44
3
4 Test Objective The objective of this test is to obtain the power performance characteristics of the Bergey Excel-S wind turbine for participation in the U.S. Department of Energy/Golden Field Office (DOE/GO) Field Verification Program. The power performance characteristics will be measured in accordance with the International Electrotechnical Commission’s (IEC’s) standard, Wind Turbine Generator Systems Part 12: Power Performance Measurement Techniques, IEC 61400-12 Ed.1.0, 1998. Hereafter this document is referred to as the Standard or the IEC standard.
5 Background This test is being conducted as part of the DOE’s Small Wind Turbine Field Verification Program. The primary purpose of this program is to provide consumers, manufacturers, and host site organizations with an independent assessment of the performance and reliability of small wind turbines manufactured in the United States. As part of the DOE/GO Field Verification Program, each turbine must pass a suite of IEC tests, including duration, system safety and function, power performance, and noise tests. The Bergey Excel test turbine, located at the National Wind Technology Center (NWTC), is owned by AWS Scientific, Inc. This turbine was erected at the NWTC in October 1999 and tested to determine power performance characteristics. In March 2002, the original blades were replaced with a new set of blades, and this second test was conducted.
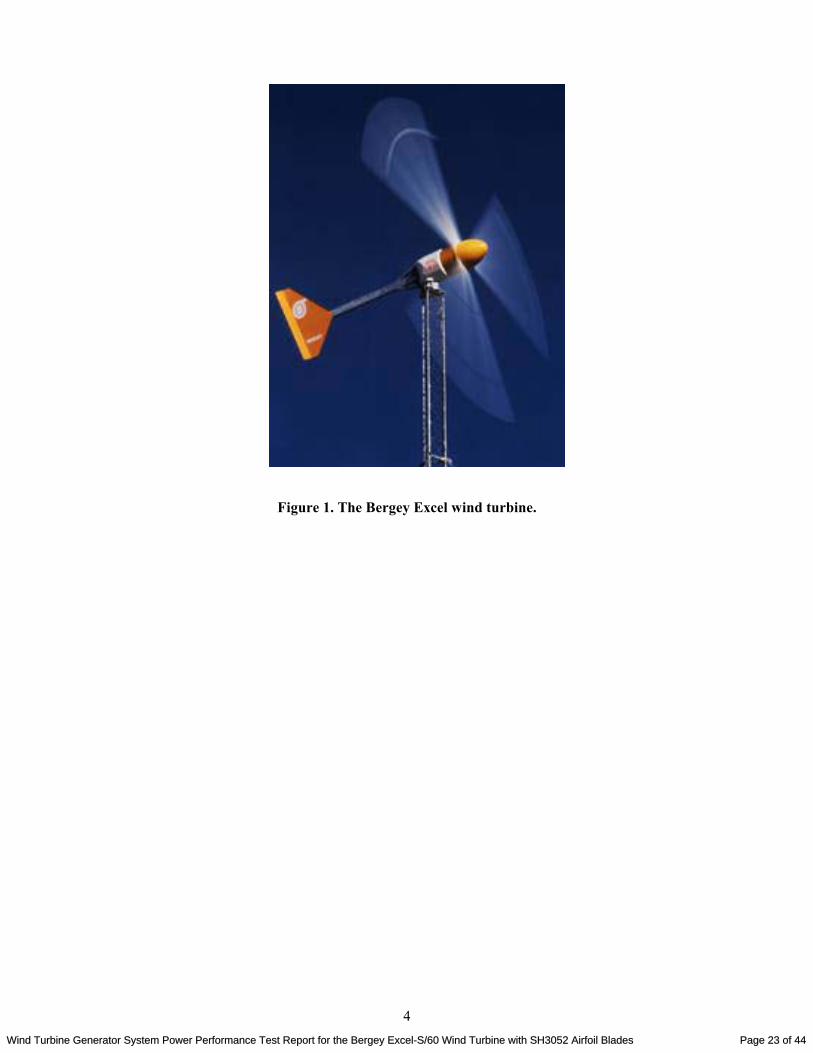
6 Test Turbine The Bergey Excel is a three-bladed upwind wind turbine rated at a 10-kW output at 13.0 m/s. It is connected to a Bergey Gridtek-10 inverter, which provides power to the NWTC public service electrical grid. The Excel uses a permanent magnet alternator to produce three-phase variable frequency output at a nominal 240 volts. The three-phase output is then rectified to DC power and converted to single-phase, 240-volt, 60-Hz AC power in the Gridtek inverter. As with the original set, the modified turbine blades are made from pultruded fiberglass. The configuration of the blades was changed, however. They are 41.5 cm shorter and use the SH3052 airfoil—changes that were intended to improve performance and decrease noise. In high wind speeds (greater than about 15.6 m/s), the turbine will turn out of the wind (known as furling) to protect the turbine from over-speeding. Table 1 lists basic turbine configuration and operational data.
Wind Turbine Generator System Power Performance Test Report for the Bergey Excel-S/60 Wind Turbine with SH3052 Airfoil Blades Page 22 of 44
4
Figure 1. The Bergey Excel wind turbine.
Wind Turbine Generator System Power Performance Test Report for the Bergey Excel-S/60 Wind Turbine with SH3052 Airfoil Blades Page 23 of 44
5
Table 1. Test Turbine Configuration and Operational Data
General Configuration:
Make, Model, Serial Number Bergey WindPower, Excel, #9900550
Rotation Axis (H/V) Horizontal
Orientation (upwind/downwind) Upwind
Number of Blades 3
Rotor Hub Type Rigid
Rotor Diameter (m) 6.17
Hub Height (m) 37
Performance:
Rated Electrical Power (kW) 10
Rated Wind Speed (m/s) 13.0
Cut-In Wind Speed (m/s) 3.1
Cut-Out Wind Speed (m/s) none
Rotor:
Swept Area (m2) 29.9
Direction of Rotation Counterclockwise
Rotor Speed (rpm) 0-400
Power Regulation (active or passive) Passive
Tower:
Type Bergey Guyed Lattice
Height (m) 36.6
Control/Electrical System:
Controller: Make, Type Bergey Gridtek Inverter
Electrical Output Voltage Nominal 240-Volt Single Phase
Yaw System:
Wind Direction Sensor Tail Vane
7 Test Site
7.1 General Description The Bergey Excel wind turbine under test is located at Test Site 1.4 of the NWTC (hereafter referred to as the test site), approximately 8 km south of Boulder, Colorado. The site is located in somewhat complex terrain at an approximate elevation of 1850 m above sea level. Figure 2 shows
Wind Turbine Generator System Power Performance Test Report for the Bergey Excel-S/60 Wind Turbine with SH3052 Airfoil Blades Page 24 of 44
6
a picture of the turbine toward the prevailing wind direction 292°. Figure 3 shows a plot plan of the test site with topography lines listed in feet above sea level. The meteorological tower is located 22.7 m from the test turbine at an azimuth of 292 degrees true. The distance is about three rotor diameters from the turbine.
Figure 2. View of test turbine toward the prevailing wind direction (292°).
Wind Turbine Generator System Power Performance Test Report for the Bergey Excel-S/60 Wind Turbine with SH3052 Airfoil Blades Page 25 of 44
7
6110
6110
6090
6100
6100
6090
6100
6090
60906100
6100
6110
HV6108 .27
929
6100
6090
6100
6090
6090
6090
6080
60806090
6070
6080
6070
6090
6090
6090
6080
6090
6080
6080
NEW WEST MET.TOWER M-2 80 METER (262.5 FEET)
X=11457.43Y=43723.81
4
6090
6080
6080
6080
6070
6090(ADD ALT. #2)
SITE 1.3
X=12022.83(ADD ALT. #3)
X=12101.49Y=43909.62
SITE 1.4
Y=43714.9
6070
X=12191.65Y=44132.05
SITE 1.1
Y=44354.57X=12281.55
SITE 1.2
6090
6080
6080
6070
6060
200 300
X=11939.93Y=43519.57
200100100 0
N
Test Site
Figure 3. Plot plan of the test site.
7.2 Evaluation of Obstructions The IEC standard uses the expression “measurement sector” to define wind directions that can be used for power performance measurements. The National Renewable Energy Laboratory (NREL) defines a “preliminary measurement sector” as part of the site assessment procedure. Using data obtained during site calibration or the power performance test, NREL may change the measurement sector to avoid wind directions in which terrain or obstacles affect the wind. The first step in defining the measurement sector is to consider historic wind data, if available. Experience at the NWTC has shown that the prevailing wind direction is 292° for winds above 4 m/s. These winds usually come during the “wind season,” which normally lasts from November to April. Next we analyze the site to estimate the wakes from obstructions. The preliminary measurement sector should avoid wake effects on the turbine and the meteorological tower. This includes the
Wind Turbine Generator System Power Performance Test Report for the Bergey Excel-S/60 Wind Turbine with SH3052 Airfoil Blades Page 26 of 44
8
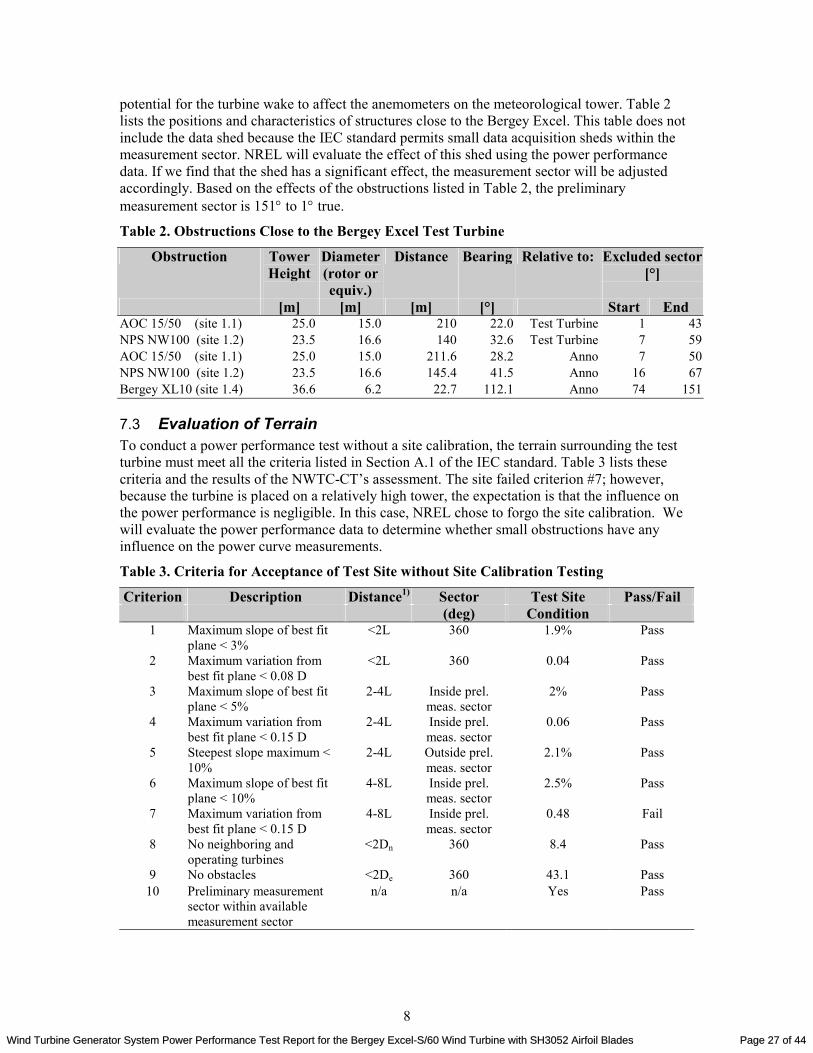
potential for the turbine wake to affect the anemometers on the meteorological tower. Table 2 lists the positions and characteristics of structures close to the Bergey Excel. This table does not include the data shed because the IEC standard permits small data acquisition sheds within the measurement sector. NREL will evaluate the effect of this shed using the power performance data. If we find that the shed has a significant effect, the measurement sector will be adjusted accordingly. Based on the effects of the obstructions listed in Table 2, the preliminary measurement sector is 151° to 1° true.
Table 2. Obstructions Close to the Bergey Excel Test Turbine
7.3 Evaluation of Terrain To conduct a power performance test without a site calibration, the terrain surrounding the test turbine must meet all the criteria listed in Section A.1 of the IEC standard. Table 3 lists these criteria and the results of the NWTC-CT’s assessment. The site failed criterion #7; however, because the turbine is placed on a relatively high tower, the expectation is that the influence on the power performance is negligible. In this case, NREL chose to forgo the site calibration. We will evaluate the power performance data to determine whether small obstructions have any influence on the power curve measurements.
Table 3. Criteria for Acceptance of Test Site without Site Calibration Testing
Criterion Description Distance1) Sector Test Site Pass/Fail (deg) Condition
1 Maximum slope of best fit plane < 3%
<2L 360 1.9% Pass
2 Maximum variation from best fit plane < 0.08 D
<2L 360 0.04 Pass
3 Maximum slope of best fit plane < 5%
2-4L Inside prel. meas. sector
2% Pass
4 Maximum variation from best fit plane < 0.15 D
2-4L Inside prel. meas. sector
0.06 Pass
5 Steepest slope maximum < 10%
2-4L Outside prel. meas. sector
2.1% Pass
6 Maximum slope of best fit plane < 10%
4-8L Inside prel. meas. sector
2.5% Pass
7 Maximum variation from best fit plane < 0.15 D
4-8L Inside prel. meas. sector
0.48 Fail
8 No neighboring and operating turbines
<2Dn 360 8.4 Pass
9 No obstacles <2De 360 43.1 Pass 10 Preliminary measurement
sector within available measurement sector
n/a n/a Yes Pass
Wind Turbine Generator System Power Performance Test Report for the Bergey Excel-S/60 Wind Turbine with SH3052 Airfoil Blades Page 27 of 44
9
1) L is the distance between the turbine and the meteorological tower, Dn is the rotor diameter of a neighboring turbine, and De is the equivalent rotor diameter of obstacles.
8 Power Performance Test
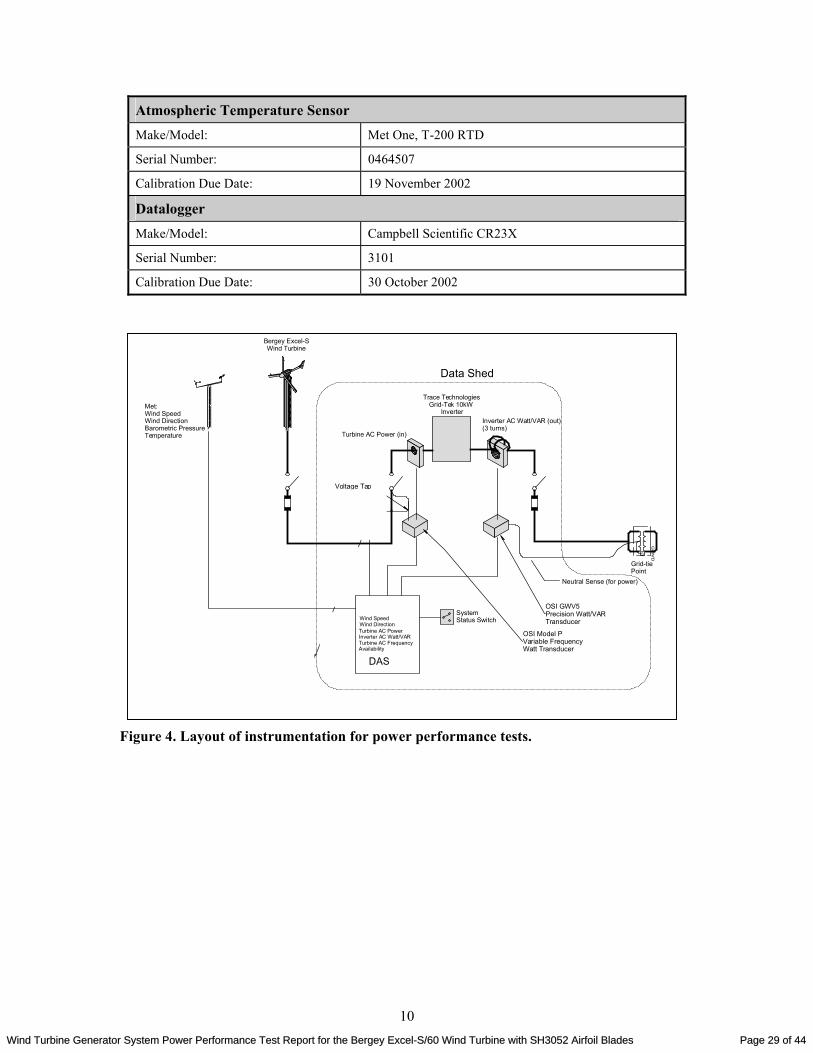
8.1 Description of Test Equipment Table 4 is an equipment list that provides the requirements and specifications for each of the instruments used for performance testing. Figure 4 shows the overall locations of the instrumentation. Figure 5 shows the location of instruments at the top of the meteorological tower.
Table 4. Equipment List for Power Performance Tests
Power Transducer and CTs (Inverter Power)
Make/Model: OSI, GWV5-001EY24 CT pn 12975
Serial Number (Transducer & CTs): 9101376
Range with CTs: -13.33 to 13.33 kW/kVar
Calibration Due Date: 15 November 2002
Power Transducer and CTs (WT Watts)
Make/Model: OSI, P-143E
Serial Number (Transducer & CTs): 9100896
Range with CTs: 0 to 40 kW
Calibration Due Date: 15 November 2002
Primary Anemometer
Make/Model: Met One, 010C with Aluminum Cups
Serial Number: T2345
Calibration Due Date: 21 February 2003
Secondary Anemometer
Make/Model: Met One, 010C with Aluminum Cups
Serial Number: U2645
Calibration Due Date: 21 February 2003
Wind Direction Sensor
Make/Model: Met One, 020C with Aluminum Vane
Serial Number: T1010
Calibration Due Date: 21 February 2003
Barometric Pressure Sensor
Make/Model: Vaisala, PTB101B
Serial Number: S2830007
Calibration Due Date: 16 November 2002
Wind Turbine Generator System Power Performance Test Report for the Bergey Excel-S/60 Wind Turbine with SH3052 Airfoil Blades Page 28 of 44
10
Atmospheric Temperature Sensor
Make/Model: Met One, T-200 RTD
Serial Number: 0464507
Calibration Due Date: 19 November 2002
Datalogger
Make/Model: Campbell Scientific CR23X
Serial Number: 3101
Calibration Due Date: 30 October 2002
Figure 4. Layout of instrumentation for power performance tests.
GR
N'D
G
Trace TechnologiesGrid-Tek 10kW
Inverter
DAS
Met:Wind SpeedWind DirectionBarometric PressureTemperature Turbine AC Power (in)
Inverter AC Watt/VAR (out)(3 turns)
System Status Switch
Grid-tie Point
Neutral Sense (for power)
Voltage Tap(for power and
frequency)
Bergey Excel-SWind Turbine
OSI Model PVariable FrequencyWatt Transducer
OSI GWV5Precision Watt/VARTransducer
Frequency to Voltage Converter
Wind SpeedWind Direction
Data Shed
Turbine AC PowerInverter AC Watt/VAR Turbine AC FrequencyAvailability
Wind Turbine Generator System Power Performance Test Report for the Bergey Excel-S/60 Wind Turbine with SH3052 Airfoil Blades Page 29 of 44
11
Figure 5. Detail of instrument locations and mounting booms on the meteo tower. In addition to the instruments listed in Table 4, the performance test requires a signal to determine turbine operational status. For the Bergey Excel with Gridtek inverter, the logbook will be checked on manual resets of inverter faults. The logbook will also be checked for further information on turbine availability (DAS or turbine maintenance). If the grid goes down, power to the power transducer is lost and the power signal is invalid; in this way, those data points will be sorted out automatically.
8.2 Test Preparations In preparation for the test, the test technician will: • install and check all instrumentation for the power performance test using procedures defined
in this section of the test plan • perform a series of “in-field” checks on each of the instruments • leave the datalogger in “logging” mode to collect a short, 6-12 hour, data set. This data set
will be checked to identify any problems that might not be apparent in the in-field checks.
Wind Turbine Generator System Power Performance Test Report for the Bergey Excel-S/60 Wind Turbine with SH3052 Airfoil Blades Page 30 of 44
12
• perform a third check if a data acquisition system is available that can provide comparable signals to those monitored by the NREL system. In this check, data sets are compared to identify any unexplainable differences in any of the comparable signals.
In parallel with instrumentation checkouts, the turbine owner will: • complete final modifications to the test turbine and test site, if any • notify NREL in writing that the turbine and test site configurations are fixed • provide NREL with updated information on the final test configuration of the turbine and the
test site. After all instrumentation checks are complete, and upon receipt of verification that the turbine and test site configurations are fixed, NREL will change the site identification code on the datalogger to signify the beginning of testing. NREL will also inform the NWTC management that the test has begun.
8.3 Measurement Procedures Measurements during the power performance test will be obtained automatically by the Campbell datalogger at a sample rate of 1 Hz. At the end of each 10-minute period, as indicated on the datalogger’s clock, it records the averages of these data with their standard deviations and minimum and maximum values for the ten minutes. It also records the percentage of time that the turbine or system is not available. Finally, the logger records the number of samples in each record. If the datalogger is interrupted by a program change, its first or last record will contain less than 10 minutes. The IEC standard does not allow use of such records. On a weekly basis, NREL will transfer data from the datalogger to computers at NREL offices. Also on a weekly basis, NREL personnel will check instruments located on the meteorological tower from ground level. They will note whether there are any obvious failures such as broken or missing cups from the anemometers; bent, broken, or missing wind vane; or misalignment of any sensors. They will also note whether 120 VAC power is being provided to the datalogger. NREL personnel will also record any unusual occurrences with the turbine or instrumentation in the appropriate logbook inside the turbine control shed. NREL will analyze the data sets once per week. Using the procedures described in the next section, the test engineer will note whether any problems have arisen. The test will be considered as suspended pending resolution of the problem. The test engineer will determine whether data obtained during the period when the problem was active can be used in the determination of power performance and note whether data are used in the test report. If the test site or turbine changes during the test, the test engineer will determine whether it is appropriate to continue the test, restart the test, or cancel the test. All actions will be documented in the test report. NREL will monitor the quantity of data obtained during testing and will report on test progress to NREL management on a weekly basis. The power curve must be well defined over a range of wind speeds specified by the IEC standard. In this test, the low end of the range is 2.1 m/s, which is 1 m/s below the Bergey Excel’s cut-in wind speed. The high end of the range is 20 m/s, which is 1.5 times the wind speed at which the turbine produces 85% of its rated power. The test will continue until 180 hours of usable data have been obtained in the specified wind speed range and when each 0.5 m/s wind bin in this
Wind Turbine Generator System Power Performance Test Report for the Bergey Excel-S/60 Wind Turbine with SH3052 Airfoil Blades Page 31 of 44
13
range contains at least 30 minutes of data. Once sufficient data are obtained to fulfill these requirements, the NREL test engineer will inform NREL management that the test is complete.
9 Analysis Methods NREL analyzes power performance data in two steps. First we determine which of the data are usable. Then we process the usable data to obtain power curves and to estimate annual energy production and uncertainty. In the first step, the analyst enters the data into a spreadsheet in which time series plots are used to review the various instrument readings. The data acquisition system has failed if: 1) voltage of the datalogger’s power supply is below 11 volts DC 2) temperature at the datalogger is less than -40oC or greater than 80oC 3) the record contains less than 600 samples 4) any channel is over range as indicated by a record of –99999. Other checks are made to ensure to the greatest extent practical that all signals are valid. Also, the analyst tags as unusable any data obtained when the logbook indicates that the turbine or external conditions prevented normal operation. Occasionally such periods are noted in the logbook but not recorded by the datalogger. Any data that are found to be unusable are filtered from the data set. The usable data are then entered into a second spreadsheet with custom macros for processing. These macros apply additional filters in accordance with the IEC standard. The IEC standard requires that all data be used unless the following conditions are present:
• The wind turbine is unavailable • The test equipment fails • The wind direction is outside of the valid measurement sector.
NREL defines unavailable as:
• The turbine is faulted (the inverter is waiting for a manual reset) • The turbine is not in automatic run mode (i.e. the turbine has manually been furled) • The utility grid is not available (utility power is not within specifications).
Once the above criteria have been applied, the remaining data from the primary test data set and the resulting power performance from this set are analyzed and reported. The macros perform the following calculations on that data set:
1. When site calibration data are available, Equation 1 is used to adjust the average wind speeds measured on the meteorological tower (MET) to calculate turbine wind speeds according to the site calibration results. If no site calibration test was performed, then the ΓSite = 1.0.
METSiteTurb VV ⋅Γ= Equation 1
where: VTurb = wind speed at turbine (m/s) ΓSite = site calibration factor VMET = wind speed at MET (m/s)
2. If the pressure sensor is more then 10 meters below hub height, then for each data point the measured pressure is corrected to hub height by Equation 2 (from ISO 2533).
Wind Turbine Generator System Power Performance Test Report for the Bergey Excel-S/60 Wind Turbine with SH3052 Airfoil Blades Page 32 of 44
14
( )R
g
bb
b
n
HHT
pp⋅
−
−⋅+⋅=
ββ1 Equation 2
where: p = pressure at hub height (Pa) pb = measured pressure (Pa) β = temperature gradient (-6.5 K/m) Tb = measured temperature (K) H = hub height above ground (m) Hb = pressure transducer height above ground (m) gn = acceleration of gravity (9.807 m/s2) R = specific gas constant (287.053 m/Ks2)
3. For each data point, the average air density is calculated by the Ideal Gas Law (Equation 3):
ρ1010
10min
min
min=
∗B
R T Equation 3
where: ρ10min = derived air density averaged over 10 minutes (kg/m3) T10min = measured absolute air temperature averaged over 10 minutes (K) B10min = measured air pressure averaged over 10 minutes (Pa) R = gas constant for air (287.05 J/kgK)
4. For each data point, the derived site air density is used to calculate the average site air density for the test period, rounded to the nearest 0.05 kg/m3.
5. For small turbines that use furling, NREL has determined that the most appropriate
method to use for normalize the power curve is to adjust wind speed in accordance with Equation 4. In this test, normalization will be performed using monthly averages instead of 10-minute averages of air density:
3/1
0
min10min10
⋅=
ρρVVn Equation 4
where: Vn = normalized wind speed (m/s) V10min = measured wind speed averaged over 10 minutes (m/s) ρ0 = site average air density (kg/m3) ρ10min = measured air density averaged over 10 minutes (kg/m3)
6. Equation 4 is applied a second time with ρo replaced with the standard sea-level air
density (1.225 kg/m3), creating a standard normalized wind speed (Vns) 7. All data are sorted according to normalized wind speeds into bins which are 0.5 m/s
wide, with bin centers at integer multiples of 0.5 m/s. Each power, DC and AC, is averaged for each bin. As a result, two power curves and AEPs are calculated.
8. For each data bin, the following parameters are calculated:
• bin average air temperature (K)
Wind Turbine Generator System Power Performance Test Report for the Bergey Excel-S/60 Wind Turbine with SH3052 Airfoil Blades Page 33 of 44
15
• bin average corrected air pressure (Pa) • bin average measured wind speed (m/s) • bin average standard deviation of wind speed (m/s) • bin average measured power (W) • bin average standard deviation of measured power (W) • bin average site average density normalized power (W) • bin average site average density standard deviation normalized power (W) • bin average sea level density normalized power (W) • bin average sea level density standard deviation normalized power (W) • site average density (kg/m3) • amount of 10-minute data points in bin • bin average uncorrected air pressure (Pa) • bin power coefficient
9. The test power curve is then formed by the resulting average normalized wind speed and
average power (average for site average density, standard for sea-level density) at each bin. For each bin the generator power coefficient is calculated by Equation 5:
CP
AVP ii
i, .
=∗0 5 0
3ρ Equation 5
where: CP,i = generator power coefficient in bin i (non-dimensional) Vi = normalized wind speed in bin i (m/s) Pi = average power in bin i (W) A = swept area of the turbine rotor ρ0 = reference air density (same as used to normalize Vi)
10. The measured power curve is then used to estimate annual energy production (AEP) for a variety of Rayleigh wind speed distributions, where for each case the distributions are specified at turbine hub height and assumed to be constant over the swept area of the rotor. The AEP estimations are made according to Equations 6 and 7:
( ) ( )[ ]AEP N F V F VP P
h i iiN i i= −
+
−
−∑ 11
2 Equation 6
where: AEP = annual energy production (kWh) Nh = number of hours in one year ≈ 8760 hr N = number of bins Vi = normalized and averaged wind speed in bin i Vi-1 = normalized and averaged wind speed in bin i-1 Pi = averaged measured power in bin i Pi-1 = averaged measured power in bin i-1 F(V) = the accumulated Rayleigh distribution, given by:
F V VVave
( ) exp= − −
1
4
2π
Equation 7
where: Vave = annual average wind speed at hub height V = wind speed
Wind Turbine Generator System Power Performance Test Report for the Bergey Excel-S/60 Wind Turbine with SH3052 Airfoil Blades Page 34 of 44
16
11. The summation of Equation 6 is initiated by setting Vi-1 equal to Vi-0.5 m/s, and Pi-1 equal
to 0 kW. The AEP calculations are made for integer values of annual average wind speeds ranging between 4 and 11 m/s.
12. An uncertainty analysis is performed per Annex C of the IEC standard for both the
measured power curve and estimated AEP. AEP is calculated in two ways, one designated AEP-measured and the other AEP-extrapolated. AEP-measured is calculated assuming that power in winds above the highest bin in the power curve is zero. AEP-extrapolated is calculated assuming that power in winds above the highest bin in the power curve is equal to the power in the highest wind bin. If AEP-measured is less than 95% of AEP-calculated, then the table reporting AEP-measured values must indicate “Incomplete.”
10 Uncertainty NREL considers two types of uncertainty in the calculation of overall measurement uncertainty of the power curve. Type A is calculated from the scatter of test data. Type B accounts for uncertainty in calibration, installation, and for instrument accuracy. Table 5 indicates values for known and estimated uncertainty levels for this test. Once the test data are obtained, NREL calculates the Type A uncertainties based on data scatter and combines these with the Type B uncertainties listed to obtain an overall uncertainty.
Table 5. Uncertainty in Power Performance Measurements
Component Uncertainty Source
Power (Inverter)
Power Transducer 6W or 0.12% Specs
Data Acquisition 36 W Specs
Resistor 0.006 % Specs
Wind Speed
Anemometer 0.06 m/s Calibration
Operational Characteristics 1.73% Assumption
Mounting Effects 1.15% Assumption
Terrain Effects 2.00% IEC Recommendation
Data Acquisition 0.00 Estimate
Temperature
Temperature Sensor 0.15 K Instrument Specs
Radiation Shielding 1.15 K Shield Specs
Mounting Effects 0.24 K IEC Method
Linearization 0.12 K Estimate
Wind Turbine Generator System Power Performance Test Report for the Bergey Excel-S/60 Wind Turbine with SH3052 Airfoil Blades Page 35 of 44
17
Data Acquisition 0.03 K Datalogger Specs/ Resistor Specs
Air Pressure
Pressure Sensor 2.0 hPa Specs
Mounting Effects 0.07 hPa IEC Method
Data Acquisition 0.8 hPa Datalogger Specs
11 Reporting When the data collection and analysis are completed, NREL will generate a test report. This report will include the power curves and AEP for the Bergey Excel, as well as detailed explanations of any deviations from this test plan. The report will also examine the uncertainty of the measurements and whether the test passes the minimum requirements of the Standard.
12 Exceptions to Standard Practice Power performance instrumentation deviates from the IEC standard as follows: 1. The power transducer was not tested for compliance with IEC 60688. 2. The current transformers were not tested for compliance with IEC 60044. 3. The terrain does not meet the requirements of the IEC standard for variations within a
distance of 4-8L from the test turbine.
13 Roles and Responsibilities Table 6 lists the planned test team and identifies roles and responsibilities for each team member.
Table 6. Roles of Test Participants
Test Team Title
Name Employer Role(s)
Certification Test Manager
Hal Link NREL Approves NREL test plan
Test Engineer Jeroen van Dam
NREL Manages and is responsible for test Serves as customer contact person Authorizes any deviations from planned test procedures Supervises performance test set-up, checkout, and conduct Periodically reviews test data Identifies problems based on data analysis results Analyzes test data Reports test results Serves as the primary point of contact between NWTC-CT and the test site manager
Test Technician
Mark Meadors
NREL Selects instruments Installs and checks out test equipment Implements corrective actions for problems Downloads and stores test data
Turbine Maintenance Technician
Scott Wilde
NREL Maintains test turbine in accordance with manufacturer’s recommendations Records all maintenance activities or observations in test log
Wind Turbine Generator System Power Performance Test Report for the Bergey Excel-S/60 Wind Turbine with SH3052 Airfoil Blades Page 36 of 44
18
Appendix A: Instrument Calibration Sheets
Wind Turbine Generator System Power Performance Test Report for the Bergey Excel-S/60 Wind Turbine with SH3052 Airfoil Blades Page 37 of 44
19Wind Turbine Generator System Power Performance Test Report for the Bergey Excel-S/60 Wind Turbine with SH3052 Airfoil Blades Page 38 of 44
20Wind Turbine Generator System Power Performance Test Report for the Bergey Excel-S/60 Wind Turbine with SH3052 Airfoil Blades Page 39 of 44
21Wind Turbine Generator System Power Performance Test Report for the Bergey Excel-S/60 Wind Turbine with SH3052 Airfoil Blades Page 40 of 44
22Wind Turbine Generator System Power Performance Test Report for the Bergey Excel-S/60 Wind Turbine with SH3052 Airfoil Blades Page 41 of 44
23Wind Turbine Generator System Power Performance Test Report for the Bergey Excel-S/60 Wind Turbine with SH3052 Airfoil Blades Page 42 of 44
24Wind Turbine Generator System Power Performance Test Report for the Bergey Excel-S/60 Wind Turbine with SH3052 Airfoil Blades Page 43 of 44
25
Wind Turbine Generator System Power Performance Test Report for the Bergey Excel-S/60 Wind Turbine with SH3052 Airfoil Blades Page 44 of 44