59
Technical Report NREL/TP-500-46192 December 2009 Wind Turbine Generator System Power Performance Test Report for the Mariah Windspire 1-kW Wind Turbine A. Huskey, A. Bowen, and D. Jager
Technical Report NREL/TP-500-46192 December 2009
Wind Turbine Generator System Power Performance Test Report for the Mariah Windspire 1-kW Wind Turbine A. Huskey, A. Bowen, and D. Jager
Wind Turbine Generator System Power Performance Test Report
for the Mariah Windspire 1-kW Wind Turbine
Conducted for
National Renewable Energy Laboratory
1617 Cole Blvd. Golden, CO 80401
Conducted by
National Wind Technology Center
National Renewable Energy Laboratory 1617 Cole Boulevard
Golden, Colorado 80401
Arlinda Huskey, Amy Bowen, Dave Jager
10 June 2009

ii
Notice
This report was prepared by the National Renewable Energy Laboratory (NREL), operated for the United States Department of Energy (DOE) by the Alliance for Sustainable Energy, LLC (Alliance), as an account of work sponsored by the United States government. The test results documented in this report define the characteristics of the test article as configured and under the conditions tested.
THIS REPORT IS PROVIDED "AS IS" AND NEITHER THE GOVERNMENT, ALLIANCE, NREL NOR ANY OF THEIR EMPLOYEES, MAKES ANY WARRANTY, EXPRESS OR IMPLIED, INCLUDING THE WARRANTIES OF MERCHANTABILITY AND FITNESS FOR A PARTICULAR PURPOSE, OR ASSUMES ANY LEGAL LIABILITY OR RESPONSIBILITY FOR THE ACCURACY, COMPLETENESS, OR USEFULNESS OF ANY SUCH INFORMATION DISCLOSED IN THE REPORT, OR OF ANY APPARATUS, PRODUCT, OR PROCESS DISCLOSED, OR REPRESENTS THAT ITS USE WOULD NOT INFRINGE PRIVATELY OWNED RIGHTS.
Neither Alliance nor the U. S. Government shall be liable for special, consequential or incidental damages. Reference herein to any specific commercial product, process, or service by trade name, trademark, manufacturer, or otherwise does not necessarily constitute or imply its endorsement, recommendation, or favoring by the United States government or any agency thereof. The views and opinions of the authors expressed herein do not necessarily state or reflect those of the United States government or any agency thereof or Alliance.
NREL is a DOE Laboratory, and as an adjunct of the United States government, cannot certify wind turbines. The information in this report is limited to NREL’s knowledge and understanding as of this date.
NREL is accredited by the American Association for Laboratory Accreditation (A2LA) and the results shown in this test report have been determined in accordance with the NREL’s terms of accreditation unless stated otherwise in the report.
This report shall not be reproduced, except in full, without the written approval of Alliance or successor operator of NREL.
Approval By: __________________________________________________________ Arlinda Huskey, NREL Test Engineer Date
Review By: ___________________________________________________________ Jeroen van Dam, NREL Test Engineer Date
iii
Contents
Contents ............................................................................................................................................................ iii
List of Tables ...................................................................................................................................................... iv
List of Figures ...................................................................................................................................................... v
1. Background ............................................................................................................................................... 1
2. Test Summary ............................................................................................................................................ 1
3. Test Turbine Configuration ......................................................................................................................... 4
4. Test Site Description .................................................................................................................................. 6
5. Description of Test Equipment ................................................................................................................... 8
6. Description of Test Procedure ................................................................................................................... 10
7. Test Results .............................................................................................................................................. 11
7.1. Results of Power Performance Test for the Normal Configuration .............................................................. 11 7.1.1. Tabular Results for Normal Power Production .................................................................................... 11 7.1.2. Graphical Results for Normal Power Production ................................................................................. 15
7.2. Results of Power Performance Test for Optimized Power Production ......................................................... 21 7.2.1. Tabular Results for Optimized Power Production ............................................................................... 21 7.2.2. Graphical Results for Power-Optimized Configuration ........................................................................ 25
8. Deviations and Exceptions ........................................................................................................................ 32
8.1. Deviations from the Standard ...................................................................................................................... 32
8.2. Exceptions to NWTC-CT Quality Assurance System ..................................................................................... 32
A. Appendix – Pictures of the Test Site from the Turbine Base ....................................................................... 33
B. Appendix – Equipment Calibration Sheets ................................................................................................. 38

iv
List of Tables Table 1. Test Turbine Configuration ............................................................................................. 4 Table 2. Structures close to the test turbine ................................................................................. 7 Table 3. Criteria for test site without site calibration ..................................................................... 7 Table 4. Equipment used in the power performance test ............................................................. 8 Table 5. Uncertainty values used in the analysis ........................................................................ 10 Table 6. Performance at Sea-level air density; 1.225 kg/m3 for normal power production .......... 12 Table 7. Performance at site average density; 1.00 kg/m3 for normal power production ............ 13 Table 8. Annual energy production (AEP) at sea-level density; 1.225 kg/m3 for normal power
production ....................................................................................................................... 14 Table 9. Annual energy production at site average density; 1.00 kg/m3 for normal power
production ....................................................................................................................... 14 Table 10. Performance at sea-level air density; 1.225 kg/m3 for optimized power production .... 22 Table 11. Performance at site average density; 0.95 kg/m3 for optimized power production ..... 23 Table 12. Annual energy production (AEP) at sea-level density; 1.225 kg/m3 for optimized power
production ....................................................................................................................... 24 Table 13. Annual energy production at site average density; 0.95 kg/m3 for optimized power
production ....................................................................................................................... 24

v
List of Figures Figure 1. Power curve summary for the normal configuration ...................................................... 2 Figure 2. Power curve summary for the power optimized configuration ....................................... 3 Figure 3. Mariah Power Windspire 1-kW test turbine at the NWTC .............................................. 5 Figure 4. Map of the test site ........................................................................................................ 6 Figure 5. Meteorological tower and instruments ........................................................................... 9 Figure 6. Power curve at sea-level density; 1.225 kg/m3 for normal power production ............... 15 Figure 7. Power curve at site average density; 1.00 kg/m3 for normal power production ........... 16 Figure 8. Scatter plot of mean, standard deviation, minimum, and maximum power data for
normal power production .............................................................................................. 17 Figure 9. Coefficient of power at sea-level density; 1.225 kg/m3 for normal power production ... 18 Figure 10. Wind turbulence intensity as a function of wind speed during for normal power
production .................................................................................................................... 19 Figure 11. Wind speed and turbulence intensity as a function of wind direction during test for
normal power production .............................................................................................. 20 Figure 12. Rotor speed as a function of wind speed (1-minute averages) and binned values for
normal power production .............................................................................................. 21 Figure 13. Power curve at sea-level density; 1.225 kg/m3 for optimized power production ........ 25 Figure 14. Power curve at site average density; 0.95 kg/m3 for optimized power production ..... 26 Figure 15. Scatter plot of mean, standard deviation, minimum, and maximum power data for
optimized power production ......................................................................................... 27 Figure 16. Coefficient of power at sea level density; 1.225 kg/m3 for optimized power
production .................................................................................................................... 28 Figure 17. Wind turbulence intensity as a function of wind speed during the test for optimized
power production .......................................................................................................... 29 Figure 18. Wind speed and turbulence intensity as a function of wind direction during the test for
optimized power production ......................................................................................... 30 Figure 19. Rotor speed as a function of wind speed (1-minute averages) and binned values for
optimized power production ......................................................................................... 31
1
1. Background
This test is being conducted as part of the U.S. Department of Energy’s (DOE) Independent Testing project. This project was established to help reduce the barriers of wind energy expansion by providing independent testing results for small turbines. In total, four turbines are being tested at the National Wind Technology Center (NWTC) as a part of this project. Power performance testing is one of up to 5 tests that may be performed on the turbines, including duration, safety and function, noise, and power quality tests.
2. Test Summary
Figure 1 is a summary of the results of a power performance test that NREL conducted on the Mariah Windspire 1-kW wind turbine. In this test, the Windspire turbine was installed at the NWTC, close to Boulder, Colorado. This test was conducted in accordance with the International Electrotechnical Commission’s (IEC) standard, Wind Turbine Generator Systems Part 12: Power Performance Measurements of Electricity Producing Wind Turbines, IEC 61400-12-1 Ed.1.0, 2005-12. However, because the Windspire is a small turbine as defined by IEC, NREL also followed Annex H that applies to small wind turbines. This test report refers to these procedures as the Standard.
During this test, two configurations were tested on the same turbine. In the first configuration, the turbine inverter was optimized for power production. Data collection was not completed with the last required wind speed bin (14 m/s) not filled. In the second configuration, the turbine inverter was set for normal power production. Again, data collection was not completed with the last wind speed bin (14 m/s) not filled. In both configurations, the inverter experienced failures and the tests were not finished.
In Figure 1, the first summary result, the normal configuration results are shown. Power is normalized to sea-level air density. Additional results are given in Section 7.1. This test was begun on October 7, 2008, and was ended on November 19, 2009. 291.57 hours of valid data were collected during that time. The highest wind speed bin filled was the 13.5 m/s bin. The amount of test data is not sufficient to meet the requirements of the Standard, Annex H.
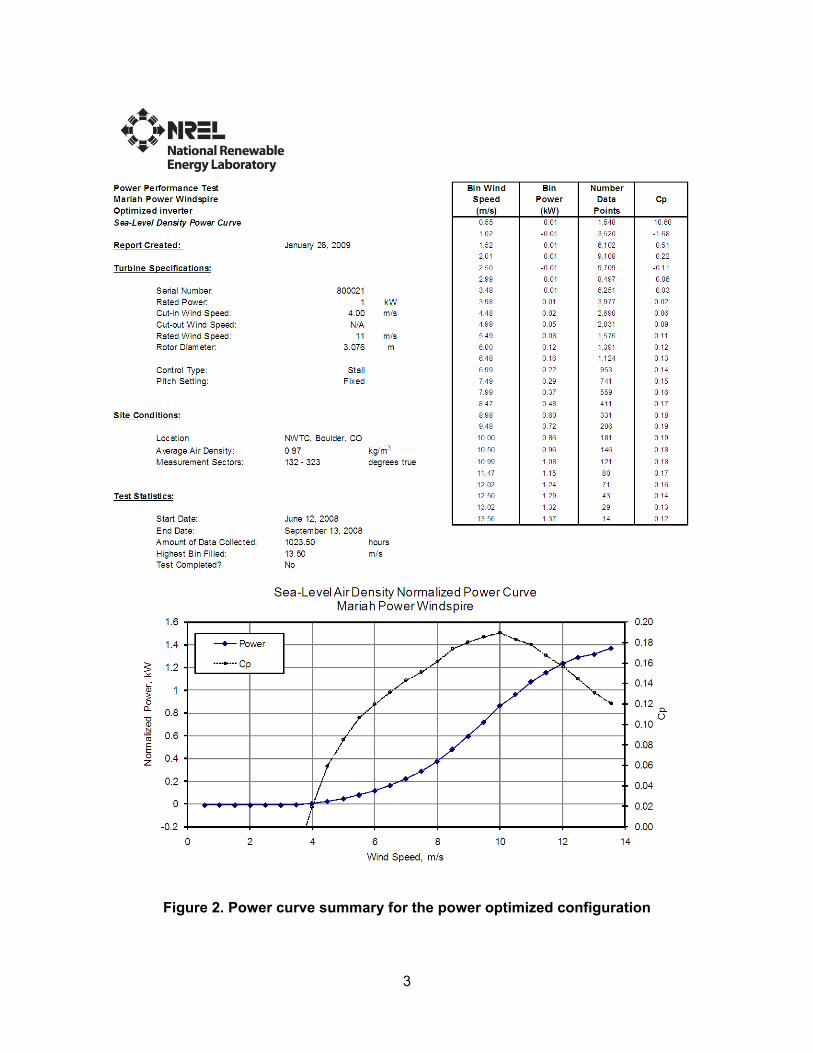
In Figure 2, the second summary result, the optimized power configuration results are shown. is normalized to sea-level air density. Additional results are given in Section 7.2.
This test was begun on June 12, 2008, and was ended on September 13, 2009. 1023.5 hours of valid data were collected during that time. The highest wind speed bin filled was the 13.5 m/s bin. The amount of test data is not sufficient to meet the requirements of the Standard, Annex H.
Power

2
Figure 1. Power curve summary for the normal configuration
Power Performance Test Bin Wind Bin NumberMariah Power Windspire Speed Power Data Cp
(m/s) (kW) PointsSea-Level Density Power Curve 0.54 -0.01 477 -10.70
1.03 -0.01 905 -1.56Report Created: 1.52 -0.01 1,595 -0.48
2.01 -0.01 2,228 -0.21Turbine Specifications: 2.50 -0.01 2,343 -0.11
2.99 -0.01 2,084 -0.06Serial Number: 800021 3.48 0.00 1,335 -0.02Rated Power: 1 kW 3.98 0.01 910 0.02Cut-in Wind Speed: 4.00 m/s 4.50 0.03 670 0.07Cut-out Wind Speed: N/A 4.99 0.05 599 0.10Rated Wind Speed: 11 m/s 5.49 0.09 567 0.11Rotor Diameter: 3.076 m 6.00 0.13 573 0.13
6.50 0.18 510 0.14Control Type: Stall 7.01 0.25 472 0.16Pitch Setting: Fixed 7.49 0.32 409 0.17
7.98 0.41 351 0.188.50 0.52 291 0.19
Site Conditions: 8.99 0.64 307 0.199.49 0.76 253 0.20
Location NWTC, Boulder, CO 9.98 0.88 189 0.19
Average Air Density: 1.00 kg/m3 10.48 0.96 132 0.18
Measurement Sectors: 132 - 323 degrees true 10.99 1.02 114 0.1711.48 1.06 65 0.1511.99 1.09 42 0.14
Test Statistics: 12.49 0.99 38 0.1113.02 0.96 21 0.10
Start Date: 13.47 0.99 14 0.09End Date:Amount of Data Collected: 291.57 hoursHighest Bin Filled: 13.50 m/sTest Completed? No
October 7, 2008November 19, 2008
January 23, 2009
Sea-Level Air Density Normalized Power CurveMariah Power Windspire
-0.2
0
0.2
0.4
0.6
0.8
1
1.2
0 2 4 6 8 10 12 14Wind Speed, m/s
Nor
mal
ized
Pow
er, k
W
0.00
0.05
0.10
0.15
0.20
0.25
Cp
Power
Cp
3
Figure 2. Power curve summary for the power optimized configuration

4
3. Test Turbine Configuration
Table 1 lists the configuration of the Windspire that was tested at the NWTC.
Table 1. Test Turbine Configuration
Turbine make, model, serial number, production year Mariah Power, Windspire, 800021, 2008 Horizontal or vertical axis turbine Vertical Rotor diameter (m) 3.05 Rotor height (m) 6.10 Rotor center height (m) 6.10 Tower type Tubular Rated electrical power (kW) 1 Rated wind speed (m/s) 11.0 Rotor speed range (rpm) 0 – 500 Fixed or variable pitch Fixed Number of blades/airfoils 3 Blade pitch angle (deg) 0 Blade make, type, serial number Mariah Power, Airfoil Description of control system (device & software version)
Windspire 1.2G
The rotor diameter was verified by measurements.

5
Figure 3. Mariah Power Windspire 1-kW test turbine at the NWTC
6
4. Test Site Description
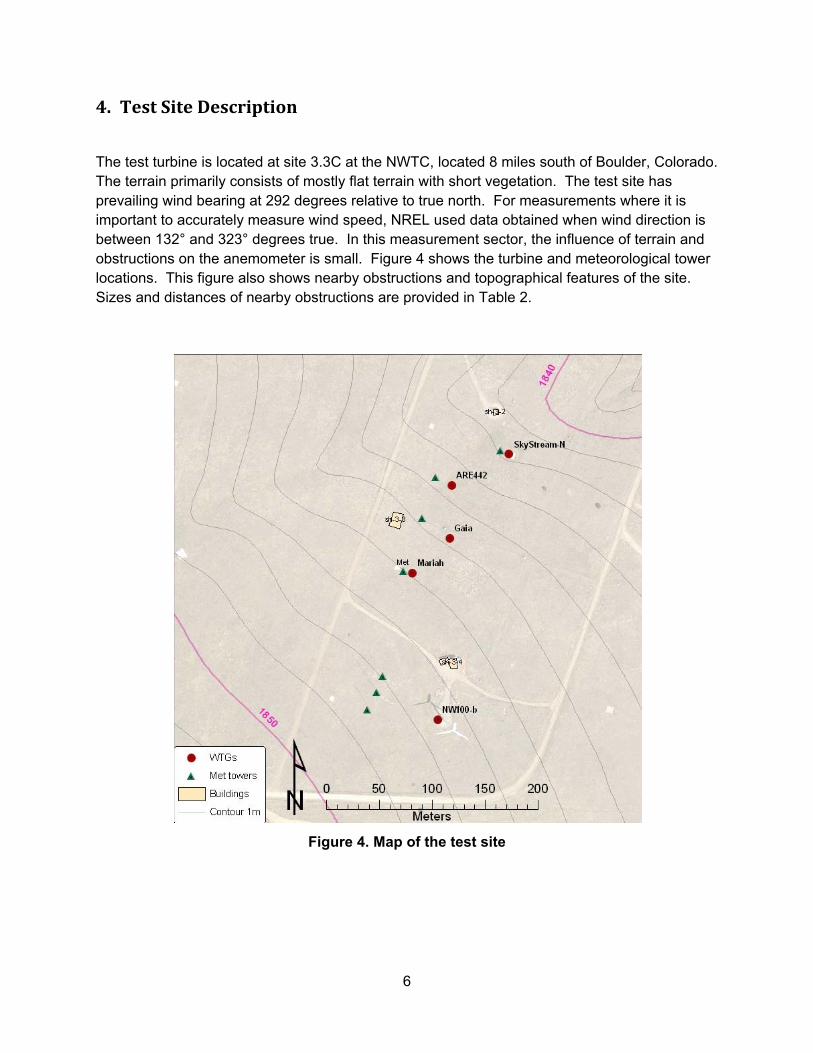
The test turbine is located at site 3.3C at the NWTC, located 8 miles south of Boulder, Colorado. The terrain primarily consists of mostly flat terrain with short vegetation. The test site has prevailing wind bearing at 292 degrees relative to true north. For measurements where it is important to accurately measure wind speed, NREL used data obtained when wind direction is between 132° and 323° degrees true. In this measurement sector, the influence of terrain and obstructions on the anemometer is small. Figure 4 shows the turbine and meteorological tower locations. This figure also shows nearby obstructions and topographical features of the site. Sizes and distances of nearby obstructions are provided in Table 2.
Figure 4. Map of the test site

7
Table 2. Structures close to the test turbine
Designation
Bearing from Test Turbine
(deg. T)
Distance from Test Turbine
(m)
Obstruction Height
(m)
Rotor Diameter or Obstruction
Width (m)
Windspire met
293 7.0 4.6 0.3
Data shed 341 60.0 3.1 7.0 ARE 442 26 303.4 31.0 7.3 ARE 442 met 13 299.3 31.0 0.4 Gaia 47 168.9 18.2 13.0 Gaia met 9 153.3 8.2 0.4
NREL completed a site assessment to determine if the site fails the requirements of Annex A of the Standard and would therefore require a site calibration. Table 3 shows the results from the site assessment. Based on the site assessment results, a site calibration is not required.
Table 3. Criteria for test site without site calibration
Description Distance Sector (deg)
Test Site Condition
Pass/Fail
Maximum slope of best fit plane < 3% <2L 360 2.6% Pass Maximum variation from best fit plane < 0.08 D
<2L 360 0.04 Pass
Maximum slope of best fit plane < 5% 2-4L In 1.7% Pass Maximum variation from best fit plane < 0.15 D
2-4L In 0.04 Pass
Steepest slope maximum < 10% 2-4L Out 3.4% Pass Maximum slope of best fit plane < 10% 4-8L In 2.0% Pass Maximum variation from best fit plane < 0.15 D
4-8L In 0.04 Pass
No neighboring and operating turbines <2Dn 360 0 Pass No obstacles <2De 360 0 Pass
D = test turbine rotor diameter L = distance between test turbine and meteorological tower De = equivalent diameter of obstacle In = inside preliminary measurement sector Out = outside preliminary measurement sector
The Mariah Windspire was connected to the electrical grid at a nominal voltage of 120 VAC at a frequency of 60 Hz. The grid tolerances are 5% for voltage amplitude and 1% for frequency.

8
5. Description of Test Equipment
All test equipment was calibrated and the calibration sheets are included in Appendix B. Table 4 shows the equipment used and calibration due dates. Figure 5 shows placement of the meteorological instruments on the tower. The primary anemometer was sent out for re-calibration after the test period. The difference between the pre-test and post-test calibrations was within the tolerances allowed by the standard.
Table 4. Equipment used in the power performance test
Instrument Make and Model Serial Number Calibration Due Date Power transducer Second Wind, Phaser 5FM-4A20 02061 8 Feb 2009 Voltage transformers Ohio Semitronics, VT7-010E-11 08010700 Calibrated with power
transducer Primary anemometer Thies, First Class 0707894 27 Feb 2009 Reference anemometer
NRG, Max 40 179500049701 179500049703
In situ
Wind vane Met One, 020C with aluminum vane
W5515 27 Feb 2009
Pressure sensor (replaced during test)
Vaisala, PTB101B C1040008 Y3350027
29 Oct 2008 29 Nov 2009
Temperature sensor (replaced during test)
Met One, T200 0673553 0602948
29 Oct 2008 10 Oct 2009
Precipitation sensor Campbell Scientific, 237 None In situ Data acquisition system
Compact DAQ w/LabVIEW cDAQ backplane NI 9229 NI 9217 NI 9205
12E4D23 12B6DD2 12BD192 12E9C3E
28 Jun 2008 06 Jul 2008 08 Oct 2008 Modules post-test calibrated on 6 May 2009 and found in compliance

9
Figure 5. Meteorological tower and instruments
To ensure that only data obtained during normal operation of the turbine are used in the analysis, and to ensure data are not corrupted, data sets are excluded from the database under the following circumstances:
• external conditions other than wind speed are out of the normal range for turbine operation,
• turbine cannot operate because of a turbine fault condition, and, • turbine is manually shut down or in a test or maintenance operating mode.
Two methods are used to track when any of these conditions occur during the test. The first method, the logbook will be checked for such events. The other method is a signal from the turbine that indicates when the turbine is braked.
Pr i mar y Anemomet er
Ref er enceAnemomet er
Wi nd Di r ect i on
Temper at ur e
Pr essur e 1. 3m
3. 3m
4. 3m
6. 2m

10
6. Description of Test Procedure
The test was conducted according to the procedures in the Standard. The sampling rate was 10 kHz, decimated to 40 Hz. The averaging time was 1 minute for the mean values. Standard deviation, minimum, and maximum values for each averaging period were also collected.
The turbine status signal for the Windspire was obtained by checking the release of the brake. The status signal indicated if the turbine was braked or not.
Only database A is reported since the Windspire does not have a cut-out wind speed.
Table 5 gives the uncertainty sources and values used in the analysis.
Table 5. Uncertainty values used in the analysis
Component Uncertainty Source
Power
Current sensor/signal conditioner
6.00 W Specifications (specs)
Power transducer 0.12% Specs
Data acquisition 40.50 W +0.08% Specs
Resistor 0.01% Specs
Wind Speed
Calibration 0.02 m/s Calibration sheet
Operational characteristics 0.05 m/s +0.52% IEC
Mounting effects 1.00% Assumption
Terrain effects 2.00% IEC
Data acquisition < 0.01 m/s Assumption
Temperature
Temperature sensor 0.15 °C Specs
Radiation shielding 1.15 °C Assumption
Mounting effects 0.09 °C IEC method
Data acquisition 0.35 °C Specs
Air Pressure
Pressure sensor 0.20 kPa Instrument specs.
Mounting effects < 0.01 kPa IEC method
Data acquisition 0.06 kPa Specs

11
7. Test Results
Test results are given for two turbine configurations. The first section is for the normal configuration. The second section is for the power optimized configuration.
7.1. Results of Power Performance Test for the Normal Configuration
7.1.1. Tabular Results for Normal Power Production
Table 6 through Table 9 provide the power performance test results for the normal configuration in tabular format. Table 6 shows the binned power performance results at sea-level normalized air density for normal power production. Table 7 shows the binned power performance results for the site average air density at the NWTC for normal power production.

12
Table 6. Performance at Sea-level air density; 1.225 kg/m3 for normal power production
Measured power curve (database A) Reference air density: 1.225 kg/m3 Category A Category B Combined
Bin Wind Normalized Cp Number of Standard Standard Standard Speed Power 1-Minute Uncertainty Uncertainty Uncertainty Output Data Sets
(m/s) (m/s) (kW) (kW) (kW) (kW) 2.5 2.50 -0.01 -0.11 2343 0.00 0.04 0.04 3 2.99 -0.01 -0.06 2084 0.00 0.04 0.04
3.5 3.48 0.00 -0.02 1335 0.00 0.04 0.04 4 3.98 0.01 0.02 910 0.00 0.04 0.04
4.5 4.50 0.03 0.07 670 0.00 0.04 0.04 5 4.99 0.05 0.10 599 0.00 0.04 0.04
5.5 5.49 0.09 0.11 567 0.00 0.04 0.04 6 6.00 0.13 0.13 573 0.00 0.04 0.04
6.5 6.50 0.18 0.14 510 0.00 0.04 0.04 7 7.01 0.25 0.16 472 0.00 0.05 0.05
7.5 7.49 0.32 0.17 409 0.00 0.05 0.05 8 7.98 0.41 0.18 351 0.00 0.05 0.05
8.5 8.50 0.52 0.19 291 0.00 0.06 0.06 9 8.99 0.64 0.19 307 0.00 0.07 0.07
9.5 9.49 0.76 0.20 253 0.00 0.07 0.07 10 9.98 0.88 0.19 189 0.00 0.07 0.07
10.5 10.48 0.96 0.18 132 0.01 0.06 0.06 11 10.99 1.02 0.17 114 0.01 0.05 0.05
11.5 11.48 1.06 0.15 65 0.02 0.05 0.05 12 11.99 1.09 0.14 42 0.03 0.04 0.05
12.5 12.49 0.99 0.11 38 0.03 0.07 0.08 13 13.02 0.96 0.10 21 0.04 0.04 0.06
13.5 13.47 0.99 0.09 14 0.06 0.04 0.07

13
Table 7. Performance at site average density; 1.00 kg/m3 for normal power production
Measured power curve (database A) Reference air density: 1.00 kg/m3 Category A Category B Combined
Bin Wind Normalized Cp Number of Standard Standard Standard Speed Power 1-Minute Uncertainty Uncertainty Uncertainty Output Data Sets
(m/s) (m/s) (kW) (kW) (kW) (kW) 2.5 2.50 -0.01 -0.11 2343 0.00 0.04 0.04 3 2.99 -0.01 -0.06 2084 0.00 0.04 0.04
3.5 3.48 0.00 -0.02 1335 0.00 0.04 0.04 4 3.98 0.01 0.02 910 0.00 0.04 0.04
4.5 4.50 0.02 0.07 670 0.00 0.04 0.04 5 4.99 0.04 0.10 599 0.00 0.04 0.04
5.5 5.49 0.07 0.11 567 0.00 0.04 0.04 6 6.00 0.10 0.13 573 0.00 0.04 0.04
6.5 6.50 0.15 0.14 510 0.00 0.04 0.04 7 7.01 0.20 0.16 472 0.00 0.04 0.04
7.5 7.49 0.26 0.17 409 0.00 0.05 0.05 8 7.98 0.33 0.18 351 0.00 0.05 0.05
8.5 8.50 0.42 0.19 291 0.00 0.05 0.05 9 8.99 0.52 0.19 307 0.00 0.06 0.06
9.5 9.49 0.62 0.20 253 0.00 0.06 0.06 10 9.98 0.72 0.19 189 0.00 0.06 0.06
10.5 10.48 0.78 0.18 132 0.01 0.05 0.05 11 10.99 0.83 0.17 114 0.01 0.05 0.05
11.5 11.48 0.87 0.15 65 0.01 0.05 0.05 12 11.99 0.89 0.14 42 0.02 0.04 0.05
12.5 12.49 0.81 0.11 38 0.02 0.06 0.07 13 13.02 0.78 0.10 21 0.03 0.04 0.05
13.5 13.47 0.80 0.09 14 0.05 0.04 0.06

14
Table 8 shows the annual energy production at sea-level normalized air density for normal power production. Table 9 shows the annual energy production at the site average air density for the NWTC for normal power production. A cut-out wind speed of 25 m/s is assumed for analysis purposes, though the turbine does not have a cut out wind speed.
Table 8. Annual energy production (AEP) at sea-level density; 1.225 kg/m3 for normal power production
Table 9. Annual energy production at site average density; 1.00 kg/m3 for normal power production
Reference air density: 1.225 kg/m 3̂Cut-out wind speed: 25.00 m/s
Hub height annual
average wind speed
(Rayleigh)
AEP-measured AEP-extrapolated
Complete if AEP measured is at least
95% of AEP extrapolated
m/s kWh kWh % kWh4 615 372 61% 617 Complete5 1,354 391 29% 1,383 Complete6 2,120 402 19% 2,283 Incomplete7 2,700 400 15% 3,156 Incomplete8 3,032 385 13% 3,898 Incomplete9 3,152 362 11% 4,459 Incomplete
10 3,126 336 11% 4,827 Incomplete11 3,010 308 10% 5,024 Incomplete
Estimated annual energy production, database A (all valid data)
Standard Uncertainty in AEP-measured
AEP measured assumes zero power between highest bin and cutoutAEP extrapolated assumes power in last bin between last bin and cutout
Reference air density: 1.00 kg/m 3̂Cut-out wind speed: 25.00 m/s
Hub height annual
average wind speed
(Rayleigh)
AEP-measured AEP-extrapolated
Complete if AEP measured is at least
95% of AEP extrapolated
m/s kWh kWh % kWh4 502 367 73% 503 Complete5 1,106 380 34% 1,129 Complete6 1,731 386 22% 1,864 Incomplete7 2,204 381 17% 2,577 Incomplete8 2,475 365 15% 3,182 Incomplete9 2,573 342 13% 3,640 Incomplete
10 2,552 316 12% 3,941 Incomplete11 2,457 290 12% 4,101 Incomplete
Estimated annual energy production, database A (all valid data)
Standard Uncertainty in AEP-measured
AEP measured assumes zero power between highest bin and cutoutAEP extrapolated assumes power in last bin between last bin and cutout

15
7.1.2. Graphical Results for Normal Power Production
Figure 6 through Figure 12 show the results of the power performance test for normal power production in graphical format. Figure 6 shows a plot of the binned power curve normalized to sea level air density for normal power production.
Figure 6. Power curve at sea-level density; 1.225 kg/m3 for normal power production
-0.1
0.0
0.1
0.2
0.3
0.4
0.5
0.6
0.7
0.8
0.9
1.0
1.1
1.2
0 2 4 6 8 10 12 14
Pow
er (k
W),
Nor
mal
ized
to S
ea L
evel
Air
Den
sity
Wind Speed (m/s)

16
Figure 7 shows a plot of the binned power curve at the site average air density during the test period for normal power production.
Figure 7. Power curve at site average density; 1.00 kg/m3 for normal power production
-0.2
0.0
0.2
0.4
0.6
0.8
1.0
0 2 4 6 8 10 12 14
Pow
er (k
W),
Nor
mal
ized
to S
ite S
peci
fic A
ir D
ensi
ty
Wind Speed (m/s)
17
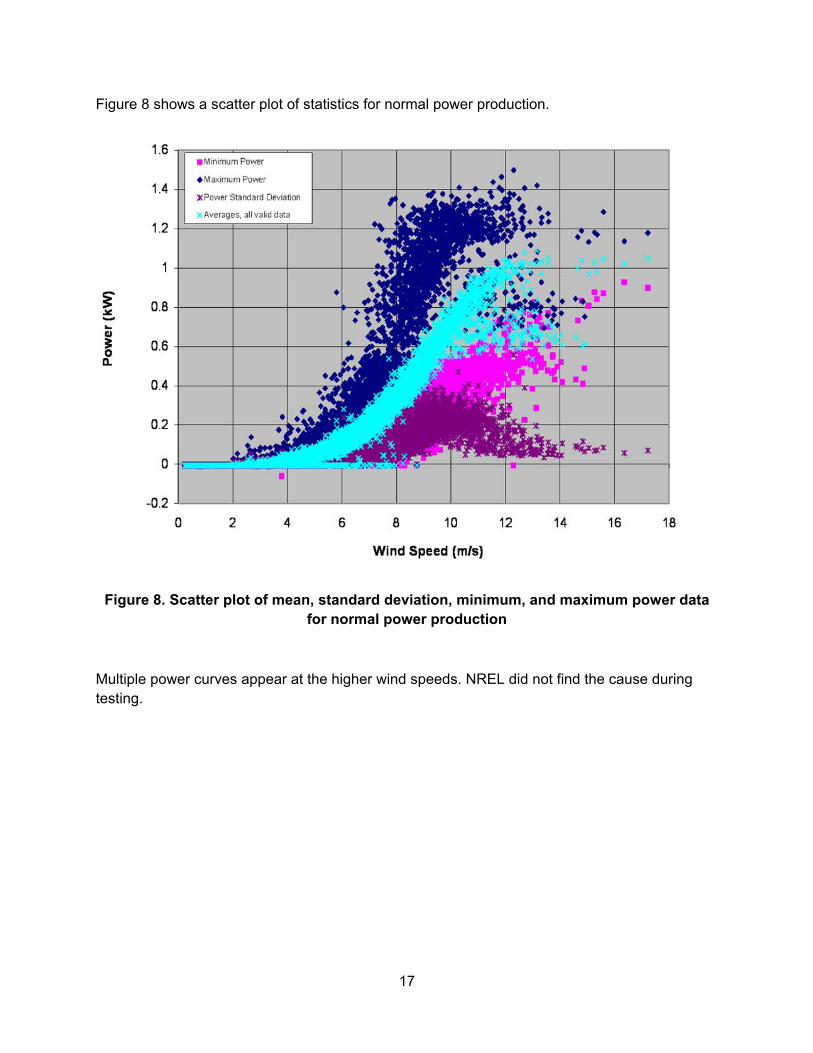
Figure 8 shows a scatter plot of statistics for normal power production.
Figure 8. Scatter plot of mean, standard deviation, minimum, and maximum power data
for normal power production
Multiple power curves appear at the higher wind speeds. NREL did not find the cause during testing.
18
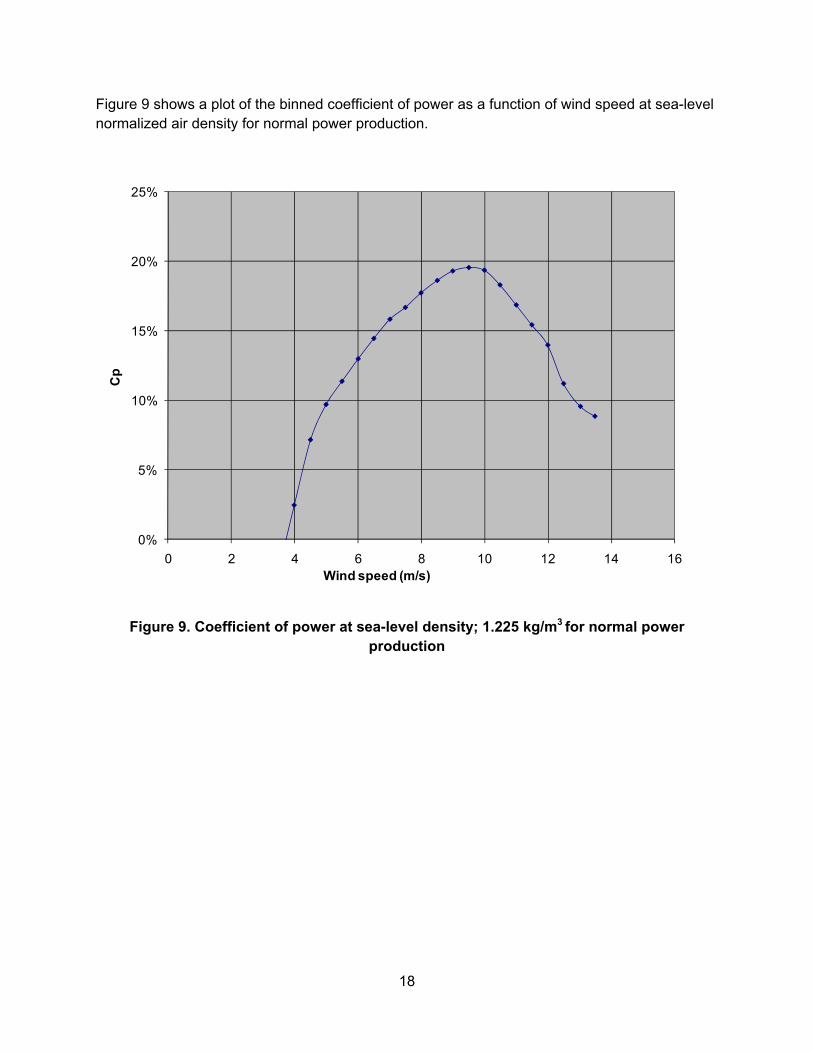
Figure 9 shows a plot of the binned coefficient of power as a function of wind speed at sea-level normalized air density for normal power production.
Figure 9. Coefficient of power at sea-level density; 1.225 kg/m3 for normal power production
0%
5%
10%
15%
20%
25%
0 2 4 6 8 10 12 14 16
Cp
Wind speed (m/s)
19
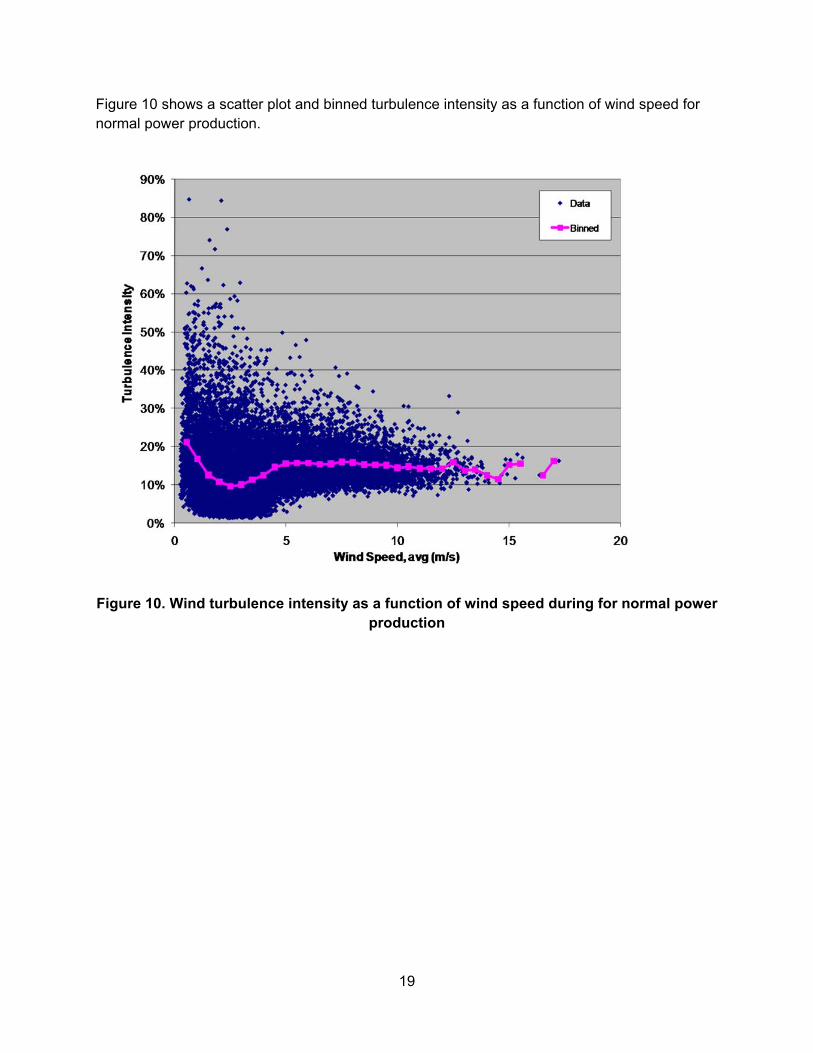
Figure 10 shows a scatter plot and binned turbulence intensity as a function of wind speed for normal power production.
Figure 10. Wind turbulence intensity as a function of wind speed during for normal power
production

20
Figure 11 shows a scatter plot of wind speed and turbulence intensity as a function of wind direction for normal power production.
Figure 11. Wind speed and turbulence intensity as a function of wind direction during test for normal power production

21
Figure 12 shows a scatter plot of binned values of rotor speed as a function of wind speed for normal power production.
Figure 12. Rotor speed as a function of wind speed (1-minute averages) and binned values for normal power production
7.2 Results of Power Performance Test for Optimized Power Production
7.2.1 Tabular Results for Optimized Power Production Table 10 through Table 13 provide the power performance test results for the optimized power production in tabular format.
Wind speed m/s 0.5 1 1.5 2 2.5 3 3.5 4 4.5 5 5.5 6 6.5 7Rotor speed rpm 0 0 1 3 9 20 42 80 137 177 204 228 255 276
Wind speed m/s 7.5 8 8.5 9 9.5 10 10.5 11 11.5 12 12.5 13 13.5 14Rotor speed rpm 291 312 331 344 353 359 355 352 348 346 326 318 321 299
050
100150200250300350400
0 2 4 6 8 10 12 14 16 18 20
wind speed (m/s)
roto
r spe
ed (r
pm)
AveragesBinned Values

22
Table 10 shows the binned power performance results at sea-level normalized air density for optimized power production.
Table 10. Performance at sea-level air density; 1.225 kg/m3 for optimized power production
Measured power curve (database A) Reference air density: 1.225 kg/m3 Category A Category B Combined
Bin Wind Normalized Cp Number of Standard Standard Standard Speed Power 1-Minute Uncertainty Uncertainty Uncertainty Output Data Sets
(m/s) (m/s) (kW) (kW) (kW) (kW) 3 2.99 -0.01 -0.06 8497 0.00 0.01 0.01
3.5 3.48 -0.01 -0.03 6251 0.00 0.01 0.01 4 3.98 0.01 0.02 3977 0.00 0.01 0.01
4.5 4.48 0.02 0.06 2690 0.00 0.02 0.02 5 4.99 0.05 0.09 2031 0.00 0.02 0.02
5.5 5.49 0.08 0.11 1576 0.00 0.03 0.03 6 6.00 0.12 0.12 1391 0.00 0.03 0.03
6.5 6.48 0.16 0.13 1124 0.00 0.04 0.04 7 6.99 0.22 0.14 953 0.00 0.05 0.05
7.5 7.49 0.29 0.15 741 0.00 0.06 0.06 8 7.99 0.37 0.16 559 0.00 0.08 0.08
8.5 8.47 0.48 0.17 411 0.01 0.11 0.11 9 8.98 0.60 0.18 331 0.01 0.11 0.11
9.5 9.48 0.72 0.19 206 0.01 0.13 0.13 10 10.00 0.86 0.19 181 0.01 0.14 0.14
10.5 10.50 0.96 0.18 146 0.01 0.11 0.11 11 10.99 1.08 0.18 121 0.01 0.12 0.12
11.5 11.47 1.15 0.17 80 0.01 0.09 0.09 12 12.02 1.24 0.16 71 0.02 0.09 0.09
12.5 12.50 1.29 0.14 43 0.01 0.07 0.07 13 13.02 1.32 0.13 29 0.01 0.04 0.04
13.5 13.56 1.37 0.12 14 0.01 0.06 0.06

23
Table 11 shows the binned power performance results at the site average air density for the NWTC for optimized power production.
Table 11. Performance at site average density; 0.95 kg/m3 for optimized power production
Measured power curve (database A) Reference air density: 0.95 kg/m3 Category A Category B Combined
Bin Wind Normalized Cp Number of Standard Standard Standard Speed Power 1-Minute Uncertainty Uncertainty Uncertainty Output Data Sets
(m/s) (m/s) (kW) (kW) (kW) (kW) 3 2.99 -0.01 -0.06 8497 0.00 0.01 0.01
3.5 3.48 0.00 -0.03 6251 0.00 0.01 0.01 4 3.98 0.00 0.02 3977 0.00 0.01 0.01
4.5 4.48 0.02 0.06 2690 0.00 0.02 0.02 5 4.99 0.04 0.09 2031 0.00 0.02 0.02
5.5 5.49 0.06 0.11 1576 0.00 0.02 0.02 6 6.00 0.09 0.12 1391 0.00 0.03 0.03
6.5 6.48 0.13 0.13 1124 0.00 0.03 0.03 7 6.99 0.17 0.14 953 0.00 0.04 0.04
7.5 7.49 0.22 0.15 741 0.00 0.05 0.05 8 7.99 0.29 0.16 559 0.00 0.06 0.06
8.5 8.47 0.37 0.17 411 0.00 0.08 0.08 9 8.98 0.46 0.18 331 0.00 0.09 0.09
9.5 9.48 0.56 0.19 206 0.01 0.10 0.10 10 10.00 0.67 0.19 181 0.01 0.11 0.11
10.5 10.50 0.75 0.18 146 0.01 0.08 0.08 11 10.99 0.83 0.18 121 0.01 0.10 0.10
11.5 11.47 0.90 0.17 80 0.01 0.07 0.07 12 12.02 0.96 0.16 71 0.01 0.07 0.07
12.5 12.50 1.00 0.14 43 0.01 0.05 0.05 13 13.02 1.02 0.13 29 0.01 0.03 0.03
13.5 13.56 1.06 0.12 14 0.01 0.05 0.05
24
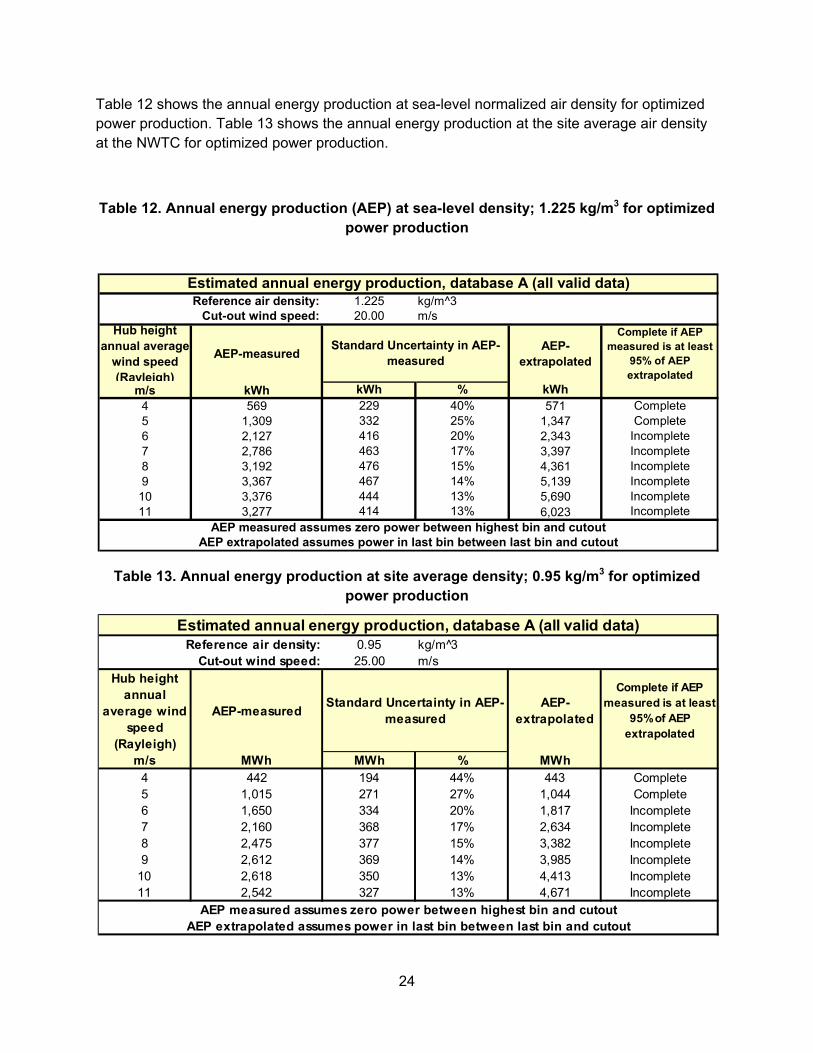
Table 12 shows the annual energy production at sea-level normalized air density for optimized power production. Table 13 shows the annual energy production at the site average air density at the NWTC for optimized power production.
Table 12. Annual energy production (AEP) at sea-level density; 1.225 kg/m3 for optimized power production
Table 13. Annual energy production at site average density; 0.95 kg/m3 for optimized power production
Reference air density: 1.225 kg/m^3Cut-out wind speed: 20.00 m/s
Hub height annual average
wind speed (Rayleigh)
AEP-measured AEP-extrapolated
Complete if AEP measured is at least
95% of AEP extrapolated
m/s kWh kWh % kWh4 569 229 40% 571 Complete5 1,309 332 25% 1,347 Complete6 2,127 416 20% 2,343 Incomplete7 2,786 463 17% 3,397 Incomplete8 3,192 476 15% 4,361 Incomplete9 3,367 467 14% 5,139 Incomplete10 3,376 444 13% 5,690 Incomplete11 3,277 414 13% 6,023 Incomplete
Standard Uncertainty in AEP-measured
AEP measured assumes zero power between highest bin and cutoutAEP extrapolated assumes power in last bin between last bin and cutout
Estimated annual energy production, database A (all valid data)
Reference air density: 0.95 kg/m 3̂Cut-out wind speed: 25.00 m/s
Hub height annual
average wind speed
(Rayleigh)
AEP-measured AEP-extrapolated
Complete if AEP measured is at least
95% of AEP extrapolated
m/s MWh MWh % MWh4 442 194 44% 443 Complete5 1,015 271 27% 1,044 Complete6 1,650 334 20% 1,817 Incomplete7 2,160 368 17% 2,634 Incomplete8 2,475 377 15% 3,382 Incomplete9 2,612 369 14% 3,985 Incomplete
10 2,618 350 13% 4,413 Incomplete11 2,542 327 13% 4,671 Incomplete
Estimated annual energy production, database A (all valid data)
Standard Uncertainty in AEP-measured
AEP measured assumes zero power between highest bin and cutoutAEP extrapolated assumes power in last bin between last bin and cutout

25
7.2.2 Graphical Results for Power-Optimized Configuration
Figure 13 through Figure 19 show the results of the power performance test for optimized power production in graphical format. Figure 13 shows a plot of the binned power curve normalized to sea-level air density of optimized power production.
Figure 13. Power curve at sea-level density; 1.225 kg/m3 for optimized power production
-0.2
0.0
0.2
0.4
0.6
0.8
1.0
1.2
1.4
1.6
0 2 4 6 8 10 12 14
Wind Speed (m/s)
Pow
er (k
W),
Nor
mal
ized
to S
ea L
evel
Air
Den
sity

26
Figure 14 shows a plot of the binned power curve at the site average air density for the NWTC for optimized power production.
Figure 14. Power curve at site average density; 0.95 kg/m3 for optimized power
production
-0.2
0.0
0.2
0.4
0.6
0.8
1.0
1.2
0 2 4 6 8 10 12 14
Wind Speed (m/s)
Pow
er (k
W),
Nor
mal
ized
to S
ite S
peci
fic A
ir D
ensi
ty

27
Figure 15 shows a scatter plot of statistics for optimized power production.
Figure 15. Scatter plot of mean, standard deviation, minimum, and maximum power data for optimized power production

30
Figure 16 shows a plot of the binned coefficient of power as a function of wind speed at sea-level normalized air density for optimized power production.
Figure 16. Coefficient of power at sea level density; 1.225 kg/m3 for optimized power production
0%
2%
4%
6%
8%
10%
12%
14%
16%
18%
20%
0 2 4 6 8 10 12 14
Wind speed (m/s)
Cp
29
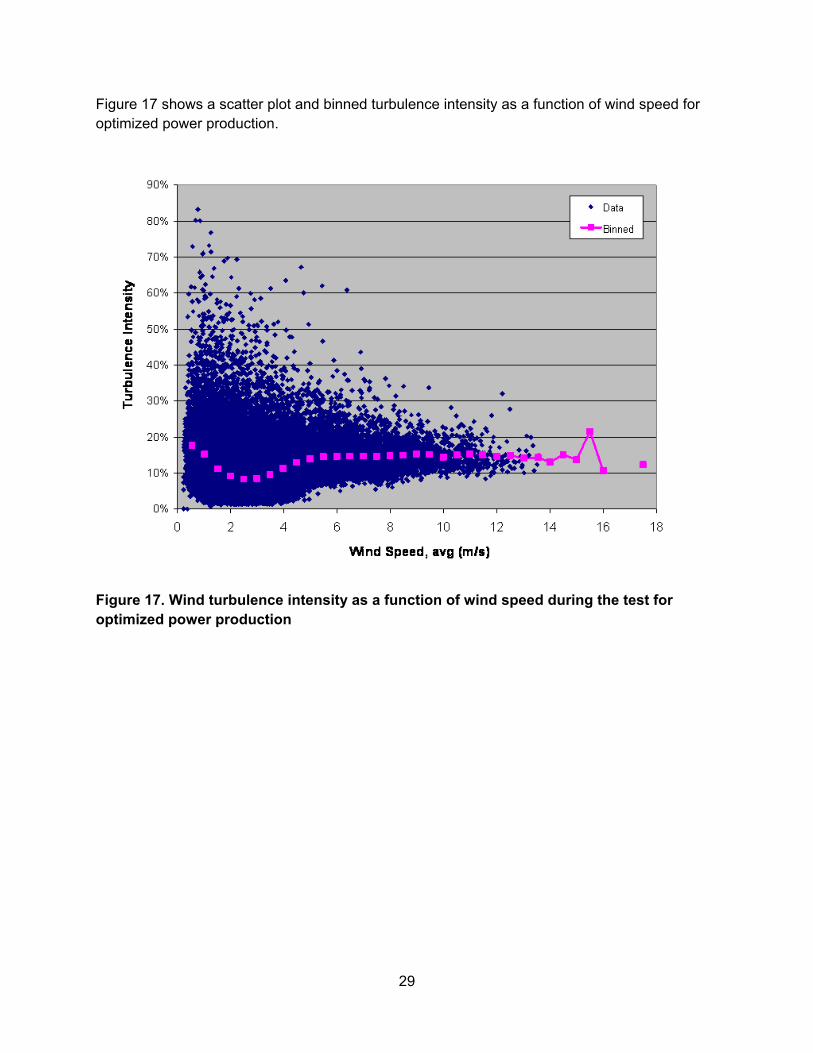
Figure 17 shows a scatter plot and binned turbulence intensity as a function of wind speed for optimized power production.
Figure 17. Wind turbulence intensity as a function of wind speed during the test for optimized power production
30
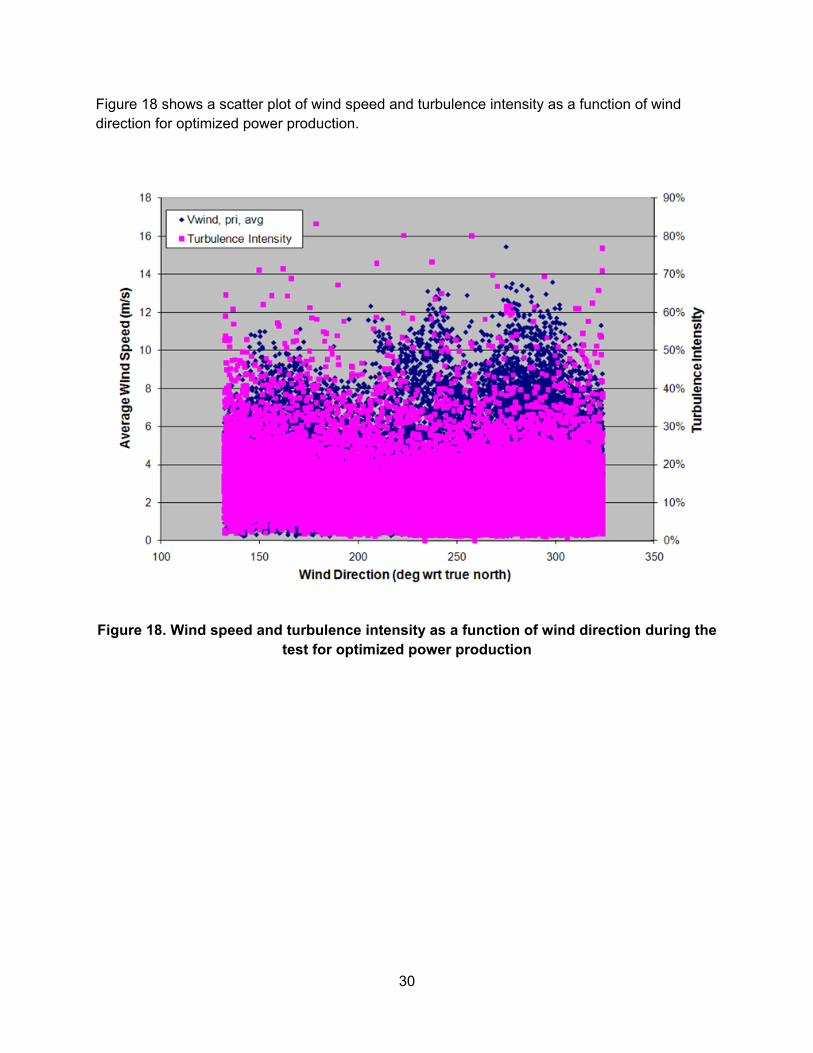
Figure 18 shows a scatter plot of wind speed and turbulence intensity as a function of wind direction for optimized power production.
Figure 18. Wind speed and turbulence intensity as a function of wind direction during the test for optimized power production

31
Figure 19 shows a scatter plot and binned values of rotor speed as a function of wind speed for optimized power production.
Figure 19. Rotor speed as a function of wind speed (1-minute averages) and binned values for optimized power production

32
8. Deviations and Exceptions
8.1. Deviations from the Standard
1. The current transformers are not complaint with IEC 60044-1, but do exceed the minimum accuracy required by the Standard.
2. For both turbine configurations, the 14 m/s wind speed bin was not filled as required in Annex H.
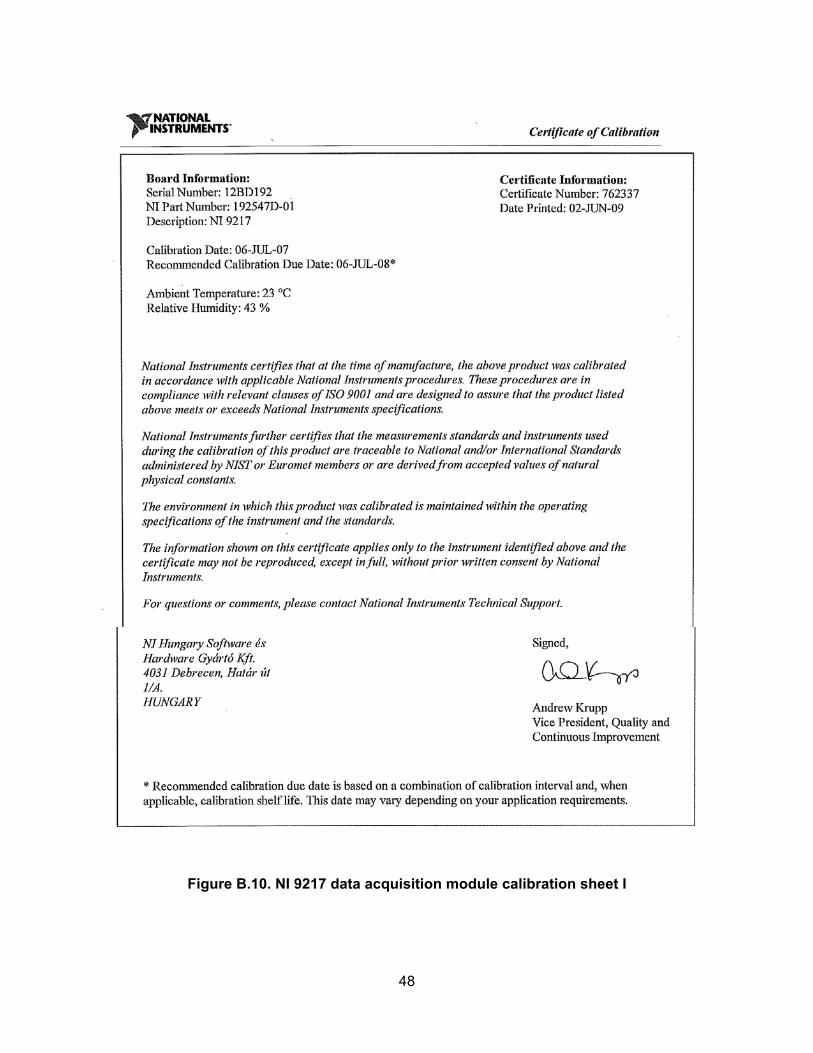
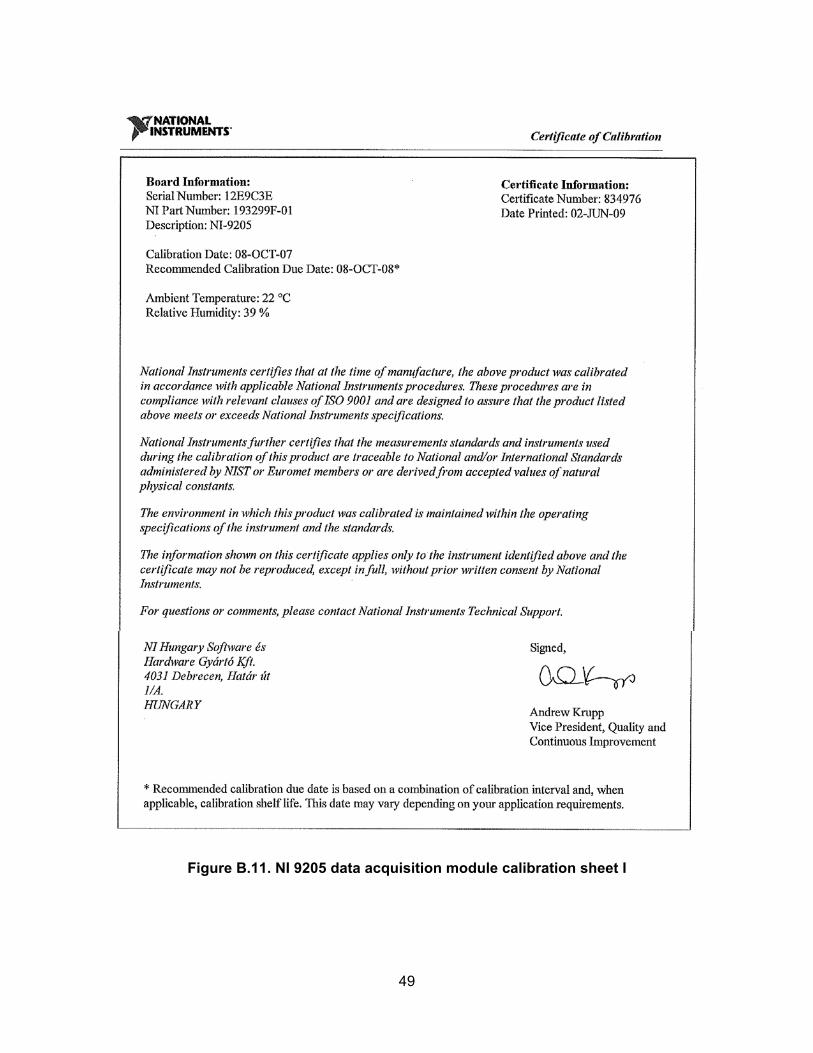
8.2. Exceptions to NWTC-CT Quality Assurance System The data acquisition modules were used beyond the calibration due date. The modules were post-test calibrated and found in compliance with the specifications. The post-test calibration sheets are included in Appendix B.

33
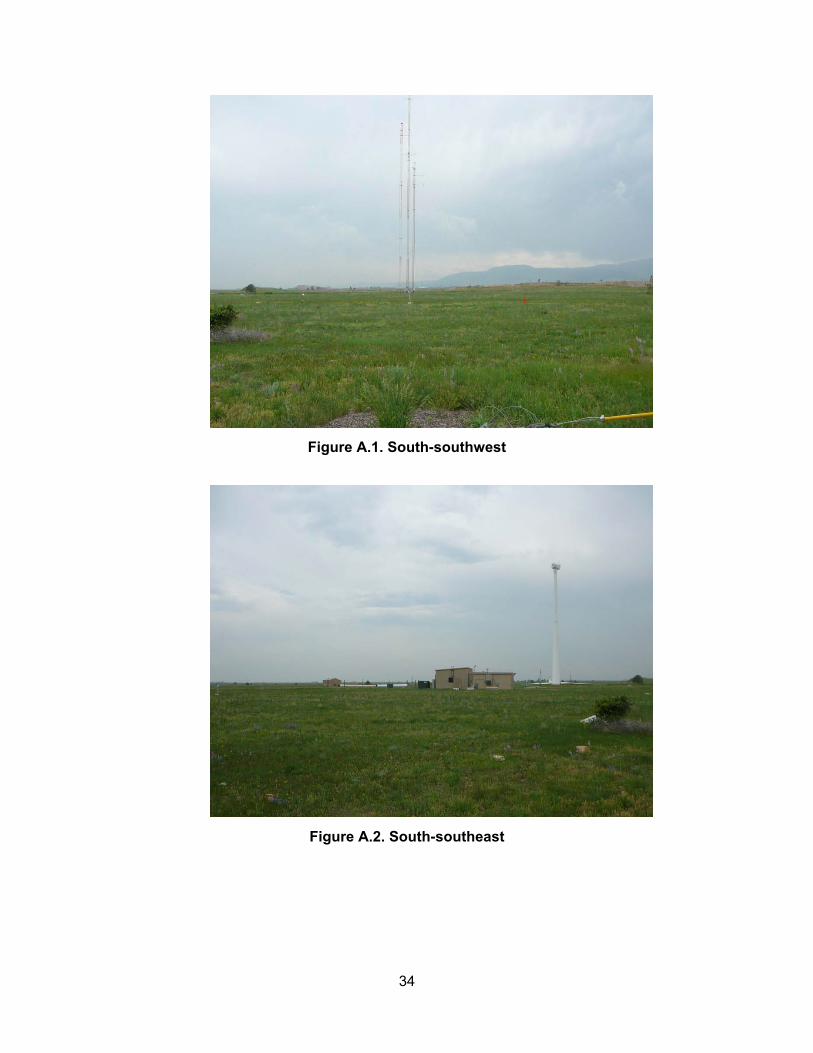
A. Appendix – Pictures of the Test Site from the Turbine Base
34
Figure A.1. South-southwest
Figure A.2. South-southeast

35
Figure A.3. East-southeast
Figure A.4. East-northeast

36
Figure A.5. North-northeast
Figure A.6. Northwest
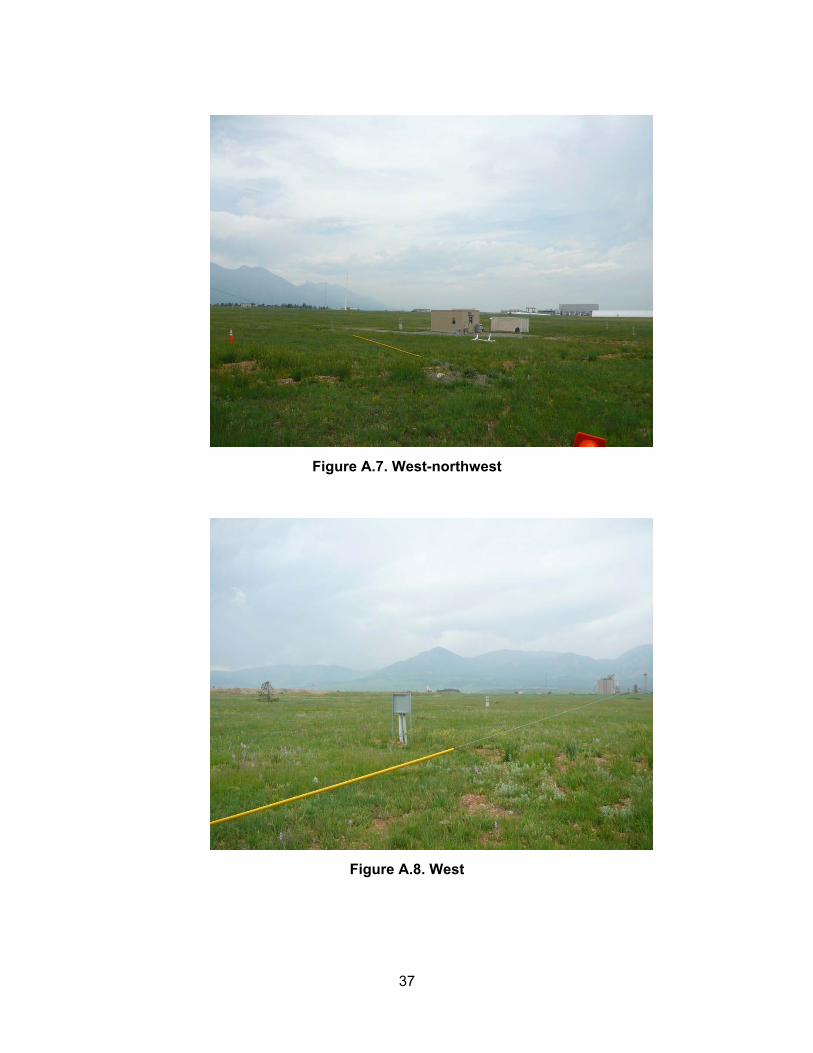
37
Figure A.7. West-northwest
Figure A.8. West

38
B. Appendix – Equipment Calibration Sheets

39
Figure B.1. Power transducer calibration sheet

40
Figure B.2. RTD probe calibration sheet I

41
Figure B.3. RTD probe calibration sheet II

42
Figure B.4. Primary anemometer calibration sheet I

43
Figure B.5. Primary anemometer calibration sheet II

44
Figure B.6. Wind vane calibration sheet

45
Figure B.7. Pressure transmitter calibration sheet

46
Figure B.8. Pressure transmitter calibration sheet II

47
Figure B.9. NI 9229 data acquisition module calibration sheet I
48
Figure B.10. NI 9217 data acquisition module calibration sheet I
49
Figure B.11. NI 9205 data acquisition module calibration sheet I

50
Figure B.12. NI 9229 data acquisition module calibration sheet II

51
Figure B.13. NI 9217 data acquisition module calibration sheet II

52
Figure B.14. NI 9205 data acquisition module calibration sheet II

F1147-E(10/2008)
REPORT DOCUMENTATION PAGE Form Approved OMB No. 0704-0188
The public reporting burden for this collection of information is estimated to average 1 hour per response, including the time for reviewing instructions, searching existing data sources, gathering and maintaining the data needed, and completing and reviewing the collection of information. Send comments regarding this burden estimate or any other aspect of this collection of information, including suggestions for reducing the burden, to Department of Defense, Executive Services and Communications Directorate (0704-0188). Respondents should be aware that notwithstanding any other provision of law, no person shall be subject to any penalty for failing to comply with a collection of information if it does not display a currently valid OMB control number. PLEASE DO NOT RETURN YOUR FORM TO THE ABOVE ORGANIZATION. 1. REPORT DATE (DD-MM-YYYY)
December 2009 2. REPORT TYPE
Technical Report 3. DATES COVERED (From - To)
4. TITLE AND SUBTITLE
Wind Turbine Generator System Power Performance Test Report for the Mariah Windspire 1-kW Wind Turbine
5a. CONTRACT NUMBER DE-AC36-08-GO28308
5b. GRANT NUMBER
5c. PROGRAM ELEMENT NUMBER
6. AUTHOR(S) A. Huskey, A. Bowen, and D. Jager
5d. PROJECT NUMBER NREL/TP-500-46192
5e. TASK NUMBER WE102211
5f. WORK UNIT NUMBER
7. PERFORMING ORGANIZATION NAME(S) AND ADDRESS(ES) National Renewable Energy Laboratory 1617 Cole Blvd. Golden, CO 80401-3393
8. PERFORMING ORGANIZATION REPORT NUMBER NREL/TP-500-46192
9. SPONSORING/MONITORING AGENCY NAME(S) AND ADDRESS(ES)
10. SPONSOR/MONITOR'S ACRONYM(S) NREL
11. SPONSORING/MONITORING AGENCY REPORT NUMBER
12. DISTRIBUTION AVAILABILITY STATEMENT National Technical Information Service U.S. Department of Commerce 5285 Port Royal Road Springfield, VA 22161
13. SUPPLEMENTARY NOTES
14. ABSTRACT (Maximum 200 Words) This report summarizes the results of a power performance test that NREL conducted on the Mariah Windspire 1-kW wind turbine. During this test, two configurations were tested on the same turbine. In the first configuration, the turbine inverter was optimized for power production. In the second configuration, the turbine inverter was set for normal power production. In both configurations, the inverter experienced failures and the tests were not finished.
15. SUBJECT TERMS wind energy; Mariah; Mariah Windspire 1-kW wind turbine; 1-kW wind turbine; power performance
16. SECURITY CLASSIFICATION OF: 17. LIMITATION OF ABSTRACT
UL
18. NUMBER OF PAGES
19a. NAME OF RESPONSIBLE PERSON a. REPORT
Unclassified b. ABSTRACT Unclassified
c. THIS PAGE Unclassified 19b. TELEPHONE NUMBER (Include area code)
Standard Form 298 (Rev. 8/98) Prescribed by ANSI Std. Z39.18


