terra australis 34 13 Wind v water: Glacial maximum records from the Willandra Lakes Jim M. Bowler School of Earth Sciences, University of Melbourne, Victoria [email protected]Richard Gillespie The University of Wollongong, NSW, and The Australian National University, Canberra, ACT Harvey Johnston New South Wales Office of Environment and Heritage, Buronga, NSW Katarina Boljkovac The Australian National University, Canberra, ACT Introduction Using lakes and dry basins for discerning the patterns of climatic change faces a number of challenges. Study of the Willandra basins (Figures 1 and 2) involves reconstruction of their environmental history and its relationship to controlling climatic change. e various methods for data interpretation and hydrologic reconstruction have been discussed elsewhere (Bowler 1971, 1998). In early evaluation, the history of the Willandra Lakes was summarised in terms of three major stratigraphic units, each related to a major cycle of hydrologic change. e units Golgol, Mungo and Zanci were designated as responsible for the major stratigraphic events in the history of the system (Bowler 1971). e Zanci drying phase was directly related to the Last Glacial Maximum (LGM), the period of maximum ice extent in the Northern Hemisphere (Clark et al. 2009), glacial ice on Kosciuszko (Barrows et al. 2001) and lowest sea level (Lambeck and Chappell 2001). In later revisions, Bowler (1998) defined an Arumpo unit between Mungo and Zanci, and a final Mulurulu unit to account for evidence of late-stage filling especially in Lake Mulurulu. Coincident with the LGM (ca. 25,000-17,000 years ago), the Zanci phase, and the assumed aridity it represents, is of
Transcript
terra australis 34
13Wind v water: Glacial maximum records from the Willandra Lakes
Jim M. Bowler School of Earth Sciences, University of Melbourne, Victoria [email protected]
Richard Gillespie The University of Wollongong, NSW, and The Australian National University, Canberra, ACT
Harvey Johnston New South Wales Office of Environment and Heritage, Buronga, NSW
Katarina Boljkovac The Australian National University, Canberra, ACT
Introduction
Using lakes and dry basins for discerning the patterns of climatic change faces a number of challenges. Study of the Willandra basins (Figures 1 and 2) involves reconstruction of their environmental history and its relationship to controlling climatic change. The various methods for data interpretation and hydrologic reconstruction have been discussed elsewhere (Bowler 1971, 1998). In early evaluation, the history of the Willandra Lakes was summarised in terms of three major stratigraphic units, each related to a major cycle of hydrologic change. The units Golgol, Mungo and Zanci were designated as responsible for the major stratigraphic events in the history of the system (Bowler 1971). The Zanci drying phase was directly related to the Last Glacial Maximum (LGM), the period of maximum ice extent in the Northern Hemisphere (Clark et al. 2009), glacial ice on Kosciuszko (Barrows et al. 2001) and lowest sea level (Lambeck and Chappell 2001). In later revisions, Bowler (1998) defined an Arumpo unit between Mungo and Zanci, and a final Mulurulu unit to account for evidence of late-stage filling especially in Lake Mulurulu. Coincident with the LGM (ca. 25,000-17,000 years ago), the Zanci phase, and the assumed aridity it represents, is of
terra australis 34
Jim M. Bowler et al.272
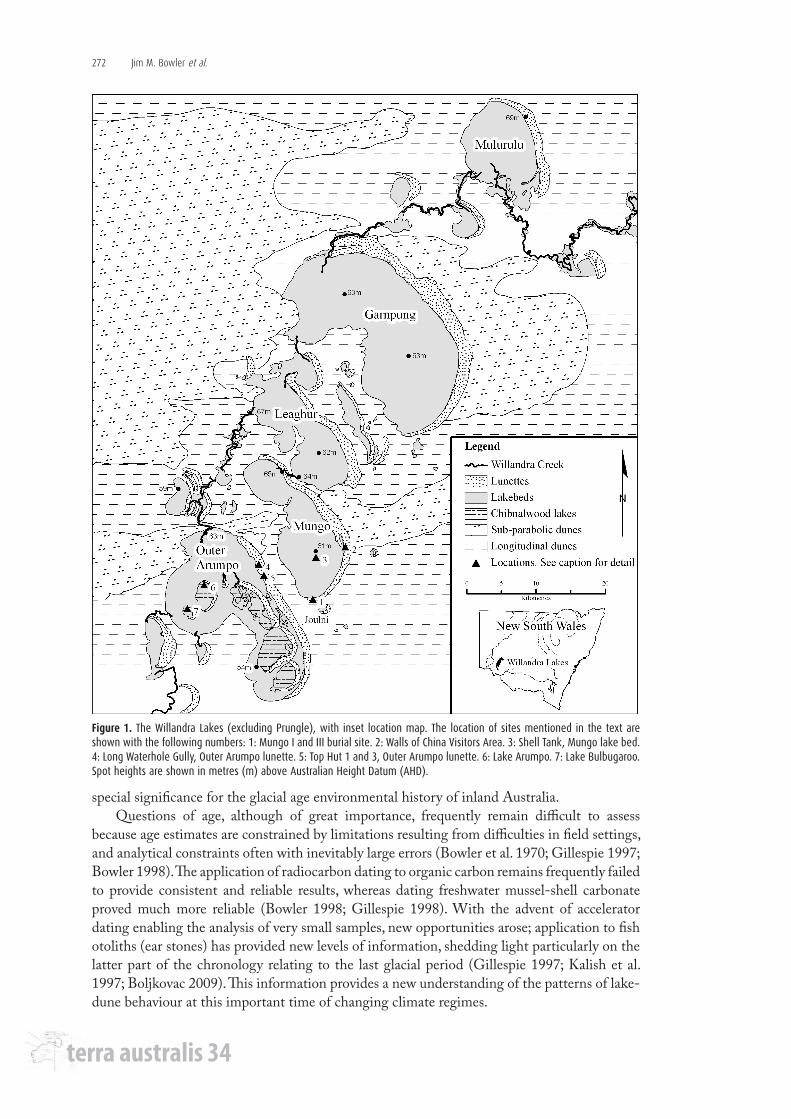
Figure 1. The Willandra Lakes (excluding Prungle), with inset location map. The location of sites mentioned in the text are shown with the following numbers: 1: Mungo I and III burial site. 2: Walls of China Visitors Area. 3: Shell Tank, Mungo lake bed. 4: Long Waterhole Gully, Outer Arumpo lunette. 5: Top Hut 1 and 3, Outer Arumpo lunette. 6: Lake Arumpo. 7: Lake Bulbugaroo. Spot heights are shown in metres (m) above Australian Height Datum (AHD).
special significance for the glacial age environmental history of inland Australia.Questions of age, although of great importance, frequently remain difficult to assess
because age estimates are constrained by limitations resulting from difficulties in field settings, and analytical constraints often with inevitably large errors (Bowler et al. 1970; Gillespie 1997; Bowler 1998). The application of radiocarbon dating to organic carbon remains frequently failed to provide consistent and reliable results, whereas dating freshwater mussel-shell carbonate proved much more reliable (Bowler 1998; Gillespie 1998). With the advent of accelerator dating enabling the analysis of very small samples, new opportunities arose; application to fish otoliths (ear stones) has provided new levels of information, shedding light particularly on the latter part of the chronology relating to the last glacial period (Gillespie 1997; Kalish et al. 1997; Boljkovac 2009). This information provides a new understanding of the patterns of lake-dune behaviour at this important time of changing climate regimes.
terra australis 34
Wind v water: Glacial maximum records from the Willandra Lakes 273
Despite the importance of age evaluation in assessing field data, that evaluation must be consistent with field evidence. In the Willandra chain of inter-connected basins, a response to any particular climatic effect involving change in the hydrologic balance will be felt and expressed differently across different basins in the same region. Responses will vary between basins, depending on shape, size and especially position in the drainage chain (see Figure 3).
Basins close to catchments will retain much more water for longer periods than those in more distant regions further down the chain. Basins close to uplands, regions of most available water, or supplied by major rivers remained full even under conditions of glacial maximum aridity. As examples, the lake basins of Urana (Page et al. 1994), Kanyapella on the Murray River (Bowler 1967, 1978) and Nekeeya near the Grampians (Bowler 1999) all remained at high levels during the glacial maximum due entirely to the efficient nature of the catchments which supplied them. Similarly, glacially wet conditions pertained in glacial age catchments in the Flinders Ranges (Williams et al. 2001). Basins more distant from effective water supply, between or away from streams, responded more sensitively to the onset of aridity (Nanson et al. 1992; Kershaw and Nanson 1993; Magee et al. 1995; Hesse et al. 2004).
As an inter-connected but descending basin chain, the Willandra Lakes can be explained by a ‘stairway’ analogy, in which relative positions impose limitations on hydrologic behaviour. Basins adjacent to each other and especially those connected by overflow, one supplying the other, will vary according to individual thresholds of wetting and drying. The application of these principles to basins in the Willandra chain of lakes has not been previously addressed.
Figure 2. Digital radar image of Willandra basins (Figure 1) in the trough between tectonic Neckarboo and Iona ridges, with cover field of Mallee sand dunes. The arrows indicate mallee dune transgression across lake floors at Garnpung (A) and Outer Arumpo (B). Data from Australian Landform Atlas, courtesy Mike Sandiford. ht tp :// jaeger.ear thsc i .unimelb.edu.au/Images/Landform/landform.html
terra australis 34
Jim M. Bowler et al.274
This paper reviews new evidence and revises previous interpretations, with special relevance to a new understanding of glacial maximum environments and their expression within the Willandra system.
Principles of lake-dune response
The simple rise and fall of a major wet to dry cycle is complicated by fluctuations at intermediate levels in the rising and falling stages. These are particularly important in providing opportunity for episodic or intermittent periods of lake floor exposure resulting from seasonal or secular discharge variability (see Figure 4A).
When the flood trend reaches an overflow level, short-term oscillations disappear. Maximum level permits generation of gravels and beach sands, providing material for foreshore dune development (quartz sand dunes, QSD). On the drying trend, the basin acts as a terminal system and salinity increases. The threshold for clay dune development (PCD) is reached when oscillations in the shallowing lake expose the dry lake floor. Basin floor 1, highest in the drainage line, first receives the floodwaters and is last to dry. Basin floor 2, further down the drainage line, receives waters later and has a much shorter duration of lake-full environment. While the long wavelength water’s rise and fall defines the major cycle, smaller high-frequency oscillations of a seasonal or secular nature impose important complications. Critical elements are twofold.
Firstly, the maximum water level in the Willandra basins is controlled by the overflow outlet level connecting each basin to the next in the chain (Figure 3). At that point, production of high wave energy, with consequent deposition of beach sands and shoreline gravels, defines this important status in the lake-full regime. At overflow level, it remains in through-flow status; any accumulating salts are flushed downstream. Simultaneously, under conditions of sufficient sand supply, substantial sandy beaches provide the materials on which wind action operates, with the construction of foreshore dunes derived from well-sorted beach sands (Bowler 1973). Identified as quartz sand dunes (QSD), although often with a significant shell component, these identify a process dramatically different from the aeolian mantles composed of pelletal clay materials, the pelletal clay dune facies (PCD). As long as the level remains at overflow, seasonal-secular oscillations are suppressed by annual recharge.
Secondly, as soon as water level falls below the outlet, the basin begins to act as a terminal system. Evaporation exceeds combined precipitation and inflow, resulting in increasing salt
MULURULU
GARNPUNG
LEAGHUR MUNGO
OUTER ARUMPO
BASIN STAIRWAY
Leaghur-Mungo connection
69
62
61 60
5754
67
Figure 3. Diagrammatic representation of Willandra basins in ‘stairway’, relative to each other. Approximate levels of basin floors in metres AHD, from digital elevation and local surveys.
terra australis 34
Wind v water: Glacial maximum records from the Willandra Lakes 275
Beach gravels
RISING
FALLING
Salinity increasing
Pelletal Clay Duneconstruction
(PCD)
BASIN FLOOR 2
BASIN FLOOR 3
BASIN FLOOR 1
OVERFLOW
Quartz sandforeshore dunes
(QSD)Basin enters terminal status
TIMEEarly Late
A
B
C
D
OUTER ARUMPOMUNGO
Rising levels
A A’B B’
C C’MULURULU
Lake full
OUTER ARUMPOMUNGO
Rising levels
A A’B B’
C C’MULURULU
Lake full
OUTER ARUMPOMUNGO
Rising levels
A A’B B’
C C’MULURULU
Lake full
Lake dry
Lake dry
Lake dry
QSD
QSD
PCD1
PCD1
PCD2
QSD Lake �oordust
Groundwatercontrol
Low salinity
I
II
III
Figure 4. Detailed evaluation of different responses to lake level changes between three interconnected basins.(A) Idealised major wet to dry lake level oscillation, showing differences in response between basins depending on locations on drainage chain. Second-order seasonal to secular oscillations are superimposed on major rise and fall of levels. Horizontal lines depict arrival times on the basin floors, showing duration of the flood events for three basins (1 Mulurulu, 2 Mungo and 3 Outer Arumpo). On the rising trend, items I, II and III depict water arrival time at each basin. Foreshore quartz dune development (QSD) may follow arrival and stabilisation at maximum water level. On falling trend, A-A’, B-B’ and C-C’ define times of lake floor drying, setting the scene for major clay dune development (PCD). (B) Outer Arumpo: Pattern illustrates relatively short-term lake-full stage. Quartz dunes generated from high lake level. On falling stage, early exposure of lake floor (A) permits development of clay dunes (PCD1). With further development of drying (A to A’), clay dune deposition accelerates. As saline surface waters contract, groundwaters nourish pools of higher salinity within inner lake floor depressions. Crystallisation of salts generates next phase of gypseous clay dunes inside outer basin perimeter (PCD2), with generation of Chibnalwood, Inner Arumpo and Bulbugaroo lunettes (Figure 5).(C) Mungo: Longer period of permanent water permits development of beach sands and foreshore dune facies (QSD). In falling stage (B-B’), period of clay dune development follows evolution of water to moderate salinity, no gypsum. This develops simultaneously with PCD2 dune growth at Chibnalwood.(D) Mulurulu: Longer period of water retention permits extensive development of beach sands and foreshore dunes. Frequent flushing by overflow prevents build-up of salts. Final drying under conditions of low salinity permits deflation of dust (clay and silt) from lake floor, but lacks effects of salt crystallisation characteristic of other basins when in terminal phase.
terra australis 34
Jim M. Bowler et al.276
concentrations as water levels progressively fall. With shallowing, the situation is reached when seasonal oscillations expose at least part of the lake floor to drying. That immediately opens the possibility for wind action to begin the process of erosion, with deposition of sand-sized clay pellets (or silt-clay components) on the lunette. Thereafter, the drying process is dominated by production of the clay dune facies. This may progress to a high-salinity-groundwater phase in which seasonal groundwater discharge affects the lower parts of the drying system. Such saline groundwaters may then produce high gypsum dune content, in contrast to earlier lower-salinity deflation clays. This occurred to the inner gypseous basins in the contracting phase of Outer Arumpo. Clay dune deposition was then terminated by either a successive return of lake water, or a fall in groundwater levels, followed by vegetation recolonisation.
These idealised events take on additional significance when applied to different basins on the drainage chain, situations in which differences in the sequence dictate different levels and different response times. We take examples from three basins, examined in a two-stage process:
1. Evaluate responses to a specific wetting and drying event.
2. Extend to the larger region over the long-term stratigraphic record.
Major wetting and drying event
A general pattern of different basin responses to changes in controlling discharge is summarised diagrammatically in Figure 4. The example chosen relates to the final major episode of water in the Willandra system, that which preceded and led to final drying. Responses of three basins (Outer Arumpo, Mungo and Mulurulu) to a major phase of lake filling and drying have been chosen as representatives to illustrate the nature of changes that applied throughout the system. On the drying trend, critical levels A-A’, B-B’ and C-C’ are levels at which basin floors begin exposure, while lengths of basin floor levels represent the relative duration of waters in Mulurulu, Mungo and Outer Arumpo respectively.
The Outer Arumpo basin (Figures 1, 3 and 4B), farthest from Mulurulu, is last to fill but first to dry. With a reduction in water level, short-term oscillations would provide early exposure there of the lake floor, permitting development of clay dune building.
Basin flood phaseAt the onset of a high lake phase, until water reaches the basin overflow level, little distinctive
sedimentary record is preserved until stabilisation at overflow level results in the deposition of high-energy beach sands and gravels. Depending on the sand supply, this sets the scene for the production of foreshore quartz dunes, QSD. The duration of this phase varies between lakes. It is shortest in the downstream system of Outer Arumpo compared with those upstream.
Drying phaseWith progressive reduction in discharge associated with regional drying, when the level
of the supply basin (Leaghur in this case) falls below outflow level, its downstream neighbour Outer Arumpo begins to act as a terminal system. Deprived of inflow with reduced levels, the terminal basin will eventually permit seasonal oscillations to expose the lake floor. This triggers the onset of local clay dune production on the outer ridge, the location of the former shoreline. Meanwhile, the upstream basins Mungo and Mulurulu remain within the quartz dune production phase.
terra australis 34
Wind v water: Glacial maximum records from the Willandra Lakes 277
In Outer Arumpo, as water level falls and salinity progresses to the salt accumulation phase, an important change occurs. Local depressions on the basin floor become sites for the next dune production phase. With final loss of surface water, saline groundwater outcrops on the lowest levels where salt crystallisation breaks clays, forming a soft ‘fluffy’ pelletal surface. Strong winds do the rest, resulting in the production of a new generation of saline clay dunes with high gypsum content. This is exactly the sequence in the Outer Arumpo-Chibnalwood lunette
Figure 5. Schematic diagram to show relationships of LGM Zanci phase lake-dune units in three basins, Outer Arumpo, Mungo and Mulurulu. The diagram emphasises contrasts in the nature of final Zanci aeolian units between groundwater control at Chibnalwood, thin pelletal clay on Outer Arumpo, thicker at Mungo, in contrast to dominantly quartz sand control at Mulurulu. Lake bed units are discriminated on the basis of disconformities on the floor of Outer Arumpo (Long Waterhole ) and Mungo (JC trench). Relatively uniform clay on Mulurulu floor does not permit direct unit discrimination.Stratigraphic units: G: Golgol M: Mungo A: Arumpo Z: Zanci.
terra australis 34
Jim M. Bowler et al.278
complex, where final groundwater control was isolated to within depressions on the basin floor within the confines of the outer shoreline, and the resultant gypseous ridges accumulated on the margins of those depressions. The inner basin lunettes of Chibnalwood, Arumpo and Bulbugaroo (Figure 1) are the result of that final wind-controlled groundwater deflation phase. A second generation of gypseous dune building followed the earlier drying trend expressed in clay dunes on the Outer Arumpo shoreline, thus defining the basin-in-basin pattern of the Outer Arumpo-Chibnalwood complex (Figures 1, 2 and 5).
At Mungo (Figures 4C and 5), where the dry threshold was not crossed until later, the trigger phase for clay dune development was reached after the initial clay dune phase at Outer Arumpo had already begun. It would have occurred contemporaneously with the gypsum dune development of the inner basins at Chibnalwood and Arumpo. Meanwhile, Mulurulu upstream (Figures 4D and 5) remained under water influence for much longer, the high lake preserving longer conditions for quartz dune formation.
Chronology and stratigraphic revision
Shell and otolith agesA comprehensive list of radiocarbon ages for Willandra Lakes lacustrine shells and fish
otolith (see Figures 7 and 8) is presented in Table 1. These details were accumulated by RG from a range of published (including Bowler et al. 1970; Clark 1987; Gillespie 1997; Kalish et al. 1997; Bowler 1998; Johnston and Clark 1998; Boljkovac 2009) and unpublished sources, brought together for the first time in the context of specific basin origin. Some samples are from controlled archaeological excavations, for example by Harry Allen and Wilfred Shawcross; many others were collected from the surface of actively eroding lunettes. Among the shell ages (n = 39), many are based on fragmented multi-shell samples, pretreatment was usually simple
17 19 20 21 22 23 2418 25 26 27Calibrated Radiocarbon Age (ka cal BP)
Willandra Ck., Upstream
Mulurulu
Garnpung
Leaghur
Willandra Ck., Leaghur Outflow
Mungo
Arumpo
A
B
Summed probabilities: Willandra Lakes charcoal, shells and otoliths
Pooled means: shells plus otoliths by locatiion
15 20 25 30 35 40 5045Calibrated Radiocarbon Age (ka cal BP)
Shells (n = 39)
Charcoal (n = 35)
Otoliths (n = 49)
Figure 6. Radiocarbon ages for shells and otoliths. A. Summed probability distributions (2σ calibrated) for 39 shell and 49 fish otolith radiocarbon ages, calculated with the atmospheric data in Reimer et al. (2009), using OxCal 4.1 (Bronk Ramsay 2009).B. Location-based probability distributions of calibrated pooled mean ages for groups of shells and otoliths through the LGM. Peak height is approximately proportional to the number of samples (1-10) in each group, lake-bed shells excluded.
terra australis 34
Wind v water: Glacial maximum records from the Willandra Lakes 279
Figure 7. Shell-midden collection of mussel, Velesunio ambiguus, dated to near 18,000 years cal BP. L. Mulurulu. Photo from Bowler’s LAKE MUNGO CD: Window to Australia’s Past.
Figure 8. Lunette erosion, L. Mungo Tourist Site (Location 2, Figure 1). Keryn Walshe (left) and the late Peter Clark examine extensive fish hearth, with more than 500 otoliths on a single bedding plane in pelletal sandy clays. Inset: Golden Perch otoliths. Organic carbon date >39,000 cal BP. Photo from Bowler’s LAKE MUNGO CD: Window to Australia’s Past.
Leaghur West LW20 shell ANU-2769 16,360 200 19,520 270
Leaghur West LW5 shell ANU-2203 16,700 180 19,860 220
Leaghur Peninsula
LP3 shell ANU-372B 27,160 900 31,690 910
Leaghur Peninsula
- shell OZJ716 41,100 1200 44,740 920
Willandra CkTH B1, Leaghur Outflow
otolith (26) OZB-627 16,000 130 19,150 160
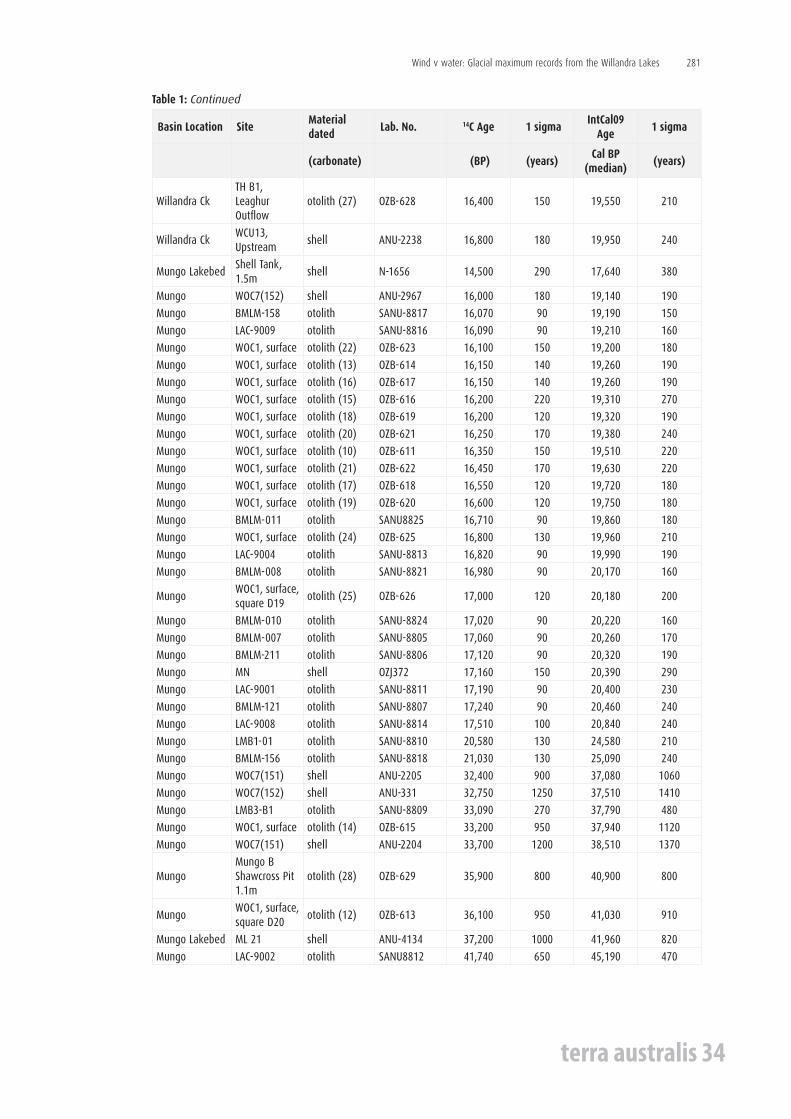
Table 1. Radiocarbon ages for shell and fish otolith carbonate from the Willandra lakes, with location of samples (dash = unknown). Calibration of raw ages using IntCal09 atmospheric data from Reimer et al. (2009), showing median probability and one sigma uncertainty from OxCal 4.1 (Bronk Ramsay, 2009). Otolith number (brackets) in Material column from Kalish et al. (1997). Laboratory codes: ANU (radiometric, ANU); N (radiometric, RIKEN); SANU (SSAMS, ANU); OZ (AMS, ANSTO).
terra australis 34
Wind v water: Glacial maximum records from the Willandra Lakes 281
hand-scraping with weak acid etching, and the oldest results were close to maximum age limits for the available Liquid Scintillation Counting (LSC) technology. All fish otolith ages (n=49) were measured using Accelerator Mass Spectrometry (AMS) on single otolith samples, often with better decontamination procedures, stable isotope correction and smaller uncertainties.
We assume here that all shell and otolith radiocarbon ages listed in Table 1 are Conventional Radiocarbon Ages as defined in Stuiver and Polach (1977); they were calibrated with OxCal 4.1 (Bronk Ramsay 2009) using IntCal09 atmospheric data from Reimer et al. (2009). Two sigma calibrated age range (95.4% confidence interval, rounded to 10 years) and mean calibrated age with two sigma uncertainty (rounded to the nearest 100 years) are given in Table 1; non-finite ages were not calibrated. The very similar patterns of summed probability distributions for all shell ages and all otolith ages are shown in Figure 6A.
Several groups of shell and otolith ages in our date list, particularly at the younger end of the age range, were found to be statistically identical using the two sigma significance test in CALIB 6.0 (Stuiver et al. 2010). Pooled mean ages for these groups were calibrated as above, and these location-based probability distributions are shown in Figure 6B, where peak height is approximately proportional to the number of samples (1-10) in each group. The predominance of results at the younger end of the age range should be seen as a consequence of taphonomy, site destruction and opportunistic sample collection (Surovell et al. 2009; Johnson and Brook 2011).
Where measurements are available from both scintillation counting and AMS for midden shells, all results overlap at one standard deviation, for example from Outer Arumpo: Top
terra australis 34
Wind v water: Glacial maximum records from the Willandra Lakes 283
Hut 1 (OA4) midden has three dates with pooled mean age 40,600 ± 900 cal BP, and Top Hut 3 (OA6) midden has four dates with pooled mean age 40,700 ± 600 cal BP. There are otoliths (and emu eggshells) from the Mungo lunette with ages similar to these Outer Arumpo middens, and luminescence dates for the Lower Mungo to Upper Mungo transition and the Mungo I and III human burials (Bowler et al. 2003) in the same age range (40,000 ± 2000 cal BP). These observations suggest that the oldest Outer Arumpo and Mungo shell midden results may not be significantly in error, while the 47,300 cal BP lake-bed shells from Prungle South probably give some indication of the true age for shell samples previously reported as >37,800 BP (Bowler 1998).
Although not always from stratigraphically controlled contexts, the association of the samples with particular basins provides new information on the presence of water at particular times. The pattern of lake changes requires that we discriminate between longer climatic change events and short-term high variability flood events (as in Figure 4). Major changes in climate will register phases of long duration compared with changes in flood regime. By reason of the time required to establish the fish and shell populations, most aquatic samples will be associated with the former. In the distribution of age samples, the cluster around a modal peak helps discriminate between long-term and short-term changes in water level. Lake-full events of longer duration are more likely to generate clusters of related ages. Short-term flood events may be represented by outlier ages from main clusters.
Within the LGM timeframe, ca. 25,000-17,000 years ago, relationships between ages and source basins assist in defining patterns of change. Age patterns between Outer Arumpo, Mungo and Mulurulu are taken here as key indicators. Leaghur and Garnpung, falling between
Figure 9. Measurements of δ18O, Sr/Ca and 87Sr/86Sr ratios in a single otolith from Mungo, showing annual variations (Boljkovac 2009).
Mungo and Mulurulu, add little that is not already evident in the other two. The modal clustering of age groups relevant to the LGM period is particularly important – they provide the basis for a new data set defining this important period.
In addition to their value as reliable ‘clocks’, otoliths act as the most valuable archives retaining the isotopic signature of water chemistry and temperature during the life of the fish. Its secretion of a daily bank of aragonite permits high-resolution chronology within the life of the fish, separable on a seasonal, monthly or even daily basis (Kalish et al. 1997). Preliminary results of in situ δ18O, Sr/Ca and 87Sr/86Sr measurements on Macquaria ambigua (Golden Perch) otoliths (Boljkovac 2009) have already begun to yield such data, shown in Figure 9.
Stratigraphic revision Sampling constraints impose controls on the
overall age distribution patterns. While many dating samples originate on erosion surfaces, ages from stratigraphically controlled sites inform some aspects of origins. Older samples, such as the otolith (OZB629, 40,900 years ago) from the Mungo B excavation (Shawcross 1998) and an organic sample from a substantial fish hearth at
terra australis 34
Jim M. Bowler et al.284
the Walls of China visitor area (ANU-2964, >34,500 BP) are important in the early sequence. While the latter represents meal remains, the results of human harvesting, many otoliths represent assemblages from fish mortality. Indeed, there is often a correlation between the two. In the Walls of China fish hearth example (Figure 8), hundreds of fish remains lie on, and were covered by, a blanket of dune pelletal clay. That fish feast was the result of increased salinity in the drying lake, and was an opportunistic recovery of hundreds of fish by people living on the shoreline at that time, providing a prototype example of human response to drying conditions as described earlier (Bowler 1998).
The relevance of otolith origins from mass mortality events is further enhanced by differences in modal age patterns between Mungo, 19,200-20,500 years ago, and Mulurulu, 18,800-19,300 years ago (Figure 6). If dominantly the result of human harvesting, similar ages might be expected between basins experiencing mutually similar aquatic environments. The evidence points more towards otolith age patterns reflecting later drying in the upstream basin.
In this sense, a strong bias exists between human behaviour and expressions of environmental change. The onset of drying with diminishment of regional resources goes hand in hand with increased pressure on diminishing aquatic resources. In an opportunistic sense, the occasion of fish populations made groggy by effects of rising salinity would immediately focus human harvesting on that occurrence.
A further link between otolith abundance and a period of increased salinity is suggested by overlapping ages in both otoliths and PCD development. Mungo otolith ages in the 19,200-20,400 year ago range are synchronous with ages for PCD development at that time, dated on charcoal or carbonates (ANU-312, 19,700 years ago and ANU-319, 19,400 years ago from Mungo; ANU-320, 19,900 years ago from Chibnalwood). Lacking fine time-scale resolution (to decades or even centuries) we cannot discriminate between ages of these mutually exclusive events. Within the limitations of dating accuracy, the disappearance of fish ca.19,000 years ago is entirely consistent with, and supportive of, evidence for increased salinity leading to dune building commencing about that time.
ArumpoDetailed construction of wet-dry oscillations during Arumpo time remain poorly constrained
both in terms of accurate ages and the detailed nature of oscillations. However, the reality of the main transgression is clearly defined by high-level gravels at Joulni disconformably overlying sediments of Upper Mungo age (Figures 7 and 10 in Bowler 1998), and in Outer Arumpo by layered sands in Long Waterhole, characterised there by frequent limnaeid shells, algal tubules and organic staining (Level D, Figure 11 in Bowler 1998). These three identical components occur in sandy clays of equivalent age at the toe of the Mungo lunette at the Walls of China Tourist Area, evidence of high carbonate precipitation, with molluscs grazing on microbial communities on aquatic plant surfaces.
The Arumpo lake phase is registered in Outer Arumpo by dates in the 27,600-25,300 year ago range (ANU-2207, N-1664, CAMS-1930). The absence of aquatic ages between 24,500 and 22,000 years ago is consistent with clay dune accretion on the Outer Arumpo dune at that time. This break in lake deposition is represented by the disconformity above the limnaeid-rich shell bed with microbial (algal) carbonates in Long Waterhole gully (Level E, Figure 11 in Bowler 1998).
High carbonate production would favour relatively warm conditions preceding descent into later cold conditions of the glacial maximum. Ages in the 24,500-27,000 year ago range are consistent with otolith and shell samples from Mungo and Outer Arumpo (Table 1, Figure 6B). This phase is tentatively assigned to 34,000-24,500 years ago, followed by subsequent
terra australis 34
Wind v water: Glacial maximum records from the Willandra Lakes 285
drying and clay dune accretion both at Mungo and on the main lunette at Outer Arumpo. The return of water heralded the next wet phase (Lower Zanci).
ZanciThe onset of Zanci flooding occurred before 20,000 years ago (OZB626, OZJ372). This
event is represented at Long Waterhole by the final transgressing, with beach sands containing Sphaerium shells (Level F, Figure 11 in Bowler 1998) disconformably overlying Arumpo deposits. Equivalent events are registered on the floor of Lake Mungo, where sands with Sphaerium overlie soil-cracked clays 1 m below the present surface, evident in a 3 m deep trench ( JC Trench, Figure 5). Shells dated from Shell Tank on the lake floor (N-1656, 17,600 years ago) probably suffer from soil carbonate contamination, providing a minimum age only. Unionid shell dates from Tysons Lake near Hatfield (N-1655, 20,300 years ago; N-2034, 22,000 years ago) help define the last arrival of freshwater in the wider region ca. 22,000-20,000 years ago. The filling stage of the Zanci cycle at Mungo is consistent with that chronology.
Dune buildingWhile ages of lacustrine environments are defined by dates from fish and shellfish, dune-
building ages must rely on organic or carbonate radiocarbon ages supported by OSL, as defined from earlier publications (Bowler 1971, 1998; Bowler et al. 1972, 2003). Important independent confirmatory evidence is now appearing from otolith isotope analyses. Results of in situ δ18O, Sr/Ca and 87Sr/86Sr measurements on five Golden Perch otoliths recovered from both surface middens and the lake floor suggest frequent drying out of Lake Mungo 19,200-20,400 years ago, and a major δ18O increase of 5‰ over nine years (Figure 9) indicates a rapid increase in salinity on a drying trend (Boljkovac 2009).
The close of the Zanci lacustral phase set the trigger for the next phase of pelletal clay dune building (PCD). A midden on the northern Mungo lunette (OZJ372, 20,400 years ago) represents shell harvesting approaching the closing stage of the lake (Figure 10). The overlying clay dune layer is stratigraphically continuous with the uppermost unit at Joulni, dated there on charcoal to 19,700 years ago (ANU-312). That estimate is further consistent with the shell/otolith age clusters in the Mungo record (19,200-20,400 years ago), where out of 26 samples, only the probably contaminated Shell Tank date is younger than 19,000 years ago. A simultaneous date on carbonate from the gypseous dune at Chibnalwood (ANU-320,
Zanci age lake sediments
Beach sands, gravels Arumpo age sedimentsLimnaeids shells common
Pelletal clay & sands
Quartz sand duneMussel shells
Shell midden Lake snails, Limnaeids
W E
Figure 10. Schematic diagram showing notional association between LGM Zanci age disconformably cut into Arumpo unit, with frequent limnaeid shells and microbial carbonates. Lower Zanci quartz dune deflated from beach sands (20,000 years ago) overlain by pelletal clay drying phase (19,000 years ago), as identified at Mungo. Mussel shell (midden) and fish harvesting appear closely associated with the transition, wet to dry at close of lake-full phase.
terra australis 34
Jim M. Bowler et al.286
19,800 years ago) would confirm contemporaneous dune formation between basins at that time (Figures 5 and 10).
Upstream, freshwater remained longer, leading to final drying of Mulurulu at 18,800 years ago. Deflation of sands from the eastern beach contributed to deposition of a final quartz sand cover contemporaneously with pelletal clay at Mungo and gypseous pelletal clay at Chibnalwood, Arumpo and Bulbugaroo, the inner basins within the Outer Arumpo system.
18
19
20
21
22
Human adaptation
Calcareous quartz sand
Pelletal clay (PCD 1)
Gypseous pelletal clay (PCD 2)
AGE(Ka) Mulurulu
MungoOuter Arumpo
Chibnalwood
Transition
zone
?Lower Zanci transgression
Upper Zanci drying
Mussel shells
Shell midden
Figure 11. Simplified stratigraphic diagram depicting the Lower to Upper Zanci transition between lakes, as on Figure 4. Interbedded sands and pelletal clays developed during lake level oscillations (A-A’, B-B’, C-C’) pass up at Mungo and Outer Arumpo into dominantly pelletal clays. Contraction to the inner basin permits saline groundwater to accelerate erosion, with deposition of gypseous clay dune at Chibnalwood (see Figure 4). At Mulurulu, waters continue to nourish sandy beaches, feeding quartz sand dunes into final lunette phase. Shell harvesting at Mungo (20,000 years ago) is continued upstream at Mulurulu after Mungo dried (19,000 years ago). People moved in response to changing water availability. Despite peak aridity, fish and shellfish continued to provided sustenance under diminishing resources.
Lacking salts necessary for pelletal clay formation, the final drying at Mulurulu did not produce the pelletal clay cover more characteristic of other lakes.
DiachroneityThe distribution of shell and otolith dates suggests drying of Lake Mungo at 19,000
years ago, compared with Garnpung at 18,400 years ago, with Lake Mulurulu and Leaghur in between. The drying relationship between Outer Arumpo, Mungo and Mulurulu is shown diagrammatically in Figure 11. The new data set permits a revision of the previous account, with construction of a new water level curve; the critical element involves the disappearance of water in Mungo by 19,000 years ago, coincident with dune building there, while water was clearly retained in Garnpung and Mulurulu until considerably later. The implications are two-fold: Firstly, this requires revision of the water level-dune building environmental synthesis curve. Secondly, nomenclature previously applied to events at this time requires modification.
Water level curveThis evidence requires amendment to the previous version of the Willandra Lakes water
level oscillation curve. The general pattern of this curve, modified from Bowler (1998) and shown in Figure 12, retains the Mungo, Arumpo and Zanci major cyclic events. The style of diachronic response identified here for the final drying cycle may well have had expression
terra australis 34
Wind v water: Glacial maximum records from the Willandra Lakes 287
between basins during earlier cyclic changes. However, the current resolution of field and age data do not permit specification of those changes. The emphasis here remains on clearer understanding of glacial maximum conditions.
The G notation in Figure 12 identifies the presence of specific gravels, indicators of high lake stand long enough to accumulate significant deposits. New stratigraphic analyses modify earlier usage in Bowler et al. (2003), the revision suggesting only a brief high lake phase coincident with Mungo I and III burials, an event insufficient to deposit an identifiable gravel signature. The event identified as G3 in Bowler et al. (2003) is now incorporated into the latter part of the G2 high lake phase.
In the construction of that curve, ages of early elements Lower to Upper Mungo were established by data drawn from earlier publications (Bowler 1971; Bowler et al. 1972). Some details of the younger Arumpo phase are clarified by the new data set. The main differences lie in two areas.
Firstly, in the time range 40,000-25,000 years ago, uncertainties remain in dating events of the Outer Arumpo lake and dune phases. In the version presented here, onset of the high lake phase represented by Level D in Long Waterhole gully (Figure 11 in Bowler 1998) and in the clays with carbonate tubules and limnaeids at Mungo Tourist site is moved towards the 30,000-28,000 year ago range. Until further work resolves these dating uncertainties, this correlation remains tentative.
Secondly, the more important revision to the curve involves the representation of the now complex and diachronic behaviour between basins in the final drying stage. This involves modification of the Zanci-Mulurulu anomaly. The tighter chronology presented here permits resolution of that period into discrete basin phases, with clay dune building progressing upstream, earliest at Outer Arumpo and later at Mulurulu (Figure 12). Although separated in time, these remain expressions of the same hydrologic event.
??
Years x 1000 (ka)10 20 30 40 50 60
G IV
G V
G III G II G I67m
65m
60m Lake �oor
Leaghur connection
Leaghur over�ow
Mungo I & III burials
Lowest artefacts
A
B
C
A’B’
C’
ZANCI ARUMPO MUNGOLowerLowerLower UpperUpperUpper
Lake levelsDune building
Figure 12. Lake level and dune formation summarising data mainly from Lake Mungo. Highest levels associated with gravels developed during high lake stands. LGM drying diachronous between basins A, B and C, representing progressive reduction in levels from Outer Arumpo to Mungo to Mulurulu respectively. A’, B’ and C’ deflation events from progressively drying basin floors. Clay dune A’ includes initial deposition on Outer Arumpo, with continued gypseous clay deflation from inner basins Chiblanwood, Inner Arumpo and Bulbugaroo.
terra australis 34
Jim M. Bowler et al.288
Nomenclature revisionThe availability of new dates, especially from a range of otolith sites, has clarified an
important aspect of the chronology. In so doing, it defines a new interpretation of events coinciding with, and to a large extent controlled by, climates of the Last Glacial Maximum.
In earlier interpretations, the drying of events at Mungo and Outer Arumpo were relegated to the Zanci unit, the period of major and final lunette construction. Dated to near 20,000 years ago, this event predated ages of midden shells at Mulurulu, implying a later lake filling event in that basin. Designated the Mulurulu Unit (Bowler 1998), that interpretation implied a complex response to glacial maximum conditions, major drying at Mungo on the one hand, followed immediately by filling of Mulurulu on the other, perhaps an unlikely combination of events during that climatic phase.
New dates now resolve the dilemma; there are no longer two discrete wet-dry events. Instead, they form part of a single complex, one in which controls are exerted as much by variations between basins as in the overall trend towards aridity.
In the Willandra system, the nature of the connected chain of lakes imposes a differential time control of filling and drying of each basin. This results in a diachronic relationship between specific events (Figure 11`). The diagrammatic water level curve (Figure 4) with seasonal-secular oscillations affects the three basins in different ways at different times.
The early Zanci high lake phase is followed by drying and clay dune development, the original Zanci dune building. In this revised interpretation, the two-stage wet-dry environment previously attributed to the Zanci dry and Mulurulu wet events are seen as evolutionary aspects of a single evolving phase. The reality now defines a single lateral change proceeding upstream, with different timing between basins. Thus, while Mulurulu was still full, the drying dune generation at Outer Arumpo occurred simultaneously with upstream flooding. Meanwhile, at Mungo, midway between the two, equivalent events occurred at intermediate times (Figure 12).
In this context, the former definition of a separate Mulurulu wet phase post-dating Zanci drying is no longer relevant. The wet-dry event is now seen as a continuum of a single cyclic change, a change coincident with events of the Last Glacial Maximum. The processes of drying and dune building were diachronic between basins rather than separate discrete events, as previously interpreted. A revision of the Zanci terminology is offered as the most appropriate amendment to the stratigraphic system (see Figure 12). The validity of the sandy Mulurulu Unit as a discrete mappable deposit lapses in favour of its incorporation as a member of the wider Zanci Unit, which, by precedence, is retained.
Climatic implications
A number of constraints limit the value of the Willandra data as a basis for quantitative climatic reconstructions (Williams et al. 1991). Firstly, this was an overflow system, thereby unable to define actual discharge volumes. Secondly, the Willandra Creek is just one of several distributary channels of the Lachlan downstream from Hillston. Despite that qualification, to simply maintain lake levels at overflow stage (an area exceeding 1000 km2) at present evaporation rates would require diversion of the entire Lachlan River. Although providing minimum discharge records only, the Willandra flood history provides the best record of changes from major streams draining the eastern highlands, an area critical to our understanding of southeastern Australia’s hydrologic and climatic change. In drying trends, episodes of lunette building, if correlating with regional linear dune expansion, have climatic implications beyond the confines of the Willandra system.
terra australis 34
Wind v water: Glacial maximum records from the Willandra Lakes 289
Aridity paradox: Lakes v desert dunesThe paradox of flooding in the northern basins simultaneously with clay dune building
involving massive transfer of dust and salt to the east raises important questions on the nature of glacial age aridity (Williams et al. 2001, 2009). While evidence of locally permanent water bodies is secure, the Willandra also registers regional evidence for simultaneous aridity. Two lines of evidence register the response of surrounding dunefields to major changes in water balance in regions away from major drainage systems. The first is the record of desert dust, Wüstenquarz – records visible in microscopic analyses of Mungo lunette sediments. The second involves advances of Mallee dunefields and their encroachment across lake margins on to basin floors, advances that not only involve reactivation of the now fossil dunefields, but equally, the loss of water in the lakes necessary to permit dune advance.
In published records from the Joulni area, the sequence of lake drying and dune development records a substantial increase in the Wüstenquarz component near 45,000 years ago (Bowler et al. 2003). Wüstenquarz is virtually absent from sediments in the 60,000-45,000 years ago range, remaining uniformly high from 45,000 years ago through Upper Mungo time, to near 32,000 years ago. This would indicate at least some reactivation of desert dunes upwind coincident with the reduction of water availability in the drying basins. In that sense, two independent measures of aridity are consistent, lending confidence to a picture of substantial environmental change at that time.
Approaching the glacial maximum, the evidence for accelerated dune activation becomes more visible. In the regional setting, large areas of mallee dunes extend from the Darling River in the west to lake shorelines in the east. As extensions of inland arid landforms, evidence of past expansion exists today on the western shoreline of several Willandra basins.
On the northwestern margin of Outer Arumpo, a substantial lobe of mallee dunes has transgressed across the cliffed margin to extend some 2.5 km on to the lake floor (Figure 2). The leading edge retains its irregular advance outline and shows no sign of trimming by waters. This event clearly occurred after drying of Outer Arumpo, an event associated with the Upper Zanci drying near 20,000 years ago. The advance of mallee dunes was then synchronous with the major clay and salt deflation involved in the production of the Chibnalwood, Inner Arumpo and Bulbugaroo lunettes (Figure 1). Simultaneously, on the western shoreline of Lake Garnpung, another lobe of broad dunefield also encroached a similar distance (ca. 2.5 km) across the shoreline but, unlike the Outer Arumpo example, this advance has been trimmed and cut back, a function of water in the basin. Dune encroachment across the western shorelines implies at least a low water level or dry basins. The trimming of advancing dunes in Garnpung offers two alternative explanations.
Firstly, short alternations of dry to wet lake conditions are consistent with the progressive but intermittent drying after 20,000 years ago. A brief dry interval with dune advance may then have been interrupted by a final pulse of water while Mulurulu was in final drying phase.
Alternatively, dune advance after final drying of Garnpung may have been trimmed by much later return of restricted floodwaters in post-glacial times.
In neither case did the Garnpung waters extend south to Outer Arumpo levels, where dune lobes retain their original advancing forms. In both cases, dune advance has been arrested on drying lake floors. Water and wind have combined to preserve this interaction between competing processes.
In summary, the lakes’ history provides a measure of time control on regional dune activity. Dune advance involves the loss of woodland vegetation cover, permitting massive erosion in mobile sands. In topographic form, the dunefield west of the Willandra, like those south of the Murray in Big Desert, retains patterns of advancing forms, now preserved as a virtually fossil sand sea. Now entirely stabilised by mallee vegetation, the genuine desert nature of these glacial
terra australis 34
Jim M. Bowler et al.290
maximum environments remain difficult for us to visualise today.
LGM paradox: Wind v water While defining relative ages of lake and dunefield changes on the one hand, the data
appear to be in conflict on the other. Desert dunes and saline gypseous lunettes advanced at 20,000-19,000 years ago while people upstream feasted on fish and shellfish. That paradox requires further analysis of controlling factors.
The two main actors evident on this LGM climatic stage, wind and water were operating, both modified by the further controlling agent temperature. While the role of wind and water is clearly evident in lake and dune behaviour, details of local temperature remain contentious.
Coincidence of maximum ice volume with lowest sea level would argue for major temperature reductions, a reconstruction consistent with 19,000 years ago Kosciuszko glacial advance (Barrows et al. 2004). Meanwhile, the abundance of fish and shellfish at Mungo (20,000 years ago) and Mulurulu (19,000 years ago) remains paradoxically inconsistent with locally cold temperatures.
In pointing to temperature constraints on fish spawning, Allen (1972) identified populations of Golden Perch surviving through the LGM as evidence that otolith abundance would seem to favour at least seasonally warm conditions. Coincidentally, distribution of mussel shells (Velesunio ambiguus) is dependent on transport by fish at the embryonic or glochidial stage. Isotopic analyses of 19,000 years ago Mulurulu mussel shells (Bowler in Shackleton’s lab, Cambridge, 1975) and by Douglas (1996) defined average changes of 3-4‰ between Mulurulu and modern shells of the same species collected upstream from Lake Cargelligo. If due to temperature alone, that magnitude would involve a temperature depression of some 9-12°C. Until the effects of glacial-age lake water composition can be uncoupled from the temperature effect, such isotopic data remain to be validated. From evidence at Lake George near Canberra, Galloway (1965) proposed glacial-age summer temperature reduction of as much as 9°C below present, an estimate in line with later analyses using eggshell racemization (Miller et al. 1997) approximating that implied by the isotopic evidence.
On the other hand, given the high Southern Hemisphere insolation at LGM time (Berger and Loutre 1991), the prospect of relatively warm inland temperatures coincident with glacial and periglacial environments in southern high altitudes remains a possibility inviting further evaluation. High carbonate production, as in the microbial carbonates of Arumpo time (30,000-25,000 years ago), would favour relatively high temperatures despite proximity to the LGM.
Decreased temperature, especially on montane catchments, exerted major controls on complexities of the LGM stage. Its influence on periglacial highland extent, increased catchment efficiency, amplified by vegetation loss and by its controls on evaporation and soil moisture balance had widespread effects. Competing agents, wind and water, operated under its overall influence. Clarification of that influence poses a major challenge for future workers.
Basin drying and occupation: Age differencesThe diachronous relationship in drying between the archaeologically barren Chibnalwood
lunette and that of Mungo is further reflected in two different aspects of sedimentology.Firstly, episodic variations in exposures of lake floors during drying leads to the development
of the pelletal clay phases (PCD 1 and PCD 2 in Figure 4). In Lake Mungo, the Upper Zanci dune unit consists of highly variable laminated sands and sandy clays with less frequent clay-rich laminae. This variability reflects expression of the transitional nature from lake-full to dry basin, a progressive rather than abrupt change in hydrologic status (Figure 11). Such variability reflects the shallow oscillations in A-A’ field of the water level model, Figure 4A.
Secondly, a major difference is reflected in the variation between the aeolian units of Mungo
terra australis 34
Wind v water: Glacial maximum records from the Willandra Lakes 291
and Chibnalwood. While Mungo continued to receive pulses of surface inflow, Chibnalwood, isolated within the confines of the already dry Outer Arumpo, was subject to discharge by saline groundwaters only.
The upper dune at Mungo is highly variable in mineralogy and texture. By contrast, the Chibnalwood sediments are dominantly gypseous clay, with a relatively low percentage of quartz sand, and maintain relatively uniform textures throughout. Isolated from the high variability of surface inflow, this is a reflection of the final, relative uniform nature of groundwater control.
The thickness of the Chibnalwood gypseous clay is additionally important in consideration of rates and times between events. With total relief from floor to crest of 30 m, the thickness on the depositional margin of the pelletal mantle exceeds 10 m (Figure 5). Assuming a depositional rate of 1 cm per year, a relatively rapid rate of erosion and deposition, the 10 m deposit would involve some 1000 years. Although only approximate, this is consistent with the inferred interval between drying of Mungo and Mulurulu. Thus, while the Chibnalwood and Mungo dunes were building, people continued to harvest on the shores of Mulurulu throughout that 1000-year interval, from near 19,000 to 18,000 years ago (Figure 11). This provides at least a notional estimate of the time involved in changing human patterns of occupation and exploitation of the final Willandra resources.
The dramatic emergence of human footprints on Garnpung’s western shore (Webb et al. 2005) has added new perspectives to the LGM occupation of the Willandra. Here, a small group of people left their footprints running and walking through saline mud ca. 19,000-23,000 years ago. The new picture reflects a regional movement, a progressive adaptation in which people may have followed the retreat of freshwaters up the drainage chain. This adaptation to the progressive drying trend reflects an earlier expression, with parallels in the records of the Mungo burials some 20,000 years earlier. The association there with increasing occupational density at the close of the Lower Mungo freshwater phase was interpreted as evidence for increased reliance on aquatic harvesting at times of regionally reduced surface waters (Bowler 1998). Corresponding to times of shallow water and increased salinity, these were precisely the environments favouring ease of fish and shellfish harvesting. This is the situation represented by the midden and otolith abundance in the closing stages of the Willandra lake environments.
Human Adaption
The people of the Willandra area occupied a region of natural system complexity, unparalleled by comparison with any other across southern Australia. The dominance of westerly winds, together with the array of dunes, lunettes and salt deflation they controlled, stood in direct competitive interaction with the dynamics of large stream discharge emanating from the snow-fed highland catchments in the southeast. Changing climatic balance at one time favoured massive stream discharge. At another, the balance gave way to colder drier climates and strong westerlies. If glacial maximum temperatures were reduced to anything like the 9°C suggested earlier, the effects on ecosystems and humans would be devastating. With much-reduced local rainfall, cold climates would be associated with extensive frost, and a much-reduced growing season, with impacts on both aquatic and terrestrial ecosystems. Golden Perch, the most frequent source of otoliths, favouring temperatures greater than 23°C (Lake 1967), would have been near their lowest limits of tolerance.
Human occupants, exposed to near freezing winters associated with strong winds in areas of little protective cover, were subject to very high levels of stress. Protective clothing and shelter construction would have been essential. Such harsh living conditions were perhaps ameliorated only by access to permanent water. It implies an adaptive ability difficult for us today to comprehend.
terra australis 34
Jim M. Bowler et al.292
The new evidence presented here qualifies some previous interpretations of human adaptation to the peak of Zanci aridity. The disappearance of water was formerly interpreted as cause for people abandoning the area and moving towards rivers as a more permanent water source (Bowler 1998). The absence of any archaeological material in the dozens of gullies on Chibnalwood lunette supported movement away from locally inhospitable deflating basins; however, the absence of occupation dates between 18,000 years ago and 21,000 years ago was also interpreted as limited sampling rather than an abandonment of the region ( Johnston and Clark 1998).
The 14C dates presented demonstrate an absence of archaeological evidence associated with freshwater exploitation between 20,500 years ago and 25,000 years ago, followed by renewed fishing and mussel collection from 20,500 years ago to the final drying stages of the Willandra at 17,500 years ago. Locally, comparisons with the archaeological record from lakes associated with the Darling River (Balme and Hope 1990; Balme 1995), ca. 100-150 km to the west and northwest of the Willandra Lakes, are revealing. Similar although somewhat earlier patterns of commencement and abandonment of lacustrine resources have been documented at Lake Tandou, where small freshwater shell middens date from 26,500 to 31,300 years ago. At the Teryawynia Lakes, Balme and Hope (1990) found Holocene middens 6800 to 8400 years ago followed a similar pattern to that now established for the Willandra: middens at the south of the drainage system were older than those upstream. Occupation of the lakes moved upstream as the system progressively dried. The concept of opportunistic exploitation of systems under stress finds support from independent lacustrine environments.
In other areas of Australia, the LGM witnessed archaeological patterns that indicate a restriction of foraging ranges, avoidance of high-risk environments and concentration on locally available resources within refuges (Smith 1989; Veth 1989; Hiscock 2008): territorial reorganisation (Hiscock 2008) was essential in the face of changing resource availability. In this national context, the Willandra Lakes may be viewed as a complex and variable refuge rather than a high-risk and abandoned environment; it offered watered environments that contracted north over time, particularly through the latter part of the LGM. Fishing people and mussel collectors were forced to follow the contracting waters. While we may speculate that people completely abandoned the dry and deflating lakes and their surrounds, this is difficult to confirm. Further investigation of the non-lacustrine archaeological record is required.
We have now a new and somewhat paradoxical cameo of people in a rapidly changing environment, one in which glacial cold was associated with increasing aridity. It was one in which downstream drying with massive deflation blasted clouds of dust and salt into the atmosphere. Meanwhile, simultaneously further upstream, fish and shellfish were being caught and eaten. It provides a new picture of glacial maximum environments, one in which wind and water interacted to display a new dynamic of environmental change, one in which land and people were involved in a whole mosaic of new accommodation. People moved upstream responding to progressive drying. They were adapting to changing patterns of ice-age environments with their feet.
Conclusions
1. The new account of flooding and drying, refined by new levels of dating precision, demonstrates the continuity of change across hydrologic gradients within this interconnected basin system. In so doing, the justification for the previous two-stage climatic subdivision (Zanci, Mulurulu) is resolved into a single Zanci stage where differential lag effects in a single drying cycle affect different basins at different times.
terra australis 34
Wind v water: Glacial maximum records from the Willandra Lakes 293
2. The data significantly amplify the nature of LGM environments. Widely regarded as the time of maximum aridity, that view must be modified to include two critical observations: (a) In southeastern Australia, montane catchments affected by glacial or periglacial processes, despite reduction in rainfall, carried significant water volumes even through the maximum phase of glacially reduced temperatures. Meanwhile, areas distant from or in dry downstream reaches of such streams underwent major instability, with intensive reactivation of both continental and lacustrine dune systems. (b) Despite the major reduction in available surface waters, groundwater levels remained high. This acted as a trigger accentuating erosive instability, especially in low-lying areas where seasonal groundwater discharge fuelled processes of salt crystallisation and instability.
3. The Willandra evidence provides a new window into human response to the adversity of diminishing resources. The picture is one of selective adjustment, small migrations upstream following the pattern of disappearing lakes. It further suggests opportunistic focus on those pockets, where falling water levels, associated with increased salinity, provided increased availability to shell and fish harvesting. Throughout the at least 1000 years that people survived upstream, massive erosion with clouds of dust and salt were blowing from downstream basins of Chibnalwood, Arumpo, Bulbugaroo and their equivalents elsewhere across huge regions of southern Australia.
4. Contemporaneously with glacial age depressed temperatures, accentuated by clouds of dust and salt from westerly winds, the fishing men and women of Mungo to Mulurulu stand as exemplary survivors of massive environmental change, a cameo not without relevance to humanity today.
Acknowledgements
The ground surface levelling presented in this paper was prepared by Dick Kernebone, surveyor for the NSW Western Lands Commission. Permission to quote unpublished radiocarbon ages on Willandra shells and otoliths was generously provided by John Kalish, Stewart Fallon, Fiona Bertuch and the late John Head. We acknowledge assistance of two anonymous referees, one of whom offered detailed constructive criticism providing improvements to the paper. Simon Haberle and Bruno David have been patient and supporting editors in the paper’s submission. In this dedication to A.P.K., we recall the delightful Pickwickian style he brought to entertain, enlighten and enliven a sometimes sleepy academia. We are grateful for the absence here of any pollen diagram!
Bibliography
Allen, H.A. 1972. Where the crow flies backwards: man and land in the Darling Basin. Unpublished PhD thesis, Department of Prehistory, Australian National University.
Balme, J. 1995. 30,000 years of fishery in western New South Wales. Archaeology in Oceania 30:1-21.
Balme, J. and Hope, J. 1990. Radiocarbon dates from midden sites in the lower Darling River area of western New South Wales. Archaeology in Oceania 32:85-101.
Barrows, T.T., Stone, J.O., Fifield, L.K. and Cresswell, R.G. 2001. Late Pleistocene glaciation
terra australis 34
Jim M. Bowler et al.294
of the Kosciuszko Massif, Snowy Mountains, Australia. Quaternary Research 55:179-189.Barrows, T.T., Stone, J.O. and Fifield, L.K. 2004. Exposure ages for Pleistocene periglacial
deposits in Australia. Quaternary Science Reviews 23:697-708. Berger, A. and Loutre, M.F. 1991. Insolation values for the climate of the last 10 million years.
Quaternary Science Reviews 10:297-317.Boljkovac, K. 2009. In situ SHRIMP δ18O and laser ablation ICP-MS Sr/Ca and 87Sr/86Sr
measurements in fossil otoliths for palaeoclimate reconstructions at the Willandra Lakes World Heritage Area. Unpublished BSc (Honours) thesis, Research School of Earth Sciences, Australian National University.
Bowler, J.M. 1967. Quaternary chronology of Goulburn Valley sediments and their correlation in southeastern Australia. Journal of the Geological Society of Australia 14(2):287-292.
Bowler, J.M. 1971. Pleistocene salinities and climatic change: Evidence from lakes and lunettes in southeastern Australia. In: Mulvaney, D.J. and Golson, J. (eds), Aboriginal man and environment in Australia, pp. 47-65. Canberra: ANU Press.
Bowler, J.M. 1973. Clay Dunes: Their occurrence, formation and environmental significance. Earth-science Reviews 9:315-338.
Bowler, J.M. 1978. Quaternary climate and tectonics in the evolution of the Riverine Plain, Southeastern Australia. In: Davies, J.L. and Williams, M.A.J. (eds), Landform Evolution in Australasia, pp. 70-112. Canberra: ANU Press.
Bowler, J.M. 1998. Willandra Lakes revisited: environmental framework for human occupation. Archaeology in Oceania 33:156-168.
Bowler, J.M. and Price, D.M. 1998. Luminscence dates and stratigraphic analysis at Lake Mungo: review and new perspectives. Archaeology in Oceania 33:120-155.
Bowler, J.M. 1999. Nekeeya Lunette Assessment Study: Geomorphology, origins and evolution of the Nekeeya sand lunette. Report to Aboriginal Affairs Victoria.
Bowler, J.M., Thorne, A.G. and Polach, H.A. 1972. Pleistocene man in Australia: age and significance of the Mungo skeleton. Nature 240:48-50.
Bowler, J.M., Jones, R., Allen, H. and Thorne, A.G. 1970. Pleistocene human remains from Australia: a living site and human cremation from Lake Mungo, western New South Wales. World Archaeology 2:39-60.
Bowler, J.M., Johnston, H., Olley, J.M., Prescott, J.R., Roberts, R.G., Shawcross, W. and Spooner, N.A. 2003. New ages for human occupation and climatic change at Lake Mungo, Australia. Nature 421:837-840.
Bourman, R.P., Prescott, J.R., Banerjee, D., Alley, N.F. and Buckman, S. 2010. Age and origin of alluvial sediments within and flanking the Mt Lofty Ranges, southern South Australia: a Late Quaternary archive of climate and environmental change. Australian Journal of Earth Sciences 57(2):175-192.
Bronk Ramsey, C. 2009. Bayesian analysis of radiocarbon dates. Radiocarbon, 51(1):337-360.Clark, P.M. 1987. Willandra Lakes World Heritage Area archaeological resources study.
Unpublished report, Western Lands Commission, New South Wales Department of Planning, Sydney.
Clark, P.U., Dyke, A.S., Shakun, J.D., Carlson, A.E., Clark, J., Wohlfarth, B., Mitrovica, J.X., Hostetler, S.W. and McCabe, A.M. 2009. The Last Glacial Maximum. Science 325:710-714.
Douglas, K. 1996. Land systems and stratigraphy of Lake Mulurulu: Examination of Quaternary palaeoenvironments. Unpublished BSc (Honours) thesis, School of Earth Sciences, University of Melbourne.
Galloway, R.W. 1965. Late Quaternary climates in Australia. Journal of Geology 73:603-18.Gillespie, R. 1997. Burnt and Unburnt Carbon: dating charcoal and burnt bone from the
terra australis 34
Wind v water: Glacial maximum records from the Willandra Lakes 295
Willandra Lakes, Australia. Radiocarbon 39(3):239-250.Gillespie, R. 1998. Alternative timescales: a critical review of Willandra Lakes dating, Australia.
Archaeology in Oceania 33:169-182. Gillespie, R., Bertuch, F. and Nicholas, W.A. (no date). Australian freshwater shells: further
radiocarbon and amino acid racemization studies. Mss in preparation.Hesse, P., Magee, J.W. and van der Kaars, S. 2004. Late Quaternary climates of the Australian
arid zone: a review. Quaternary International 118/119:87-102.Hiscock, P. 2008. Archaeology of Ancient Australia. Abingdon: Routledge.Johnson, C.N. and Brook, B.W. 2011. Reconstructing the dynamics of ancient human
populations from radiocarbon dates: 10,000 years of population growth in Australia. Proceedings of the Royal Society B doi:10.1098/rspb.2011.0343.
Johnston, H and Clark, P. 1998. Willandra Lakes archaeological investigations 1968-98. Archaeology in Oceania 33:105-119.
Kalish, J.M., Miller, G.H., Tuniz, C., Pritchard, J.C., Rosewater, A. and Lawson, E. 1997. Otoliths as recorders of palaeoenvironments: comparison of radiocarbon age and isoleucine epimerization in Pleistocene golden perch Macquaria ambigua otoliths from Willandra Lakes. In: Conference Handbook, Sixth Australasian Archaeometry Conference, Australian Museum, Sydney, 10-13 February 1997.
Kershaw, A.P. and Nanson, G.C. 1993. The last full glacial cycle in the Australian region. Global and Planetary Change 7:1-9.
Lake, J.S. 1967. Rearing experiments with five species of Australian freshwater fishes. 1. Inducement to spawning. Australian Journal of Marine & Freshwater Research 18:137-153.
Lambeck, K. and Chappell, J. 2001. Sea level change through the last glacial cycle. Science 292:679-686.
Magee, J.W., Bowler, J.M., Miller, G.H. and Williams, D.L.G. 1995. Stratigraphy, sedimentology, chronology and palaeohydrology of Quaternary lacustrine deposits at Madigan Gulf, Lake Eyre, South Australia. Palaeogeography, Palaeoclimatology, Palaeoecology 113:3-42.
Miller, G.H., Magee, J.W. and Jull, A.J.T. 1997. Low-latitude glacial cooling in the Southern Hemisphere from amino-acid racemization in emu eggshells. Nature 385:241-244.
Nanson, G.C., Price, D.M. and Short, S.A. 1992. Wetting and drying of Australia over the past 300 ka. Geology 20:791-794.
Page, K., Dare-Edwards, A., Nanson, G. and Price, D. 1994. Late Quaternary evolution of Lake Urana, New South Wales, Australia. Journal of Quaternary Science 9:44-57.
Reimer, P.J., Baillie, M.G.L., Bard, E., Bayliss, A., Beck, J.W., Blackwell, P.G., Bronk Ramsey, C., Buck, C.E., Burr, G.S., Edwards, R.L., Friedrich, M., Grootes, P.M., Guilderson, T.P., Hajdas, I., Heaton, T.J., Hogg, A.G., Hughen, K.A., Kaiser, K.F., Kromer, B., McCormac, F.G., Manning, S.W., Reimer, R.W., Richards, D.A., Southon, J.R., Talamo, S., Turney, C.S.M., van der Plicht, J. and Weyhenmeyer, C.E. 2009. IntCal09 and Marine09 radiocarbon age calibration curves, 0-50,000 years cal BP. Radiocarbon 51(4):1111-50.
Shawcross, W. 1998. Archaeological excavations at Mungo. Archaeology in Oceania 33:183-200.
Smith, M.A. 1989. The case for a resident human population in the Central Australian ranges during full glacial aridity. Archaeology in Oceania 24:93-105.
Stuiver, M. and Polach, H.A. 1977. Discussion: Reporting of 14C data. Radiocarbon 19:253-258.Stuiver, M., Reimer, P.J. and Reimer, R. 2010. CALIB Radiocarbon Calibration Version 6.0
(http://calib.qub.ac.uk/calib/ accessed May/June 2010).Surovell, T.A., Finley, J.B., Smith, G.M., Brantingham, P.J. and Kelly, R. 2009. Correcting
temporal frequency distributions for taphonomic bias. Journal of Archaeological Science 36:1715-1724.
terra australis 34
Jim M. Bowler et al.296
Veth, P. 1989. Islands in the interior: a model for the colonization of Australia’s arid zone. Archaeology in Oceania 24:81-92.
Webb, S., Cupper, M.L. and Robin, R. 2006. Pleistocene human footprints from Willandra Lakes, southeastern Australia. Journal of Human Evolution 50:405-413.
Williams, M.A.J., Cook, E., van der Kaars, S., Barrows, T., Shulmeister, J. and Kershaw, P. 2009. Glacial and deglacial climatic patterns in Australia and surrounding regions from 35,000 to 10,000 years ago reconstructed from terrestrial and near-shore proxy data. Quaternary Science Reviews 28:2398-2419.
Williams, M.A.J., De Deckker, P. Adamson, D.A. and Talbot, M.R. 1991. Episodic fluviatile, lacustrine and aeolian sedimentation in a late Quaternary desert margin system, central western New South Wales. In: Willams, M.A.J., de Deckker, P., Kershaw, A.P. (eds), The Cainozoic in Australia: A re-appraisal of the evidence, Special Publication No. 18, Geological Society of Australia Incorporated.
Williams, M.A.J., Prescott, J.R., Chappell, J., Adamson, D., Cock, B., Walker, K. and Gell, P. 2001. The enigma of a late Pleistocene wetland in the Flinders Ranges, South Australia. Quaternary International 83/85:129-144.