2015-16 School Accountability Report Card for Windmill Springs School Page 1 of 16 Windmill Springs School 2880 Aetna Way • San Jose CA, 95121 • (408) 363-5600 • Grades K-8 Zarpana Rietman, Principal [email protected]windmillsprings.fmsd.org 2015-16 School Accountability Report Card Published During the 2016-17 School Year Franklin-McKinley Elementary School District 645 Wool Creek Drive San Jose CA, 95112 (408) 283-6000 www.fmsd.org District Governing Board John Lindner, Board President George Sanchez, Board Vice President Thanh Tran, Board Clerk Omar Torres, Board Member Rudy Rodriguez, Board Member District Administration Juan Cruz Superintendent Megan Lamken Assistant Superintendent, Business Services Paula Boling Deputy Superintendent, Human Resources Dr. Stella Kemp Assistant Superintendent, Educational Services Dr. Tracy Rohlfing Director, State & Federal Projects & Assessment Karen Allard Director, Curriculum & Instruction Dr. Mariam Galvarin Director, Special Services Hung Nguyen Director, IT Services ---- ---- Principal’s Message Windmill Springs, a California Distinguished School located near the intersection of Capitol Expressway and McLaughlin Avenue, is one of 16 schools in the Franklin-McKinley School District and one of three K-8 schools. It is not uncommon for a student to spend his or her entire elementary and middle school career at Windmill Springs. Giving meaning to the creed, “It is not what we teach – it is what they learn,” the school focus is on learning. Staff maintain high standards and immerse students in authentic, engaging and rigorous curriculum. For those students who may not yet meet standards, staff provide focused, intense interventions; for those students who exceed standards, Windmill Spring offers meaningful, challenging enrichment. Through encouragement and modeling, Windmill Spring staff members challenge all students on the school campus to be respectful, compassionate, and global contributors. Many programs at Windmill Springs provide students with the opportunity to explore their potentials and develop positive character traits. Discipline is seen as an opportunity to teach students how to handle similar challenges in the future and communicate the expectation that students will change their behavior accordingly. Windmill Spring's goal is to provide a safe, meaningful, well-rounded educational experience that produces diligent, disciplined, compassionate and motivated young people who will make a positive impact in the world. A student who attends Windmill Springs will have achieved his or her academic potential such as: • Language skills of listening, speaking, reading and writing • Math skills of computation and problem solving • Critical thinking skills (the above skills will be integrated throughout the other curricular areas) A student who attends Windmill Springs will demonstrate acceptable social skills and behavior by: • Being safe, respectiul and responsible • Accepting differences • Demonstrating leadership qualities • Following rules of common courtesy A student who attends Windmill Springs will value being active and physically fit through: • Engaging in consistent, regular exercise • Demonstrating game skills • Exhibiting good sportsmanship A student who attends Windmill Springs will have an appreciation for fine arts evidenced by: • Participation in visual arts • Participation in performing arts • Having been exposed to some of the great works and masters A student who attends Windmill Springs will demonstrate computer skills in: • Keyboarding • Word processing • Internet research
Transcript
2015-16 School Accountability Report Card for Windmill Springs School Page 1 of 16
Windmill Springs School
2880 Aetna Way • San Jose CA, 95121 • (408) 363-5600 • Grades K-8 Zarpana Rietman, Principal [email protected]
windmillsprings.fmsd.org
2015-16 School Accountability Report Card
Published During the 2016-17 School Year
Franklin-McKinley Elementary School District
645 Wool Creek Drive San Jose CA, 95112
(408) 283-6000 www.fmsd.org
District Governing Board
John Lindner, Board President
George Sanchez, Board Vice President
Thanh Tran, Board Clerk
Omar Torres, Board Member
Rudy Rodriguez, Board Member
District Administration
Juan Cruz Superintendent
Megan Lamken Assistant Superintendent, Business
Services
Paula Boling Deputy Superintendent, Human
Resources
Dr. Stella Kemp Assistant Superintendent,
Educational Services
Dr. Tracy Rohlfing Director, State & Federal Projects
& Assessment
Karen Allard Director, Curriculum & Instruction
Dr. Mariam Galvarin Director, Special Services
Hung Nguyen Director, IT Services
---- ----
Principal’s Message Windmill Springs, a California Distinguished School located near the intersection of Capitol Expressway and McLaughlin Avenue, is one of 16 schools in the Franklin-McKinley School District and one of three K-8 schools. It is not uncommon for a student to spend his or her entire elementary and middle school career at Windmill Springs. Giving meaning to the creed, “It is not what we teach – it is what they learn,” the school focus is on learning. Staff maintain high standards and immerse students in authentic, engaging and rigorous curriculum. For those students who may not yet meet standards, staff provide focused, intense interventions; for those students who exceed standards, Windmill Spring offers meaningful, challenging enrichment. Through encouragement and modeling, Windmill Spring staff members challenge all students on the school campus to be respectful, compassionate, and global contributors. Many programs at Windmill Springs provide students with the opportunity to explore their potentials and develop positive character traits. Discipline is seen as an opportunity to teach students how to handle similar challenges in the future and communicate the expectation that students will change their behavior accordingly. Windmill Spring's goal is to provide a safe, meaningful, well-rounded educational experience that produces diligent, disciplined, compassionate and motivated young people who will make a positive impact in the world. A student who attends Windmill Springs will have achieved his or her academic potential such as: • Language skills of listening, speaking, reading and writing • Math skills of computation and problem solving • Critical thinking skills (the above skills will be integrated throughout the other curricular
areas) A student who attends Windmill Springs will demonstrate acceptable social skills and behavior by: • Being safe, respectiul and responsible • Accepting differences • Demonstrating leadership qualities • Following rules of common courtesy A student who attends Windmill Springs will value being active and physically fit through: • Engaging in consistent, regular exercise • Demonstrating game skills • Exhibiting good sportsmanship A student who attends Windmill Springs will have an appreciation for fine arts evidenced by: • Participation in visual arts • Participation in performing arts • Having been exposed to some of the great works and masters A student who attends Windmill Springs will demonstrate computer skills in: • Keyboarding • Word processing • Internet research
2015-16 School Accountability Report Card for Windmill Springs School Page 2 of 16
About the SARC By February 1 of each year, every school in California is required by state law to publish a School Accountability Report Card (SARC). The SARC contains information about the condition and performance of each California public school. Under the Local Control Funding Formula (LCFF) all local educational agencies (LEAs) are required to prepare a Local Control and Accountability Plan (LCAP), which describes how they intend to meet annual school-specific goals for all pupils, with specific activities to address state and local priorities. Additionally, data reported in an LCAP is to be consistent with data reported in the SARC. • For more information about SARC requirements, see the California
Department of Education (CDE) SARC Web page at http://www.cde.ca.gov/ta/ac/sa/.
• For more information about the LCFF or LCAP, see the CDE LCFF Web page at http://www.cde.ca.gov/fg/aa/lc/.
• For additional information about the school, parents/guardians and community members should contact the school principal or the district office.
2015-16 Student Enrollment by Grade Level
Grade Level Number of Students
Kindergarten 57
Grade 1 47
Grade 2 48
Grade 3 49
Grade 4 62
Grade 5 71
Grade 6 72
Grade 7 63
Grade 8 48
Total Enrollment 517
2015-16 Student Enrollment by Group
Group Percent of Total Enrollment
Black or African American 1.7
American Indian or Alaska Native 0.2
Asian 48.9
Filipino 3.7
Hispanic or Latino 41
Native Hawaiian or Pacific Islander 1.2
White 1.5
Two or More Races 1.7
Socioeconomically Disadvantaged 64
English Learners 39.5
Students with Disabilities 13
Foster Youth 0.8
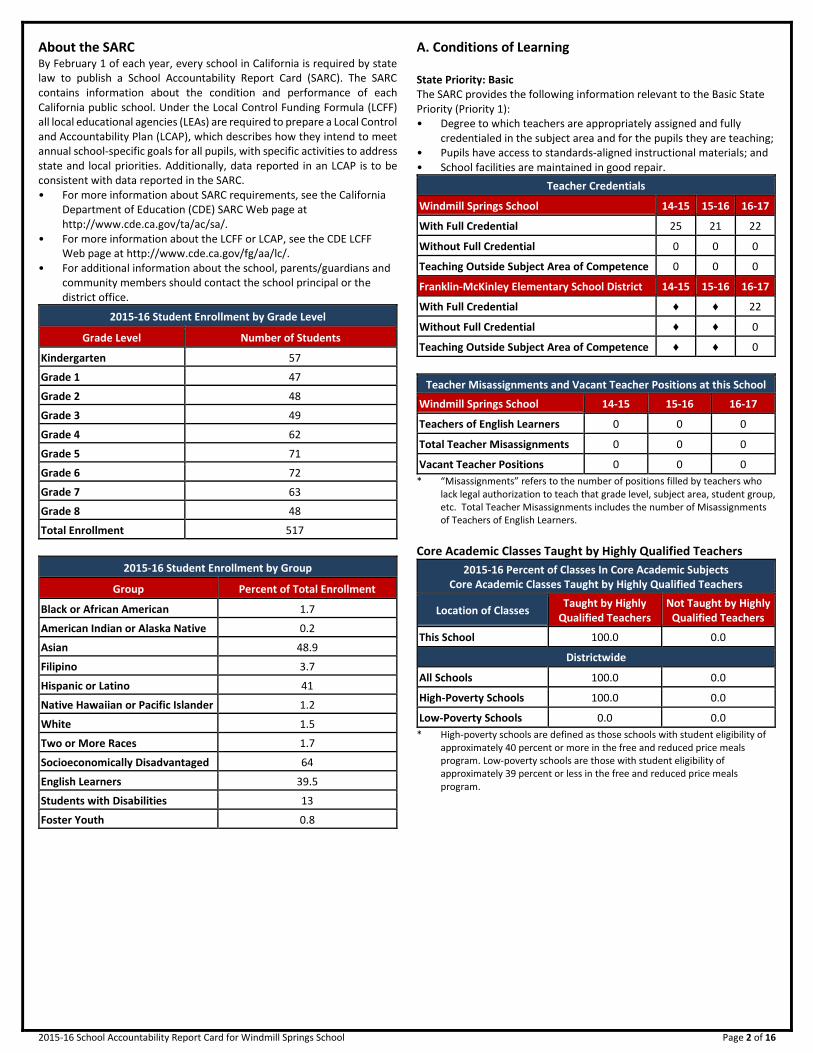
A. Conditions of Learning State Priority: Basic The SARC provides the following information relevant to the Basic State Priority (Priority 1): • Degree to which teachers are appropriately assigned and fully
credentialed in the subject area and for the pupils they are teaching; • Pupils have access to standards-aligned instructional materials; and • School facilities are maintained in good repair.
Teacher Credentials
Windmill Springs School 14-15 15-16 16-17
With Full Credential 25 21 22
Without Full Credential 0 0 0
Teaching Outside Subject Area of Competence 0 0 0
Franklin-McKinley Elementary School District 14-15 15-16 16-17
With Full Credential ♦ ♦ 22
Without Full Credential ♦ ♦ 0
Teaching Outside Subject Area of Competence ♦ ♦ 0
Teacher Misassignments and Vacant Teacher Positions at this School
Windmill Springs School 14-15 15-16 16-17
Teachers of English Learners 0 0 0
Total Teacher Misassignments 0 0 0
Vacant Teacher Positions 0 0 0
* “Misassignments” refers to the number of positions filled by teachers who lack legal authorization to teach that grade level, subject area, student group, etc. Total Teacher Misassignments includes the number of Misassignments of Teachers of English Learners.
Core Academic Classes Taught by Highly Qualified Teachers
2015-16 Percent of Classes In Core Academic Subjects Core Academic Classes Taught by Highly Qualified Teachers
Location of Classes Taught by Highly
Qualified Teachers Not Taught by Highly
Qualified Teachers
This School 100.0 0.0
Districtwide
All Schools 100.0 0.0
High-Poverty Schools 100.0 0.0
Low-Poverty Schools 0.0 0.0
* High-poverty schools are defined as those schools with student eligibility of approximately 40 percent or more in the free and reduced price meals program. Low-poverty schools are those with student eligibility of approximately 39 percent or less in the free and reduced price meals program.
2015-16 School Accountability Report Card for Windmill Springs School Page 3 of 16
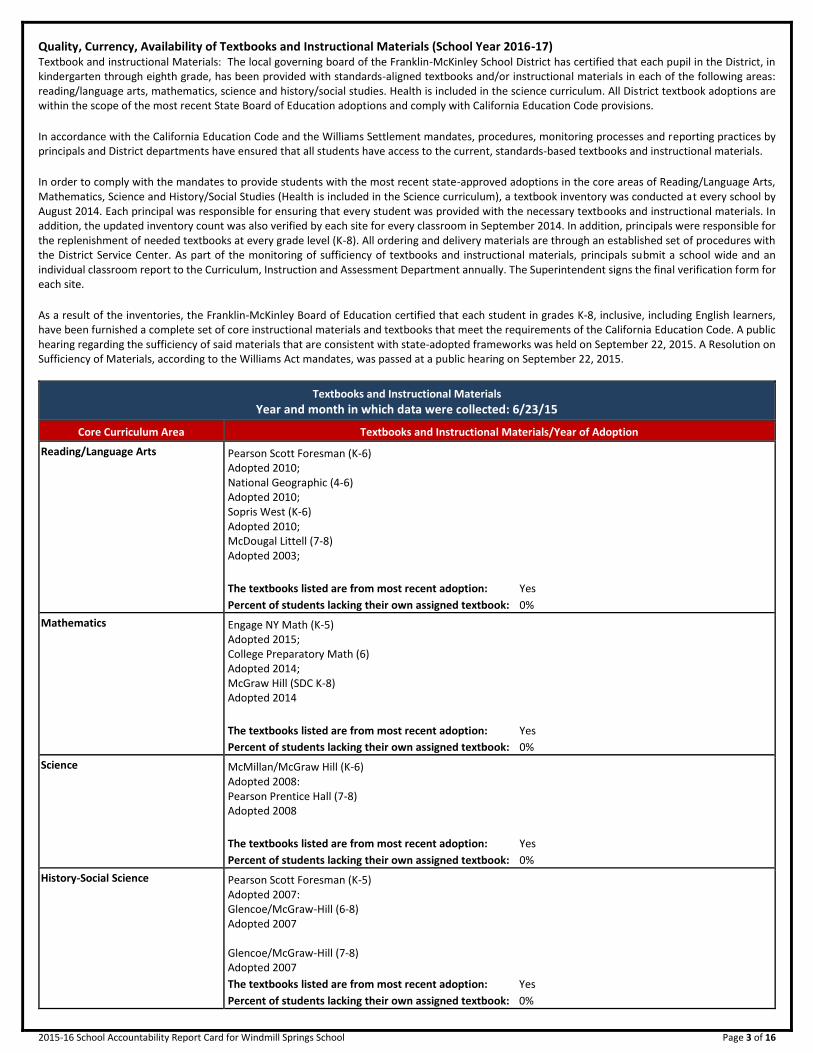
Quality, Currency, Availability of Textbooks and Instructional Materials (School Year 2016-17) Textbook and instructional Materials: The local governing board of the Franklin-McKinley School District has certified that each pupil in the District, in kindergarten through eighth grade, has been provided with standards-aligned textbooks and/or instructional materials in each of the following areas: reading/language arts, mathematics, science and history/social studies. Health is included in the science curriculum. All District textbook adoptions are within the scope of the most recent State Board of Education adoptions and comply with California Education Code provisions. In accordance with the California Education Code and the Williams Settlement mandates, procedures, monitoring processes and reporting practices by principals and District departments have ensured that all students have access to the current, standards-based textbooks and instructional materials. In order to comply with the mandates to provide students with the most recent state-approved adoptions in the core areas of Reading/Language Arts, Mathematics, Science and History/Social Studies (Health is included in the Science curriculum), a textbook inventory was conducted at every school by August 2014. Each principal was responsible for ensuring that every student was provided with the necessary textbooks and instructional materials. In addition, the updated inventory count was also verified by each site for every classroom in September 2014. In addition, principals were responsible for the replenishment of needed textbooks at every grade level (K-8). All ordering and delivery materials are through an established set of procedures with the District Service Center. As part of the monitoring of sufficiency of textbooks and instructional materials, principals submit a school wide and an individual classroom report to the Curriculum, Instruction and Assessment Department annually. The Superintendent signs the final verification form for each site. As a result of the inventories, the Franklin-McKinley Board of Education certified that each student in grades K-8, inclusive, including English learners, have been furnished a complete set of core instructional materials and textbooks that meet the requirements of the California Education Code. A public hearing regarding the sufficiency of said materials that are consistent with state-adopted frameworks was held on September 22, 2015. A Resolution on Sufficiency of Materials, according to the Williams Act mandates, was passed at a public hearing on September 22, 2015.
Textbooks and Instructional Materials
Year and month in which data were collected: 6/23/15
Core Curriculum Area Textbooks and Instructional Materials/Year of Adoption
Reading/Language Arts Pearson Scott Foresman (K-6) Adopted 2010; National Geographic (4-6) Adopted 2010; Sopris West (K-6) Adopted 2010; McDougal Littell (7-8) Adopted 2003;
The textbooks listed are from most recent adoption: Yes
Percent of students lacking their own assigned textbook: 0%
Mathematics Engage NY Math (K-5) Adopted 2015; College Preparatory Math (6) Adopted 2014; McGraw Hill (SDC K-8) Adopted 2014
The textbooks listed are from most recent adoption: Yes
Percent of students lacking their own assigned textbook: 0%
Science McMillan/McGraw Hill (K-6) Adopted 2008: Pearson Prentice Hall (7-8) Adopted 2008
The textbooks listed are from most recent adoption: Yes
Percent of students lacking their own assigned textbook: 0%
The textbooks listed are from most recent adoption: Yes
Percent of students lacking their own assigned textbook: 0%
2015-16 School Accountability Report Card for Windmill Springs School Page 4 of 16
School Facility Conditions and Planned Improvements (Most Recent Year) The main campus was built in 1984. It consists of 30 classrooms, a library, computer lab, and an administration building. The campus is considered in Fair condition. The site has two custodians, who clean the site on a daily basis. The morning custodian is on site from 6:30 a.m. to 3p.m., and the evening custodian’s hours are 2 to 10:30 p.m. In 2014 solar panels were installed on the campus. The campus will be going through Modernization in 2017/18 which will include, replacement of existing play structures, pour in place rubber mating, a new roof, new HVAC units, new LED lighting, reconfiguration of the library for better use by staff and students, upgrades to student and adult restrooms.
School Facility Good Repair Status (Most Recent Year) Year and month in which data were collected: 07/22/2016
System Inspected Repair Status Repair Needed and
Action Taken or Planned Good Fair Poor
Systems: Gas Leaks, Mechanical/HVAC, Sewer
X Clean dirty vents in Library. (Complete 04/17)
Interior: Interior Surfaces
X Paint water stained ceiling tiles in Admin, Multi-purpose Room, Conference Room, C2, C3, C4, C5, C6, C7, D1, D2, D4, and D7. (Complete 08/16) Replace broken/missing floor tiles in Unisex Restroom in Admin, Kitchen, and Office/Electrical Rooms. (Complete 08/16) Secure loose ceiling tiles in Conference Room. (Complete 09/16) Replace missing rubber molding in Library and P4 (Complete 09/16) Repair/treat chipping formica on counter in B6 and on cabinet doors in C7. (Complete 09/16) Repair broken cabinet in B6. (Complete 09/16) Repair broken wall tile in Boys' Restroom by end of B-wing. (Complete 09/16) Replace torn ceiling tiles in P2, broken in C3, C4, C6, C7, and D7. (Complete 09/16) Remove missing pencil sharpener cover in C2. (Complete 01/17) Remove torn wall paper in P4. (Complete 09/16)
X Remove multi-stacked objects above six feet in B4, C2, C6, C7, D3, and D4. (Complete 01/17) Clear/remove dead black widow's egg sacks in C4. (Complete 01/17)
2015-16 School Accountability Report Card for Windmill Springs School Page 5 of 16
School Facility Good Repair Status (Most Recent Year) Year and month in which data were collected: 07/22/2016
System Inspected Repair Status Repair Needed and
Action Taken or Planned Good Fair Poor
Electrical: Electrical
X Replace broken/missing light diffuser/panel/cover in Office and Staff Workroom. (Complete 09/16) Clear blocked access to door to Electrical Room and electrical panel (blocked by books). (Complete 01/17) Repair non-working exhaust fan in Boys and Girls' Restroom outside of Library and B4. (Complete 09/16) Repair/replace one light ballast in B2, one in B7, two in P6, one flickering in P5, one in P4, one in Staff Workroom, one in D1, and one in D2. (Complete 09/16) Replace missing electrical cover in B5, interior and exterior outlet covers for P7, P5. (Complete 09/16) Secure loose switch in B8. (Complete 08/16) Remove three surge protectors daisy-chained together in B8. (Complete 01/17) Replace broken switch plate in C2. (Complete 08/16) Secure loose electrical conduit from wall in C7. (Complete 08/16) Replace one missing ethernet cover in D1. (Complete 01/17)
Restrooms/Fountains: Restrooms, Sinks/ Fountains
X Adjust water pressure for no flow in faucet in Boys' Restroom by Multi-purpose Room, Boys' Restroom outside of Library, one faucet with no flow in B1, no flow in Girls' Restroom by end of B-wing, and low flow faucet in C7. (Complete 09/16) Secure loose base in drinking fountain in B2, drinking fountain and faucet in Restroom in B4 . (Complete 09/16) Repair leaking toilet when flushed in P1. (Complete 09/16) Repair constantly running toilet in P1. (Complete 09/16)
Safety: Fire Safety, Hazardous Materials
X Remove plug-in candle warmer in Principal Office and D4. (Complete 01/17)
2015-16 School Accountability Report Card for Windmill Springs School Page 6 of 16
School Facility Good Repair Status (Most Recent Year) Year and month in which data were collected: 07/22/2016
System Inspected Repair Status Repair Needed and
Action Taken or Planned Good Fair Poor
Remove improperly stored cleaning supplies in B5, B7, B8, and C1. (Complete 01/17) Repair/replace broken fire extinguisher glass in B6. (Complete 01/17) Remove/repaint peeling paint on fascia board for C7. (Complete 09/16)
X Missing window screens will not be replaced for P1, P2, P3, P7, P6, P5, P4, and Staff Workroom. (Completed 07/16) Repair chipping cement exposing rusted rebar by Girls' Restroom at end of B-wing. (Complete 09/16) Remove trip hazard at ramp/asphalt seam by P2 and Play Courts. (Complete 010/16) Redo peeling skid paint on ramp for P2, missing for P3. (Complete 08/16) Repair dry rot on ramp for P3, rusted for P6, P5. (Complete 08/16) Repair broken window and remove broken glass on floor in D3. (Completed 08/16)
Overall Rating Exemplary Good Fair Poor
---------- X
2015-16 School Accountability Report Card for Windmill Springs School Page 7 of 16
B. Pupil Outcomes
State Priority: Pupil Achievement The SARC provides the following information relevant to the State priority: Pupil Achievement (Priority 4): • Statewide assessments (i.e., California Assessment of Student
Performance and Progress [CAASPP] System, which includes the Smarter Balanced Summative Assessments for students in the general education population and the California Alternate Assessments [CAAs] for English language arts/literacy [ELA] and mathematics given in grades three through eight and grade eleven. The CAAs have replaced the California Alternate Performance Assessment [CAPA] for ELA and mathematics, which were eliminated in 2015. Only eligible students may participate in the administration of the CAAs. CAA items are aligned with alternate achievement standards, which are linked with the Common Core State Standards [CCSS] for students with significant cognitive disabilities); and
• The percentage of students who have successfully completed courses
that satisfy the requirements for entrance to the University of California and the California State University, or career technical education sequences or programs of study
2015-16 CAASPP Results for All Students
Subject
Percent of Students Meeting or Exceeding the State Standards (grades 3-8 and 11)
School District State
14-15 15-16 14-15 15-16 14-15 15-16
ELA 41 52 41 48 44 48
Math 40 47 37 41 34 36
* Percentages are not calculated when the number of students tested is ten or less, either because the number of students in this category is too small for statistical accuracy or to protect student privacy.
CAASPP Results for All Students - Three-Year Comparison
Subject
Percent of Students Scoring at Proficient or Advanced (meeting or exceeding the state standards)
* Science test results include California Standards Tests (CSTs), California Modified Assessment (CMA), and California Alternate Performance Assessment (CAPA) in grades five, eight, and ten. Scores are not shown when the number of students tested is ten or less, either because the number of students in this category is too small for statistical accuracy or to protect student privacy.
Grade Level
2015-16 Percent of Students Meeting Fitness Standards
4 of 6 5 of 6 6 of 6
---5--- 16.4 26.9 10.4
---7--- 24.1 5.2 1.7
* Percentages are not calculated when the number of students tested is ten or less, either because the number of students in this category is too small for statistical accuracy or to protect student privacy.
2015-16 CAASPP Results by Student Group
Science (grades 5, 8, and 10)
Group Number of Students Percent of Students
Enrolled with Valid Scores w/ Valid Scores Proficient or Advanced
All Students 114 113 99.1 48.7
Male 66 65 98.5 55.4
Female 48 48 100.0 39.6
Asian 67 67 100.0 62.7
Hispanic or Latino 37 36 97.3 30.6
Socioeconomically Disadvantaged 77 76 98.7 43.4
English Learners 31 31 100.0 25.8
Students with Disabilities 18 18 100.0 61.1
* Science test results include CSTs, CMA, and CAPA in grades five, eight, and ten. The “Proficient or Advanced” is calculated by taking the total number of students who scored at Proficient or Advanced on the science assessment divided by the total number of students with valid scores. Scores are not shown when the number of students tested is ten or less, either because the number of students in this category is too small for statistical accuracy or to protect student privacy.
2015-16 School Accountability Report Card for Windmill Springs School Page 8 of 16
School Year 2015-16 CAASPP Assessment Results - English Language Arts (ELA) Disaggregated by Student Groups, Grades Three through Eight and Eleven
Student Group Grade
Number of Students Percent of Students
Enrolled Tested Tested Standard Met or
Exceeded
All Students 3 49 48 98.0 37.5
4 65 64 98.5 53.1
5 69 67 97.1 53.7
6 68 68 100.0 57.4
7 61 60 98.4 48.3
8 45 45 100.0 57.8
Male 3 23 23 100.0 47.8
4 28 27 96.4 40.7
5 40 39 97.5 56.4
6 38 38 100.0 44.7
7 31 31 100.0 48.4
8 26 26 100.0 61.5
Female 3 26 25 96.2 28.0
4 37 37 100.0 62.2
5 29 28 96.5 50.0
6 30 30 100.0 73.3
7 30 29 96.7 48.3
8 19 19 100.0 52.6
Black or African American 3 -- -- -- --
4 -- -- -- --
5 -- -- -- --
7 -- -- -- --
8 -- -- -- --
American Indian or Alaska Native 4 -- -- -- --
Asian 3 20 19 95.0 57.9
4 34 33 97.1 63.6
5 39 39 100.0 66.7
6 39 39 100.0 71.8
7 29 29 100.0 51.7
8 28 28 100.0 67.9
Filipino 3 -- -- -- --
4 -- -- -- --
5 -- -- -- --
7 -- -- -- --
8 -- -- -- --
2015-16 School Accountability Report Card for Windmill Springs School Page 9 of 16
School Year 2015-16 CAASPP Assessment Results - English Language Arts (ELA) Disaggregated by Student Groups, Grades Three through Eight and Eleven
2015-16 School Accountability Report Card for Windmill Springs School Page 10 of 16
School Year 2015-16 CAASPP Assessment Results - English Language Arts (ELA) Disaggregated by Student Groups, Grades Three through Eight and Eleven
Student Group Grade
Number of Students Percent of Students
Enrolled Tested Tested Standard Met or
Exceeded
Students Receiving Migrant Education Services
7 -- -- -- --
Foster Youth 3 -- -- -- --
4 -- -- -- --
5 -- -- -- --
6 -- -- -- --
7 -- -- -- --
8 -- -- -- --
ELA test results include the Smarter Balanced Summative Assessment and the CAA. The “Percent Met or Exceeded” is calculated by taking the total number of students who met or exceeded the standard on the Smarter Balanced Summative Assessment plus the total number of students who met the standard on the CAAs divided by the total number of students who participated in both assessments. Double dashes (--) appear in the table when the number of students is ten or less, either because the number of students in this category is too small for statistical accuracy or to protect student privacy. The number of students tested includes all students who participated in the test whether they received a score or not; however, the number of students tested is not the number that was used to calculate the achievement level percentages. The achievement level percentages are calculated using only students who received scores.
School Year 2015-16 CAASPP Assessment Results - Mathematics Disaggregated by Student Groups, Grades Three through Eight and Eleven
Student Group Grade
Number of Students Percent of Students
Enrolled Tested Tested Standard Met or
Exceeded
All Students 3 49 48 98.0 41.7
4 65 64 98.5 51.6
5 69 67 97.1 47.8
6 68 68 100.0 48.5
7 61 60 98.4 50.0
8 45 45 100.0 35.6
Male 3 23 23 100.0 56.5
4 28 27 96.4 55.6
5 40 39 97.5 53.9
6 38 38 100.0 44.7
7 31 31 100.0 61.3
8 26 26 100.0 34.6
Female 3 26 25 96.2 28.0
4 37 37 100.0 48.6
5 29 28 96.5 39.3
6 30 30 100.0 53.3
7 30 29 96.7 37.9
8 19 19 100.0 36.8
2015-16 School Accountability Report Card for Windmill Springs School Page 11 of 16
School Year 2015-16 CAASPP Assessment Results - Mathematics Disaggregated by Student Groups, Grades Three through Eight and Eleven
Student Group Grade
Number of Students Percent of Students
Enrolled Tested Tested Standard Met or
Exceeded
Black or African American 3 -- -- -- --
4 -- -- -- --
5 -- -- -- --
7 -- -- -- --
8 -- -- -- --
American Indian or Alaska Native 4 -- -- -- --
Asian 3 20 19 95.0 79.0
4 34 33 97.1 66.7
5 39 39 100.0 69.2
6 39 39 100.0 66.7
7 29 29 100.0 65.5
8 28 28 100.0 53.6
Filipino 3 -- -- -- --
4 -- -- -- --
5 -- -- -- --
7 -- -- -- --
8 -- -- -- --
Hispanic or Latino 3 22 22 100.0 18.2
4 23 23 100.0 26.1
5 25 23 92.0 21.7
6 27 27 100.0 22.2
7 26 25 96.2 32.0
8 12 12 100.0 8.3
Native Hawaiian or Pacific Islander 3 -- -- -- --
4 -- -- -- --
6 -- -- -- --
7 -- -- -- --
8 -- -- -- --
White 3 -- -- -- --
5 -- -- -- --
6 -- -- -- --
8 -- -- -- --
Two or More Races 3 -- -- -- --
4 -- -- -- --
5 -- -- -- --
7 -- -- -- --
2015-16 School Accountability Report Card for Windmill Springs School Page 12 of 16
School Year 2015-16 CAASPP Assessment Results - Mathematics Disaggregated by Student Groups, Grades Three through Eight and Eleven
Mathematics test results include the Smarter Balanced Summative Assessment and the CAA. The “Percent Met or Exceeded” is calculated by taking the total number of students who met or exceeded the standard on the Smarter Balanced Summative Assessment plus the total number of students who met the standard on the CAAs divided by the total number of students who participated in both assessments. Double dashes (--) appear in the table when the number of students is ten or less, either because the number of students in this category is too small for statistical accuracy or to protect student privacy. The number of students tested includes all students who participated in the test whether they received a score or not; however, the number of students tested is not the number that was used to calculate the achievement level percentages. The achievement level percentages are calculated using only students who received scores.
2015-16 School Accountability Report Card for Windmill Springs School Page 13 of 16
C. Engagement
State Priority: Parental Involvement The SARC provides the following information relevant to the Parental Involvement State Priority (Priority 3): • Efforts the school district makes to seek parent input in making decisions for the school district and each schoolsite. Opportunities for Parental Involvement (School Year 2016-17) Parents, teachers and the administration work together to support maximum parent involvement at Windmill Springs. To promote communication among all parent groups, parents participate in the English Learners Advisory Committee, District Advisory Committee, School Site Council, as volunteers in classrooms, and as part of the newly reorganized Home and School Partnership. The Principal’s Newsletier in English, Spanish and Vietnamese is posted on the school website at the beginning of each month. The school provides translation in Spanish and Vietnamese for parents upon registration and during parent teacher conferences. Parents attend conferences with their child’s teacher in November and March. Parents are encouraged to attend orientation programs, parent meetings and other school activities. The “Meet the Teacher Night,” Family BBQ, Volunteers’ Reception, monthly Cafecitos and other activities foster and highlight parent support and community involvement. We invite parents to visit their child’s classroom and to join us as a volunteer either in the classroom or in some other capacity around the school. For more information on how to be involved, please contact Zarpana Rietman, Principal, at (408) 363-5600 or [email protected]
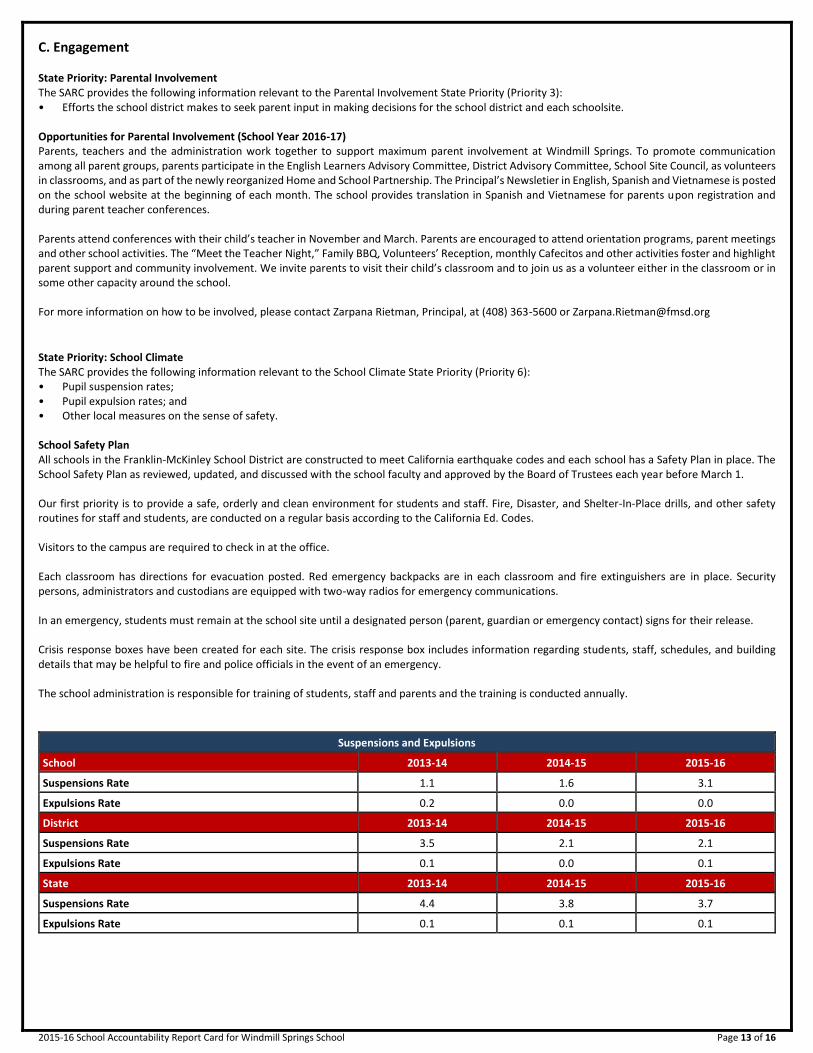
State Priority: School Climate The SARC provides the following information relevant to the School Climate State Priority (Priority 6): • Pupil suspension rates; • Pupil expulsion rates; and • Other local measures on the sense of safety. School Safety Plan All schools in the Franklin-McKinley School District are constructed to meet California earthquake codes and each school has a Safety Plan in place. The School Safety Plan as reviewed, updated, and discussed with the school faculty and approved by the Board of Trustees each year before March 1. Our first priority is to provide a safe, orderly and clean environment for students and staff. Fire, Disaster, and Shelter-In-Place drills, and other safety routines for staff and students, are conducted on a regular basis according to the California Ed. Codes. Visitors to the campus are required to check in at the office. Each classroom has directions for evacuation posted. Red emergency backpacks are in each classroom and fire extinguishers are in place. Security persons, administrators and custodians are equipped with two-way radios for emergency communications. In an emergency, students must remain at the school site until a designated person (parent, guardian or emergency contact) signs for their release. Crisis response boxes have been created for each site. The crisis response box includes information regarding students, staff, schedules, and building details that may be helpful to fire and police officials in the event of an emergency. The school administration is responsible for training of students, staff and parents and the training is conducted annually.
Suspensions and Expulsions
School 2013-14 2014-15 2015-16
Suspensions Rate 1.1 1.6 3.1
Expulsions Rate 0.2 0.0 0.0
District 2013-14 2014-15 2015-16
Suspensions Rate 3.5 2.1 2.1
Expulsions Rate 0.1 0.0 0.1
State 2013-14 2014-15 2015-16
Suspensions Rate 4.4 3.8 3.7
Expulsions Rate 0.1 0.1 0.1
2015-16 School Accountability Report Card for Windmill Springs School Page 14 of 16
D. Other SARC Information
The information in this section is required to be in the SARC but is not included in the state priorities for LCFF.
2016-17 Federal Intervention Program
Indicator School District
Program Improvement Status Not in PI In PI
First Year of Program Improvement 2004-2005
Year in Program Improvement Year 3
Number of Schools Currently in Program Improvement 12
Percent of Schools Currently in Program Improvement 54.5
Academic Counselors and Other Support Staff at this School
Number of Full-Time Equivalent (FTE)
Academic Counselor------- 0.0
Counselor (Social/Behavioral or Career Development) 0.0
Library Media Teacher (Librarian) 0.0
Library Media Services Staff (Paraprofessional) 1.0
Psychologist------- .500
Social Worker------- 0.0
Nurse------- .125
Speech/Language/Hearing Specialist 1.00
Resource Specialist------- 0.0
Other------- 0.00
Average Number of Students per Staff Member
Academic Counselor------- * One Full Time Equivalent (FTE) equals one staff member working full time;
one FTE could also represent two staff members who each work 50 percent of full time.
Average Class Size and Class Size Distribution (Elementary)
* Number of classes indicates how many classrooms fall into each size category (a range of total students per classroom). At the secondary school level, this information is reported by subject area rather than grade level.
2016-17 School Accountability Report Card for Windmill Springs School Page 15 of 16
Professional Development provided for Teachers Our professional development consists of a variety of opportunities for teachers and administrators to deepen their understanding of best practices and build capacity to meet the needs of our students. We provide these opportunities in the context of job embedded learning experiences, usually with colleagues, coupled with support for implementation. This model is consistent with Professional Learning Communities (PLCs), which maximizes opportunities for collaboration with a focus on student learning. As part of the growth process, opportunities for training and staff development are provided at the district and individual school sites to administrators, teachers, and classified staff. After analyzing district data, it was evident that FMSD students were struggling in reading. Many students were not proficient in reading by the end of third grade, and middle school adolescents were struggling to comprehend and analyze text. Throughout the school year, our Curriculum Support Specialists (CSS) led ongoing presentations based on best reading practices and instructional approaches. Topics included close reading, reciprocal teaching, higher level questioning and collaborative conversations. After workshops, CSSs helped teachers implement the taught content by planning lessons, modeling strategies and providing feedback. Several FMSD campuses also worked with Partners in School Innovation, (PSI) a non-profit organization that accelerates, strengthens and sustains improved teaching, learning and achievement in public schools and districts. Working side-by-side, schools developed best practices, systems for professional learning, and focused on improving their core instructional program. PSI intensively supported schools and helped plan and implement productive Instructional Leadership Teams (ILTs) where teacher-leaders and site administrator's set goals for student learning and collaborated regularly to close the achievement gap at their sites. Several principals, curriculum support specialists and ILT members also had the opportunity to work one-on-one with a National consultant from the International Center for Leadership Education (ICLE). Four times a year, the consultant worked with schools to improve classroom instruction. Using the ICLE Collaborative Instructional Review rubric, walkthrough teams visited classrooms and gathered concrete data focused on rigorous, relevant and student engagement. Results were shared and discussed with staff members and as a result positive academic changes took place in classrooms. To align systems at the school and district level, district administrators also participated in site walkthrough visits. Once a week, district leaders visited school sites and provided feedback to ILT teams. Through this process, a culture of collaboration developed and follow-up conversations focused on what high-quality instruction looks like in a 21st century classroom. This approach created a shared practice and understanding of observing, discussing and analyzing learning and teaching. Our Curriculum Support Specialists continued to attend quality professional development sessions focused on based on coaching. CSSs attended Cognitive Coaching, Facilitating Professional Learning Communities and the Art of Coaching workshops. These workshops helped our CSSs To promote 21st Century Teaching and Learning FMSD envisions an active learning environment where technology supports students in their preparation for an increasingly connected and digital world. To support this vision, several teachers attended a variety if hands-on professional development workshops including Project Based Learning, iPad integration, teaching apps, MacBook training, Google Classroom and personalized learning. These trainings have helped teachers create innovative opportunities for students to create, think critically, communicate, collaborate and ultimately prepare them to become lifelong, global learners. FMSD Curriculum Support Specialists support professional development sessions. They attend and lead multiple trainings throughout the school year. To support implementation, they coach and support their colleagues in and outside the classroom and have full coaching cycles that guide their work. To ensure our CSSs are using the best research based coaching strategies, they have attending The Art of Coaching, Cognitive Coaching and PLC Facilitation workshops. Finally, professional development opportunities do no stop when school ends. Throughout the summer and during school breaks teachers had the opportunity to attend a variety of professional development sessions that aligned to district initiatives. These trainings provided additional professional growth and supported teachers as they continued to close the achievement gap in Franklin – McKinley.
2015-16 School Accountability Report Card for Windmill Springs School Page 16 of 16
FY 2014-15 Teacher and Administrative Salaries
Category District Amount
State Average for Districts In Same
Category
Beginning Teacher Salary $47,266 $44,573
Mid-Range Teacher Salary $81,708 $72,868
Highest Teacher Salary $95,546 $92,972
Average Principal Salary (ES) $111,353 $116,229
Average Principal Salary (MS) $121,952 $119,596
Average Principal Salary (HS) $121,883
Superintendent Salary $216,000 $201,784
Percent of District Budget
Teacher Salaries 40% 39%
Administrative Salaries 6% 5% * For detailed information on salaries, see the CDE Certificated Salaries &
Benefits webpage at www.cde.ca.gov/ds/fd/cs/.
FY 2014-15 Expenditures Per Pupil and School Site Teacher Salaries
Level Expenditures Per Pupil Average
Teacher Salary Total Restricted Unrestricted
School Site-------
$5,278 $1,088 $4,191 $77,098
District-------
♦ ♦ $5,154 $80,675
State------- ♦ ♦ $5,677 $75,137
Percent Difference: School Site/District -18.7 -1.0
Percent Difference: School Site/ State -21.6 5.6
* Cells with ♦ do not require data.
Types of Services Funded
The following is a list of Federal and State funded programs that are provided to students at Franklin-McKinley School District:
• Title I (Basic Grant) • Title II (Teacher & Principal Training and Recruiting) • Title III (for Limited English Proficient Students) • After School Education and Safety Program (ASES) • Beginning Teacher Support and Assessment (BTSA) • Hourly Programs (extended day/year education) • Local Control Funding Formula (LCFF) • Special Education • Starting Smart and Strong Grant • National School Lunch Program
DataQuest DataQuest is an online data tool located on the CDE DataQuest Web page at http://dq.cde.ca.gov/dataquest/ that contains additional information about this school and comparisons of the school to the district and the county. Specifically, DataQuest is a dynamic system that provides reports for accountability (e.g., test data, enrollment, high school graduates, dropouts, course enrollments, staffing, and data regarding English learners).
Internet Access Internet access is available at public libraries and other locations that are publicly accessible (e.g., the California State Library). Access to the Internet at libraries and public locations is generally provided on a first-come, first-served basis. Other use restrictions may include the hours of operation, the length of time that a workstation may be used (depending on availability), the types of software programs available on a workstation, and the ability to print documents.