20
Windows User-Mode Debugging Sisimon E S
| Date post: | 05-Sep-2014 |
| Category: |
Documents |
| Upload: | sisimon-soman |
| View: | 594 times |
| Download: | 3 times |

Windows User-Mode Debugging
Sisimon E S

Agenda
• Windows concepts
• Stack Frames
• WinDBG setup
• Analyze a simple crash
• WinDBG commands
• Analyze an IMA crash from customer

Windows User mode concepts
• Process, Thread, process environment block (PEB), thread environment block (TEB).
• Exe, Dll, PE format.• Monolithic kernels and micro-kernels.• Image File Execution Option.• Win32 subsystem, Windows Executive, Kernel,
Session Manager (Smss) , Winlogon, SCM,…..• WinDBG – The powerful tool to debug from user
to kernel mode..


TEB
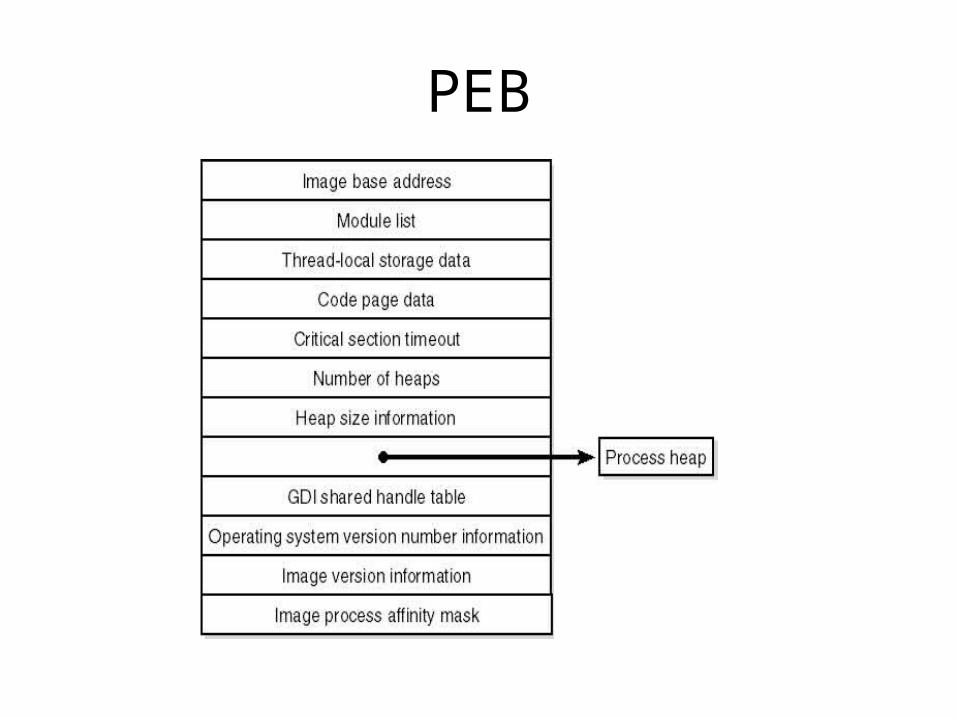
PEB
How to setup WinDBG
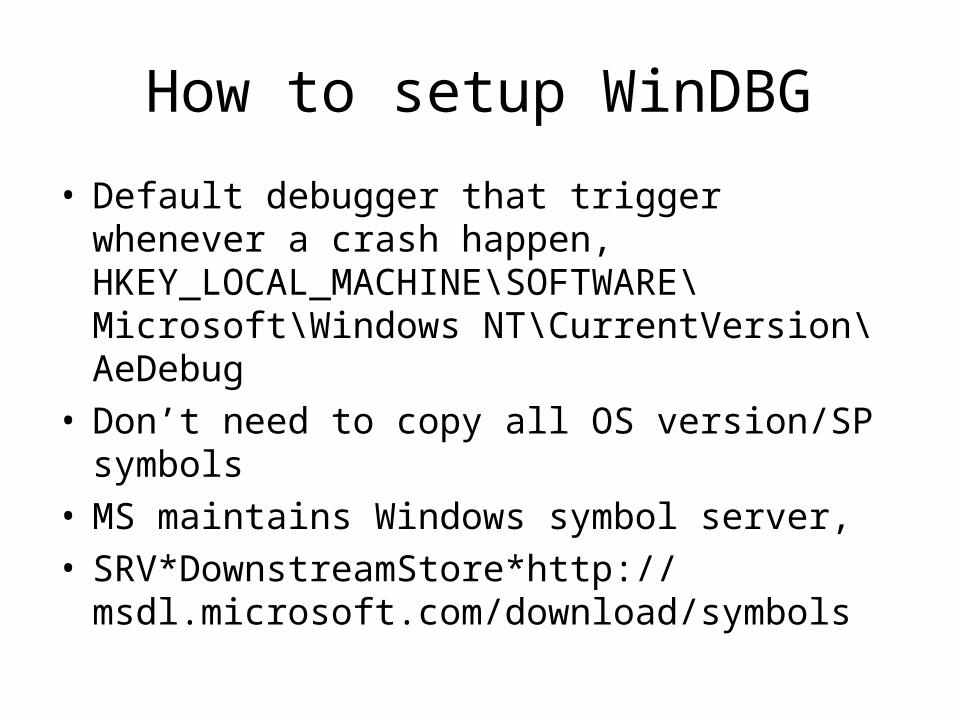
• Default debugger that trigger whenever a crash happen, HKEY_LOCAL_MACHINE\SOFTWARE\Microsoft\Windows NT\CurrentVersion\AeDebug
• Don’t need to copy all OS version/SP symbols• MS maintains Windows symbol server,• SRV*DownstreamStore*http://
msdl.microsoft.com/download/symbols

Stack Frames – x86 Calling Conventions
• __cdecl -> Parameters push right to left, caller cleanup the stack.
• __stdcall -> Parameters push right to left, callee cleanup the stack.
• __fastcall ->The first two DWORD-or-smaller arguments are passed in the ecx and edx registers. The remaining parameters are passed on the stack, pushed right to left. The callee cleans the stack.
• C++ (this calling convention)-> pushed right to left , this pointer in ecx, callee clean the stack.

Stack Frames – x64 Calling Conventions
• Only one calling convention- Uses increased number of registers.
• The first four integer or pointer parameters are passed in the rcx, rdx, r8, and r9 registers.
• The first four floating-point parameters are passed in the first four SSE registers, xmm0-xmm3.
• Any additional arguments are passed on the stack. • An integer or pointer return value is returned in the rax
register, while a floating-point return value is returned in xmm0.
• Itanium -> Large number of registers -> Uses registers instead of stack. Once all register fill up, use stack.
• “Another session on Itanium and x64 debugging”

Stack Frame continued..
• The purpose EBP – Frame Pointer.
• Function parameter, local variables in stack and, it’s the same thread stack (one stack per thread).
• EBP + offset points to function parameter
• EBP – offset points to local variables.
• Demo – Start the crash analyze and see how stack frame looks like.

Let’s analyze a simple crash.• 0:000> u Simple_App_Crash3!CSimpleAppCrash3Dlg::OnBnClickedButton1• Simple_App_Crash3!CSimpleAppCrash3Dlg::OnBnClickedButton1 [d:\sisimon\working
area\presentations\windbg\simple app crash3\simple app crash3\simple app crash3dlg.cpp @ 154]:
• 00401580 55 push ebp - First Push EBP to stack• 00401581 8bec mov ebp,esp Set new ebp as current esp• 00401583 83ec14 sub esp,14h make enough room for local variable• 00401586 894dec mov dword ptr [ebp-14h],ecx <- Copy the this pointer to stack
first element for the current stack frame• 00401589 c745f400000000 mov dword ptr [ebp-0Ch],0 one of the local var to 0• 00401590 c745fc0a000000 mov dword ptr [ebp-4],0Ah Another local var to 10• 00401597 c745f80f000000 mov dword ptr [ebp-8],0Fh Another local var to 15• 0040159e cc int 3 Our hard coded break point

• 0:000> u • Simple_App_Crash3!CSimpleAppCrash3Dlg::OnBnClickedButton1+0x1f [d:\sisimon\
working area\presentations\windbg\simple app crash3\simple app crash3\simple app crash3dlg.cpp @ 160]:
• 0040159f 8b45f4 mov eax,dword ptr [ebp-0Ch] • 004015a2 50 push eax push first arg to stack• 004015a3 8b4df8 mov ecx,dword ptr [ebp-8]• 004015a6 51 push ecx push second arg to stack• 004015a7 8b55fc mov edx,dword ptr [ebp-4]• 004015aa 52 push edx push third arg to stack004015ab 8b4dec mov ecx,dword ptr [ebp-14h] set the this pointer to ecx• 004015ae e82d000000 call Simple_App_Crash3!CSimpleAppCrash3Dlg::Add
(004015e0) call Add( unseen this in ecx, arg1, arg2, arg3)

• 0:000> u Simple_App_Crash3!CSimpleAppCrash3Dlg::Add• Simple_App_Crash3!CSimpleAppCrash3Dlg::Add [d:\sisimon\working area\presentations\
windbg\simple app crash3\simple app crash3\simple app crash3dlg.cpp @ 166]:• 004015e0 55 push ebp push new ebp• 004015e1 8bec mov ebp,esp set new ebp and current esp• 004015e3 51 push ecx push this to stack• 004015e4 894dfc mov dword ptr [ebp-4],ecx• 004015e7 8b45fc mov eax,dword ptr [ebp-4]• 004015ea c7407464000000 mov dword ptr [eax+74h],64h set• this->variable=100• 004015f1 6838344000 push offset Simple_App_Crash3!
CSimpleAppCrash3App::`vftable'+0xd8 (00403438)• 004015f6 ff15a4324000 call dword ptr [Simple_App_Crash3!_imp__printf (004032a4)]

• 0:000> r• eax=00000000 ebx=00000111 ecx=0013fe74 edx=00000000 esi=00403444 edi=00000001• eip=0040159e esp=0013f860 ebp=0013f874 iopl=0 nv up ei pl nz na pe nc• cs=001b ss=0023 ds=0023 es=0023 fs=003b gs=0000 efl=00000206• Simple_App_Crash3!CSimpleAppCrash3Dlg::OnBnClickedButton1+0x1e:• 0040159e cc int 3• 0:000> dds 0013f860 • 0013f860 0013fe74• 0013f864 7e41b788 USER32!GetParent+0x59• 0013f868 00000000• 0013f86c 0000000f• 0013f870 0000000a• 0013f874 0013f884 push current ebp to stack, set new ebp as esp Stack Frame - 1• 0013f878 7c1746cc MFC71!_AfxDispatchCmdMsg+0x3d [f:\vs70builds\3077\vc\mfcatl\ship\atlmfc\src\mfc\cmdtarg.cpp @ 89]• 0013f87c 00403444 Simple_App_Crash3!CSimpleAppCrash3Dlg::messageMap• 0013f880 0013fe74• 0013f884 0013f8b4 push current ebp to stack, set new ebp as esp Stack Frame - 2• 0013f888 7c171915 MFC71!CCmdTarget::OnCmdMsg+0x10a [f:\vs70builds\3077\vc\mfcatl\ship\atlmfc\src\mfc\cmdtarg.cpp @ 396]• 0013f88c 0013fe74• 0013f890 000003e8• 0013f894 00000000• 0013f898 00401580 Simple_App_Crash3!CSimpleAppCrash3Dlg::OnBnClickedButton1 [d:\sisimon\working area\presentations\windbg\
simple app crash3\simple app crash3\simple app crash3dlg.cpp @ 154]• 0013f89c 00000000• 0013f8a0 00000035• 0013f8a4 00000000• 0013f8a8 0013fe74• 0013f8ac 000003e8• 0013f8b0 00000000• 0013f8b4 0013f8d8 push current ebp to stack, set new ebp as esp, Stack Frame - 3• 0013f8b8 7c14db36 MFC71!CDialog::OnCmdMsg+0x1b [f:\vs70builds\3077\vc\mfcatl\ship\atlmfc\src\mfc\dlgcore.cpp @ 88]• 0013f8bc 000003e8• 0013f8c0 00000000• 0013f8c4 00000000• 0013f8c8 00000000• 0013f8cc 000003e8• 0013f8d0 0013fe74• 0013f8d4 00000000• 0013f8d8 0013f928• 0013f8dc 7c175cd8 MFC71!CWnd::OnCommand+0x51 [f:\vs70builds\3077\vc\mfcatl\ship\atlmfc\src\mfc\wincore.cpp @ 2549]

Frequently used WinDBG commands for user mode debugging.
• | - process
• ~ - thread (~.,~*,~#)
• ~<thread>s – switch thread
• kv, kb, kb n,
• !analyze –v
• r
• u

WinDBG commands continued..
• x, x mymodule!*spin*,
• x * (similar to dv display address and name of all local variable)
• dt (dt r)
• lm, lmv mTest*
• ln

WinDBG commands continued..
• .cls
• .restart (restart app in user mode, system in kernel mode)
• .reload , reload /f
• !teb –thread environment block
• !peb – process environment block

• .frame n (use kb n, .frame <frame no>)
• dds
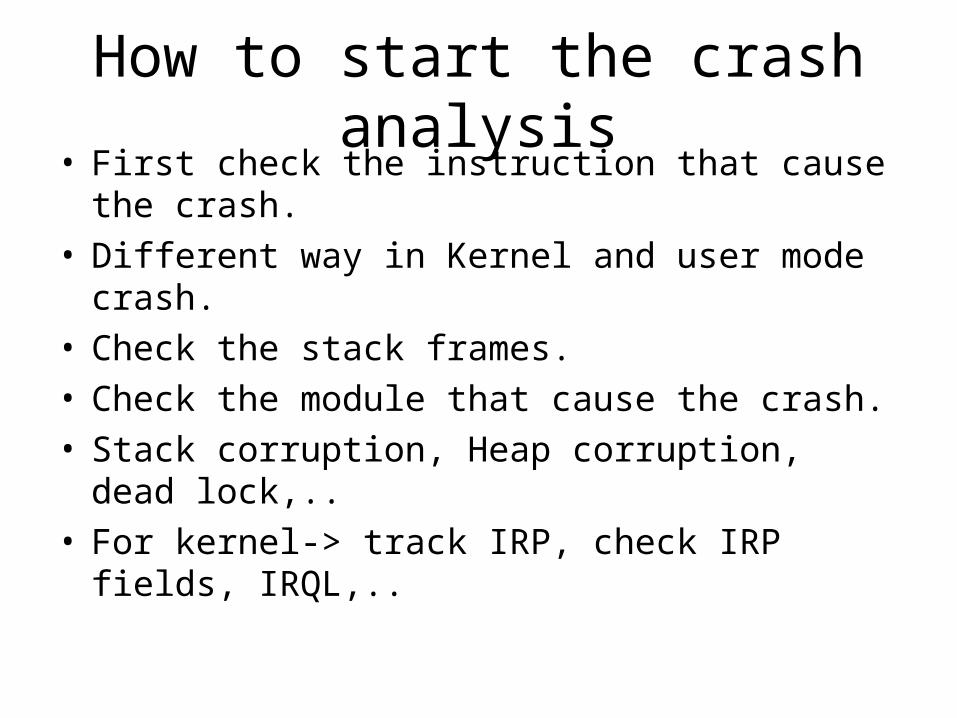
How to start the crash analysis• First check the instruction that cause the crash.• Different way in Kernel and user mode crash.• Check the stack frames.• Check the module that cause the crash.• Stack corruption, Heap corruption, dead lock,..• For kernel-> track IRP, check IRP fields, IRQL,..

• Crash dump analysis example - IMA service is crashing, let us analyze the dump.


