Winds, Waves, Tides, and the Resulting Flow Patterns and Fluxes of Water, Sediment, and Coral Larvae off West Maui, Hawaii By Curt D. Storlazzi and Michael E. Field Photograph of sediment plumes off Kahana, West Maui, by E. Brown (NPS) Open-File Report 2008-1215 U.S. Department of the Interior U.S. Geological Survey
Transcript
Winds, Waves, Tides, and the Resulting FlowPatterns and Fluxes of Water, Sediment, andCoral Larvae off West Maui, Hawaii
By Curt D. Storlazzi and Michael E. Field
Photograph of sediment plumes off Kahana, West Maui, by E. Brown (NPS)
Open-File Report 2008-1215
U.S. Department of the InteriorU.S. Geological Survey
U.S. Department of the Interior
Dirk Kempthorne, Secretary
U.S. Geological Survey
Mark Myers, Director
U.S. Geological Survey, Reston, Virginia 2008
For product and ordering information:
World Wide Web: http://www.usgs.gov/pubprod
Telephone: 1-888-ASK-USGS
For more information on the USGS—the Federal source for science about the Earth,
its natural and living resources, natural hazards, and the environment:
World Wide Web: http://www.usgs.gov
Telephone: 1-888-ASK-USGS
Suggested citation:
Storlazzi, C.D. and Field, M.E., 2008, Winds, waves, tides, and the resulting flow patterns and fluxes of water, sediment, and coral larvae off West Maui, Hawaii: USGS Open-File Report
2008-1215, 13 p. [http://pubs.usgs.gov/of/2008/1215/].
Any use of trade, product, or firm names is for descriptive purposes only and does not imply
endorsement by the U.S. Government.
Although this report is in the public domain, permission must be secured from the individual
copyright owners to reproduce any copyrighted material contained within this report.
Introduction ......................................................................................................................................... 4 Meteorology ........................................................................................................................................ 4 Tides ..................................................................................................................................................... 5 Waves................................................................................................................................................... 6 Nearshore Circulation ....................................................................................................................... 6 Coastal Transport ............................................................................................................................... 9 Summary .............................................................................................................................................. 9 References Cited .............................................................................................................................. 11 Additional Digital Information ........................................................................................................ 13 Direct Contact Information ............................................................................................................. 13
Figures
Figure 1. Map displaying topography and bathymetry of West Maui. ...................................... 5 Figure 2. Map displaying surface water dispersal patterns during the 2003 coral spawning season................................................................................................................................ 7 Figure 3. Schematic displaying the nature of flow and water column properties resulting in a front .............................................................................................................................. 9 Figure 4. Schematic diagram of the dynamics of flow and turbidity along West Maui.. ....................................................................................................................................... 10
3
Winds, Waves, Tides, and the Resulting FlowPatterns and Fluxes of Water, Sediment, andCoral Larvae off West Maui, Hawaii
By Curt D. Storlazzi and Michael E. Field
U.S. Geological Survey, Pacific Science Center, Santa Cruz, CA 95060 USA
Introduction
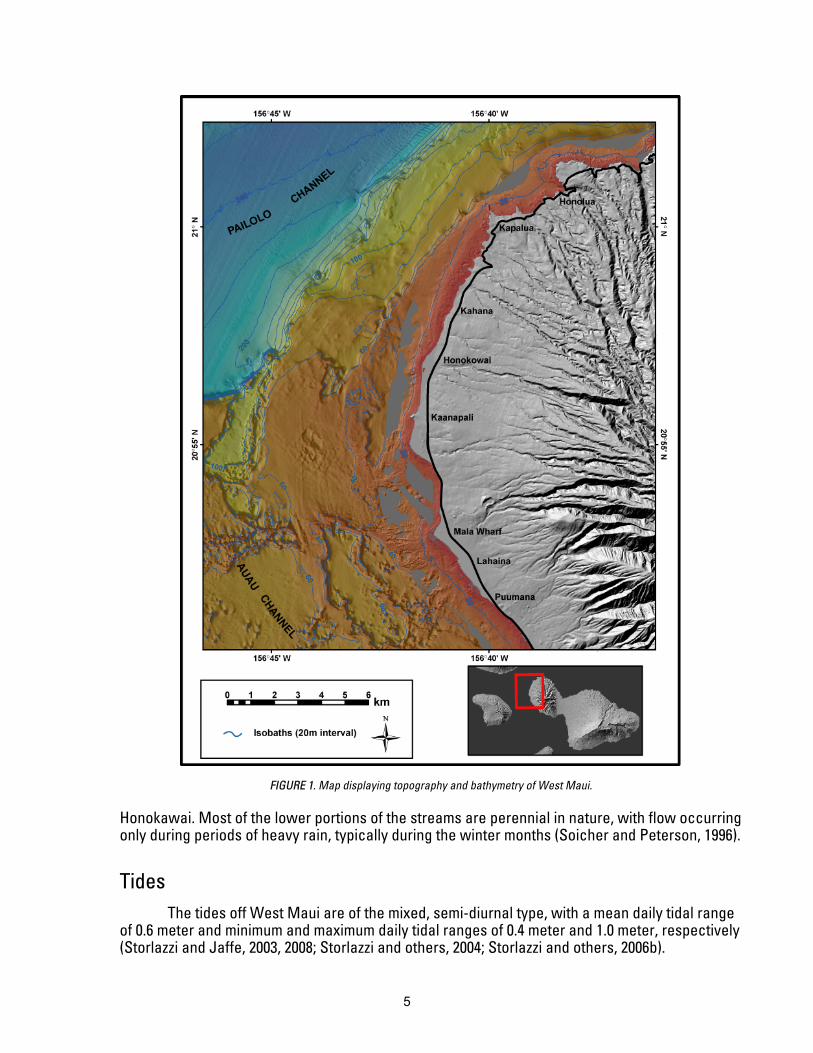
A series of recent studies has focused on the flow patterns and particle fluxes along thecoast of West Maui, Hawaii, USA, from Honolua south to Puumana (fig. 1). From those studies arelatively good understanding has emerged of the physical processes that influence the relativeamount of suspended sediment in nearshore waters and the circulation patterns that transportsediment and coral larvae along the coast and between islands. This report is a synthesis of ourexisting knowledge on the nature of flow and transport off West Maui.
Meteorology of West Maui and its Impact on Coastal Processes
The northeast trade winds occur throughout the year but are most consistent from April-November. These winds strike the northeast side of West Maui, are steered around the WestMaui volcanic cone and most often approach the shoreline obliquely from the north in the studyarea (Fletcher and others, 2002). Insolation-driven heating and nocturnal cooling of the islandcause the general trade wind speeds in the vicinity of the islands to vary from almost negligible atnight to more than 10 meters/second in the afternoon, compared to about 5 meters/second in theopen ocean (Storlazzi and others, 2006b). The wind speeds in the channels between the islands ofMaui, Molokai, and Lanai are often 50-100% faster than those observed along west Maui due tofunneling between the islands’ large volcanic cones. These relatively rapid diurnal variations inwind speed result in a very thin (<1 meter) wind-driven oceanic surface layer. It is important tonote that this thin surface layer is trade-wind controlled, and transport in the layer can besignificantly different in rate and direction than the rest of the water column.
Precipitation patterns on West Maui result primarily from orographic uplift of air massesdriven by the northeast trade winds. Due to orographic effects associated with the high (> 1400meters) West Maui shield volcano, most of the precipitation (100-400 centimeters/year) falls onthe northern face of the volcano while the south and southwest sides of the volcano receive lessthan 40 centimeters/year on average (Fletcher and others, 2002). This causes a north-southgradient in both stream flow and terrestrial sediment discharge along West Maui, with greaterfreshwater and sediment discharge to the north (between Honolua and Kahana) relative to thecoast south of
4
FIGURE 1. Map displaying topography and bathymetry of West Maui.
Honokawai. Most of the lower portions of the streams are perennial in nature, with flow occurringonly during periods of heavy rain, typically during the winter months (Soicher and Peterson, 1996).
Tides
The tides off West Maui are of the mixed, semi-diurnal type, with a mean daily tidal rangeof 0.6 meter and minimum and maximum daily tidal ranges of 0.4 meter and 1.0 meter, respectively(Storlazzi and Jaffe, 2003, 2008; Storlazzi and others, 2004; Storlazzi and others, 2006b).
5
Waves
The wave climate off West Maui is dominated by four wave regimes: the North Pacificswell, northeast trade-wind waves, Southern Ocean swell and Kona storm waves (Moberly andChamberlain, 1964). North Pacific swells are generated by strong winter (November-March)storms as they track from west to east across the North Pacific and have significant waveheights (Hs) ~ 3-8 meters and peak periods (Tp) ~ 10-20 seconds. The northeast trade-wind wavesoccur throughout the year but are largest from April through November when the trade windsblow the strongest; these waves have Hs ~ 1-4 meters but have very short periods (Tp ~ 5-8seconds). The Southern swell is generated by storms in the Southern Ocean during the SouthernHemisphere winter; while the waves are typically small (Hs ~1-2 meters), they have very longperiods (Tp ~ 14-25 seconds). Kona storm waves occur when local fronts or extratropical lowspass through the region and are neither frequent nor consistent in their occurrence. Kona stormwaves typically have Hs ~ 3-5 meters and Tp ~ 8-12 seconds.
Additional information on waves and their influence on coral distribution has been derivedfrom models (Storlazzi and others, 2005). Those authors found that maximum wave conditionswere dominated by the large (8+ meters), long-period (22 seconds) North Pacific winter wavesalong the north shore of West Maui. Due to refraction, some of this wave energy wraps aroundthe west end of the island, generating very high wave-orbital velocities at Honolua and Napili thatrapidly decrease south towards Honokawai. The rest of the west shore of Maui is in the shadowof Molokai and is protected from these large North Pacific waves, which exhibit low wave-orbitalvelocities. Trade wind waves show a similar gradient in wave energy that decreases southwardfrom Honolua as the coastline is increasingly sheltered by the West Maui volcano. Most of WestMaui is sheltered from Kona storm waves and Southern Ocean swell, except for small windowssouth of Olowalu and to the east of Thousand Peaks. These findings were reinforced by the laterwork of Vitousek and others (2007), who modeled sediment transport along West Maui betweenBlack Rock and Hanakao’o Point; their model results compared favorably to in situ data collectedby Storlazzi and others (2004).
Nearshore Circulation off West Maui
Until recently, the only studies investigating currents off West Maui looked at large-scale(order of 10s of kilometers) flow through the channels between the islands of Lanai, Molokai andMaui (Flament and Lumpkin, 1996; Sun, 1996). Using satellite data and a numerical model, Sun(1996) observed long-term mean flow through the channels driven by differences in sea-surfaceheight across the island chain. Flament and Lumpkin (1996) noted that the flow in the upper watercolumn out in the middle of the Pailolo Channel was primarily oriented east-west at 0-1.0meters/second (mean = 0.04 meters/second) while the flow closer to the bed was orientedsouthwest-northeast, roughly parallel to the isobaths, at 0-0.5 meters/second (mean = 0.04meters/second). Flament and Lumpkin (1996) also calculated that the majority of the current’senergy was in the diurnal and semi-diurnal tidal frequencies.
Hatcher and others (2004) and Storlazzi and others (2006b) showed that surface flow, andlikely coral larvae dispersal, offshore Honokawai during the 2003 summer coral spawning season
6
was net alongshore to the south and offshore to the west, causing net projected transport ofsurface water to be to the south and offshore (fig. 2). The meteorologic and oceanographic data
FIGURE 2. Map of GPS drifter tracks displaying surface water dispersal patterns off West Maui during the 2003summer coral spawning season. The colors denote different periods of spawning when the drifters were released.
From both of these and previous studies (Flament and Lumpkin, 1996; Storlazzi and Jaffe, 2003)show that flow off West Maui in the Auau, Pailolo and Kalohi Channels is primarily controlled bythe winds and tides. The general flow patterns and seawater properties show greaterconsistency during the summer months when the forcing by northeast trade winds is relativelysteady, storms occur very infrequently and nearshore surface wave-induced flows are at aminimum. During the summer coral-spawning season (June-October), both the forcing (windsand tides) and the resulting flow and environmental patterns were relatively consistent, withnortheast-southwest oscillating tidal currents with a superimposed net flow to the southwest andoffshore. Similar forcing and response across multiple spawning periods resulted in comparablemodels of projected water and coral larvae pathways during the 2003 spawning season.Furthermore, since Hawaiian corals always spawns at the same time relative to the phase of themoon (Kolinski and Cox, 2003), these spawning events always occur during the transition fromspring to neap tides and thus the relative magnitude of the tidal current forcing during eachspawning period is relatively consistent. These consistent patterns, along with the similar pathsthat the drifters followed over multiple deployments, suggest that the temporally limited driftertrajectories from the study period are likely a good model for initial dispersal patterns off westMaui during the summer months when many of the Hawaiian corals spawn.
7
Studies by Storlazzi and Jaffe (2003, 2008), Storlazzi and others (2003, 2004) and Storlazziand Presto (2005) measured tides and currents on the inner (< 30 meters) shelf and show that thetidal wave propagated from south to north in the study area. Similar to the findings of Flamentand Lumpkin (1996), they observed that flow over the deeper portion of the fore reef wasdominated by diurnal and semi-diurnal tidal currents, and to a lesser extent by lower frequencymotions likely driven by wind-driven differences in sea level across the island chain, as modeledby Merrifield and others (2002), and/or the impingement of mesoscale eddies on the island chainas shown by Firing and others (2004). Over the reef flat, however, flows were primarily wind- andwave-driven, and they were often oriented at an angle (> 90º) to the flows concurrently measuredout over the fore reef.
The summer months are characterized by consistent northeast trade winds and smallwaves, and under these conditions high-frequency internal bores are commonly observed offKahana, there is little net flow or turbidity over the fore reef, and net flow on the reef flat isdownwind to the southwest and turbidity is high (Storlazzi and Jaffe, 2003; 2008). When the tradewinds wane or the wind direction deviates from the dominant northeast trade wind orientation,strong alongshore currents flow to the northeast, into the dominant trade wind direction, andlower turbidity is observed both on the reef flat and over the fore reef. During the winter, whenlarge storm waves impact Kahana, strong offshore flow and high turbidity occur on the reef flatand the fore reef. Over the course of a year, trade wind conditions resulted in the greatest nettransport of turbid water due to relatively strong currents, moderate overall turbidity, and theirfrequent occurrence. Near-surface current directions over the fore reef varied on average bymore than 41º from those near the seafloor, and the orientation of the currents over the reef flatdiffered on average by more than 65º from those observed over the fore reef. This shearoccurred over relatively short vertical (order~meters) and horizontal (order~100s of meters)scales, causing material distributed throughout the water column to be transported in differentdirections under constant oceanographic and meteorologic forcing.
Wave- and wind-driven flows appear to be the primary control on flow over shallowerportions of the reefs while tidal and subtidal currents dominate flow over the outer portions of thereefs and insular shelf (Storlazzi and others, 2003; 2006a). When the direction of these flowscounter one another, which is quite common, they cause a zone of cross-shore horizontal shearand often form a front, with turbid, lower-salinity water inshore of the front and clear, higher-salinity water offshore of the front (fig. 3). It is not clear whether these zones of high shear andfronts are the cause or the result of the location of the fore reef, but they appear to be correlatedalongshore over relatively large horizontal distances (order~kilometers). When two flowsconverge or when a single flow is bathymetrically steered, eddies can be generated that, in theabsence of large ocean surface waves, tend to accumulate material. Areas of higher turbidityand lower salinity tend to correlate with regions of poor coral health or the absence of well-developed reefs, suggesting that the oceanographic processes that concentrate and/or transportnutrients, contaminants, low-salinity water or suspended sediment might strongly influence coralreef ecosystem health and sustainability.
8
FIGURE 3. Schematic displaying the nature of flow and water column properties resulting in a front along West Maui.Higher turbidity and submarine groundwater discharge or freshwater runoff is typically found close to shore. Along the relatively straight sections of coast, net wave- and wind-driven flow close to shore is downwind. Flow farther offshore
is upwind, causing zones of high cross-shore horizontal velocity shear and often fronts.
Coastal Transport
Eversole and Fletcher (2003) and Vitousek and others (2007) studied beach sand transportalong West Maui and characterized Kaanapali as an alongshore system. Approximately 3 X 10⁴
cubic meters of sand is driven to the north by south swell during summer months; forced by northswell the sand returns to the south in winter months. This volume of sand can result in dramaticbeach-width changes of more than 50 meters in a few weeks. Vitousek and others (2007)suggested that rapid changes in beach width, such as those observed in the summer of 2003, arelikely due to unusually high sea levels (15-20 centimeters above normal) resulting from a series ofmesoscale eddies that arrived over spring and summer months (Firing and others, 2004). Seasonalbeach profile changes at Kaanapali beach are pronounced.
Summary
These studies suggest the following conceptual model of meteorologic andoceanographic processes over the inner shelf off West Maui (fig. 4). The northeast trade windsstriking the West Maui volcanic cone cause a strong north-south gradient in precipitation alongWest Maui throughout the year. This precipitation gradient, along with the large area of plowedagricultural lands on the uplands in this area causes, on average, more freshwater and sedimentto be discharged from streams between Honolua Bay and Kahana than farther south. This streamdischarge, along with submarine groundwater discharge, causes lower salinities and higherconcentrations of fine-grained suspended sediment close to shore. Trade wind-induced currentstransport the turbid, lower-salinity water south alongshore over the shallower reef areas. Theseflows appear to keep the turbid, lower-salinity water coherent alongshore, reducing dissipationby forcing these waters against the shoreline while the wave-generated turbulence tends to keepthe fine-grained sediment in suspension, offsetting sediment settling due to gravity.
9
FIGURE 4. Schematic diagram of the dynamics of flow and turbidity along West Maui. Higher turbidity and freshwatereffluence or runoff is typically found close to shore. Net wave-driven flow close to shore is to the south in the northernpart of the study area and to the north in then southern portions of the study area, causing convergence in the region
between Mala Wharf and Kaanapali. Flow further offshore is typically the opposite of that observed inshore, with offshore flow to the north in the northern portion of the study area and to the south in the southern portion of the study area.
Together, these two factors persistently create relatively high levels (order of 10’s of NTUs) ofturbidity close to shore in the Kahana region. The turbid, lower-salinity, southward-flowinginshore jet over the shallower portions of the reefs in the northern part of the study area appearsto veer offshore between Honokawai and Kaanapali. It is not clear, however, exactly where theoffshore veering of these turbid waters occurs due to the highly variable currents measured inthis area. The flow close to shore offshore of Lahaina heads north past Mala Wharf; its fate northof there is unknown. The region between Mala Wharf and Kaanapali appears to be a zone ofeddy formation. These eddies, along with the lack of large ocean surface waves (due toshadowing by the surrounding islands), help to retain fine-grained sediment in this area, causing
10
persistent high turbidity (order of 10’s of NTUs) despite the absence of fluvial discharge. In contrast, turbid freshwater water is likely not retained in Honolua Bay during the winter when stream discharge is the greatest due to the rapid flushing and mixing of the bay by large North Pacific storm waves.
References
Eversole, D., Fletcher, C.H., 2003. “Longshore sediment transport rates on a reef-fronted beach: Field data and empirical models Kaanapali Beach, Hawaii.” Journal of Coastal Research, vol. 19, no. 3, p. 649–663.
Firing, Y.L., and Merrifield, M.A., 2004. “Extreme sea level events at Hawaii: Influence of
mesoscale eddies.” Geophysical Research Letters, vol. 31, L24306 Flament, P. and Lumpkin, C., 1996. “Observations of currents through the Pailolo Channel:
Implications for nutrient transport.” In: Wiltse, W. (Ed.), Algal Blooms: Progress Report on Scientific Research. West Maui Watershed Management Project, p. 57-64.
Fletcher, C.H., Richmond, B.M., Grossman, E.E. and Gibbs, A.E., 2002. Atlas of Natural Hazards in
the Hawaiian Coastal Zone. USGS Geologic Investigations Series I-2716. http://pubs.usgs.gov/imap/i2761/
Hatcher, G.A., Reiss, T.E., and Storlazzi, C.D., 2004. “Application of GPS drifters to track Hawaiian
coral spawning” U.S. Geological Survey Open-File Report 2004-1309, 14 p. http://pubs.usgs.gov/of/2004/1309/
Kolinski, S.P., and Cox, E.F., 2003. “An update on modes and timing of gamete and planula release
in Hawaiian Scleractinian corals with implications for conservation and management.” Pacific Science, vol. 57, p. 17-27
Merrifield, M.A., Yang, L., and Luther, D.S., 2002. “Numerical simulations of a storm generated
island-trapped wave event at the Hawaiian Islands.” Journal of Geophysical Research, vol. 107, no. C10, 3169, doi:10.1029/2001JC001134.
Moberly, R.M., and Chamberlain, T., 1964. Hawaiian Beach Systems. University of Hawaii. Soicher, A.J., and Peterson, F.L., 1996. Assessing Terrestrial Nutrient and Sediment Discharge to
the Coastal Waters of West Maui, Hawaii. University of Hawaii, Honolulu, Hawaii, 98 p. Storlazzi, C.D., and Jaffe, B.E., 2003. “Coastal Circulation and Sediment Dynamics along West
Maui, Hawaii, PART I: Long-term measurements of currents, temperature, salinity and turbidity off Kahana, West Maui: 2001-2003” U.S. Geological Survey Open-File Report 03-482, 28 p. http://pubs.usgs.gov/of/2003/of03-482/
Storlazzi, C.D., Logan, J.B., McManus, M.A., and McLaughlin, B.E., 2003. “Coastal Circulation and Sediment Dynamics along West Maui, Hawaii, PART II: Hydrographic Survey Cruises A-3-03-HW and A-4-03-HW Report on the spatial structure of currents, temperature, salinity and turbidity along Western Maui” U.S. Geological Survey Open-File Report 03-430, 50 p. http://pubs.usgs.gov/of/2003/of03-430/
“Coastal Circulation and Sediment Dynamics along West Maui, Hawaii, PART III: Flow and particulate dynamics during the 2003 summer coral spawning season” U.S. Geological Survey Open-File Report 2004-1287, 36 p. http://pubs.usgs.gov/of/2004/1287/
Storlazzi, C.D., Field, M.E., Rogers, K., Jokiel, P.L., Brown, E., and Dykes, J.D., 2005. “A model for
wave control on coral breakage and species distribution in the Hawaiian Islands” Coral Reefs, vol. 24, p. 43-55.
Storlazzi, C.D., and Presto, M.K., 2005. “Coastal Circulation and Sediment Dynamics along West
Maui, Hawaii, PART IV: Measurements of waves, currents, temperature, salinity and turbidity in Honolua Bay, Northwest Maui: 2003-2004” U.S. Geological Survey Open-File Report 2005-1068, 34 p. http://pubs.usgs.gov/of/2005/1068/
shear, eddies and heterogeneity in water column properties over fringing coral reefs: West Maui, Hawaii.” Continental Shelf Research, v. 26, p. 401-421.
Storlazzi, C.D., Brown, E.K., and Field, M.E., 2006b. “The application of acoustic Doppler current
profilers to measure the timing and patterns of coral larval dispersal.” Coral Reefs, vol. 25, p. 369-381.
Storlazzi, C.D., and Jaffe, B.E., 2008. “The relative contribution of processes driving variability in
flow, shear, and turbidity over a fringing coral reef: West Maui, Hawaii” Estuarine Coastal and Shelf Science, vol. 77, p. 549-564.
Sun, L.C., 1996. “ The Maui algal bloom: The role of physics.” In: Wiltse, W. (Ed.), Algal Blooms: Progress
Report on Scientific Research, West Maui Watershed Management Project, 54-57. Vitousek, S., Fletcher, C.H., Merrifield, M.A., Pawlak, G., and Storlazzi, C.D., 2007. “Model
scenarios of shoreline change at Kaanapali Beach, Maui, Hawaii: Seasonal and extreme events.” ASCE Coastal Sediments 2007 Meeting Proceedings, vol. 2, p. 1227-1240.